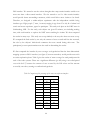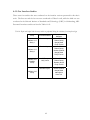
1
EVOLUTION OF A TELEPRESENCE ROBOT INTERFACE
BY
BRENDEN KEYES
ABSTRACT OF A DISSERTATION SUBMITTED TO THE FACULTY OF THE
DEPARTMENT OF COMPUTER SCIENCE
IN PARTIAL FULFILLMENT OF THE REQUIREMENTS
FOR THE DEGREE OF
MASTER OF SCIENCE IN COMPUTER SCIENCE
UNIVERSITY OF MASSACHUSETTS LOWELL
2007
Dissertation Supervisor:
Dr. Holly A. Yanco
Assistant Professor, Department of Computer Science
Committee Members:
Dr. Fred G. Martin
Assistant Professor, Department of Computer Science
Dr. Jill L. Drury
Associate Department Head at The MITRE Corporation and adjunct faculty member at
the University of Massachusetts Lowell
ABSTRACT
Robot operations are progressively becoming more important in a variety of areas, especially in
environments where humans are at risk. When possible, it is better to have a robot search a cave
in Afghanistan, patrol a building complex at night for security, or search through rubble piles for
victims of a disaster. In these tasks, maintaining good situation awareness (SA) is a critical factor
in successfully completing a remote robot operation.
In this work, we have studied a variety of robot systems designed to perform robot interaction
tasks. As a result of these studies, many human-robot interaction (HRI) guidelines for providing
better SA were produced. Using these guidelines, we set out to create our own telepresence
robot system that put many of these suggestions into action. The system was improved a
number of times as a direct result of several usability studies. We successfully created a system
that performed better and solved many of the problems that the previously studied systems had
shown. In the end, we were able to prove, strengthen, or disprove many of the original HRI
design principles that were created from the original studies.
ii
ACKNOWLEDGEMENTS
I'd like to thank everyone who has supported me over the past few years. First and foremost,
this is dedicated to my mother, who was always there with love, understanding and patience.
She is the biggest inspiration in my life and the best role model anyone could ask for.
Secondly I'd like to thank Holly Yanco for being such a great advisor, mentor and friend. If it
was not for her, there would be no robotics department and the last five years of my life would
have been something completely different and no doubt much less fulfilling. I would not be the
person I am today without her kindness.
I’d also like to thank my other two committee members. First, I’d like to Jill Drury for her
support and help to get me started down the correct path during the writing phase and also for
keeping me on track throughout it. Again, I’m lucky to have another kindhearted person in my
life. I’d also like to thank Fred Martin for taking the time to be on my committee. He always
kept robotics fun and interesting, which kept me motivated enough to continue on my current
path.
I’d also like to thank all the other students in the robotics lab that volunteered their time to help
with the various studies that were performed during this process. Much of this work would
have not been completed without you.
iii
Portions of this thesis have been previously published in the following works:
Brenden Keyes, Robert Casey, Holly A. Yanco, Bruce A. Maxwell and Yavor Georgiev, “Camera
Placement and Multi-Camera Fusion for Remote Robot Operation,” Proceedings of the IEEE
International Workshop on Safety, Security and Rescue Robotics, National Institute of Standards and
Technology (NIST), Gaithersburg, MD, August 22-24, 2006.
Holly A. Yanco, Michael Baker, Robert Casey, Brenden Keyes, Philip Thoren, Jill L. Drury,
Douglas Few, Curtis Nielsen and David Bruemmer, “Analysis of Human-Robot Interaction for
Urban Search and Rescue,” Proceedings of the IEEE International Workshop on Safety, Security and
Rescue Robotics, National Institute of Standards and Technology (NIST), Gaithersburg, MD,
August 22-24, 2006.
Jill L. Drury, Brenden Keyes and Holly A. Yanco, “LASSOing HRI: Analyzing Situation
Awareness in Map-Centric and Video-Centric Interfaces,” Proceedings of the Second Annual
ACM/IEEE Conference on Human-Robot Interaction, March 2007.
Michael Baker, Robert Casey, Brenden Keyes and Holly A. Yanco, “Improved Interfaces for
Human-Robot Interaction in Urban Search and Rescue,” Proceedings of the IEEE Conference on
Systems, Man and Cybernetics, October 2004.
Robert Casey, Brenden Keyes, Michael Baker, Holly A. Yanco, “Designing Interfaces for
Remote Robot Operations”, Unpublished manuscript, University of Massachusetts Lowell,
Lowell, MA.
iv
TABLE OF CONTENTS
ABSTRACT .........................................................................................................................................................II
ACKNOWLEDGEMENTS .............................................................................................................................. III
1
STATEMENT OF THE PROBLEM ........................................................................................................1
1.1
THE NEED FOR A TELEPRESENCE ROBOT INTERFACE .....................................................................1
1.2
CONTRIBUTIONS .................................................................................................................................5
2
REVIEW OF RELEVANT RESEARCH .................................................................................................7
2.1
MAP-CENTRIC INTERFACES ...............................................................................................................7
2.2
VIDEO-CENTRIC INTERFACES ..........................................................................................................10
3
TESTING METHODOLOGY.................................................................................................................14
3.1
TEST ARENA .....................................................................................................................................15
3.2
TIMED RUN .......................................................................................................................................15
3.3
DATA COLLECTION AND ANALYSIS .................................................................................................16
4
THE ROBOT SYTEM .............................................................................................................................19
4.1
ROBOT HARDWARE ..........................................................................................................................19
4.2
CONTROL PROTOCOL .......................................................................................................................21
4.3
AUTONOMY MODES ..........................................................................................................................23
4.4
GENERAL INTERFACE DESIGN .........................................................................................................24
5
THE INTERFACE....................................................................................................................................30
5.1
PROTOTYPE AND VERSION 1.0 - 2004 ..............................................................................................30
5.1.1
Prototype Design ..........................................................................................................................30
5.1.2
Version 1.0....................................................................................................................................31
5.1.3
Results of the First Study ..............................................................................................................32
5.1.4
Results of the Second Study ..........................................................................................................38
5.2
VERSION 2.0 - 2005 ...........................................................................................................................42
5.2.1
Design...........................................................................................................................................43
5.2.2
Usability Study and Results ..........................................................................................................45
5.3
VERSION 3.0 - 2006 ...........................................................................................................................50
5.3.1
Design...........................................................................................................................................52
5.3.2
Experiment and Results ................................................................................................................54
6
RESULTS AND CONCLUSIONS ..........................................................................................................59
7
FUTURE WORK ......................................................................................................................................62
8
REFERENCES..........................................................................................................................................64
APPENDIX A .....................................................................................................................................................68
A.1 DATA GATHERING IN ROBOT STUDIES ....................................................................................................68
A.1.1 Previous Studies ................................................................................................................................68
A.1.2 Our Interface Studies.........................................................................................................................69
A.2 ROBOT HARDWARE AND SOFTWARE .......................................................................................................70
A.2.1 Hardware...........................................................................................................................................70
A.2.2 Software.............................................................................................................................................70
A.3 THE INTERFACE .......................................................................................................................................72
A.3.1 Prototype ...........................................................................................................................................72
A.3.2 Version 1.0.........................................................................................................................................72
A.3.3 Version 2.0.........................................................................................................................................73
A.3.4 Version 3.0.........................................................................................................................................73
v
LIST OF FIGURES
FIGURE 1: MITRE’S MAP-CENTRIC INTERFACE ......................................................................................................8
FIGURE 2: INL’S ORIGINAL VIDEO-CENTRIC INTERFACES AND THEIR MAP-CENTRIC INTERFACE .............................9
FIGURE 3: ARGOS INTERFACE FROM THE UNIVERSITY OF BRNO .........................................................................11
FIGURE 4: SWARTHMORE COLLEGE’S INTERFACE INSPIRED BY FIRST-PERSON SHOOTER VIDEO GAMES ................12
FIGURE 5: COMMERCIAL ROBOT INTERFACE EXAMPLES .......................................................................................12
FIGURE 6: THE ATRV-JR ......................................................................................................................................19
FIGURE 7: INTERFACE CONTROL ARCHITECTURE ...................................................................................................22
FIGURE 8: OLDER ARGOS INTERFACE FROM THE UNIVERSITY OF BRNO .............................................................25
FIGURE 9: THE MAP PANEL ....................................................................................................................................27
FIGURE 10: THE MODE PANEL ...............................................................................................................................28
FIGURE 11: THE STATUS PANEL .............................................................................................................................28
FIGURE 12: THE CO2 PANEL ..................................................................................................................................29
FIGURE 13: SCREENSHOT OF THE ORIGINAL PROTOTYPE. ......................................................................................30
FIGURE 14: SCREENSHOT OF VERSION 1.0 .............................................................................................................31
FIGURE 15: INTERFACES USED FOR SECOND EXPERIMENT OF VERSION 1.0 ............................................................39
FIGURE 16: SCREENSHOT OF VERSION 2.0 OF THE INTERFACE ...............................................................................42
FIGURE 17: INTERFACE SCREENSHOT SHOWING THE ROTATED DISTANCE PANEL ..................................................44
FIGURE 18: THE ZOOM MODE DISPLAY. .................................................................................................................44
FIGURE 19: MINI-MAP EXAMPLE. SCREENSHOTS TAKEN FROM ELECTRONIC ART’S BATTLEFIELD 2...................51
FIGURE 20: SCREENSHOT OF VERSION 3.0 .............................................................................................................53
FIGURE 21: THE NEW DISTANCE PANEL .................................................................................................................53
FIGURE 22: INTERFACES USED FOR EXPERIMENT ON INTEFACE VERSION 3.0. ........................................................54
vii
LIST OF TABLES
TABLE 1: SITUATION AWARENESS AND PERFORMANCE RESULTS .........................................................................33
TABLE 2: COMPARISON OF THE PERCENTAGE OF THE ARENA COVERED FOR TWO INTERFACES .............................46
TABLE 3: TIME AND HIT RESULTS FROM THE STUDY PERFORMED ON VERSION 3.0 OF THE INTERFACE ..................56
TABLE 4: ORIGINAL GUIDELINES AND RESULTS ...................................................................................................61
TABLE 5: PEOPLE WHO ASSISTED WITH STUDIES DISCUSSED IN THE DRURY, SCHOLTZ, YANCO CITATIONS. .........68
TABLE 6: PEOPLE WHO HELPED WITH THE STUDIES WE PERFORMED FOR THE EVOLUTION OF OUR INTERFACE .....69
vii
1
STATEMENT OF THE PROBLEM
1.1 The Need for a Telepresence Robot Interface
Robot operations are progressively becoming more important in a variety of areas, especially in
environments where humans are at risk.
It is better to have a robot search a cave in
Afghanistan, patrol a building complex at night for security, or search through rubble piles for
victims of a disaster; the value of having a robot do the job, so a rescuer’s or soldier’s life is
saved, is immeasurable. “In the case of the Mexico City earthquake in 1985, 135 rescuers died;
65 of those deaths were due to rescuers searching confined spaces that flooded” [Casper, 2002].
The cases described above are examples of remote robot operations. The human operator(s)
and robot(s) are operating in different locations that are not within line of sight of each other.
In this situation, the human’s knowledge of the robot’s surroundings, location, activities and
status is gathered solely through the interface. The partnership between the human and the
robot is known as human-robot interaction (HRI). Unlike driving a remote control car where
the operator can see how the car fits into its environment, the remote robot operator has no
direct physical cues as to the robot’s state. Insufficient knowledge of the robot’s state in an
urban search and rescue (USAR) environment, for example, may result in the robot contacting a
shaky support beam which could cause a secondary collapse. Without good state awareness, the
robot can be more of a detriment to the task than a benefit.
Some researchers have tried to solve the problem of a human directing a remote robot by giving
the robot full autonomy. The DARPA Grand Challenge is a prime example of where robot
autonomy is beneficial [Thrun et al. 2006]. The off-road traversal domain allows for car sized
robots, allowing them to have many sensors, computing power and battery power than a smaller
robot. In contrast, many safety critical remote robot tasks require smaller robots as well as
human judgment and human decision making in real-time. For many applications, having a
human in the loop is a requirement, at least for the foreseeable future.
The human’s comprehension of the robot’s state and environment is often termed Situation
Awareness (SA). Endsley [1988] developed the most generally accepted definition for SA: “The
1
perception of elements in the environment within a volume of time and space, the
comprehension of their meaning and the projection of their status in the near future.” Drury et
al. [2003] redefined situation awareness to make it more specific to robot operations:
HRI awareness (general case): Given n humans and m robots working together on a
synchronous task, HRI awareness consists of five components:
•
Human-robot: the understanding that the humans have of the locations, identities,
activities, status and surroundings of the robots. Further, the understanding of
the certainty with which humans know the aforementioned information.
•
Human-human: the understanding that the humans have of the locations, identities
and activities of their fellow human collaborators.
•
Robot-human: the robots’ knowledge of the humans’ commands needed to direct
activities and any human-delineated constraints that may require command
noncompliance or a modified course of action.
•
Robot-robot: the knowledge that the robots have of the commands given to them,
if any, by other robots, the tactical plans of the other robots and the robot-torobot coordination necessary to dynamically reallocate tasks among robots if
necessary.
•
Humans’ overall mission awareness: the humans’ understanding of the overall goals of
the joint human-robot activities and the measurement of the moment-bymoment progress obtained against the goals.
Three of the five parts are relevant to this research. They are the definitions that relate to a case
where one human operator is working with one robot: human-robot awareness, robot-human
awareness and the human’s overall mission awareness.
2
In Drury et al. [2007], human-robot awareness is further broken up into five types to aid in
assessing the operator’s SA.
The categories are location awareness, activity awareness,
surroundings awareness, status awareness and overall mission awareness. The two categories that
will be mentioned often in this document are location awareness and surroundings awareness.
Location awareness is the operator’s knowledge of where the robot is situated on a larger scale.
For instance, knowing where the robot is from where it started or that it is in room 314.
Surroundings awareness is the knowledge the user has of the robot’s circumstances in a local
sense. This could be the knowledge that there is an obstacle two feet away from the right side of
the robot, or that the area directly behind the robot is completely clear. Location awareness is
good for mission planning for a general idea of where the robot is and where it needs to go.
Surroundings awareness, on the other hand, is more important for maneuvering the robot safely
in a real-time manner.
In a study of safety related problems occurring in a USAR competition, Drury et al. [2003] noted
that “all critical incidents [such as collisions] were due to some type of awareness violation.” A
critical incident, in this case, is a significant event such as the robot bumping an obstacle, a
hardware failure, or the injury of a victim. An awareness violation occurs when “HRI awareness
information that should be provided is not provided.”
Situation awareness is arguably the main factor in completing a remote robot task effectively.
Unfortunately, it is a challenge to design interfaces to provide good SA. Situation awareness
with respect to robots is a recent area of study, so in previous interfaces the emphasis of the
designs have typically not been concerned with providing sufficient SA. For example, two
studies examined twelve separate USAR interfaces [Yanco, Drury, 2002, Scholtz et al., 2004].
Throughout the studies, various things transpired which lead to critical incidents resulting from
poor SA. For instance, as described in Yanco, Drury and Scholtz [2004], “During the first run
[of the user study], the Team B operator moved the robot’s video camera off-center to look at a
victim for identification and also switched to his thermal camera to verify that it was a live
victim. After the victim identification, the operator switched to shared mode to allow the robot
to get out of a tight space with less operator intervention. At this point, the operator forgot that
he had turned his camera to the left. When he switched back to safe mode, he found that the
results of his actions did not correspond to the video image he saw. This confusion resulted in
3
the operator accidentally driving the robot out of the arena into the crowd and bumping into a
wall trying to get back into the arena. The turned camera also resulted in substantial operator
confusion.” There are many cases of the operator driving with the camera off center in all of
these studies.
Also described is the case of a fire chief test driving one of the systems. He was overly
dependent on the video stream, which is common among users. The interface did not provide a
good method of displaying distance information and the fire chief ended up driving through a
Plexiglas panel. Although the ranging data can see an obstacle like this, it can be much harder
for a human to detect in a video stream. Both studies show that poor SA led to most of the
critical events that occurred.
My research was designed to fill the need for good situation awareness in remote robots. This
thesis documents the lessons from the evolution of our HRI design for improved SA in remote
robot operations. We started with a prototype based on a list of guidelines recommended by
Yanco et al. [2004] and Scholtz et al. [2004]. The guidelines state that a USAR interface should
include:
•
A map of where the robot has been.
•
Fused sensor information to lower the cognitive load on user.
•
Support multiple robots in a single display (if it’s a multi-robot system).
•
Minimal use of multiple windows.
•
More spatial information about the robot in the environment.
•
Help in deciding which level of autonomy is most useful.
•
A frame of reference to determine position of the robot relative to its environment.
•
Indicators of robot health/state, including which camera is being used, the position(s) of
camera(s), traction information and pitch/roll indicators.
•
The ability of the robot to self inspect its body for damage or entangled obstacles.
We implemented a complete working version (version 1.0), which was tested via a user study.
Based on the results of that study, the interface was redesigned and retested (version 2.0). As a
result of the version 2.0 tests, we designed and tested version 3.0.
4
1.2 Contributions
This work describes an interface design that is a result of an evolutionary process. This design
was validated through user testing, which showed improved awareness of the robot’s
surroundings with each new version.
Few researchers in the HRI domain are iterating interface designs via user testing. Notable
exceptions are the Idaho Nation Laboratory (INL) and also Swarthmore College. Due to the
relative paucity of literature describing HRI design iterations, one of this thesis’ contributions is
the documentation of our evolutionary process.
This work puts into action many of the guidelines produced by Yanco, Drury and Scholtz [2004]
and Scholtz et al. [2004]. We provide a map of where the robot has been as well as fused sensor
information. We do not have the user tab through multiple windows to find the information
they need. All of the important information is displayed in a single window. We provide more
spatial information about the robot in the environment. This spatial information takes the form
of a map, as well as displaying the current distance sensor readings in an easy to interpret
distance panel. This information makes it easy to know if the robot is close to an obstacle or
not.
We also provide information on which camera is currently the main one and we use a
crosshair overlaid on the video to indicate the current pan/tilt position of it.
Some original guidelines were also created as result of this work. These guidelines can be added
to those already mentioned from prior work. For instance, using this system, we proved that
having multiple cameras, especially one facing the rear of the robot, greatly improved situation
awareness. Therefore, we state that to improve SA most effectively, if at least two cameras are
present on the robot system, one should face forward and one backward. We also show that
having the ability to see at least part of the robot’s chassis in the video stream also leads to
improved SA which follows along the guideline about being able to use the cameras to inspect
the robot. Also, for our interface, we presented all of the important information on or around
the video screen. Operators pay attention primarily to the video, so information will only be
noticed if it is overlaid on the video, or directly adjacent to it. Although we did not explicitly test
the validity of this claim in our experiments, it has been seen that users ignore information not
near the video screen. Therefore, as a guideline, we state that all important information needed
5
to make real-time decisions should be presented on, or around the main video screen, so the
operator does not have to look far to see it.
Prior to this work, no other research interface in the cited studies used two video cameras on a
single robot platform. Using the two cameras (one front facing, one rear facing), we were the
first to do Automatic Direction Reversal (ADR). ADR allowed the operator to easily switch
their main video from the front camera to the rear camera. This switch also remapped the
driving controls and sensor information, so that it was no longer necessary to back up the robot.
This switch made the back of the robot appear the same as the front allowing the user to drive
the robot as so.
This work also provides lessons on how to provide good SA. By conducting experiments on the
interfaces, we have found a few things that work and a few things that do not, when it comes to
providing improved SA. For instance, the crosshairs seem to be working well. We have
documented very few cases where operators inadvertently drove with the camera off-center for
extended periods of time. We also provide, with the most current version of the interface, an
intuitive distance panel that is easy to interpret, thus requiring no mental stress. We have also
learned that when dealing with surroundings awareness, only close obstacles, roughly within a
meter of the robot, are of real-time importance to the operator.
Providing additional
information about obstacles outside this range produces more mental stress and can adversely
affect SA.
6
2
REVIEW OF RELEVANT RESEARCH
Remote robot interfaces can be broken down in to two categories: map-centric and videocentric. A map-centric interface is an interface where the map is the most predominant feature
in the interface. Most of the frequently used information is clustered on or near the map.
Likewise, in a video-centric interface, the video window is the most predominant feature with all
the important information located on or around the video screen.
2.1 Map-centric Interfaces
A strong case could be argued that map-centric interfaces are much better suited for operating
remote robot teams than video-centric interfaces, due to the inherent location awareness that a
map-centric interface can easily provide. Thus, the relation of each robot in the team to each
other, as well as its position in the search area, can be seen in the map. However, it is tougher to
argue that map-centric interfaces are better for use with a single robot. If the robots do not have
adequate sensing capabilities, creating the maps that these systems rely on may not be possible.
Also, due to the emphasis on location awareness, it can be difficult to effectively provide good
surroundings awareness.
We know of two examples of map-centric interfaces. The first was developed by the MITRE
Corporation and is shown in figure 1. It involved using up to three robots to build up a global
map of the area that was covered. Most of the upper portion of the display was a map that
gradually built up as ranging information was combined from the robots. It provided drawing
tools for annotation. It also had the ability to switch operator driving controls among the three
robots. Small video windows from the robots appeared under the map. A command history list
appeared on the bottom right-hand corner. The command history could be toggled off to see a
slightly larger version of one of the video streams. The main problems with this interface were
the small size of the video screens as well as the slow updates [Drury, Riek, et al. 2003].
7
Figure 1: MITRE’s Map-centric Interface. Photo from: [Yanco and Drury, 2007]
The Idaho National Laboratory (INL) also has a map-centric interface, which is shown in figure
2. Just like our system, the INL interface has been tested and modified numerous times. They
originally started out with a video-centric interface. However, as a result of Nielsen et al. [2004]
and Nielsen et al. [2006], INL developed a map-centric interface. This interface combines 3D
map information (denoted in blue blocks) with a red robot avatar in the map. The video
window is displayed in the current pan-tilt position with respect to the robot avatar by it
swinging around the robot. This indicates the orientation of the robot with respect to where the
camera is currently looking. The INL interface provides a wide variety of icons for marking the
map, including landmarks and waypoints. This is an advantageous feature to have, not only for
being able to quickly recognize where you are, but it also allows for the robot to autonomously
travel back to a previously marked area. However, it can be prone to some of the issues that all
map-centric interfaces face. If the map isn’t generated correctly due to moving objects in the
environment, faulty sensors or other factors, the user could become very confused as to what
8
the actual area looks like. Also, it can be hard to get good surroundings awareness due to how
the walls are drawn with respect to the robot avatar. At times it can appear that the robot is
passing through the wall, where in reality it is just close to the wall.
Figure 2: INL’s original video-centric interface is shown on the top left. The top right screenshot shows a ewer
version of their interface. Bottom is their newest incarnation. It provides a map-centric view, with live video
shown. Photo from: http://www.inl.gov/adaptiverobotics/robotintelligencekernel/3ddisplay.shtml
9
2.2 Video-centric Interfaces
Video-centric interfaces are by far the most common type of interface used with remote robots.
It has been shown in studies that operators rely very heavily on the video feed from the robot
and tend to ignore any other sensor reading the interface may provide [Yanco and Drury, 2004].
Many, if not all, commercially available robots have video-centric interfaces.
Video-centric interfaces are often compared to video games [Richer and Drury, 2006]. First
person shooter games generally give the user full screen video. The video is overlaid with a
heads-up display (HUD) that gives the user all the status info he or she needs, such as health,
ammunition, mini-map, etc. In the same respect, video-centric interfaces often provide full
screen video with status information, such as battery voltage, overlaid in HUD fashion.
However, most robots, especially research platforms, have a variety of sensors that are not
available in the first person shooters. The information provided by these sensors also must be
displayed on the interface.
ARGOS from Brno University of Technology is a video-centric interface, shown in figure 3.
[Zalud, 2006]. It provides a full screen video interface with a HUD that displays a map, a
pan/tilt indicator and also a distance visualization widget that displays what the laser sensor on
the front of the robot detects. What makes this interface really unique is that it uses virtual
reality goggles. These goggles not only display the full interface, but the robot’s camera also
pans and tilts the camera based on where the operator is looking, making scanning an area
extremely intuitive. It also eliminates issues with forgetting that the camera is not centered. The
only problem with this approach is that people have been known to succumb to immersion
sickness due to the goggles. Also, the user must be careful to keep his or her head looking
straight ahead and level to keep the camera centered. This posture requirement could possibly
lead to neck stiffness and other related problems.
10
Figure 3: ARGOS interface from the University of Brno.
Photo from: http://www.orpheus-project.cz/galery/img/5/5_slideshow.jpg
The interface designed by Swarthmore College researchers, shown in figure 4, also has a videocentric interface [Maxwell, Ward and Heckel, 2004]. The operator interface consists of a main
panel showing the view of the video camera. It has a unique feature where it overlays green bars
on the video which show 0.5m distances projected onto the ground plane. The bars always stay
pointing in the forward direction relative to the robot, even when the camera is panned to the
side. It also has pan-tilt-zoom indicators, the red bars, on the top and left of the video screen.
The width of the red bars indicates the zoom setting: a wider bar means a higher zoom setting. It
also displays the current sonar and infrared distance data, where white indicates open space.
This system performed well at the Association for the Advancement of Artificial Intelligence
(AAAI) robot competitions. This interface does a good job with some of the previously
mentioned guidelines. It provides a way to tell camera orientation, shows robot location by way
of a map and has a large video screen. It could be improved by showing how the robot fits in
the environment better by improving the sensor display at the bottom center of the screen.
11
Figure 4: Swarthmore College’s interface inspired by first-person shooter video games.
Photo from: [Keyes et al, 2006]
Figure 5
Figure 5: On the left is the Foster-Miller Talon robot’s operator control unit. It consists of four video displays
from various cameras on the robot. On the right is the iRobot Packbot EOD interface. It contains video streams
from the main camera on the top left and a video window on the top right that can display video streams from
other cameras located on the system. It also shows the current mechanical arm position, as well other status
information. Photos from: http://www.electronicdesign.com/Files/29/14132/Figure_02.jpg. and
http://www.defense-update.com/products/p/pacbot.htm
12
Commercial robot interfaces such as iRobot’s Packbot, Foster-Miller’s Talon, Remotec’s
Andros and American Standard Robotics’ VGTV Extreme, two of which are shown in figure 5,
generally are made up of one or more video streams. If the robot has a mechanical arm, the
interface may include a visualization which shows the current position of the mechanical arm.
However, other sensors such as SICK lasers and sonar sensors are not mounted on the
platforms. There are various reasons to blame for commercial robots not being equipped with
robust sensor arrays. First, many of the sensors are expensive; therefore including them on the
platform would drive the price up of the unit. Also, many of the sensors are too large to fit on
the compact platforms and require more power which reduces time needed before recharging.
Additionally, many of the sensors are not rugged enough to survive the extreme conditions that
many of the commercial robots are forced to deal with. These reasons and more, add up to
commercial robots consisting mainly of platforms with multitudes of cameras on them, with
little else in the way of additional sensors.
All commercial robots, of this type, are teleoperated. They do not have enough sensing power
to be able to complete the complex task of performing autonomous behaviors, so there is always
a human operator at the control station performing all the tasks to be completed. Generally the
robot control teams in the Army, for instance, consist of two or more people. One person is
designated solely to drive, while other people are designated to scan the video for important
information, while another person may be designated to hand draw a map of what the area looks
like as the robot is being controlled through the environment. In the future, when sensors are
cheaper and more rugged, autonomous behaviors will eliminate the need for more than one
person monitoring the system. They may even afford the ability to have one person effectively
monitor multiple robot systems at once, but unfortunately, we are not at that stage for
commercially available platforms.
13
3
TESTING METHODOLOGY
Because it is important to quantify situation awareness (SA), we discuss SA measurement
techniques here. Again, situation awareness, with respect to this research, is defined as “the
understanding that the human has of the location, activities, status and surroundings of the
robot. Further, [it is also] the understanding of the certainty with which the human knows the
aforementioned information.” [Drury et al. 2003]
The tests that were conducted during the creation of this interface, as well as the previous
studies of other systems, followed the same basic testing format. Each study was geared at
assessing SA to figure out what was the best interface or system. Hjelmfelt and Pokrant [1998]
state that experimental methods for measuring SA fall into three categories:
Subjective: Subjects rate their own SA.
Implicit performance: Experimenters measure task performance, assuming that a subject’s
performance correlates with SA and that improved SA will lead to improved
performance.
Explicit performance: Experimenters directly probe the subject’s SA by asking questions
during short suspensions of the task.
For these studies, we could have used the most popular method, Endsley’s [1988] Situation
Awareness Global Assessment Technique (SAGAT), which falls under the explicit category.
However, we did not feel it was appropriate to use a method that relied upon stopping the user’s
progress to inquire about their SA. These interruptions can cause adverse effects on the user’s
ability to maintain the concentration needed to perform well at the task. Instead we elected to
use mainly implicit measures to associate task outcomes with implied SA. The implicit measures
we used were task completion time as well as the number of collisions. A faster completion time
as well as fewer collisions implies better SA. We did perform an explicit measure at the end of
some studies, where the user was asked to complete a secondary task. Subjective methods of
measuring SA are known to be very unreliable, so we do not depend on any subjective methods
14
in these studies. The post run questions do ask how they felt they did in completing the task.
These questions are subjective forms of SA.
However, just because a user thinks they
performed well, it does not mean they actually did well; we observed many instances of subjects
reporting they had not hit anything with the robot, when they had actually caused damage to the
arena [Yanco et al., 2004].
3.1 Test Arena
For all the tests that were performed, the test arenas were all relatively the same. The studies
discussed by Yanco, Drury and Scholtz [2004] all took place in the National Institute of
Standards and Technology (NIST) USAR arena [Jacoff et al., 2000, Jacoff et al., 2001, Jacoff et al.,
2002].
For the studies performed at the University of Massachusetts Lowell (UML) we
constructed our own USAR test arena. Our arenas were constructed in large open lobbies. We
joined 4-foot square sheets of wall paneling together with door hinges to create sections that
could quickly and easily be configured into arbitrary patterns representing damaged rooms and
corridors.
We covered some of the areas with tarps to create dark areas.
These arenas
compared well with the concrete building that houses the standard NIST arenas.
All of the studies performed at UML had multiple arena orientations as well as starting positions.
These orientations were permuted so that a single test subject only saw each arena once and also
so all the test subjects did not run each course in the same order. This permutation helps
remove learning effects from the resulting data.
The configuration of the wall sections,
obstacles and victim locations was the same for all test subjects. We marked the locations of
everything on the floor with tape and drew a map that was used to record the robot's path
during the subject runs, which made it possible to recreate each arena exactly the way it was set
up for the previous users.
3.2 Timed Run
In all the studies, except for the last one that was performed on version 3 of the interface (which
is talked about in section 5.3), the user had a set time limit to complete the task that was asked of
them. In most cases we explained that a disaster had occurred and that the subject had X
minutes to search for and locate as many victims in a damaged building as possible. The time
limit was anywhere from 15-25 minutes depending on the study. This portion of the testing
15
procedure often used a script to be sure that the mission was presented identically to each test
subject. We wanted to simulate the stress of a real search and rescue mission by creating a sense
of urgency. The subject is assured beforehand, however, that the test may be discontinued at
any time without any consequences or ill feelings whatsoever.
3.3 Data Collection and Analysis
During a run, the interface screen was captured directly from the graphics card. In addition,
there was an “over-the-shoulder” camera that recorded the user's interaction with the interface
controls as well as the user's think-aloud comments [Ericsson and Simon, 1980]. Think-aloud is
a study protocol where the test subject verbally expresses their thoughts while performing the
task assigned to them. They are asked to express their thoughts on what they are looking at,
what they are thinking, why they are performing certain actions and what they are currently
feeling. This allows the test administrators to establish the reasoning of why the subject is
performing the task in a specific way. There was usually paper and a pencil at the testing station
for the user to make notes, draw maps, etc. at their discretion. We figured if the subject chose to
use the paper, it could give us ideas about what was missing from the interface. Very often, the
test participants did not make use of the paper.
A cameraman and mapper followed the robot through arenas to create a record of the robot's
progress through the test course. The mapper recorded critical incidents on the map and when
they occurred. The map and video data was used for post-test analysis to determine hits and
also to settle any data collection errors if needed.
The test administrator signaled the start and end of the run to the robot crew via a 2-way radio.
Occasionally, a hardware failure, such as lost communications or dead robot batteries, forced a
restart. This restart was conducted without penalty to the user's run time. Sometimes, an
operator would drive recklessly and cause damage to the environment or the robot. In these
cases, the people following the robot could use their discretion to stop the robot and have the
administrator advise the test subject what happened. The run then resumed from that point.
During the run, the test administrator took notes on the subject's think-aloud comments,
actions, etc. They often recorded if the subject seemed confused or frustrated, but never offered
any kind of help or advice to make them less confused. Sometimes the administrator would ask
16
questions to the subject, if they were being too quiet or seemed confused, so the administrator
could pinpoint in the notes what was the cause of the confusion.
When all the runs ended, the administrator interviewed the subject. The subject was generally
asked to rate his or her own performance and answer a few questions about the experience. The
subject was then asked for any other comments he or she may have.
We analyzed this data to determine performance measures. Performance measures are implicit
measures of the quality of the user interaction provided to users. Under ordinary circumstances,
users who were given usable interfaces could be expected to perform better at their tasks than
those who were given poor interfaces.
There were a few ways we inferred situation awareness from the test data. First, we counted the
number of collisions that occurred with the environment. A user with good surroundings
awareness should hit fewer obstacles than an operator with poor surroundings awareness. We
also analyzed the percentage of the arena covered or the time to complete the task, depending
on the study. A person with good location awareness should not unknowingly backtrack over
places they have already been. Therefore, they should be able to cover more area in the same
amount of time than an operator with poor SA, who might continually traverse the same area
over and over. Likewise, if a person has good SA, it stands to reason that they should complete
the task at hand quicker than someone with poor SA. An operator with poor SA might be
confused and pause to try to figure out what is perplexing them.
Other implicit measures were also taken. These measurements often came from the subjects
think-aloud comments. These comments can give valuable insight into whether or not a subject
is confused, or if they recognize a landmark. For example, users would often freely admit to a
loss of location awareness by saying “I am totally lost.” or “I don’t know if I’ve been here
before” (speaking as a “virtual extension” of the robot).
Some of our studies also used explicit techniques to determine SA. At the end of their task time,
the participant was asked to return to a previously found target. Often this target was a victim in
the arena or the location they started from. The user had no prior knowledge that they would be
17
asked to perform this secondary task. The ability to traverse their way back directly showed if
they had good location awareness.
In Chapter 5, we discuss any variations from these testing procedures with each individual
experiment.
18
4
THE ROBOT SYTEM
Although this thesis describes the evolution of the robot system as a whole, the majority of
changes to the system, as a result of testing, were made to the interface. The original additions
to the robot, such as the second camera and lighting system were made for this research.
However, after that, even though things were added and changed on the robot, it was very rarely
done as a result of user testing.
4.1 Robot Hardware
Our system’s platform, shown in figure 6, is an iRobot ATRV-Jr. It is 77cm long, 55cm high and
64cm wide. It is a powerful four-wheeled all-terrain research platform that can turn in place due
to its differential (tank-like) steering. It came stocked with a full sonar ring (26 sonar sensors)
that encompass the full 360 degrees around the robot as well as an extremely accurate SICK
laser rangefinder that covers the front 180 degrees of the robot. A pan/tilt/zoom color camera
and a full Linux (kernel 2.2) computer running on an Intel Pentium III processor also came
standard. During the three years the robot has been in the lab, it has gone through extensive
modifications in both hardware and software.
Figure 6: The ATRV-Jr
19
We noted during runs of other systems we were studying that a large percentage of the robot
hits in the environment were directly behind the robot [Yanco and Drury 2004]. The reason for
this problem was clear; anything outside of the 180° camera pan range directly in front of the
robot was essentially a blind spot.
To alleviate this problem, we added a rear-facing
pan/tilt/zoom camera to our robot. This camera (a Canon VCC4) is identical to the forwardfacing camera that was already in place. In user tests of using the two cameras, we noticed a
significant reduction in the number of collisions to the rear of the robot [Keyes et al., 2006].
When we looked at the results of the previously studied competitions, the need for more
advanced vision processing became evident. Therefore the internal computer system was fully
upgraded. We replaced the Pentium III system with a Pentium IV system with one gigabyte of
RAM to alleviate the computation requirements of these advanced algorithms. For this upgrade,
the robot required a new custom power supply as well as an update of all of its software,
including iRobot’s Mobility software.
Also, during the study of the other robot systems, we saw that most teams duct-taped a
flashlight to the front of their robot. This was done to help them see in the dark areas of the
arena. However, this was a futile attempt, as the flashlight was generally not bright enough.
There was also no control to turn it off. Many of the panels in the test arenas were reflective.
This caused the flashlight to be reflected back into the robot’s camera causing the white
balancing to go wild, making it impossible to see anything. Also, a flashlight’s beam is very
directional, so if something is lit up, anything to the left or right is not, making the user have to
turn the robot to see more things. Turning the robot, can be a dangerous task if the user has
poor SA. Panning the camera is safer; assuming they remember to re-center it. We felt that
there was a better way to solve this problem. We used Velcro to attach a cold-cathode light to
each exterior side of the robot. These lights are controlled though software, so the user can turn
them on or off with the push of a button. They are also very powerful. We were able to
illuminate a completely dark and cluttered room enough to effectively maneuver through it. The
cold cathode tubes give off ambient light, so everything is equally lit, giving the user the ability to
drive the robot in a sun lit room as well as in a completely dark one.
We also attached a forward looking infrared (FLIR) camera to the front of the robot. This
20
camera is used to detect heat signatures and help find victims that may be covered in dust as well
as in darkened areas. We did some work trying to fuse the infrared video image with the live
regular video stream, so a user does not have to toggle between the two camera views, as they
had to in some other robot systems that were studied [Hestand and Yanco, 2004]. We originally
mounted the Raytheon Nightdriver camera, a low resolution, black and white image that was
intended to be mounted to an automobile. This camera was large and heavy, so we were not
able to have it pan and tilt with the regular color camera as we originally wanted to. We later
moved to a color FLIR camera. The new camera was much smaller and much lighter, which left
open the option to have it mimic the pan/tilt of the primary video camera, which could make
overlaying the infrared image much easier.
4.2 Control Protocol
The overall system architecture is shown in figure 7. Most of the sensor information is sent
from the robot to the interface via User Datagram Protocol (UDP) sockets. We chose UDP
over Transmission Control Protocol (TCP) for two main reasons. The first reason is that in a
crowded network, TCP will throttle its bandwidth back to try to improve connectivity for all
users. It will also queue up packets to be sent when connectivity improves. However, in the
type of situations we are dealing with, we want to be selfish. We do not want the driving
commands that are sent to the robot to be throttled back or held in a queue. If we need to stop
the robot in an emergency, we need that message to get there as quickly as possible. Also, the
queuing problem can be devastating in a fragile environment. If the user gets frustrated that the
robot isn’t responding due to dropped packets or slow connection, every command that they
sent while the connection is slow will quickly get executed as soon as a good status is restored.
This can result in very erratic and extremely dangerous behavior. Therefore, we want to make
sure that any packets that aren’t received in a timely fashion are just ignored and not queued up.
We want the most current data to be received and acted upon. We do not want old data.
21
Figure 7: Interface control architecture.
The video uses the Phission package to capture the video on the robot end. Phission is a
concurrent vision processing developed in the UML robotics lab by Phillip Thoren [Thoren,
2007]. It is used to capture the video streams from the cameras. The video is sent to the
interface via the Real-time Transport Protocol (RTP). It is received and displayed on the
interface end using the Java Media Framework (JMF). The most recent map image is also
captured via the Phission capture class, but is displayed on the interface using a Phission java
panel.
All sensors have a data store on the interface side. Any incoming data packet is routed to the
correct store. The store holds the most current data sent by the robot. This passive information
gathering allows the interface to display the most up to date information sent to it without
having to ask the robot for information and waiting for a response. These stores help the
overall responsiveness of the robot system.
Also, because many of these sensor readings are
updated multiple times a second, we do not have to deal with dropped packets, timeouts, or
sending and receiving acknowledgements. Having these stores also allows multiple panels on
the interface to easily use the same information if it is desired.
Events are used to capture joystick controls and keyboard actions. Every time a joystick or
keyboard button is pressed, or the joystick is moved, an event is triggered. This event will then
22
send the corresponding command out to the robot to be acted upon. These events control
many actions, including moving the robot, changing autonomy modes and panning the camera.
Having an event get triggered is faster than waiting for a control loop to read the current
position of the joystick to adjust the robots speed. If we used the control loop method, many
button presses may be missed if the control loop is not fast enough to catch them.
However, it is appropriate to have the interface panels be managed by a control loop. This loop
watches various timers that are used to activate when certain items such as the map or status
panel get updated. Seeing some panels are not as important as others; they don’t require updates
as often as more important ones. For instance, the distance panel is updated five times a
second, whereas the status panel is updated only once a second. Currently, there is not a huge
speed increase in doing this, meaning the status panel could get updated five times a second
without a noticeable slowdown, but if many more panels were added, having this ability becomes
a benefit.
4.3 Autonomy Modes
The robot system has four autonomy modes: teleoperation, safe, shared and escape, based upon
Bruemmer et al. [2002]. In the teleoperation mode, the operator makes all decisions regarding
the robot’s movement. No sensors are used to help keep the robot from bumping into objects.
It is often described as similar to driving a remote controlled car. In safe mode, the operator still
directs the robot, but the robot will use its distance sensors to prevent the operator from driving
into obstacles. Shared mode is a semi-autonomous navigation mode. The user tells the robot
the general direction they want to go. Based on sensor readings, the robot will comply with the
user's request, or it may choose to take a slightly different trajectory if the user's desired direction
is unsafe. For instance, if a user tells the robot to more forward, but to the front right of the
robot is a close obstacle, the robot will elect to more in a forward-left trajectory. By default,
escape mode is the only fully autonomous mode on the system. If the user puts the robot into
escape mode, the robot will maneuver itself out of tight spaces. This mode was extremely useful
when the robot only had one camera, which was facing forward. If the user traveled down a
tight corridor that led to a dead end, often they were unable to turn the robot in place because it
was so narrow. The use of escape mode in these types of situations was very common.
23
The system does have the ability to be expanded to use more autonomy modes, as shown in
Casey, Chanler, et al. [2005]. However, adding more autonomy was not the focus of this
research, so it will not be addressed further.
4.4 General Interface Design
The interface was designed to address many of the issues that became evident in the previous
studies mentioned in the related work section. This includes measures to prevent inadvertently
driving with the camera off center and providing a map to indicate where the robot has traveled.
It also keeps the distance information close to the main video in an easy to read manor so that
the user is more apt to see it and make use of it. We also provide access to a rear camera and
provide automatic direction reversal. The interface is described in detail in section 4.2, 4.4 and
Chapter 5.
The robot interface consists of many independent panels on the interface. Some of these panels
are more important than others. They are described below with the more important panels
being described first.
In Western cultures, people read from left to right, top to bottom. Therefore, the most
important items on an interface should be located on the top left of the interface and the least
important items should be on the bottom right. This scheme was followed for the placement of
many of the original positions of the panels. Extenuating circumstances, such as panel size,
cropped up in later versions that caused us to break away from this principle slightly.
The main video panel is the hub of the interface. It is what all other items revolve around. As
Yanco and Drury [2004] state, users rely heavily on the main video screen and very rarely notice
other important information presented on the interface. Therefore, all important information
should be present on, or around the main video screen, so that the operator has a better chance
of noticing it. The main video screen should be as large as possible, so users can get the full
visual information provided by the cameras. In our first instances of the interface, the video
screen was on the left side of the screen and migrated to the center towards the end of the
interface evolution.
24
Figure 8: Older ARGOS interface from the University of Brno. It uses center crossed lines to indicate the
pan/tilt status of the camera. Photo from: http://robotika.cz/competitions/rescue2003/UI_hires.jpg
When switching from looking around the environment to driving the robot, operators often
forget to change the camera view [Yanco et al., 2004]. One option to correct this problem would
be to automatically center the camera when the operator starts driving. However, there might be
times where an operator would like to look along a wall to the left while moving forward. In this
case, we would like to allow the camera to remain pointing to the left. Instead of making an
automatic adjustment, we choose instead to make a more visible reminder of the camera’s
orientation. Rather than having separate indicators for the pan and tilt of the robot's camera, as
seen in other systems such as the original INL interface (seen in figure 2), we overlay a small
cross on the screen to indicate the direction in which the camera is pointing. These crosshairs
were inspired by the older Brno robot system, as seen in figure 8.
In the prior studies discussed by Yanco, Drury and Scholtz [2004], it was observed that the
25
robots bumped obstacles in the environment an average of 2.6 times per run. Also, of the 29
total hits that occurred in the study, 12 or 41%, of the hits were on the rear of the robot. We
believe a lack of sensing caused many of the rear hits.
To address the issue of poor situation awareness in the back of the robot, we added a rearlooking camera to our system. Since the rear-looking camera would only be consulted
occasionally and we did not wish to draw attention away from the main video feed, the rear
video feed is relegated to a smaller window and updated less frequently. The video image in this
panel is mirrored along the vertical center axis to provide a rear view mirror effect. This makes
the objects on the right side of the original stream appear on the left side of the video window.
This is done to align the objects properly, because where the camera is facing backwards, objects
in the frame appear on the wrong side if this mirror effect is not done.
In Automatic Direction Reversal (ADR), we can switch the video displays so that the rear view
is expanded in the larger window. The large display indicates whether the front or rear view is
active. Also, the drive commands automatically remap so that forward becomes reverse and
reverse becomes forward. The command remapping allows an operator to spontaneously reverse
the direction of the robot in place and greatly simplifies the navigation task.
The rear video screen was a new feature to these types of robot interfaces when we first
implemented it.
As a result of this work, some newer interfaces in development have
incorporated them into their designs.
There is also a map panel on the interface, shown in figure 9. This panel provides a map of the
environment the robot is in, as well as the robot's current position and orientation within that
environment. As the robot moves throughout the space, it generates a map using the distance
information received by its sensors using a Simultaneous Localization and Mapping (SLAM)
algorithm. This type of mapping algorithm uses a statistical model to compare current distance
readings and odometry information with other readings it has already seen to try to match up
and build a representation environment. This algorithm also can determine the robot's current
location in the map. This is the most widely used and well accepted algorithm for real-time
dynamic mapping using robotic platforms.
26
Figure 9: The map panel. It shows the current area that the robot is in, as well as the path it took around the
environment. The robot is indicated by a green triangle.
The placement of this panel has changed throughout the evolution of the interface, but we have
always kept it at the same eye level as the video screen. This makes it more visible to the user,
which makes them less apt to forget that the panel exists.
The map package we used changed from the Naval Research Laboratory (NRL) mapping
package, WAX, [Schultz et al., 1999] to the PMap package out of the University of Southern
California [Howard, 2004]. However, the basic idea of the map panel remains unchanged.
The distance panel is the panel that has by far been the main focus of this interface throughout
its development. It is a key provider of situation awareness for all “blind spots” on the robot
(i.e. spots out of the robot's current camera view). This panel displays the current distance
sensor readings to the user. The presentation of this panel has differed widely during the course
of its progression and will be discussed more thoroughly in the next chapter.
Some interfaces, such as the Swarthmore interface shown in figure 4, display similar distance
sensor data in separate displays on the screen. This goes against the guideline which states that
interfaces should fuse sensor information to reduce the user’s cognitive load. We, however,
have followed this guideline and have merged the two distance sensor’s data in to a single panel.
27
Figure 10: The mode panel shows the current autonomy mode the robot is in. The background color and
highlighted button will change depending what mode the robot is in.
The mode panel, shown in figure 10, has remained the same in all of our interface versions. Its
purpose is to indicate which mode the robot is currently in. It does this by highlighting the
current button, as well has changing the background color to the color associated with the
current mode. Teleop mode is red, Safe mode is green, Shared mode is gold and Escape mode
is blue. The location of this panel has changed from being on the bottom of the main video
screen to the top in the newest version.
The status panel, shown in figure 11, provides all the status information about the robot. This
information includes the battery level, the robot's maximum speed level and whether or not the
lighting system is on or off. This information is considered less mission critical, than the
previously mentioned panels. This is all information that the user may want to know at some
point throughout the deployment, but it is not considered critical to mission success, unless it
drops too low.
Due to the less important nature of this information, this panel does not need to follow the rule
that all information should be on or around the main video screen. Certainly, a mission cannot
be completed with a dead battery, but the user doesn't need to see the current battery health on
the video screen constantly to have real-time success. In all versions of the interface, except the
paper prototype, this panel has been relegated to the bottom right corner of the interface.
Figure 11: The status panel. Generally the information is not mission critical, but it is good to have access. This
information includes battery life, the lighting system status, current time and the max speed setting of the robot.
Michael Baker’s masters thesis research was about providing suggestions to the operator to help
28
promote proper interface use. Recall, this was a guideline as proposed by Yanco et al. [2004].
These suggestions ranged in variety. Some suggestions indicated what autonomy mode the user
should be in, while others recommended to turn the lights on or off. Others were alerts that
told the user their battery level was running low. This system was relegated to a panel at first
and then later moved to being overlaid on the main video screen [Baker, 2006].
Figure 12: The CO2 panel indicates the current ambient CO2 levels in the robot’s local environment. It can be
used to help detect victims, or identify hazardous levels of CO2 in an environment.
Due to the data store mechanism that is implemented, adding additional sensor data to the
interface is an easy task. All the developer must do is to create a unique id in the transmission
protocol so that the incoming packet can be directed to the correct data store. Then creating a
graphic panel, which uses this newly acquired sensor data, is as easy as specifying an X,Y
position to display the panel on the interface. We added a Carbon Dioxide (CO2) panel, shown
in figure 12, for one of the studies we performed. This panel contained a simple slider that
indicated the robot’s surrounding area’s ambient CO2 level. It is a simple panel, but it shows the
ability to easily add the display of other sensors the robot may need.
29
5
INTERFACE EVOLUTION
This chapter describes the interface evolution. It discusses how the interface is laid out and why.
It also tells about the experiments or usability studies 1 that took place using the interface in
question and what results came from it.
5.1 Prototype and Version 1.0
The original prototype, shown in figure 13, was created as a proof of concept. It was made to
show how the various guidelines set by Yanco et al. [2004] and described in section 1.1, would be
put into affect. Version 1.0, shown in figure 14, introduced a fully functional version of the
interface that was used in two studies.
5.1.1 Prototype Design
Figure 13: Screenshot of the original prototype.
A usability study is a formal test where representative users perform typical tasks under realistic conditions.
Our experiments differed only in the fact that, in most of the experiments, the users were not USAR experts.
1
30
The original prototype consisted of many of the panels described in section 4.4. The large video
screen can be seen on the left center of the screen. The rear-view camera is directly above it.
Bordering the main video screen are colored boxes indicating the current values returned by the
distance sensors. Directly below the video screen is the mode panel, indicating that the robot is
currently in safe mode. Directly to the right of the main video screen is the map indicating the
robots path through the course, as well as its current position and orientation. On the top-right
of the interface is the status panel, indicating battery life, max speed and that the brake is on.
This prototype was created as an exercise to express how the interface design might look.
5.1.2 Version 1.0
Figure 14: Screenshot of version 1.0
Several cosmetic changes were made between the prototype and this version. These changes
included a more aesthetically pleasing mode bar. We also added text to say what mode the robot
is currently in to reinforce the background color. Also, instead of the ranging information being
displayed in boxes around the main video screen, we chose to use colored bars.
31
We
hypothesized that having both the color changing, as well as how many bars were filled in,
would allow for a better understanding of the robot’s situation. Having the ranging information
being displayed as numbers was thought to be too hard to track and mentally exhausting because
the user would have to be the one processing what the numbers meant.
The rear view camera was moved to the top right of the main video screen. We chose to move
it here so that it would mimic the placement of the rear view mirror in a car. An automobile
driver needs to look up and to the right to see their rear view mirror; likewise, our users need to
look up and right to see the rear view camera.
Directly above the main video screen is the first implementation of the suggestion system that
was previously mentioned in section 4.4. It is recommending that the lights be turned off to
conserve battery power, as well as a switch to safe mode In the mode bar, safe mode is also
being highlighted, indicating that it is being suggested, but the background is still red and the text
says “TeleOp Mode” informing the user that the robot is in teleop mode.
This version of the interface was subject to two studies. The first was a small study consisting of
three participants. This study was conducted to get a general sense if we were on the right track
with the interface and our hypotheses. The second study was conducted in conjunction with
Swarthmore College. On our end, we set out to see if having two opposite facing cameras, one
facing forward and one facing backward, would lead to better SA. Swarthmore was tasked with
seeing if one forward facing camera and one overhead camera, which provided a view of the
robot’s chassis in the video image, would lead to better SA.
5.1.3 Results of the First Study
We began this study with the idea of evaluating our progress to this point by comparing it with
the original INL system [Bruemmer et al., 2004]. The INL system won the AAAI robot rescue
competition that year and was considered to be the best and most complete research USAR
system at the time. The idea was simply to conduct the same user test as was done using the
INL system as explained by Yanco and Drury [2004] and compare the results. In the interest of
full disclosure, however, our system differed in more than just the interface. Both robot
platforms were ATRV-Jr research robots, but our robot had nine more sonar sensors than the
32
INL robot. The biggest advantage over the INL system, however, came from the added rear
camera.
There was another difference between the studies that were performed. Some of the subjects
who were tested on the INL system were rescue experts whose experience with computers and
robots varied; these participants were tested after the competition runs ended. During the
competition, the INL robot was controlled by its developer. Our subjects were computer
science students, two males and one female who, presumably, have had much more exposure to
computer interfaces. They did not, however, have any prior knowledge of our system.
Table 1: Situation Awareness and Performance Results
Area
Returned
Covered
to victim
100%
100%
Yes
4
83%
88%
Yes
17
33%
66%
Yes
Subject
Hits
Victims Found
1
2
2
3
During the study, we found that the three users operated the system quite differently. We did
note, however, that two of the three subjects tended to stay with two modes that they were
comfortable with. For instance, the first subject primarily switched between teleop and shared
mode, while the second subject mainly switched between safe and escape mode. The third
subject mostly stayed in teleop mode, but did enter safe mode occasionally. During the training
session the subjects were encouraged to try all of the modes, but during the actual run, they were
reluctant to stray from their working combination.
We also noticed that because escape mode was designed to move forward, if it can, all of our
subjects started to use escape mode to traverse into tight areas that they could not get into with
safe mode and were too tight to maneuver safely in teleop mode. Also, two subjects drove
around the arena using mainly escape mode, even though this is what shared mode was designed
to do. We noted many times that when the user entered escape mode while in Automatic
Direction Reversal (ADR) mode, the robot moved in the opposite direction than what the user
expected. Recall from section 4.4, ADR allows the operator to easily switch their main video
33
from the front camera to the rear camera. This switch also remaps the driving controls and
sensor information so that the back of the robot appears to be the front allowing the user to
drive the robot the same forward or backward. Although escape mode acted appropriately, all
of the subjects commented that the robot should move backwards when in ADR mode.
Two of the three subjects we tested were content with using some form of autonomy to control
the robot. The first subject spent the majority of the run in shared mode and commented that
“you can let it do most of the driving and look while it drives.” The third subject was frustrated
by safe mode because the robot would stop itself. Often was the case that this user would then
switch back to teleop mode and continue on the current path, which in most instances, resulted
in the robot hitting the obstacle that originally caused safe mode to stop the robot.
We observed that subjects who made more use of the autonomy modes had better SA. We
noted that the third operator, who used teleop mode for the majority of the run, accounted for
17 (73%) of the 24 total hits during this study. This user also only found 33% of the victims in
the arena, while subject 2 hit a total of 4 objects and found 81% of the victims. Subject 1, who
did the best, hit only two objects and found 100% of the victims.
This information is
summarized in table 3.
Because it is a much safer way to operate the robot, we prefer our users to be in an autonomous
mode at all times. However, sometimes there may be a need to switch to teleop mode. Most of
the time, however, safe mode will perform better because it puts the robot, the environment and
victims in much less danger since the robot is less likely to collide into things of which the user
may not be aware. Over 90% of the hits occurred while the users were in teleop mode. Safe
mode is a better alternative. However, we did notice that many users got frustrated with safe
mode. This frustration, which was also mention above, occurred when the robot would not
move due to an obstacle being in the way. Often the obstacle was out of camera view, so the
path seemed clear to the user. In these cases, the user would often either think the system was
lagging and not receiving the drive commands, or they would just put the robot in teleop mode
and move ahead anyway, crashing in to the obstacle of which they were not aware. Sometimes
however, it did cause them to glance at the distance panel and notice they were close to an
obstacle. We felt that flashing the proximity information around the video screen to signal that
34
the robot’s path is blocked would be a possible solution to this irritation. We discuss this further
in section 5.2 which discusses version 2.0.
As explained in section 4.4, we overlaid a cross-hair on the video screen to keep the user aware
of where the camera is pointed so they do not inadvertently drive with the camera off center.
Driving with the camera off center can put the robot, environment, or victims in danger. It has
been observed in another study that users have spent 10% of their runs driving unknowingly
with the camera off center [Yanco, Drury 2004]. We did not want to enforce automatic camera
re-centering in our design because we anticipated that some users would want to scan sideways
while driving. In this round of testing, with the cross-hair overlaid, none of our subjects
mistakenly drove with the camera off center. One subject, however, chose to drive with the
camera off center in order to scan along a wall while the robot drove forward.
Yanco and Drury [2004] also found that due to the lack of SA behind the robot, rear hits
accounted for 41% of the total collisions. We theorized that adding a rear camera would
improve SA behind the robot, leading to fewer collisions. In this study, only 1 hit (4%) was
recorded while backing up. There are at least two reasons for this. First, the rear camera allows
the user to see obstacles behind the robot. Second, with ADR, the need for backing up is
essentially eliminated because the user can just swap camera views and drive straight out.
Every user made use of the ADR mode. Sometimes, however, to get out of a tight area a user
would either turn the robot around or back out using the rear-view display instead. One subject
commented that the lights weren't very bright in the back. To support ADR mode, we have
tried to make the front and back of the robot act identically; however, at the time of this test,
there were lights only on the front of the robot. It is possible that users turned in place because
it was too dark to see while backing up and so the front lights were needed. Despite this, the
users still made frequent use of ADR mode.
This study was also a precursor to Michael Baker’s thesis work on the suggestion system [Baker
2006]. An explicit goal of the suggestion system is to teach the novice user about the interface
and remind the experienced user. We felt this goal was accomplished in this study because every
subject remarked that suggestions helped them in some way. One subject who did not explicitly
35
accept any suggestions said they were still helpful because they showed multiple interface
features and when their use was appropriate. Another subject had forgotten that the robot was
equipped with lights until the suggestion provided a reminder.
Surprisingly, the most popular suggestion was the one that toggled the lights. Every subject
commented that it was the most useful suggestion. We originally hypothesized that the mode
and camera suggestions would be most useful. However, as was mentioned above, the subjects
alternated between two modes that they felt comfortable using. Therefore, the user would often
ignore mode suggestions because they were content with the current mode.
The camera suggestions were not used as often as expected, mainly because the users did not
drive accidentally with the camera off center. We felt this was due to the cross-hair overlay.
This suggestion was included as another way to prevent users from driving with their cameras
off center. Without crosshairs, we believed this suggestion would have been more helpful.
One subject noted that most of the time he was so intent on the video screen, that he had not
noticed the suggestions at all. Although the suggestions were near the video screen, some users
still did not notice them. In later versions of the suggestion system, the alerts were overlaid
directly on the video screen so that users would notice them.
Many interfaces that were studied prior to our interface included a robot generated map that can
be used to improve SA and draw attention to unexplored areas. However, we noticed users
tended to ignore the map. We felt that placing the map beside the video screen and on the same
level would make subjects utilize it more. We also saw in the other systems that the robot icon
on the map was either hard to see or nonexistent. Therefore, we placed an easily visible marker
to make it easier for the user to visualize and interpret the area immediately around the robot.
During this study, we observed that two of the subjects used the map. The first subject used the
map to determine where the robot had been, which allowed the user to find and enter
unexplored areas. Recall that this subject found 100% of the victims in the arena. Another
subject used the map to determine where the starting point of the arena had been. This helped
the user visualize where the robot had gone and where it was with respect to the global
36
environment. The bird’s eye view provided by the map can assist in producing a good mental
model of the environment which leads to good location awareness. One subject began to draw
a map using the paper and pencil, despite the interface displaying the robot generated map. This
user quickly abandoned the idea, saying that it was too difficult to do. In our experience,
drawing a map while controlling the robot is too complicated for most users.
The second subject did not make use of the map at all during the run, but in post-run
questioning, he said “I didn’t really use the map, but looking back on it, it might have been
useful.” One subject commented that showing the robot on the map was useful, but it would be
more useful to show the path the robot had taken to get to its point on the map. Other users
commented that if we showed which side was the front of the robot on the marker, it would be
more valuable. Both of those features were added in future versions of the interface. Every user
commented that the ability to mark the map with victim and landmark locations is necessary.
The first subject claimed to have a good mental model of the arena, but admitted that he forgot
where one of the victims was located.
The subjects in this study showed good SA in various ways. The first subject stated twice that
he was scanning the area. He also said, “[I am] putting myself in the center of the room and
scanning around to see if I can see anything.” This strategy for gaining situation awareness is
common among USAR experts.
At the end of the run, when asked to return to a previously found victim, all of our test subjects
were able to return easily to the chosen victim via the most direct route. Multiple subjects, when
asked to return to a victim, successfully found the victim using landmarking. Landmarking is when
a person remembers where something is located relative to other objects in the world. The
ability to add landmarks to the map would help maintain SA.
Also, as previously stated, there was only one hit in the rear, effectively increasing SA behind the
robot. Seventy percent of the hits recorded in this study took place on the side of the robot.
These incidents occurred either by scraping along the edge of a wall while passing it or turning
into it. As expected, the interface provides excellent SA in the front and rear of the robot, but
the sides are still lacking.
37
In our design, we sought to reduce the number of collisions by surrounding the video screen
with proximity information. We felt that having the important information on or around the
video screen would make operators more aware of it, which would lead to better SA. Most of
the users found this information helpful when driving the robot.
This study gave good preliminary results, showing that we were successful in creating an
enhanced interface that provides more useful information to the operator while reducing their
cognitive load. The built-in autonomy modes were utilized successfully. We saw that users who
spent a lot of time in an autonomy mode had more effective runs. The cross-hair eliminated the
dangerous and prevalent, act of driving with the camera off center. We enhanced situation
awareness by use of an additional camera, better map placement and more comprehensible
sensor information. In doing so, we virtually eliminated rear hits while still keeping the interface
intuitive. This test seemed to show that we were on the right track with our interface design. It
showed strong support for the guidelines we had followed to create the interface. We also
learned that the interface wasn’t perfect in its current state. However, this study only consisted
of three users, so we would need a larger study to confirm the results.
5.1.4 Results of the Second Study
The second study of the version 1.0 interface had two parts to it. The first part was to see if
having a forward looking camera, as well as an overhead 3rd person camera would improve
situation awareness. The second part of the study was to see if having a forward facing camera,
as well as a rear facing camera, would improve SA. The first part of the study was performed by
Swarthmore College. The second part was completed by us. For this study, we tried to make
our interface as similar to the Swarthmore interface as possible. For this reason, we removed the
suggestion system, map and restricted the users to operating only in teleop or safe mode. The
arenas were similar to the other arenas used in the previous studies, which were discussed in
section 3.1. Here, we discuss only our part of the study, because it is the only part that has to do
with the evolution of this interface (For the full paper, please see Keyes et al. [2006].)
For our part of the study, we created three versions of the interface, Interfaces A, B and C,
which can be seen in figure 15. Interface A consisted of the main video panel, distance panel,
pan-tilt indicator, mode bar and status panel. For this interface, the test subjects only had access
38
to the front camera’s video stream. Interface B consisted of all the same panels as interface A,
but the user could switch the main video panel to display the rear camera’s video feed, resulting
in ADR mode. Interface C added in the rear view camera panel and also had ADR mode.
Figure 15
Figure 15: a) The full interface designed for the USAR system, version 1.0. b) The simplified interface with a
single camera view. The interface looked like this for both the single camera and switch-able two camera
experiments. c) The simplified interface with two camera views. The camera displayed in the larger window can be
switched with the camera displayed in the smaller window.
39
For this study, we had 19 subjects ranging in age from 18 to 50, with 11 men and 8 women.
Each subject operated the robot through the arenas three times. Each time they had a different
interface.
We found that if the subject had access to the rear camera, their situation awareness increased.
Using a two-tailed paired t-test, we were able to show that there was a significant difference in
the number of collisions that occurred between the different interfaces. When comparing
interface A (the one with only the forward looking camera) to interface C (the one with front
and rear cameras being displayed at the same time), there was a significant difference in
performance (p = 0.02.) We also found a significant difference (p = 0.04), when we compared
the number of hits from interface A to that of interface B. Therefore, the results showed that
situation awareness in the back of the robot is improved by having access to the rear camera,
even if the rear camera is not constantly being displayed. We did not find any significant
difference when we compared the time it took to complete the task.
There was only one user in this study that did not use the rear camera at all. The other eighteen
subjects made at least one camera switch in interface B. For interface C, there were three of
eighteen subjects that did not switch camera modes. One user stated that they didn’t need to
switch camera modes because they had both cameras being displayed already. Another user said
they were reluctant to switch views, because switching views caused their mental model of the
environment to get messed up.
Five of the nineteen subjects preferred to use only the front camera because they were able to
pan the camera down to see the front bumper of the robot. The front of the robot has a larger
bumper than the back of the robot, so the front camera is the only camera that can see the robot
chassis. We found that the five users who had the strategy of looking at the bumper to localize
the robot in the environment had fewer collisions (mean: 8.0 collisions, standard deviation: 4.1)
than the other fourteen subjects (mean: 14.7 collisions, standard deviation: 6.6). This finding
correlated with the results obtained in the other part of the study, where the 3rd person camera
could see the robot in its view [Keyes et al. 2006].
40
We found that most of the hits occurred on the robot’s tires. Of all the front hits that occurred
with the system, 75% of the time it hit with the tires. These tires lie just outside the visible area
and widen the robot by about five inches on each side. Despite warnings by the instructor, users
continually went on the assumption that the boundaries of the video reflected the boundaries of
the robot. Also of interest, we found that 71% of the total collisions in the study occurred on
the tires. Seeing the tires make up almost the entire left and right sides of the robot, this result is
not startling. We were able to improve situation awareness in the front and back of the robot
with the two cameras, but the sides were still lacking.
Fifteen of the nineteen subjects, or 79%, preferred the interface with two camera displays. Three
of the subjects preferred the interface with two cameras that could be switched in a single video
window. Two of these subjects had little computer experience, leading us to believe that they
might have been overwhelmed by the two video windows. The final subject expressed no
preference between the two interfaces with two cameras, but did prefer these two to the single
camera case. No subject preferred the single camera case.
We asked the subjects to identify the best feature(s) of the interface. Eight of nineteen subjects
mentioned pan-tilt-zoom abilities, six of nineteen like switching between cameras and the
distance display was liked most by four users.
When asked to identify the least favorite features of the interface, five subjects stated the control
for the pan-tilt-zoom could be better. Three subjects wanted to have a view of the tires
indicating that they required better SA on the side of the robot.
Two of the users in this study found the distance panel to be unintuitive. A couple of users
thought that the bars on top of the video window corresponded to distance sensors pointing
directly up from the robot and the bars on the bottom represented distance sensors that were
pointing from the bottom of the robot. We also noted that due to the number of colors
displayed by the bars, as well as the amount of bar lines being filled, it was hard to mentally keep
track of what was important. Often the display panel appeared to be blinking due to how often
the distance values were changing, which caused users to start to ignore the panel altogether,
which is not what we want.
41
Although this study was not a study of the complete system since the suggestion system and
map were removed, it did give us good insight to the parts of the system that remained. Having
the second camera helped improve SA significantly. Also, although the distance panel was being
noticed and did improve SA over that of systems in the previous studies, it was not doing
enough to prevent hits in on the side of the robot. We also saw users get confused by its
orientation with respect to how sensors are mounted on the robot.
5.2 Version 2.0
Figure 16: Version 2.0 of the Interface. It shows a reorganization of the video window and map. It has a new
distance panel, as well as the newly created CO2 panel.
Although the user feedback on the distance panel was mostly positive, we decided to design
something better. Our own personal use and opinions of it, coupled with the few negative
responses it received in the previous studies, led us to believe we could come up with something
42
better. Due to how much distance values change as the robot moves, the icons were constantly
changing colors and the number of bars filled. The rapid changes made it hard to keep track of
the distance to obstacles, which led to users ignoring that information completely: the complete
opposite of what we wanted. Also, some users thought the sensors displayed on top of the
video screen were sensors facing upward from the robot, despite being told what they were
during the training session.
5.2.1 Design
We wanted to keep the panel simple. We followed along a human-computer interaction (HCI)
principle of aesthetic and minimalist design, which says “dialogues should not contain
information which is irrelevant or rarely needed. Every extra unit of information in a dialogue
competes with the relevant units of information and diminishes their relative visibility” [Molich
and Nielsen, 1990]. Due to this desire for simplicity and the other issues mention above we
moved the ranging data from around the video window to directly below it. The range data still
borders the video, so we did not ignore the guideline that important items need to be on or near
the video screen to be noticed. We changed the look and feel of the distance panel and went
from the colored bars back the original prototype design of the simple colored boxes. We also
changed it to consist of only three colors: gray, yellow and red. This way it wouldn’t be
constantly blinking and changing colors. In general, when remotely operating the robot, users
only care about what obstacles are close in proximity, so having more colors representing objects
that are far away is rather useless. Therefore, in the new display a box would turn yellow if there
was an obstacle within one meter of the robot. Likewise, it would turn red if the sensor detected
an obstacle within 0.5 meters of the robot.
The last major change we made to the distance panel was that we changed it to a perspective
view. This 3D view allows the operator to easily tell that the “top” boxes represent forward
facing sensors on the robot. It also helps create a better mental model of the space due to the
depth the 3D widget provides. Also, as stated in the previous section, SA on the side of the
robot was bad. The new view allowed the user to picture the sides of the robot better, which we
hoped would improve SA even more. Also, because this panel was in 3D, we added the ability
to have it rotate as the user panned the camera. This feature, shown in figure 17, is one that we
had wanted to add since the prototype, but it was too complicated to make it viable on the
43
Figure 17: Interface screenshot showing the rotated distance panel caused by the user panning the camera to the
left. The red boxes line up with the obstacle that is shown in the video window.
Figure 18: The zoom mode display.
44
previous version. With the 2D view, rotating the panel clockwise or counter-clockwise was
programmatically difficult.
However, with the 3D panel which uses JOGL, an OpenGL
implementation for Java, creating the rotation effect was trivial. If a user pans the camera left,
the ring will rotate right. This rotation causes the distance boxes to line up with the objects the
user is currently seeing in the video window. It also doubles as a pan indicator to let the user
know if the robot’s camera is panned left or right.
This version of the interface also included new mapping software. PMap from USC is a SLAM
based mapping suite that is easier to manage than the previous suite was. It has slightly more
features than the previous suite had, such as displaying the robot's path through the
environment [Howard, 2004]. One feature that resulted from it was a panel that we termed
“zoom mode.” This feature, which can be seen in figure 18, was made chiefly as a toy, for us,
the developers, to fool around with, while testing out some of the new mapping functionality. It
is in essence a view of the map at a zoomed in level. It takes the raw laser data in front of the
robot and draws a line, connecting the sensor readings together. There is also a smaller rectangle
on the bottom of this widget that represents the robot. As long as the sensor’s lines do not
touch or cross the robot rectangle, then robot is not in contact with anything. This sensor view
gives a highly accurate, highly visual and extremely easy way to tell if the robot is close to an
object or not. The lines make it easier to visualize the environment than what the colored boxes
provide. This visualization leads to less mental translations and less cognitive load. The only
problem that we had with this panel was that it was placed in the map display panel, making
them mutually exclusive.
The video screen was moved to the center of the screen, rather then being on the left side. This
shift was mainly due to the fact that the new distance panel was larger and with the rotation
feature, was being cut off by the edge of the screen. Placing it in the center allowed for the full
ring to be displayed at all times. The map was moved to the right side of the video and we
added the CO2 sensor panel to this version of the interface. The CO2 panel was added as a signof-life detector for the study we performed on this interface at NIST.
5.2.2 Usability Study and Results
We wanted to see differences in preferences and performance with the UML interface and the
45
INL interface. We wanted to test the various thoughts that a map-centric interface would cover
more area than a video-centric interface. We also wanted to see if a video-centric interface
would provide better surroundings awareness, which would allow more victims to be found.
Therefore, we designed a within-subjects experiment with the independent variable being
interface type. Eight people (7 men, 1 woman) ranging in age from 25 to 60, all of whom had
search and rescue experience, agreed to participate. This study took place at the NIST arena in
Gaithersburg, MD. For the study, each subject was given 25 minutes, not including training
time, with each interface to explore the NIST arena searching for victims. We then compared
the results in many ways. This study was set up similarly to the ways the other tests were set up.
We compared the final results by not only the amount of area covered and hits that occurred,
but also by the subjects’ think-aloud comments that were uttered during their runs. The
participants’ post run questionnaires were also used in determining the results.
We first compared the interface by area coverage: we hypothesized that the three dimensional
mapping system on INL’s interface (see figure 2, bottom screenshot) would provide users with
an easier exploration phase. Table 2 gives the results of arena coverage for each participant with
each of the robot systems. There was a significant difference (p<.022, using a two-tailed paired
t-test with dof=7) between the amount of area covered by the INL robot and the amount
covered by our robot, seeming to confirm that hypothesis.
Table 2: Comparison of the percentage of the arena covered for two interfaces
% Area Covered
Participant
INL
UML
1
8.7
12.6
2
37.9
25.2
3
34.8
34.8
4
37.9
19.7
5
30.3
27.3
6
33.3
22.7
7
53.0
31.8
8
30.3
19.7
Average
33.3
24.2
St. Dev
7.8
5.8
46
One possible confounding variable for this difference was the size of the two robots. The
ATRV-Mini (INL’s robot) was smaller than the ATRV-Junior (UML’s robot) and thus could fit
in smaller areas. However, the first half of the arena, which was the primary area of coverage,
had the widest areas, fitting both robots comfortably.
We also compared the interfaces by the number of bumps that occurred. The number of times
that the robot bumped into something in the environment is an implicit measure of situation
awareness. However, there were several confounding issues in this measure. First, the INL robot
experienced a sensor failure in its right rear sensors during the testing. Second, the INL robot
has a similar length and width, meaning that it could turn in place without hitting obstacles; the
UML robot was longer than it was wide, creating the possibility of hitting obstacles on the sides
of the robot. Finally, subjects were instructed not to use teleop mode on the INL robot, instead
they were asked only to use safe mode. They were allowed to use teleop mode on our robot.
Despite these confounding factors, we found no significant difference in the number of hits that
occurred on the front of the robot (INL average: 4.0 (3.7); UML average: 4.9 (5.1); p=.77). Both
robots were equipped with similar cameras on the front and both interfaces presented some sort
of ranging data to the user. As such, the awareness level of obstacles in front of the robot
seemed to be similar between systems.
When hits occurring in the back right of the robot were eliminated from both the UML and INL
rear hit totals, because of the INL sensor failure, we did find a significant difference in the
number of hits (INL average: 2.5 (1.6); UML average: .75 (1.2); p<.037). The UML robot had a
camera on the rear of the robot, adding additional sensing capability that the INL robot did not
have. While both robot systems present ranging information from the back of the robot on the
interface, the addition of a rear camera appeared to improve awareness of obstacles behind the
robot. This result correlates to the findings in Keyes et al. [2006].
The systems also had a significant difference in the number of hits on the side of the robot (INL
average: 0 (0); UML average: 0.5 (0.5); p<.033). As the two robots had equivalent ranging data
on their sides, the difference in hits appeared to come solely from the robot’s size and geometry.
47
The number of victims found was also compared between the two interfaces.
We had
hypothesized that the emphasis on the video window and other sensor displays such as the FLIR
and CO2 sensor of the UML interface would help users find more victims in the arena.
However, this hypothesis was not borne out by the data because there was an insignificant
difference (p=.35) in the number of victims found. Using the INL system, participants found an
average of .63 (.74) victims. With the UML system, participants found an average of 1.0 (1.1)
victims. In general, victim placement in the arena was sparse and the victims that were in the
arena were well hidden. Using the number of victims found as an awareness measure might have
been improved by having a larger number of victims in the arena, with some easier to find than
others.
At the end of the runs, each user was asked a series of Likert scale questions. The users were
asked to rank the ease of use of each interface, with 1 being extremely difficult to use and 5
being very easy to use. In this subjective evaluation, operators found the INL interface more
difficult to use: 2.6 for INL vs 3.6 for UML (p =.0185).
Users were also asked to rank how the controls helped or hindered them in performing their
task, with 1 being “hindered me” and 5 being “helped me tremendously.” Operators felt that the
UML controls helped them more: 4.0 for UML and 3.2 for INL (p=.0547).
Users were also asked what features on the robots helped them and which features did not. We
performed an analysis of these positive and negative statements, clustering them into the
following groups: video, mapping, sensors, input devices and autonomy. The statements
revealed insights into the features of the systems that the users felt were most important.
In the mapping category, there were a total of 10 positive mapping comments and one negative
for the INL system and 2 negative mapping comments overall for the UML system. We believe
that the number of comments showed that the participants recognized the emphasis on mapping
within the INL interface and showed that the three-dimensional maps were preferred to the
two-dimensional map of the UML interface. Furthermore, the preference of the INL mapping
display and the improved average percentage of the environment covered by the INL robot
suggested that the user preferences were correlated with performance. Interestingly, two of the
48
positive comments for INL identified the ability to have both a three dimensional and twodimensional map. Subjects also liked the waypoint marking capabilities of the INL interface.
Due to these results, we modified the guideline that states the system should provide a map of
where the robot has been. We changed it to state that the system should provide a map of
where the robot has been and also allow the ability to label the created map with landmarks,
labels and waypoints (if the system supports autonomy).
There were a similar number of comments made on video about the two systems (13 for UML
and 16 for INL), seeming to suggest that video is very important in this task and that most
subjects were focused on having the best video possible. There were more positive comments
for UML (10 positive and 3 negative) and more negative comments for INL (3 positive and 13
negative). The INL video window moved when the camera was panned or tilted; the robot
stayed in a fixed position within the map while the video view moved around the robot. This
video movement caused occlusion and distortion of the video when the camera was panned and
tilted, making it difficult to use the window to identify victims or places in the environment.
Interestingly, most of the positive video comments for UML did not address a fixed position
window (only 1 comment). Four users commented that they liked the ability to home the camera
(INL had two positive comments about this feature as well). Three users commented that they
liked having two cameras.
All comments on input devices were negative for both robots, suggesting that people just expect
that things will work well for input devices and will complain only if they aren’t working. There
were a similar number of positive comments for autonomy, suggesting that users may have
noticed when the robot had behaviors that helped. It is possible that the users didn’t know what
to expect with a robot and thus were just happy with the exhibited behaviors and accepted
things that they may not have liked.
We saw many more comments on UML’s sensors (non-video), which identifies the emphasis on
adding sensors on the UML system. INL had two negative comments for not having lighting
available on their robot. UML had ten positive comments (one each for lights, FLIR and CO2,
four for the zoom mode display and three for the sonar ring display) and three negative
49
comments (two for the sonar ring display blocks not being definitive and one for the FLIR
camera).
Our analysis suggests that there are a few categories of great importance to operators: video,
labeling of maps, ability to change perspective between 3D and 2D maps, additional sensors and
autonomy. In fact, in their suggested ideal interface, operators focused on these categories.
The occlusion of video by other sets of information may have influenced the operator’s ability to
adequately search the environment, as it was more difficult for the operator to see the entire
visual scene. Another possibility is that the navigational requirement of the task took sufficient
effort from the participant that it negatively impacted the operator’s ability to search the
environment. Even though there were various levels of autonomy available to facilitate the
navigation of the robot, participants often expressed confusion about where the robot had been
and what they had seen previously. To improve the usefulness of robot systems in search and
detection tasks in general, it will be important to reduce the operator’s responsibility to perform
both the navigation and search aspects of the task.
5.3 Version 3.0
We saw in the previous experiment that although the colored boxes on the distance panel
performed better than the previous colored bar approach, they weren’t far superior. The main
problem with them was that, while trying to keep it simple, we had only two important colors to
display: yellow and red. This turned out to be too simple. When in a tight area, which is often
the case in a USAR environment, the robot may not have 0.5 meters on either side of it, which
was the case during the experiment. If a distance box was red, the user knew that an obstacle
was close, but didn’t know how close. When talking about this kind of space, 0.5 meters is large.
We could have fine-tuned it so that it only turned red at 0.1 meters, or even 0.05 meters, but the
basic problem is still there. The colored boxes are not definitive and that uncertainty causes the
user to not trust the system.
The major thing that we took away from the previous user study was that the zoom mode
feature is a great tool to have. The users commented on how much they liked that feature. It
solves the uncertainty problem mentioned above as well. Using the lines provides a concrete
50
Figure 19: Top mini-map shown in the top-right of the screen. Bottom: Toggled large view of the map, showing a
larger area. Screenshots taken from Electronic Art’s Battlefield 2.
51
idea of how close an obstacle is to the robot without overwhelming the user. It is also extremely
accurate, which can help produce a better mental model of the environment. The operator does
not have to extrapolate what the area might look like based on colored boxes, thus reducing
their cognitive load. The user can see the flow of the obstacles with respect to the robot’s
movements. It also helps to give the user a more accurate idea as to what the layout ahead looks
like.
The main complaint about the interface during the previous study was that the map was too
small. It is not only hard to make out where the robot is located on it, but also it is hard to
understand the robot’s orientation. The idea we had to counter this was to use a video-game
technique known as a mini-map. We would keep the map small and displaying local space. Then
the user could toggle a larger version to overlay the screen. The larger version would show the
entire map space. When the user is done with the larger map, they toggle it back to the smaller
version of the map. This works very will in video games that need to conserve screen real estate.
One example of this is Battlefield 2 seen in figure 19.
5.3.1 Design
Using the results from the previous experiment, we again set out to improve upon the interface.
For this version, we chose to again scrap the current distance panel. Although the boxes were
better than the bars, their uncertainty made it impossible for the user to trust the system. In its
place, we chose to implement the zoom mode feature as the main distance panel. However, we
added to it to encompass the entire circumference of the robot. The front part of the robot
would use the laser data, while the left, back and right sides would use the sonar data. We also
added tick marks to indicate the distance that the lines portrayed. These tick marks are spaced in
0.25 meter increments. This panel was again placed directly under the main video display.
Unlike the previous zoom mode, this new panel also had the ability to not only give a top-down
view, but also a perspective view. We saw in the previous study that users liked having the ability
to go from a 2D map to a 3D map and since the zoom mode is technically a local space map, we
felt users would appreciate this toggle ability here as well (shown in figure 21). Also, as with the
previous distance panel, this panel also rotated with respect to the user panning the camera.
52
Figure 20: Version 3.0 of the interface. It boasts a larger video window, a new distance panel and a relocated
mode bar.
Figure 21: The new distance panel. Left is the top-down view, where right is the same view but in a perspective
display.
53
5.3.2 Experiment and Results
We again performed an experiment on this version of the interface. This new study consisted of
18 users, 12 men and 6 women. They varied in age from 26 to 39, with varying professions.
None of them were USAR experts. The main purpose of this study was to directly compare the
version 3 distance panel (figure 22, Interface A) with the new version 3 distance panel (figure 22,
Interface C). We also added a modified version of the distance panel from interface A that
overlaid the distance values in meters on the colored boxes, which was the idea we had in the
original paper prototype (figure 22, Interface B). This information gives the user exact distance
information. These interface layouts are shown in figure 21.
Figure 22: a) Interface A. Distance panel with just the colored boxes. b) Interface B. Colored boxes with
distance values displayed in the boxes. c) Interface C. “Zoom mode” inspired panel with lines displaying the
distance values.
This test differed slightly from the other previous studies we conducted. For this study, the user
was only tasked to go through an arena and back again. Unlike all of the previous arenas, these
consisted of one path. When the user got to the end, they were asked to turn around and come
back out the way they came in. The user was not searching for victims: they just had to
maneuver through the course. The courses in this study were much narrower than ones from
previous studies. In some cases, there was only 3 centimeters of clearance on either side of the
robot. This was done to fully exploit the weaknesses of the distance panels on each interface to
show which one was truly the best. If the arenas were wide open and easy, then there may have
been no significant difference found between the interfaces.
We also forced the user to only use teleop mode, which was not done in the previous studies.
54
We were studying the effects of the distance panel. If we allowed the robot to take some
initiative, such as stopping itself, it may have prevented many of the critical events from
happening, which may have skewed the results. Therefore, the autonomy confounder was
eliminated.
For this study, we hypothesized that interface A would perform the worst due to the lack of
information that it provides. We felt that interface A would yield the most collisions due to the
uncertainty of the information. However, we thought that it would yield relatively fast run times
because the user would start to ignore the information provided due to the uncertainty of it.
We hypothesized that interface B would result in many fewer collisions than interface A due to
the exactness of the data presented. However, because the user would have to mentally process
the numerical data to get useful information, we felt interface B would lead to longer run times
than both interfaces A and C. We felt users would perform the best using interface C due how
easy it is to visually process the information.
We hypothesized that interface C would yield fewer collisions than both of the other interfaces,
as well as the fastest run times of both the interfaces. It is very easy to interpret, thus it is
extremely easy to recognize if an obstacle is close to the robot, without having to expend mental
effort calculating numbers. Due to the various numbers constantly changing values on interface
B, we felt sometimes they would be misinterpreted due to cognitive overload. With interface C,
we felt this would not be an issue. Even though interface C's data presentation is still technically
not as precise as interface B's, the fact that the user can instantaneously know if obstacles are
close or not would provide much better situation awareness.
We did not want the user to get lost in the arena. The courses were deliberately made to have
only one possible way to go. We wanted to know which interface yielded the fastest results and
if a user was lost in a maze, the results could get skewed, yielding an incorrect result for which is
the best distance panel. Along these lines, if a user did get confused as to where they were, the
test administrator told them which way was the correct way to go (the information the test
administrator gave the operators while the actual runs were in progress.)
55
Table 3: Time and hit results from the study performed on version 3.0 of the interface
Interface
Time (s)
A
B
C
507.9
634.6
495.4
σt
283.6
409.1
217.8
Collisions
8.8
7.6
6.0
σc
3.7
3.1
3.1
Each operator was given all the time they needed to go from the start to the end of the arena
and back to the start. The time it takes each user to make this trek on each interface was
collected and analyzed. Our initial hypotheses held true for most of the test cases when
comparing time on task. On average, interface A took 508 seconds (standard deviation: 283.6)
to complete the runs. Interface B took an average 635 seconds (standard deviation: 409.1) to
complete the task and interface C took an average 495 seconds (standard deviation: 217.8) to
complete the task. Interface C was the fastest while interface B was by far the slowest. Again,
we feel this is due to cognitive load differences between the two distance panels. Interface B
requires many mental calculations to yield important results, where no mental number
calculations need to take place for interface A or C. Interface A performed on par with interface
C, again because there were no calculations to be done, but also because it is uncertain, so users
tended to ignore the many red boxes that were displayed. For most of the run, the boxes were
red due to how narrow much of the arena was.
The difference in the amount of time it took for the three interfaces was significant. Using a
two-tailed paired t-test (dof=17), Interface A was significantly faster than interface B (p= 0.02).
Interface C was also significantly faster than interface B (p=0.031).
There was a learning effect with respect to the time it took to complete the task. The difference
in the time it took to complete the first run compared to the second run was not significant,
although the second run on average was faster than the first (p = 0.15). However, there was
significance when comparing the second run to the third (p = 0.019) and there was 99.9%
significance when comparing the time of the first run to the time of the third run (p = 0.0005).
However, because the interface and arenas were permuted, one interface was not unfairly given
the edge for time. No course was significantly easier than the others with respect to time to
complete.
56
When comparing the number of collisions that occurred, our initial hypotheses were correct.
Interface A had the most collisions, with an average of 8.78 hits per run (standard deviation:
3.72). Interface B had an average of 7.61 hits per run (standard deviation: 3.11) and Interface C
did the best, with an average of 6.00 hits per run (standard deviation: 3.07).
The number of collisions experienced using interface A versus interface B is not significant (p =
0.14). However, the number of hits was significant when comparing both the other interfaces to
interface C. Interface A compared to interface C resulted in p = 0.007 and compared to
interface B, p = 0.041. These results show that interface C was clearly the winner when it came
to the number of collisions that occurred.
This experiment provided very definitive results. We found the data closely matched our initial
hypothesis. Interface C out performed interface A when compared to both time on task as well
as critical events that occurred. Interface C also had significantly fewer hits and yielded
significantly faster run times than interface B.
The total number of collisions that stemmed from this experiment is much larger than the
number of hits we've seen in previous studies. This is not a sign that the newer interface is in
some way inferior, however. As was previously stated, the arenas in this experiment were
extremely narrow and operators were only allowed to be in teleop mode, so a larger number of
total collisions were expected.
One confounder that may need to be studied in the future is that this experiment differed more
than the studies that were carried out with the other interface versions. In this study, the user
went down a path and came back. They did not have to look for victims or get lost in a maze,
which are challenges that the previous studies presented. Therefore, a user may have been more
apt to concentrate on the distance panel more than they would have, because there was no threat
of missing a victim or important landmark in the video. However, the study still shows that the
distance panel with the lines, in interface C, is by far better than the previous one. In the future,
it would be beneficial to perform a study similar to the previous studies conducted on the other
versions of this interface.
57
As for the new distance panel, the majority of the users (11 of 18) preferred interface C, while
six of the eighteen participants preferred interface B. Some commented that having the exact
numbers were a huge benefit and indicated that if somehow the numbers could be shown along
with the lines from interface C, they would like it better. Only one user selected interface A as
being the best, stating that they liked how it was less cluttered, but also that they were more used
to the system by the third run. Because interface A was the last interface they used, perhaps they
would have chosen a different favorite if they happened to have another interface last.
Three users did, however, say they liked interface C the least. All three commented that the lines
kept changing their distance, which made it hard to track. The sides and back of the robot use
sonar sensors to detect the distance. Sonar sensors are inherently unstable and fluctuate a great
deal. There is an averaging algorithm being performed as the robot collects the distance
readings, to try to minimize this fluctuation, but where interface C is easy to interpret, every shift
is noticed. With interface A, the box will most likely stay the same color, or in interface B,
where the user won't notice the changing numbers as much if they aren't directly looking at it.
We believe this is more of a poor sensor issue, rather than a poor display issue, because if there
were laser sensors on the sides and back of the robot, instead of the sonars, these fluttering lines
would not occur. The movement of the lines as the robot moves through the environment
would be much more fluid. Fourteen of the eighteen uses disliked interface A the most and one
user disliked interface B the most.
About half the users preferred having interface C in its perspective view, while the other half
preferred it in the top-down view. Therefore the ability to be able to switch views is a feature
that will be kept. Most users generally chose which view they liked at the beginning of the run
and stuck with it. Several subjects, however, did change the panel's view at various times during
the run. Generally these users would put the panel in the top-down view when they were very
close to an obstacle.
58
6
RESULTS AND CONCLUSIONS
We have succeeded through design and testing in providing a very useful surroundings
awareness panel that displays accurate data to the user in an easy to interpret manner. Through
testing, the current distance panel was proven to provide faster run times, with fewer collisions
than any of the other methods we had seen in prior studies.
We succeeded in providing proof that the guidelines we followed in the creation of the interface
were accurate assumptions. These guidelines and the results of the experiments are summarized
in table 4.
•
We provided a map of where the robot had been. Although we had many complaints
about our map, we found in the usability study performed on version 2.0 that a good
map is liked and wanted by users. Also, as a result, we say that not only should the
interface provide a map of where the robot has been, but also should provide the
functionality to be able to place labels and landmarks on the map.
•
We fused sensor information to lower the cognitive load on user. Having the laser and
sonar sensor values being displayed in the same distance panel allowed the users to only
have to look at one spot on the interface for the distance information. Through an
iterative process, we successfully provided a way to provide more spatial information
about the robot in the environment in an easy to interpret distance panel. The display
panel rotates when the operator pans the camera. This allows the user to line up the
obstacle they see in the video with where it is represented in the distance panel, which
also reduces their cognitive load.
•
We also provide indicators of robot health and state. We include information on which
camera is currently in the main display. Crosshairs are overlaid on the video screen to
show the current pan/tilt position of the main camera. The rotation of the distance
panel also doubles as a pan indicator.
•
We have shown, in the second experiment of version 1.0, that the ability to see the
robot’s chassis improves SA. This finding helps to strengthen the guideline that states
the robot should have the ability to self inspect its body for damage or entangled
obstacles.
59
We also add our own guidelines to enhance the list of proven guidelines.
•
Important information should be presented on or very close to the video screen. Users
primarily pay attention to the video screen, so keeping important information on or near
it makes it more noticeable.
•
If the robot system has more than one camera, a second camera should be mounted
facing the rear of the robot to provide the best SA.
•
If the robot system has more than one camera, the system should include an ADR mode
to improve SA and reduce the number of collisions that occur while the robot is backing
up.
We are aware that most of these findings will not make it on any commercial interface anytime
soon, due to sensor prices and sensor frailty. In the future though, this work could be quite
useful to commercial telepresence systems.
60
Table 4: Original Guidelines and Results
Result
Discussion
Revised or New Guideline (if
applicable)
Confirmed/
Revised
We proved that operators want to have a
map. Also, not only should the interface
provide a map of where the robot has been,
but also should provide the functionality to
be able to place labels and landmarks on the
map.
Provide a map of where the robot
has been, while providing the ability
to place labels and landmarks on the
map.
Supported
We fused sensor information to lower the
cognitive load on user. Having the laser and
sonar sensor values being displayed in the
same distance panel allowed the users to
only have to look at one spot on the
interface for the distance information. For
confirmation, another study to compare an
interface with similar distance panels
containing non-fused data with an interface
using the same panels with fused data
should be performed.
Confirmed
Interface 3.0 provides a distance panel that
shows the user exactly how the robot is
situated within its local environment. This
panel was proven in the experiment to
provide increased situation awareness over
the other panels.
Confirmed
The map and distance panel helped increase
situation awareness by providing a good
frame of reference to determine the position
of the robot relative to its environment.
Provide indicators of
robot health/state,
including which
camera is being used,
the position(s) of
camera(s), etc…
Supported
Although not explicitly tested, we observed
driving with the camera unknowingly not
centered was significantly less that was
noted in previous experiments. This is
assumed to be because of the crosshairs and
later the rotating distance panel.
The robot should
have the ability of the
robot to inspect its
body for damage or
entangled obstacles.
Confirmed
We have shown, in the second experiment
of version 1.0, that the ability to see the
robot’s chassis improves SA.
New
Users primarily pay attention to the video
screen, so keeping important information on
or near it makes it more noticeable.
Important information should be
presented on or very close to the
video screen.
New
We have shown in the second study of
interface version 1.0 that having a rear
facing camera significantly improves
situation awareness.
If the robot system has more than
one camera, a second camera should
be mounted facing the rear of the
robot to provide the best SA
ADR mode reduces the amount of hits that
occur while the robot is backing up.
If the robot system has more than
one camera, the system should
include an ADR mode to improve
SA and reduce the number of
collisions that occur while the robot
is backing up.
Original Guideline
Provide a map of
where the robot has
been.
Fuse sensor
information to lower
the cognitive load on
user.
Provide more spatial
information about the
robot in the
environment.
Provide a frame of
reference to determine
position of the robot
relative to its
environment.
New
61
7
FUTURE WORK
The first and most important feature that should be implemented in the future is a mini-map.
We have heard many complaints about the size of the map, especially in the study that was
conducted on version 2.0 of the interface. Users often stated that the robot was still hard to find
on the map. To combat this, I propose that a mini-map be implemented. This technique, used
in many video games such as Battlefield 2, gives the user a moderately zoomed in view of their
location. They can then toggle the small map to become large, possibly taking up the whole
screen. This large map view will show the entire generated map, as well as the robot’s location.
When the user is done looking, it can be toggled back to a small map, so it does not interfere
with the rest of the interface. We hypothesize that this will provide a useful tool to increase
location awareness without causing a large part of the current interface to change.
We must also implement the ability to mark the map with waypoints and landmarks. This
capability was identified in many of the usability studies, but most notably in the study
performed on version 2.0 of the interface. We tried to keep the mouse out of the control
paradigm of the system, because we were already using the keyboard and joystick to control the
interface. Currently, there is no good solution to be able to mark the map. Adding a mouse to
the system would most likely mean removing either the keyboard or joystick. This is a difficult
choice, because the joystick is a great way to control the robot and marking the map with icons
may not be very beneficial if there is no keyboard to be able to label the landmarks. Also, in real
world examples, a mouse or trackball might not be a viable option due to equipment
requirements, such as bulky gloves. Nonetheless, this feature should be implemented in some
way. If we removed the keyboard from the system and implemented a mouse instead, then the
buttons on the mode bar, as well as a button to toggle the lights and robot speed would have to
be implemented to be clickable via a mouse.
The current display panel only displays 2D data. If an obstacle exists above or below the sensor,
it may be missed, which can lead to very dangerous situations. The use of a 3D sensor could be
implemented. Either a Swissranger SR-2 sensor, or possibly many Hokuyo URG-04LX laser
sensors mounted at an angle, would allow for a 3D visualization. This 3D volume could be
62
displayed similarly to how the current distance panel is now displayed. This would make
toggling from a perspective view to a top-down view much more useful. The top-down view
would provide a view that shows the closest object to the robot on any horizontal plane,
whereas the perspective view would provide a volumetric presentation.
Sonar sensors are not reliable. They are good to have as backups, but when maneuvering in
tight areas, their fluctuations are unwelcome. Mounting Hokuyo lasers around the entire robot
would help to provide accurate data on all sides of the robot. The Hokuyo sensors are relatively
cheap and can sense up to four meters, which is more than enough range when, as mentioned
before, operators really only care about obstacles that are close to the robot.
A second study should also be conducted on interface version 3.0. This study should mimic
other USAR-style studies that have been performed, where the user searches a maze-like space
for victims. That way version 3 can be fully compared to the other interfaces in all the previous
studies.
63
8
REFERENCES
1) Baker, M., R. Casey, B. Keyes and H. A. Yanco, “Improved Interfaces for Human-Robot
Interaction in Urban Search and Rescue,” Proceedings of the IEEE Conference on Systems, Man and
Cybernetics, October 2004.
2) Baker, M., “An Intelligent Suggestion System for Improved Human-Robot Interaction,”
Master’s thesis, Computer Science Dept., University of Massachusetts Lowell, 2006.
3) Bruemmer, D., R. Boring, D. Few, J. Marble and M. Walton, “‘I Call Shotgun!’: An
Evaluation of Mixed-Initiative Control for Novice Users of a Search and Rescue Robot,”
Proceedings of the IEEE 2004 Conference on Systems, Man & Cybernetics, October 2004.
4) Bruemmer, D., D. Dudenhoeffer and J. Marble, “Dynamic Autonomy for Urban Search and
Rescue,” Proceedings of the AAAI Mobile Robot Workshop, Edmonton, Canada, August 2002.
5) Casey, R., B. Keyes, M Baker and H.A. Yanco, “Designing Interfaces for Remote Robot
Operations”, Unpublished manuscript, University of Massachusetts Lowell, Lowell, MA,
2005
6) Casey, R., A. Chanler, M. Desai, B. Keyes, P. Thoren, M. Baker and Holly A. Yanco, “Good
Wheel Hunting: UMass Lowell's Scavenger Hunt Robot System,” Proceedings of the AAAI-05
Robot Competition and Exhibition Workshop, Pittsburgh, PA, July 2005.
7) Casper, J., "Human-Robot Interactions during the Robot-Assisted Urban Search and Rescue
Response at the World Trade Center," Master's thesis, University of South Florida, 2002.
8) Drury, J. L., B. Keyes and H. A. Yanco, “LASSOing HRI: Analyzing Situation Awareness in
Map-Centric and Video-Centric Interfaces,” Proceedings of the Second Annual ACM/IEEE
Conference on Human-Robot Interaction, March 2007.
9) Drury, J. L., L. D. Riek, A. D. Christiansen, Z. T. Eyler-Walker, A. J. Maggi and D. B. Smith,
“Evaluating Human-Robot Interaction in a search and Rescue Context,” Proceedings of
PERMIS 2003, Sept. 2003.
10) Drury, J. L., J. Scholtz and H. A. Yanco, “Awareness in Human-Robot Interactions,”
Proceedings of the IEEE Conference on Systems, Man and Cybernetics, 2003.
64
11) Endsley, M. R., “Design and Evaluation for Situation Awareness Enhancement,” Proceedings
of Human Factors Society 32nd Annual Meeting, Santa Monica, CA, 1988.
12) Ericsson, K. A. and H. A. Simon, “Verbal Reports as Data,” Psychological Review, Volume 87,
pp 215 – 251, 1980.
13) Hestand, D. and H. A. Yanco, “Layered Sensor Modalities for Improved Feature
Detection,” Proceedings of the IEEE Conference on Systems, Man and Cybernetics, October 2004.
14) Hjelmfelt, A. T. and M. A Pokrant, “Coherent Tactical Picture,” CNA RM, pp 97-129,
Alexandria, Virginia, Center for Naval Analyses, 1998.
15) Howard, A., December 14 2004, “Simple Mapping Utilities,” University of Southern
California, April 15, 2007, <http://www-robotics.usc.edu/~ahoward/pmap/index.html>.
16) Jacoff, A., E. Messina and J. Evans, “A Standard Test Course for Urban Search and
Robots,” Proceedings of the Performance Metrics for Intelligent Systems Workshop, August 2000.
17) Jacoff, A., E. Messina and J. Evans, “A Reference Test Course for Autonomous Mobile
Robots,” Proceedings of the SPIE-AeroSense Conference, Orlando, FL, April., 2001.
18) Jacoff, A, E. Messina and J. Evans, “Performance Evaluation of Autonomous Mobile
Robots,” Industrial Robot, Volume 29, Number 3, May 2002.
19) Keyes, B., R. Casey, H. A. Yanco, B. A. Maxwell and Y. Georgiev. “Camera Placement and
Multi-Camera Fusion for Remote Robot Operation,” Proceedings of the IEEE International
Workshop on Safety, Security and Rescue Robotics, National Institute of Standards and Technology
(NIST), Gaithersburg, MD, August 22-24, 2006.
20) Maxwell, B. A., N. Ward and F. Heckel, “A Configurable Interface and Architecture for
Robot Rescue,” AAAI Mobile Robotics Workshop, San Jose, July 2004.
21) Molich, R. and J. Nielsen, “Improving a Human-Computer Dialogue,” Communications of the
ACM, Volume 33, pp. 338-348, March 1990.
22) Nielsen, C. W., B. Ricks, M. A. Goodrich, D. J. Bruemmer, D. A. Few and M. C. Walton.
“Snapshots for Semantic Maps,” Proceedings of the 2004 IEEE Conference on Systems, Man and
Cybernetics, The Hague, The Netherlands, 2004.
65
23) Nielsen, C. W. and M. A. Goodrich. “Comparing the usefulness of video and map
information in navigation tasks,” Proceedings of the Human Robot Interaction Conference. Salt Lake
City, UT, 2006.
24) Richer, J., J. L. Drury, “A Video Game-based Framework for Analyzing Human-Robot
Interaction: Characterizing Interface Design in Real-time Interactive Multimedia
Applications,” Proceedings of the Human Robot Interaction Conference. Salt Lake City, UT, 2006.
25) Scholtz, J., J. Young, J. L. Drury and H. A. Yanco, “Evaluation of Human-Robot Interaction
Awareness in Search and Rescue,” Proceedings of the IEEE International Conference on Robotics and
Automation, New Orleans, April 2004.
26) Schultz A.C., W. Adams, B. Yamauchi, “Integrating Exploration, Localization, Navigation
and Planning with a Common Representation,” Journal of Autonomous Robots, Volume 6, pages
293-308, June 1999.
27) Thoren, P., Aug. 24, 2006, “Phission :: Concurrent Vision Processing System”, April 15,
2007, <www.phission.org>.
28) Thrun, S., et al., “Stanley: The Robot That Won The DARPA Grand Challenge,” Journal of
Field Robotics, 2006.
29) Yanco, H. A. and J. L. Drury, “‘Where Am I?’ Acquiring Situation Awareness Using a
Remote Robot Platform,” Proceedings of the IEEE Conference on Systems, Man and Cybernetics,
October 2004.
30) Yanco, H. A. and J. Drury, “A Taxonomy for Human-Robot Interaction,” Proceedings of the
AAAI Fall Symposium on Human-Robot Interaction, AAAI Technical Report FS-02-03,
Falmouth, Massachusetts, pp. 111-119, November 2002.
31) Yanco, H. A., J. L. Drury, “Rescuing Interfaces: A Multi-year Study of Human-Robot
Interaction at the AAAI Robot Rescue Competition,” Journal of Autonomous Robots, Volume
22, Number 4, pp. 333-352, May 2007.
32) Yanco, H. A., J. L. Drury and J. Scholtz, “Beyond Usability Evaluation: Analysis of HumanRobot Interaction at a Major Robotics Competition,” Journal of Human-Computer Interaction,
Volume 19, Numbers 1 and 2, pp. 117-149, 2004.
66
33) Yanco, H. A., M. Baker, R. Casey, B. Keyes, P. Thoren, J. L. Drury, D. Few, C. W. Nielsen
and D. Bruemmer, “Analysis of Human-Robot Interaction for Urban Search and Rescue,”
Proceedings of the IEEE International Workshop on Safety, Security and Rescue Robotics, National
Institute of Standards and Technology (NIST), Gaithersburg, MD, August 22-24, 2006.
34) Zalud, L, “Argos – System for Heterogeneous Mobile Robot Teleoperation,” Proceedings of the
2006 IEEE RSJ International Confderence on Intelligent Robots and Systems, October 9 – 16,
Beijing, China, 2006.
67
APPENDIX A
The design of the USAR robot system was a group effort: many people put many hours into
various aspects of its design. This section is meant to give credit to those that helped in some
way with this robot system. The section is organized into three categories of help: (1) Data
gathering in experiments, (2) Robot hardware and backend programming and (3) Interface
design and programming.
A.1 Data Gathering in Robot Studies
Many people helped make all of the studies described in this thesis happen. The tables below
list who the test administrators were, as well as the people that helped videotape and map the
paths of the robots and mark critical incidents.
A.1.1 Previous Studies
Table 5***** lists the people that helped capture the data for the three AAAI studies cited in
Yanco et al. [2004] and Scholtz et al. [2004].
Table 5: List of people that assisted with studies discussed in the Drury, Scholtz, Yanco citations.
Test
Administrators
Jean Scholtz
Holly Yanco
Videotapers and
Mappers
Michael Baker
Philip Thoren
AAAI-03
Jean Scholtz
Holly Yanco
Michael Baker
Robert Casey
Brenden Keyes
Philip Thoren
AAAI-04
Jil Drury
Holly Yanco
Robert Casey
Marbella Duran
Brenden Keyes
Rachael Mulcrone
Study
AAAI-02
68
A.1.2 Our Interface Studies
There were four studies that were conducted on the interface versions presented in this thesis
work. The first two and the last one were conducted at UMass Lowell, while the third one was
conducted at the National Institute of Standards and Technology (NIST) in Gaithersburg, MD.
Personnel from these studies are listed in Table 6***I*.
Table 6: People who helped with the many studies we performed during the evolution of our interface design.
Study
Test Administrator
Brenden Keyes
Interface v1.0
Study 1
Brenden Keyes
Interface v1.0
Study 2
Interface v2.0
Usability
Study
Videotapers and
Mappers
Michael Baker
Robert Casey
Munjal Desai
Philip Thoren
Michael Baker
Robert Casey
Andrew Chanler
Munjal Desai
Philip Thoren
Jill Drury
Holly Yanco
Michael Baker
Robert Casey
Brenden Keyes
Philip Thoren
Brenden Keyes
Andrew Chanler
Munjal Desai
Mark Micire
Kate Tsui
Interface v3.0
Study
69
A.2 Robot Hardware and Software
The ATRV-JR robot went through many changes during the course of this research. Michael
Baker andrew Chanler and Philip Thoren all had a hand in upgrading it, as well as programming
it.
A.2.1 Hardware
The robot hardware was kept in working order mainly by Michael Baker. He also had a large
part in upgrading the robot’s internal computer from a Pentium III to a Pentium IV. This task
involved ordering and installing a custom power supply unit capable of running the more
powerful computer. Michael Baker was also involved with installing various sensors on the
robot, including the extra video camera, the CO2 sensor and original FLIR camera.
Andrew Chanler also helped add many of the sensors to the robot. His “SerialSense” board was
installed on the robot (http://www.cs.uml.edu/~achanler/robotics/serialsense/). This board
currently controls many of the sensors on the robot, including the lighting system and the CO2
sensor. This board is also used to send the “Power On” command to boot the robot’s
computer.
Philip Thoren added the lighting system to the robot using the cold cathode tubes.
A.2.2 Software
Much work was done on the robot’s software. This work included patching iRobot’s Mobility
software and fixing a bug with the SICK laser server. This software also includes all the
autonomy modes and interface parts, such as the command protocol, on the robot side of the
system.
Philip Thoren did all the work of getting Mobility to compile on the upgraded Pentium IV
computer. He also wrote service start and stop scripts for the robot that would correctly start
and stop various servers, such as the laser LMS server, the sonars and cameras.
Originally we used the Java Media Framework (JMF) to send video to the interface via the Real-
70
time Transfer Protocol (RTP). Robert Casey and I implemented the JMF on the robot. Philip
Thoren installed his project, called Phission, on the robot to replace the JMF. Using Phission it
was possible to perform advanced video editing techniques, such as overlaying the FLIR camera
stream on the video stream [Thoren, 2007]. Phission also sent its images via RTP, so the
interface could still use the JMF on its end.
The original command protocol and autonomy modes came from INL. Over the years, Michael
Baker added commands to the command protocol as more sensors were added. He and
Andrew Chanler also rewrote the INL autonomy modes to enhance their abilities. They also
created a subsumption-like architecture that can combine multiple robot behaviors. They also
made it so that the robot can send the interface a list of autonomy modes currently available.
The user can then select from this list of autonomy modes on a drop-down menu on the
interface [Casey, Chanler et al., 2005]. I implemented the drop-down menu on the interface, but
this menu does not relate in a large part to this research.
The first mapping package we used on the robot, WAX from NRL, was installed and worked on
by Robert Casey [Schultz, 1999]. He made it so the map was created into a PNG image file and
then copied to the computer the interface was running on. This file was then displayed by the
interface. After the second study of version 1.0, we moved to the PMap package out of USC.
[Howard, 2004] This package was installed and worked on by Andrew Chanler. The map image
was sent to the interface as a video stream via Phission.
Robert Casey also set up the pan/tilt/zoom controls for the cameras.
The only thing I did on the robot end of the project was to create a way to filter out spurious
readings from the sonar data. This algorithm uses a windowed approach, comparing the last X
number of readings. It drops the maximum and minimum values and returns the average of the
rest.
71
A.3 The Interface
The interface is where I did the majority of my work. Just about everything on the interface was
created and added by me. However, there are a few things that I had help with or did not take
part in.
A.3.1 Prototype
The layout of the prototype was done by me. Robert Casey and Holly Yanco had input as to
how things should be laid out, but I created the mock up.
A.3.2 Version 1.0
The data store architecture, as well as the layout of all the version of the interface was done by
me. However, the architecture used to trap incoming packets and send them to the correct store
was created by Robert Casey.
Robert Casey also created the ability to control the pan/tilt/zoom controls of cameras through
the interface. He also created the way to display the image of the map on the map panel by
continuously reading a temporary file that was being rewritten constantly by the robot.
The positioning of the rear view camera panel, as well as its mirror effect was completed by me.
Both Robert Casey and I worked on overlaying the crosshair on the main video screen. Robert
also created the brake icon and had it display over the main video display if the robot’s brake
was active.
Automatic direction reversal (ADR) mode was conceived by Michael Baker, Robert Casey and
me. It was implemented on the interface solely by me.
The layouts of the panels were all designed by me. Some of the icons, though, were created by
Rachael Mulcrone. These icons include the mode panel’s buttons, the panel icons (this version
only) and the speed and battery indicators on the status panel.
The suggestion panel layout and functionality were created and implemented by me. The robot
72
icon
for
the
suggestion
panel
was
found
on
the
internet
at
http://forums.macmerc.com/phpBB2/images/avatars/gallery/ikonboard/IconFactory5_robot.
gif.
A.3.3 Version 2.0
This version was in development when we started to use Phission on the robot end of the
system. Phil Thoren, Michael Baker and Andrew Chanler all were responsible for getting the
transmitted video to display correctly in the interface.
This version also introduced the new mapping package, Pmap. Andrew Chanler, Michael Baker
and Phil Thoren again were responsible for getting the map to be displayed correctly on the
interface. Andrew Chanler created the “zoom mode” feature and added in the ability to toggle
to it via the interface.
The distance panel changed to the perspective view with the colored boxes. I implemented this
using JOGL, which are OpenGL bindings for Java. All the functionality associated with it, such
as its rotation, its ADR animation and when to change colors, was done by me.
The CO2 sensor was also added in this version. The associated data store, as well as its panel on
the interface, was implemented solely by me as well.
I made the choice to move the video to the center of the screen in response to the new distance
panel as well. In doing so, I moved the map to the left and put the CO2 panel on the right.
A.3.4 Version 3.0
The only major change in version 3.0 was the distance panel. It was implemented solely by me
as well. Also, due to the size of this new distance panel, I moved the mode bar to the top of the
interface instead of the bottom.
73