1
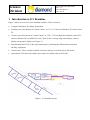
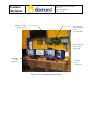
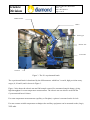
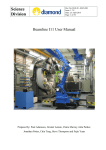
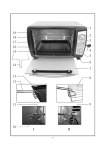
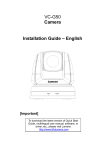
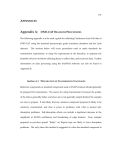
Doc No: BLS-I11-MAN-001 Issue: 1.5 Date: 09 Feb 2011 Page: 1 of 47 Science Division Beamline I11 User Manual Prepared by: Alistair Lennie, Julia Parker, Chiu Tang, Steve Thompson, and Fajin Yuan Doc No: BLS-I11-MAN-001 Issue: 1.5 Date: 09 Feb 2011 Page: 2 of 47 Science Division Contents 1 Introduction to I11 Beamline .............................................................................................................4 1.1 Scope of this document ...................................................................................................................8 1.2 Related documents ..........................................................................................................................8 2 Safety issues ......................................................................................................................................9 3 Sample environment options ...........................................................................................................10 3.1 Sample alignment..........................................................................................................................11 3.2 Sample spinners and holders .........................................................................................................12 3.3 Cryostream (80 – 500K) ...............................................................................................................13 3.4 Cyberstar hot air blower (RT – 1000C) ........................................................................................14 3.5 PheniX cryostat (11 – 295K) ........................................................................................................15 3.6 Cryostat (5 – 295K) ......................................................................................................................19 3.7 Humidity chamber.........................................................................................................................19 3.8 Capillary furnace (RT – 1500K) ...................................................................................................20 3.9 Flat plate furnace (RT – 1700K) ...................................................................................................20 4 Controlling the instrument ...............................................................................................................20 4.1 First steps ......................................................................................................................................20 4.2 The synoptic window ....................................................................................................................22 4.3 GDA Commands ...........................................................................................................................29 5 Constant Velocity Scanning Commands (MAC data collection) ....................................................32 5.1 Constant velocity scan (cvscan) ....................................................................................................32 6 Step Scanning Commands ...............................................................................................................33 7 PSD Data Collection ........................................................................................................................34 7.1 Data Collection .............................................................................................................................34 8 Robotic Arm and carousel ...............................................................................................................36 8.1 Manual Sample Change Commands .............................................................................................36 8.2 Multiple sample scans ...................................................................................................................37 9 Sample environment control commands .........................................................................................39 9.1 Fast Temperature Scanning ...........................................................................................................39 9.2 Oxford Cryostream .......................................................................................................................40 9.3 Cyberstar Hot-Air blower .............................................................................................................40 Science Division Doc No: BLS-I11-MAN-001 Issue: 1.5 Date: 09 Feb 2011 Page: 3 of 47 9.4 PheniX cryostat operation .............................................................................................................41 10 Writing and running scripts..........................................................................................................42 11 Data Handling ..............................................................................................................................44 11.1 Data Directories and Subdirectories ...........................................................................................44 11.2 Automatic processing of MAC data............................................................................................45 11.3 Rebinning MAC data ..................................................................................................................45 11.4 Data Processing - PSD data ........................................................................................................45 12 Data Plotting ................................................................................................................................46 13 Troubleshooting ...........................................................................................................................47 Doc No: BLS-I11-MAN-001 Issue: 1.5 Date: 09 Feb 2011 Page: 4 of 47 Science Division 1 Introduction to I11 Beamline Figure 1 shows an overview of the beamline facilities. These consist of A support laboratory for sample preparation. Training room (also known as Control Cabin 1 or CC1). CC1 has two Windows PCs and a Linux PC. Control room (also known as Control Cabin 2 or CC2). CC2 has duplicate beamline control PCs and two Windows PCs available for users. There is also a storage ring status display, camera display and synoptic display (see Figure 2). Experimental hutch. This is the experimental space containing the diffractometer and other ancillary equipment. Control racks. These contain beamline electronics and are accessible only to DLS staff. Optics hutch. This houses beamline optics and is accessible only to DLS staff. Figure 1 I11 beamline layout Science Division Doc No: BLS-I11-MAN-001 Issue: 1.5 Date: 09 Feb 2011 Page: 5 of 47 Beamline synoptic display (see 4.2) Fixed webcams. 2 in experimental hutch, 2 in optics hutch Display showing status of DLS storage ring Control PC ws-002 (2 monitors) Control PC ws-001 (2 monitors) Figure 2 View of beamline control cabin Doc No: BLS-I11-MAN-001 Issue: 1.5 Date: 09 Feb 2011 Page: 6 of 47 Science Division Diffractometer MACs Beam pipe Robotic arm XYZ table Carousel Figure 3 The I11 experimental hutch The experimental hutch is dominated by the diffractometer which has 3 coaxial, high precision rotary stages (, 2 and ) and is shown in Figure 3. Figure 3 also shows the robotic arm and 200 sample carousel for automated sample change, giving high throughput for room temperature measurements. The robotic arm can also be used with the Cryostream and hot-air blower. For room temperature measurements (capillary or flat plate) a spinner is mounted on the circle. For non-contact variable temperature techniques the ancillary equipment can be mounted on the (large) XYZ table. Doc No: BLS-I11-MAN-001 Issue: 1.5 Date: 09 Feb 2011 Page: 7 of 47 Science Division MAC arm (1 of 5) beampipe Si111 crystals (x9) Sample stage Figure 4 Close-up of MAC detector array Each of 5 MAC consists of 9 Si crystals giving a total of 45 crystals. Full 2 scan 3 – 150 degrees achieved by 40 degrees of motion, with overlap between detectors. Data from total of 45 detectors is integrated to produce final pattern. I11 is designed to operate in Constant Velocity trajectory mode. The user specifies the total count time and the diffractometer motion trajectory is calculated to give a constant 2 angular speed. Unless specified in advance the I11 optics will be set up to use the maximum X-ray flux at 15keV (about 0.827Å). A beamline scientist will determine the precise wavelength at the beginning of the experiment using a standard silicon sample. Science Division Doc No: BLS-I11-MAN-001 Issue: 1.5 Date: 09 Feb 2011 Page: 8 of 47 1.1 Scope of this document This is a guide for users of DLS beamline I11. Its contents are restricted to aspects of the hardware and software that users need to know in order to collect high quality data from the I11 beamline. It will be updated in line with beamline developments. New users are strongly recommended to read this document before the start of their experimental time. Chapter 2 describes essential safety issues. Chapter 3 describes basic operations for the various sample environment options including loading and unloading of samples. Chapters 4-7 describe the software and commands (graphical and text) used to control and collect data from the diffractometer. Chapter 8 describes how to use the robot arm and carousel to change samples automatically. Chapter 9 describes the commands used to control the sample environment options. Chapter 11 gives a summary of the data handling protocol used with the I11 beamline. Chapter 13 is a troubleshooting guide. 1.2 Related documents Diamond User Office: Welcome. SCI-SAD-0008 Computing Services for Diamond Users. Beamline I11 technical papers: [1] “Design of powder diffraction beamline (BL-I11) at Diamond”, C C Tang, S P. Thompson, T P Hill, G R Wilkin, U H Wagner, Z. Kristallogr. Suppl. 26 153-158 (2007). [2] “A new instrument for high resolution powder diffraction”, S P Thompson, J E Parker, J Potter, T P Hill, A Birt, T M Cobb, F Yuan and C C Tang, Rev. Sci. Instrum. 80 075107 (2009) Science Division Doc No: BLS-I11-MAN-001 Issue: 1.5 Date: 09 Feb 2011 Page: 9 of 47 2 Safety issues All users are required to attend a Safety induction provided via the User Office before using the beamline. This will cover safety issues and procedures applicable throughout Diamond Light Source. The I11 beamline staff or Experimental Hall Coordinators will provide Beamline induction Personnel Safety System (PSS) training The beamline induction will describe the location of the nearest fire exit the location of the emergency motor stop the location of oxygen depletion monitor beamline specific safety information A set of staff telephone numbers is located close to every telephone in case of any problems. For out of hours support please control the Experimental Hall Coordinators (ext. 8787) or the Control Romm (ext. 8899) No user is permitted to work inside the experimental hutch unless trained by Beamline staff or the Experimental Hall Coordinators. Doc No: BLS-I11-MAN-001 Issue: 1.5 Date: 09 Feb 2011 Page: 10 of 47 Science Division 3 Sample environment options There are a number of sample environment options available, depending on the temperature range required for measurements. Temperature control commands are described in chapter 9. Temperature range Name Capillary Spinner Notes Sample change with robot arm available Flat plate spinner 80 – 500 K Oxford Cryostream For use with capillary spinner. Can be used with the robot for automated sample changes. RT – 1000 °C Cyberstar hot air For use with capillary spinner. Can be used (295 – 1273 K) blower with the robot for automated sample changes. Temperature control less precise below 250C. RT – 1500°C STOE capillary (295 – 1773 K) furnace RT – 1700 °C Flat plate furnace (295 – 1973 K) 11 – 295 K PheniX cryostat Closed cycle cooler. Allow at least 3 hours to change samples. 5 – 295 K 4K Cryostat Closed cycle cooler. 1 beamtime shift to set up and cooldown. Allow 1 day per sample. 22 – 90 °C Humidity chamber (295 - 363 K) -190 – 600 °C Linkam DSC Table 1 Sample environment options Doc No: BLS-I11-MAN-001 Issue: 1.5 Date: 09 Feb 2011 Page: 11 of 47 Science Division 3.1 Sample alignment Two cameras with built-in cross hairs are positioned inside the experimental hutch to allow users to check their sample alignment (Figure 5). The monitors are located on the back inside wall of the experimental hutch, adjacent to the door to CC2. Cross hairs Cross hairs Figure 5 Images from sample alignment cameras Science Division Doc No: BLS-I11-MAN-001 Issue: 1.5 Date: 09 Feb 2011 Page: 12 of 47 3.2 Sample spinners and holders Both capillary and flat plate room temperature sample holders fit directly to magnetic spinners mounted at the centre of the circle face plate. The sample holders are magnetic. 3.2.1 Capillary spinner Capillary sample. Upper brass body. This screws on to the lower brass body. Lower brass body with internal magnetic body. This fits to the diffractometer. Doc No: BLS-I11-MAN-001 Issue: 1.5 Date: 09 Feb 2011 Page: 13 of 47 Science Division Flat plate. Perspex holder Lower brass body with internal magnetic body. This fits to the diffractometer. 3.3 Cryostream (80 – 500K) Dry air supply (shield gas) Liquid nitrogen supply line Gas nozzle Figure 6 Cryostream The Cryostream will be set up by DLS staff on the large sample table and all ancillary equipment connected. For manual sample changes Mount sample capillary on standard sample holder Execute pos tlx 300 command (or use control window Figure 16) to move large table out of position , allowing access to diffractometer Science Division Doc No: BLS-I11-MAN-001 Issue: 1.5 Date: 09 Feb 2011 Page: 14 of 47 Place sample on diffractometer Execute pos tlx 0 command (or use control window Figure 16) to move large table, with Cryostream, back into position Execute spin.on()command in GDA to switch on sample spinner (section 4.3.4). Or use the Enable/Disable button on the EPICS screen Set temperature as described in section 9.1 Beware of hot or cold gas jet from Cryostream nozzle when changing samples. 3.4 Cyberstar hot air blower (RT – 1000C) The hot air blower will be set up by DLS staff on the large sample table and all ancillary equipment connected. Manual sample changing is as for the cryostream described above (section 3.3). Temperature control is described in section 9.3 Use quartz capillaries for temperatures above 650C. Doc No: BLS-I11-MAN-001 Issue: 1.5 Date: 09 Feb 2011 Page: 15 of 47 Science Division Protective cover Hot air blower Figure 7 Hot air blower (with protective cover in position) Even with the protective cover, users should take care when changing samples if the hot air blower is ON. 3.5 PheniX cryostat (11 – 295K) The cryostat will be set up by DLS staff on the diffractometer and all necessary ancillary equipment connected. Mount your sample capillary on to the PheniX brass sample holder as shown in Figure 8. Use a small amount of vacuum grease to secure the capillary, if necessary. Aluminium capillaries are available and improve thermal contact. Fit sample holder to the cold stage of the PheniX cryostat. There are 2 grub screws that lock it into place Check sample alignment (Figure 8) Fit the first cover and tighten the 4 screws holding it in place Fit the outer cover as shown in Figure 9 and close the 4 clips to hold it in place. Doc No: BLS-I11-MAN-001 Issue: 1.5 Date: 09 Feb 2011 Page: 16 of 47 Science Division Camera cross-hairs Sample capillary Maximum length 40mm, different diameters Sample capillary possible side view top view Figure 8 Sample holder for PheniX cryostat Outer cover fitted into position Sample holder in position on cold stage Clips (4) for securing outer cover Figure 9 Views of PheniX cryostat in position on diffractometer left - both covers removed, right - both covers fitted Doc No: BLS-I11-MAN-001 Issue: 1.5 Date: 09 Feb 2011 Page: 17 of 47 Science Division Switch on vacuum diaphragm pump connected to the cryo-seal On first use, it is necessary to briefly pump with the gas ballast valve open. Pull and twist the sleeve DOWN to open (see Figure 10), leave for 10 minutes then pull and twist the sleeve UP to close. This cryo-seal pump remains ON throughout the experiment . Check that the vent valve on the side of turbo station is closed Switch on the turbo pumping station to pump out the sample space. Open the gas ballast valve as required (usually approx 10 minutes only). The turbo will accelerate to 1500Hz over the next few minutes. Figure 10 shows the turbo controller display. Display ON/OFF Mains ON/OFF Figure 10 Pumping set used with PheniX cryostat (front view) Doc No: BLS-I11-MAN-001 Issue: 1.5 Date: 09 Feb 2011 Page: 18 of 47 Science Division The PheniX cryostat is ready for use when the pressure has fallen below about 10-4 mbar. This will take up to 90 minutes for first use and typically 45 minutes thereafter. Switch on the controller. Initialise by pressing the Start button, or by using the pcs.start()command (see 9.4) Set start temperature for experiment (see 9.4) Gas ballast valve on turbo backing pump Vent valve Twist knurled ring and raise to close gas ballast valve Twist knurled ring and lower to open gas ballast valve Gas ballast valve on Cryoseal pump Figure 11 Pumping set for PheniX cryostat (rear view) To change your sample the cryostat must be fully warmed to room temperature and the vacuum released, see instructions below. Once the data collection is completed, in the cryostat controller window select . The “PhaseID” changes to Warm. This will heat the cryostat to 300K and hold this temperature for half an hour to rmove any water from the system. After 30min the “Run mode” indicates “Shutdown Science Division Doc No: BLS-I11-MAN-001 Issue: 1.5 Date: 09 Feb 2011 Page: 19 of 47 OK”. For a view of the complete window see Figure 19. To run this from a scripts use the command pcs.purge(). Switch off the turbo pump using the mains on/off button (Figure 10). Once the turbo speed is below 200Hz slowly open the black vent valve shown in Figure 10. Do not vent the system until the system is fully warm and the turbo pump has completely stopped. Failure to do this risks damaging the cryocooler and the pump. Release the 4 clips and remove the outer cover Loosen but do not remove the 4 screws holding the inner cover in place. Slide the inner cover off. Loosen 2 grub screws and remove sample holder with sample 3.6 Cryostat (5 – 295K) Details to be added. 3.7 Humidity chamber Details to be added. Doc No: BLS-I11-MAN-001 Issue: 1.5 Date: 09 Feb 2011 Page: 20 of 47 Science Division 3.8 Capillary furnace (RT – 1500K) Details to be added. 3.9 Flat plate furnace (RT – 1700K) Details to be added. 4 Controlling the instrument All control takes place using two Linux control PCs (ws-001 and ws-002) in the control cabin. Each PC duplicates the other. 4.1 First steps All users need to log in to the data acquistion software (GDA) as follows: Log on to a linux control PC using your FedID and password ( supplied by the User Office) (using menu bar) Applications | Data Acquisition | 1. start GDA log display This starts a log file which will run continuously. (using menu bar) Applications | Data Acquisition | 2. start GDA servers This restarts the GDA servers to load your user visit information (using menu bar) select OK. Applications | Data Acquisition | start GDA Client This starts the GDA client window (Figure 12Figure 12 GDA client display Science Division Doc No: BLS-I11-MAN-001 Issue: 1.5 Date: 09 Feb 2011 Page: 21 of 47 Main Terminal window Script Editor window Command line Commands for controlling scripts and operating the shutter Data display window Figure 12 GDA client display Doc No: BLS-I11-MAN-001 Issue: 1.5 Date: 09 Feb 2011 Page: 22 of 47 Science Division 4.2 The synoptic window From a Linux terminal window type launcher then select |Beamlines|I11 powder diffraction to display the synoptic window (Figure 13). As the name suggests, this window provides a synopsis or summary of the beamline topology and hardware from the storage ring to the diffractometer. The user need be concerned only with parts of the information presented. These are indicated by and described in more detail in the remainder of this section. Vacuum system Beamline hardware I11 diagnostics Storage ring information Figure 13 The synoptic window for I11 Doc No: BLS-I11-MAN-001 Issue: 1.5 Date: 09 Feb 2011 Page: 23 of 47 Science Division 4.2.1 Webcam controls Webcams are labelled WB1…WB11. Five webcams are located in the experimental hutch, 2 are fixed and permanently displayed in the control cabin (Figure 2). Double click the required WB icon in the synoptic view to open the corresponding webcam window Figure 14 Typical webcam image - webcam 1 WB1, WB10 and WB11 can be further controlled by the user Use the controls at the bottom of the display to pan and zoom. Doc No: BLS-I11-MAN-001 Issue: 1.5 Date: 09 Feb 2011 Page: 24 of 47 Science Division Click to open a further menu. This includes the option of removing the red cross marking the centre of the image and to switch on the auto focussing. 4.2.2 Diffractometer motors Select to open a window for direct control of some of the diffractometer motors (Figure 15) Nudge motor position UP 1 step Current motor position To change motor position enter new value Nudge motor position DOWN 1 step Figure 15 Diffractometer motor control window Step size Doc No: BLS-I11-MAN-001 Issue: 1.5 Date: 09 Feb 2011 Page: 25 of 47 Science Division DO NOT move the vertical jacks or the X translation - you will mis-align the diffractometer! Care must be taken when moving 2 and to avoid collision (anti-collision switched are in place) 4.2.3 Large sample table Select to open a window for direct control of the position of the large sample table. To change motor position enter new value (mm) Nudge motor position DOWN 1 step Horizontal X direction Kills power to motor Nudge motor position UP 1 step Current Position Step Size Figure 16 Motor control for large sample table. Users should only make adjustments to the Horizontal Motor 300 = Table OUT 0 = Table IN Doc No: BLS-I11-MAN-001 Issue: 1.5 Date: 09 Feb 2011 Page: 26 of 47 Science Division 4.2.4 Sample environment options Select Select the appropriate option for your experiment to open another window. These are provided for to open a window for control of the sample environment options (Figure 17). reference as Figure 18 and Figure 19 but will not be discussed further as users normally control temperature from scripts using GDA. Oxford Cryostream Hot air blower 11-300K cryostat Enable/disable sample spinner Figure 17 Sample environment options Set spin speed The hot air blower, capillary furnace and flat plate furnace all use Eurotherm controllers similar to Figure 18. Science Division Doc No: BLS-I11-MAN-001 Issue: 1.5 Date: 09 Feb 2011 Page: 27 of 47 Figure 18 Eurotherm controller window (for hot air blower, capillary and flat plate furnaces) The Cryostream and PheniX cryostats use an Oxford Cryosystems controllers similar to Figure 19. Science Division Doc No: BLS-I11-MAN-001 Issue: 1.5 Date: 09 Feb 2011 Page: 28 of 47 Figure 19 Oxford Cryosystems controller window (for PheniX and Cryostream) Doc No: BLS-I11-MAN-001 Issue: 1.5 Date: 09 Feb 2011 Page: 29 of 47 Science Division 4.3 GDA Commands Note that: some commands are case sensitive there is no syntax check where a parameter is enclosed in round brackets, as (parameter), the brackets are an essential part of the command syntax. There is no space before the first bracket. where a parameter (or other option) is enclosed in square brackets, as [parameter], the brackets should be omitted in the final command commands should be typed into a single line even when examples extend over more than 1 line. 4.3.1 Generic commands sleep(time) Pause all GDA activities for the specified time in seconds - to be used in a script if a wait time is required sleep(300) Pause all GDA activity for 300 seconds (perhaps to allow temperature stabilisation) 4.3.2 Experimental hutch shutter Open the experimental hutch shutter by clicking the ehshutter Open button in the GDA window. Close the shutter by clicking the Close button. Indicates shutter status on beamline synoptic. Doc No: BLS-I11-MAN-001 Issue: 1.5 Date: 09 Feb 2011 Page: 30 of 47 Science Division 4.3.3 Fast shutter There is a fast shutter embedded in the beamline after the last ion chamber. This is to protect radiation sensitive samples from unnecessary exposure when not collecting data. This is linked in to data collection so should open and close automatically at the beginning and end of data collection. The commands below can be used to open and close the fast shutter at other times, eg. to take a ‘burn’ of the beam position during experimental alignment and set-up. pos fastshutter “OPEN” pos fastshutter “CLOSE” 4.3.4 Sample spinner spin.on() Turn on the sample spinner. spin.off() Turn off the sample spinner spin.setspeed(speed) Set (or change) the spin speed. spin.setspeed(35) Set spin speed to 35% of maximum. spin.getSpeed() Returns the current spin speed. 4.3.5 Beam monitor The beam monitor command monitors the value of the ion chamber Ic4. If Ic4 falls below a threshold value this means there is no X-ray beam, because the shutter is closed or the synchrotron has lost beam. The scan will pause and the warning message SCAN PAUSED.WAITING FOR BEAM ON will appear in the GDA window. When beam is restored step scan will resume. constant velocity trajectory scan will stop and restart from the beginning. bm.on() Turn on the beam monitor facility bm.off() Turn off the beam monitor facility bm.isMonitorOn() Is the beam monitor on? 1 = yes, 0 = no Doc No: BLS-I11-MAN-001 Issue: 1.5 Date: 09 Feb 2011 Page: 31 of 47 Science Division 4.3.6 Controlling Position Motors The command syntax is identical for all motors. A code is used to distinguish between motors as follows: Diffractometer -circle Diffractometer 2-circle (MACs) tth Diffractometer -circle (PSD) delta sample X position (across the beam) spos large table X position (across the beam) tlx (sample) theta A number of general commands are available to control the motors. pos [motor] Read and return the position of a motor pos tth Read and return the position of the 2 circle pos [motor] [requested value] Move the motor to the requested value pos tth 10 Move the 2 circle motor to 10 degrees spos [value] Move the sample position (allowed range 20 to +5 mm) If you move the sample with the spos command, use the appropriate camera to ensure that the sample is still in the beam. spos 0 Move sample to default position. (beam hits sample 10mm from end of brass holder) spos -20 Move the sample so that the beam is 10 + 20 = 30mm from end of brass holder spos 5 Move the sample so that the beam is 10 – 5 = 5mm from end of brass holder Doc No: BLS-I11-MAN-001 Issue: 1.5 Date: 09 Feb 2011 Page: 32 of 47 Science Division pos tlx 0 Move the table to location close to diffractometer pos tlx 300 Move table 300mm away from diffractometer Moving the large table towards and away from the diffractometer provides a convenient way to move variable temperature equipment out of the way to change samples. See examples in sections 3.3 and 3.4. 5 Constant Velocity Scanning Commands (MAC data collection) 5.1 Constant velocity scan (cvscan) The user specifies only the total time for the scan (seconds). A motion trajectory is calculated so that the diffractometer 2 circle moves at a constant angular speed. The detectors are gated at sufficient frequency to give a nominal 2 interval of 1 mdeg. cvscan(time) Perform constant velocity scan. cvscan(1800) Perform 2 cvscan with a total counting time of 30 minutes scan ds 1 3 1 cvscan 1800 Perform 3 2 cvscans with a counting time of 30 minutes each. Doc No: BLS-I11-MAN-001 Issue: 1.5 Date: 09 Feb 2011 Page: 33 of 47 Science Division Constant velocity scanning of 2 and spos To be added Constant velocity scans with sample stage translation motor (stagescan) To be added Constant velocity scan with theta rocking In use, the PheniX cryostat (11 – 300K) is mounted on the theta circle of the diffractometer. This can be oscillated during a 2 scan by appending rocktheta at the end of a scan command 6 Step Scanning Commands Single motor or step scan (scan) scan [motor] [start] [finish] Move the motor from [start] to [finish] in [stepsize] [detector] [count steps, allowing the [detector] to count for time] [count time] seconds at each motor position scan tth 10 20 0.005 Io 2 Scan 2 from 10 to 20 in steps of 0.005, allowing Io to count for 2 seconds at each motor position Concurrent multi-motor scans scan [motor1] [start1] Scan [motor 1] from [start1] to [finish1] in [finish1] [step1] [motor2] steps of [step1, simultaneously with motor 2 [start2] [step2] [detector] etc collecting data at each point for [count [count time] time] seconds. scan tth 10 30 0.002 theta 5 Scan - 2 concurrently, starting at 10, 0.001 mac15 1 finishing at 30, with steps of 0.001, 1 second per step, using the MAC15 detector. Doc No: BLS-I11-MAN-001 Issue: 1.5 Date: 09 Feb 2011 Page: 34 of 47 Science Division Multi-motor nested or grid scans scan [motor1] [start1] [end1] Perform a grid of scans using [motor1] from [step1] [motor2] [start2] [start1] to [end1] in steps of [step1] and [end2] [step2] [detector likewise [motor2]. Collect data for [time] at name] [time] each point using [detector] scan tth 10 30 0.002 theta 5 Perform a grid of scans. 2 moves from 10 10 0.001 mac15 1 to 30 in 0.001 steps. At each 2, moves from 5 to 10 in steps of 0.001. Detector MAC15 records intensity for 1 second at each point. 7 PSD Data Collection Before using the PSD (Mythen detector) from GDA the NewMythenII GUI must be started in order to load the trimbits to the detector modules and set the correct thresholds. A beamline scientist will do this for you. The fast shutter is opened at the beginning of any scan and closed at the end to protect sample from beam damage. 7.1 Data Collection A file 12345.dat is created listing the frame number and corresponding mythen data file for each frame. Data for multiple frames has the same file number but with an extension indexing mythen and the frame number eg. 12345-mythen-0001.dat psd t collects one frame (exposed for t seconds) psd 1 1 frame of 1 sec exposure psd t n collects n frames (exposed for t seconds each) psd 1 10 10 frames of 1 sec each Doc No: BLS-I11-MAN-001 Issue: 1.5 Date: 09 Feb 2011 Page: 35 of 47 Science Division psdrt 10 A 10 sec psd data collection with the theta circle rocking scan delta [angle1] [angle2] Collects data for one frame at angle1 and [anglestep] mythen t one frame at angle 2. Two .dat files will be written to your data directory eg. 12345mythen-0001.dat and 12345-mythen- 0002.dat. Using the object smythen in place of mythen means the 2 files will sunsequently be summed and the merged data file also saved, 12345-mythen- summed.dat scan delta 5 5.25 0.25 smythen 1 Collects one frame (of 1 second) at 5 degrees and a second frame at 5.25 degrees. Then sums the frames scan delta 5 5.25 0.25 mythen 1 Collects one frame (of 1 second) at 5 degrees and a second frame at 5.25 degrees. scan [tempdevice] [start T] A temperature scan can be called to collect [end T] [T step] ds 1.0 n 1.0 multiple frames with the PSD over a range mythen t scan ocs of temperatures. 200 300 10.0 1.0 mythen t 5 ds 1.0 Cryostream scan [ocs] changing temperature from 200 to 300K in 5K steps, collecting 10 frames of 1 sec at each temperature Note that the number of frames you wish to collect at each temperature needs to be written with a decimal place, ie 10.0 not 10 The file number 12345.dat for this scan will contain 3 columns, listing the temperature, frame number (at that T) and PSD data file. Doc No: BLS-I11-MAN-001 Issue: 1.5 Date: 09 Feb 2011 Page: 36 of 47 Science Division For faster temperature scanning with the psd see section 9.1. 8 Robotic Arm and carousel The robotic arm and carousel are identified (in blue) in Figure 3. Each of 4 carousel trays can hold 50 samples (200 total). Every 5th location is numbered. The robotic arm is interlocked with the experimental hutch door so will not operate unless the hutch has been searched and locked. The user has complete freedom when loading the carousel but is responsible for recording where samples are! The marked area of the large table must remain totally clear otherwise the robot arm could be obstructed or cause damage. 8.1 Manual Sample Change Commands Use these commands to insert and remove individual samples from the diffractometer sample stage. The following commands must be run before any use of the robot. sample.start() Switch on the robot servo. sample.recover() Check for the presence of a sample on the diffractometer. Remove any sample present and place in the recovery tray on the carousel stand. You must also use the sample.start()and sample.recover() commands to initialise the robot following an emergency stop or opening of the hutch door. Doc No: BLS-I11-MAN-001 Issue: 1.5 Date: 09 Feb 2011 Page: 37 of 47 Science Division sample.stop() Stop robot and switch off server pos sample [samplenumber] Pick up sample from location [samplenumber] on carousel and place on diffractometer. sample.clearSample() Pick up sample from spinner and replace in original position on carousel. sample.finish() Switch off the robot. 8.2 Multiple sample scans In this mode the robotic arm picks up a sample from the carousel and places it on the diffractometer performs a cvscan removes the sample and returns it to the carousel. The sample start and recover commands must be run before the scan is started scan sample [firstsample] [last Perform 2 cvscan for the sample] [step] cvscan [time] specified [time] for every [step]th sample between [firstsample] and [lastsample] scan sample 1 21 1 cvscan 1800 Perform 30 minute 2 cvscan on every sample between 1 and 21. Multiple sample scans with sample position translation for each sample scan sample [firstsample] Perform a cvscan for samples [firstsample] Doc No: BLS-I11-MAN-001 Issue: 1.5 Date: 09 Feb 2011 Page: 38 of 47 Science Division [lastsample] [samplestep] to [lastsample] at each position from spos [startpos] [endpos] [startpos] to [endpos] in steps of [posstep], [posstep] cvscan [time] with 2theta [start], counting for [time] at each position Robot error codes If the robotic arm fails an error code will be reported in the terminal panel. Use this to help beamline staff identify the problem. The most common error codes are: 2010 diffractometer move not completed 2450 interlock problem 3540 Robot interlock key missing 2070 servo not active Doc No: BLS-I11-MAN-001 Issue: 1.5 Date: 09 Feb 2011 Page: 39 of 47 Science Division 9 Sample environment control commands Command syntax is identical for all variable temperature options (with some minor exceptions). A 3letter code is used to distinguish between hardware as follows: ocs Oxford Cryostream csb Cyberstar Hot air blower pcs PheniX cryostat capf STOE capillary furnace mri flat plate furnace humidity chamber cs4 4K cryostat linkam linkam DSC 9.1 Fast Temperature Scanning The use of the pos command to set the temperature (see below) will wait for the temperature to be achieved before returning and allowing the next command (eg. data collection) to be run. For fast temperature scanning, eg. using the PSD with cryostream or hotair blower, you may simply wish to set the temperature ramping and be able to collect data as it is changing. ocs.asynchronousMoveTo(100) Sets the cryostream target temperature to 100K and the temperature will begin to change. Does not return the temperature scan ds 1.0 10.0 1.0 mythen 1 Command to take 10 frames of 1 sec each ocs with the PSD. The appending of ocs to the command line means the temperature will be read from the cryostream after each frame and written as an extra column in the .dat file, see §7.1 Doc No: BLS-I11-MAN-001 Issue: 1.5 Date: 09 Feb 2011 Page: 40 of 47 Science Division 9.2 Oxford Cryostream ocs.start() Initialise the Cryostream pos ocs Get current temperature (K) ocs Get current temperature (K) pos ocs 270 Set temperature to 270K ocs.getRampRate() Get current ramp rate (K/hour) ocs.setRampRate(180) Set the temperature ramp rate to 180K/hour. (Maximum is 360K/hour) ocs.stop() Stop ramp immediately and hold temperature ocs.end() Run Cryostream shutdown procedure 9.3 Cyberstar Hot-Air blower pos csb Get current temperature (C) pos csb 500 Set temperature to 500C csb.stop() Stop ramp immediately and hold temperature pos csb 23 Set temperature to 23C. Use this command to ramp down the temperature before switching off. ocs.setRampRate(0.1) Set the temperature ramp rate to 0.08C/sec (= 5C/min). (Maximum is 0.16C/sec = 10C/min) Doc No: BLS-I11-MAN-001 Issue: 1.5 Date: 09 Feb 2011 Page: 41 of 47 Science Division 9.4 PheniX cryostat operation pcs.start() Initialise the PheniX cryostat pos pcs Get current temperature (K) pcs Get current temperature (K) pos pcs 50 Set temperature to 50K pcs.getRampRate() Get current ramp rate (K/hour) pcs.setRampRate(180) Set the temperature ramp rate to 180K/hour. (Maximum is 360K/hour) pcs.stop() Stop ramp immediately and hold temperature pcs.end() Run PheniX shutdown procedure (see §3.5) pcs.end() Runs the warm phase (see §3.5) Doc No: BLS-I11-MAN-001 Issue: 1.5 Date: 09 Feb 2011 Page: 42 of 47 Science Division 10 Writing and running scripts Use the JythonEditor window in the GDA to write sequences of commands. Redo last action Undo last action Filename of displayed script Opens a new script Run (saved) script Opens a saved script Close JythonEditor window Saves the displayed script with new filename Saves the displayed script Notes on the JythonEditor: The JythonEditor does not check for syntax (except capitalization) Comments require the # character at the beginning of the line Some commands are given pre-programmed colour codes to make the script easier to read There are no “end” or “stop” commands Tabs allow many files to be edited at once Use ctrlC and ctrlV to copy/paste between scripts. Doc No: BLS-I11-MAN-001 Issue: 1.5 Date: 09 Feb 2011 Page: 43 of 47 Science Division you must if the your script before it can be button is not highlighted, either the script is not saved or the GDA is busy. An example script can be viewed in Figure 12. The current scan or an entire script can be paused or halted from the GDA display. Figure 20 Control of scripts Doc No: BLS-I11-MAN-001 Issue: 1.5 Date: 09 Feb 2011 Page: 44 of 47 Science Division 11 Data Handling 11.1 Data Directories and Subdirectories 11.1.1 Where is my data? Your main experimental directory has the same name as your visit number eg. ee1234-1 This directory is in the I11 directory for the current year so, From a windows machine open an explorer window and type in the address bar: \\i11-storage\i11\data\2010\ee1234-1 And from a linux terminal window: cd /dls/i11/data/2010/ee1234-1 Run numbers will automatically increment by 1 for each scan – it is your responsibility to keep a record of which scan is of which sample!! Each scan will consist of an SRS file, 12345.dat, which list the data files for that scan, and any other information you have appended such as the cryostream temperature (see section 9.1). The data files for MAC data will be in the form 12345-mac-001.raw (raw data) and 12345-mac002.dat (rebinned data) 11.1.2 Creating sub directories For experiments creating a LARGE number of data files you may wish to divide you data directory into sub-directories, eg. a new sub-directory for each sample. setSubdirectoy(‘myfirstsample’) Creates a new subdirectory within ee1234-1 called myfirstsample. All subsequent data will be written into this subdirectory until you set a new subdirectory or return to the main directory setSubdirectory(‘’) Returns to the main directory (ie. no subdirectory set) 11.1.3 Adding a title to the file SRSWriteAtFileCreation=”MyTitle” Sets the title in the header file to be MyTitle. Doc No: BLS-I11-MAN-001 Issue: 1.5 Date: 09 Feb 2011 Page: 45 of 47 Science Division Warning: This will be applied to all subsequent data files until you change it! 11.2 Automatic processing of MAC data This takes place after every constant velocity scan (cvscan) as follows. Data rebinned to step size 0.001 degree Data file your data directory For example, raw data file number 3051-mac-001.raw 3051-mac-001.dat If data collection has been paused part way through a cvscan (eg. due to a beam loss) then only the processed .dat file is saved, not the raw data. 11.3 Rebinning MAC data 11.3.1 Rebinning to a different step size To be added 11.3.2 Summing multiple datafiles To be added 11.4 Data Processing - PSD data 11.4.1 Automatic data merging Using the detector object smythen in place of mythen will automatically merge data files after collection (see §7.1) 11.4.2 Data Merging If you forget to use the smythen object and wish to sum the data collected from two delta positions (using the scan delta command) the two frames from a scan can be merged together afterwards using a routine called mythenbin.py Doc No: BLS-I11-MAN-001 Issue: 1.5 Date: 09 Feb 2011 Page: 46 of 47 Science Division From a linux terminal window cd to your data directory (eg. /dls/i11/data/2009/ee0) Then call the mythenbin script to merge the two files. Note that the merged file will need to be written to your data processing directory as you do not have write permissions to your data directory: /dls/i11/software/gda/config/scripts/mythenbin FILE1 FILE2 > processing/NEWFILE e.g. To merge 12345-mythen-0001.dat and 12345-mythen-0002.dat: /dls/i11/software/gda/config/scripts/mythenbin 12345-mythen-0001.dat 12345-mythen-0002.dat > processing/12345-merged.dat 11.4.3 Mythen Data Summing A program for summing Mythen data is also in /dls/i11/software/gda/config/scripts/ The title is mythensum.py. To state the obvious perhaps, if a sample is changing structure, or even expanding or contracting during a series of data collections, summing these data won’t help you very much, so beware. Summed smythen files can also be added together using this method. /dls/i11/software/gda/config/scripts/mythensum.py 12345-mythen0001.dat 12345-mythen-0002.dat > processing/12345-summed.dat OR /dls/i11/software/gda/config/scripts/mythensum.py 12345-mythen-*.dat > processing/12345-summed.dat 12 Data Plotting Data from the MAC and PSD will be plotted in the DataPlot windows of GDA. To plot data from an older visit use the full file path in place of the scan number eg. “/dls/i11/data/2010/ee0/12345-mythen-001.dat” Doc No: BLS-I11-MAN-001 Issue: 1.5 Date: 09 Feb 2011 Page: 47 of 47 Science Division plot MAC “12345-mac-001.dat” Plots the MAC file 12345-mac-001.dat as a new plot Plotover MAC “12346-mac- Adds 12345_red.dat to the existing MAC 001.dat” plot plot PSD 12345 Plots the final frame of scan number 12345 NB. this actually plots all frames overwriting each in turn so be wary if you have many frames in the scan number! plotover PSD 12345 Plots all frames from this scan plot PSD "12345-mythen-0004" Plots the chosen frame only plotover PSD "12234-mythen- Plots the chosen frame onto the existing plot 0003" plot PSD "12345—mythen-summed" To plot a merged data file, see section 11.4.1 13 Troubleshooting An error message ‘permission denied’ Check that you are logged into the linux terminal appears when I try and rebin my data offline with your own FedID and password as the generic i11user does not have permission to access your data.eg. su abc12345 See §11.3 All motors return to their original positions To turn OFF the return to original postions flag, after a scan, including the cryostream/hotair on blower temperatures! the gda command line type scansReturnToOriginalPositions=0 To switch back ON type scansReturnToOriginalPositions=1