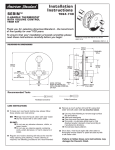
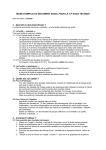
1
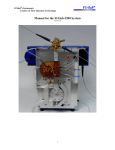
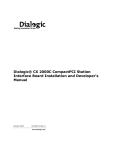
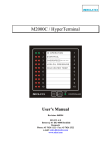
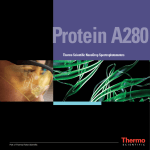
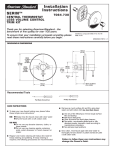
T064‐TECHNICAL BULLETIN N a n o D r o p I ns t r u m e n ts Protein Measurements, Best Practices
The patented sample retention system of Thermo Scientific NanoDrop spectrophotometers and fluorospectrometers allow
for micro-volume measurements of many molecules, including proteins. Small volume protein measurements require
special handling due to the physical characteristics of the proteins in solution and the surface tension properties of the
associated protein assay buffers.
The recommendations listed below will ensure accuracy and reproducibility when working with protein samples:
•
Use 2 µl samples for all protein measurements.
•
Ensure samples solutions are homogenous.
Sample homogeneity is extremely important when measuring small volumes to avoid micro-sampling errors. Thorough
yet gentle mixing of the solution immediately prior to taking a sample aliquot is necessary to ensure samples are
homogenous. Avoid the introduction of bubbles when mixing and pipetting.
•
Use low retention pipette tips.
Changing tips between each sample and touching the pipette tip to the pedestal surface while expelling the solution will
help to prevent protein solutions from adhering to the outside of the pipette tip. Expelling less than the full amount of
sample will prevent blowout and introduction of bubbles in the sample.
•
Ensure the pedestal surfaces are clean and properly conditioned.
Proteins tend to be sticky so proper cleaning and re-conditioning of the measurement pedestals will ensure the most
accurate results. Please refer to the your NanoDrop instrument user manual for more details.
•
Use buffers that do not contain components with strong absorbances at the wavelength of interest.
Proteins and peptides in solution may be measured directly by absorbance of aromatic amino acid residues within a
peptide or protein @ 280 nm. Alternatively, if no aromatic residues are present in the primary structure of the peptide
a concentration can be determined by measuring the absorbance of the peptide bond at 205 nm (NanoDrop™
2000/2000c models only.) Solutions containing components that absorb strongly at these wavelengths should be
avoided to get the most accurate results. The spectra below display typical absorbance profiles for purified proteins
or peptides.
Typical Protein Spectrum at 280 nm
(BSA in PBS)
Thermo Fisher Scientific - NanoDrop products
Wilmington, Delaware USA
Typical peptide spectrum at 205 nm
(5 R-K in 0.01% Brij 35)
Technical support: [email protected]
302-479-7707
www.nanodrop.com
T064‐TECHNICAL BULLETIN N a n o D r o p I ns t r u m e n ts Protein Measurements, Best Practices
RIPA Buffer
Halt Protease Cocktail in PBS
8 M Guanidine HCl
Phosphate Buffered Saline (PBS)
The spectra above display absorbance profiles for some common reagents used in protein purification measured against a water
blank. Buffer exchanges may be accomplished by dialysis or by column chromatography to remove highly absorbing reagents.
Check the absorbance of the buffer against a water blank to determine its absorbance profile. Indirect, colorimetric protein
quantitation methods such as Pierce 660 nm, BCA, Lowry and Bradford assays or fluorometric protein quantitation assay methods may be used if the protein buffer has significant absorbance and a suitable alternative buffer is not available. Refer to the protein reagent manufacturer for information regarding buffer reagents that may interfere with a specific assay.
Note: If using a cuvette, ensure that the cuvette used is UV transparent. Not all cuvettes may be used for
absorbance measurements at 205 or 280 nm.
Contact Technical Support at 302-479-7707 or [email protected] for further assistance.
Thermo Fisher Scientific - NanoDrop products
Wilmington, Delaware USA
Technical support: [email protected]
302-479-7707
www.nanodrop.com