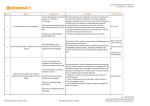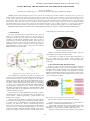
1
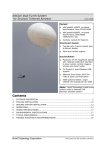
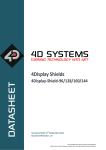
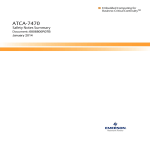
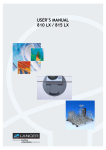
MACHINES, TECHNOLOGIES, MATERIALS. ISSN 1313-0226. ISSUE 12/2013
FEATURES OF THE TESTING OF AUTOMOTIVE SOFTWARE
Assoc. Prof. Atanassov A.
Department of Computer Science – University of Chemical Technology and Metallurgy, Bulgaria
Abstract: Control and Information Systems become vital for the contemporary Automotive Industry. Practically, there is no new car
without number of Electronic Control Units (ECUs) aimed to control all or most of its mechanical, electro-mechanical and electrical
systems, units or parts. Testing and early finding and fixing of software bugs of these ECUs is very important not only for the safety of car
driving but for saving billions euro for software updates during the time of cars exploitation. Most significant ECU in the car is Instrumental
Panel Cluster (IPC). The IPC presents to the driver actual information related to major car systems (engine, transmission, ABS),
information about current speed, warnings about oil and coolant temperatures, usage of lights, navigation, etc. Current paper discusses
some features and problems related to system software tests of IPC, as well the requirements about specific testers' skills and knowledge.
Keywords: ELECTRONIC CONTROL UNITS, INSTRUMENTAL PANEL CLUSTER, AUTOMOTIVE SOFTWARE TESTS
car depending on his preferences or specific needs.
1. Introduction
The level of electronic devices responsible for the control of
main car’s systems and nodes increases in the last years and
according to [1] they are about 40% of all systems included in
nowadays cars with internal combustion engine and are going to
reach about 70% in electric and hybrid vehicles. These devices are
known as Electronic Control Units (ECU). Practically, ECUs are
embedded control systems (controllers) with on-chip software.
Their number (Fig. 1.) varies from 30 to 100 in new cars and in new
BMW series the ECUs are up to 200.
Fig. 2 Instrumental Panel Cluster
Because of mentioned frequent hardware changes of IPC the
cluster software is also object of intensive tests.
Current paper is oriented to present what functionalities of
IPCs are tested and how specific system software tests
requirements, test environment (CANoe), as well the requirements
to the testers.
2. IPC Functions that should be tested
As given on Fig. 3 the IPC collects and presents to the driver
information provided by most of car ECUs and sensors. Only the
information that is valuable and that can be correctly interpreted by
the driver is presented to him/her. The diagnostic or specific
malfunction information related to major systems is stored in error
memory of IPC or memory of the problem unit and can be read in
service via diagnostic program.
Fig 1 Electronic Control Units (ECUs) inside the car
The communication among ECUs is based on Controller Area
Network (CAN) bus. Each ECU can broadcast its own messages via
CAN bus and can listen for specific messages from other ECUs.
Usually, the ECUs control direct fuel injection and throttle valves of
the engine, brakes (ABS), active suspension, lights, power steering,
navigation, climate, park-assistance, radio, phone, etc. Depending
on various type of input data collected from different kind of
sensors each ECU implements its own software control algorithm
and applies computed results (outputs) to controlled hardware. Both
input and output data can be regarded as CAN messages or signals
included inside these messages.
One specific ECU is Instrumental Panel Cluster (IPC or cluster)
which shows the driver an important amount of information in
various formats – telltales (signal lamps) , gauges (pointers) and
displays as given in Fig 2.
Fig. 3 ECUs and sensor information collected by the IPC
Until the software for the ECUs, controlling the engine, brakes,
power steering, etc. changes rarely the other one - the IPC software
is a object of lots of modifications and updates and changes
frequently. As a mater of fact , there are various hardware types of
IPC even for one model of car. For example there are three models
of IPC for VW cars– with black and white displays - one with low
resolution and other with high resolution, and third with colour
display. The customer is able to select one or another cluster for his
The IPC visual information is presented in several ways:
- gauges (stepper motors) with pointers, like a speedometer, a
tachometer, oil, coolant and temperature meters, etc.
- tell tales that indicate the state or usage of different car's units
and systems like the usage of lights (High/Low Beam, Turn
Left/Right, etc.), state of battery, brakes, airbags, stability, etc.
- displays presenting main and trip odometers, board computer
59
MACHINES, TECHNOLOGIES, MATERIALS. ISSN 1313-0226. ISSUE 12/2013
messages (average speed or fuel consumption) or warnings, gear
box info or some errors reported by some major car ECUs, etc.
The main functionality of mentioned above IPC units is
discussed in following paragraphs.
When the battery is off the speedometer pointer remains
in the same position. At reconnection the pointer is synchronized
and then it returns to the valid indication.
When the ignition is on the pointer returns to zero
indication and then to the valid indication. For values in normal
range, the pointer moves damped according the characteristic curve.
If the validity signal is false then the pointer drops to zero (invalid
speed signal).
After a power recovery (and in some cases after
under/over voltage) the pointer returns to the zero position and then
to the valid indication (synchronization).
In case the input signal is out of range,(error handling) the
pointer indicates this by dropping to zero position (without
damping) after a delay.
In case of under (less than 9 V)/over voltage (bigger than
16V) and power fail - the pointer remains in the same position and
when the voltage is back to normal range, the pointer is
synchronized (in some IPCs it remains in the same position) and
then indicates the valid value.
2.1 Speedometer
The speedometer is used to indicate the vehicle speed in km/h
or mph. The instrument cluster performs the transformation from
the input value (the number of impulses or revolutions per second
or the value from the bus) to an angular indication reflected by a
number of stepper motor steps (1 step = 0,05625 degrees). When
the speed is received via the bus (Fig. 4), in general it is
accompanied by a validity signal (quality factor). The conversion is
done using characteristic curves that contain some points (4 - 6)
with the correspondence between input value and output angle,
between these points linear interpolation is used. The characteristic
curve is stored in EEPROM of the IPC. To avoid pointer flickering
or jumps, a damping is used.
2.2 Tachometer
The tachometer testing is similar to the speedometer. Here two
dampings can be used. One when the engine is running and the
vehicle stands still, then the damping is higher (large variations in
short time can be performed). Second damping is when the vehicle
is moving - then the damping is smaller (the possible variations are
smaller).
The similar common behaviour tests as for the speedometer
must be done for tachometer.
Fig. 4 Data Flow and Characteristic Curves of Speedometer
The Damping (Fig. 5.) curve has a t (tau) parameter (time) and
it assures that for a pointer variation, 64% of the variation range is
reached after the time tau and 99% of the final value is reached after
about 4-5 times tau
2.3 Fuel level indication
If the signal is received over the CAN bus, the characteristic
curve is similar to the speedometer. If the signal comes directly
from the sensor, two curves are used: ADC value -> litters ->
stepper motor steps.
Two damping values are used (in some cases one is as in Fig. 5
and the other is linear) with regard to vehicle moving status - when
the vehicle is stopped, the damping is lower. A bigger damping is
needed for the moving vehicle to overcome the fuel movements in
the tank due to accelerations and braking.
When the fuel level is below a defined threshold, the fuel
reserve telltale is activated.
2.4 Coolant temperature indication
The test for coolant temperature are similar to the fuel level
indication. The behaviour and the damping depend on the vehicle
speed. When the vehicle is stopped (after a driving session) the
indication will not exceed the last valid value for an amount of time
proportional to the driving duration because the temperature around
the sensor can increase (burst of heat).
Some extra test are related to normal coolant values (75-115 deg) then the pointer stands still. In case of engine overheating
(temperature > a threshold) - a warning is generated (can be a LED,
an acoustic warning, a warning message on the display or a
combination of them), so these warnings also must be checked.
Fig. 5 Damping (exponential) Curve
In some car clusters the advance factor is applied. It represents a
percent that is added to the real vehicle speed having as a result a
bigger velocity value to be indicated. It is done in order to ensure
safety driving. On figures below an advance factor of 20% is added
to the speed of 100 km/h (Fig. 6a) and for the driver it is 120 km/h
as given on Fig. 6b.
2.5 Odometer
Fig. 6a Real speed
The main odometer is stored in IPC EEPROM area without the
possibility of reset (after the production); maximum displayed value
is 999.999 km. The storage is done using a multi-block storage
technique - the value (km/miles) is stored in a location of more
bytes (for ex. 32) and each byte is written according a IPC specific
algorithm (to avoid writing the same location each time). This
EEPROM locations can not be overwritten with a lower value.
The trip odometer is stored in IPC RAM (in some cases in
EEPROM). After the maximum value is reached (999,0 or 1999,0
km) a rollover to 0,0 km is performed.
Fig. 6b Speed with advance factor
Testing the Speedometer common behaviour
During the speedometer tests the following requirements
related to battery connection and engine ignition must be checked:
60
MACHINES, TECHNOLOGIES, MATERIALS. ISSN 1313-0226. ISSUE 12/2013
-
2.6 Tell Tales
The tell tales have specific activation/deactivation/reactivation
conditions. Some of the most popular tell tales and their meaning
are given on Fig. 7. In some clusters the lamps or the LEDs of Tell
tales are situated in speedometer or tachometer areas and some tell
tales are outside these areas. In some clusters some telltales
(warnings) are presented as icons only in main display.
clock, date
gear box position and mode
distronic / tempomat
navigation
telephone.
2.9 EEPROM
The EEPROM memory contains some configuration parameters
which are object of tests. It contains info about the cluster itself model , version, production day, month, year, similar data regarding
the engine and most important ECUs in the car, odometer data,
characteristic curves, damping parameter tau, type of engine
(gasoline, diesel, hybrid), measurement units km, miles, error codes
and lots of other data.
Except the software tests related to the functionality of
mentioned above IPC units and elements special attention has to be
given to IPC Power Management tests and Illumination tests
described below.
Power Management tests are related to normal voltage range is
which is between 9V and 16 V, under voltage (below 9V), over
voltage (above 16V) and power fail (below 6V).
In normal voltage range the instrument cluster has normal
functionality. The test voltage is around 13.5V. Outside this range,
except the case of power fail we can have the following situation: pointers are frozen to the actual position, the microprocessor
controlled LED's (lamps) are deactivated and the write function for
EEPROM is deactivated. Data retention in RAM is assured. When
the voltage resumes to normal range (with hysteresis) the normal
functionality is resumed. The pointers are synchronized (return to
zero position and then to the valid indication) to avoid step losses.
During power fail, additional to the under voltage situation, the
RAM is no more retained. When the voltage resumes to normal
range, the instrument cluster is reset.
The background Illumination is related to the displays and
scales and pointers. They can be illuminated separately. The
illumination is different according to two situations:- daytime, when
only the display is illuminated with small brightness and night time
when display(s), scales and pointers are illuminated. During night
time illumination the brightness can be modified manually or
automatically. The day/night transition is done when the front lights
are activated (manual mode) or when the outside illumination level
is below a defined threshold (auto mode). The illumination levels
are stored in EEPROM and the selected level is memorized as a
pointer in this illumination table. The display and the scales +
pointers can have different illumination tables to have different
illuminations.
Manual dimming is performed using one cluster button or a
function from the menu. Automatic dimming is preformed using a
sensor that decides the transition from day to night illumination
level. Illumination dimming does not influence the telltales'
brightness. Illumination can be used as a way to signalize a
warning. For example in some cars the tachometer scale
illumination is activated at full brightness (while the other scales'
illuminations are deactivated) when the engine speed exceeds a
defined threshold - to signalize that the engine can be damaged.
Fig. 7 Tell Tales indicators
2.7 Board computer
The information displayed by the board computer is calculated
by counting the distance, time and injected fuel. Based on these data
the instant/average consumption and velocity are obtained.
Also the remaining range reflects the distance that can be driven
with the remaining fuel in the tank and at the actual speed (actual
consumption). The travel duration can be counted too.
The functions of board computer that are object of tests are the
average speed, average consumption, trip duration - can be reset
(usually by pressing a knob on the cluster).After reset (battery reset,
manual reset, start of ignition) - a certain distance/time/consumption
is required so the first values are calculated and displayed.
Tests are also related to measuring units as:
- distance km or miles;
- speed km/h or mph;
- consumption 1/100 km, mpg (UK or USA), km/l
2.8 Information and warning messages
More complex instrument clusters having a big dot matrix
display (in some cases colour) show additional information
that alerts the driver about the state of several car
functionalities (tire pressure, engine status, ABS, ASR, ESP,
seat belt, gear information, ice warning, navigation, telephone,
radio/cd etc.).
A text message is displayed and it can be doubled by a
symbol or / and an acoustic chime too.
The messages can be presented in different languages
(configurable from menu or EEPROM).
When more warnings/messages should be displayed in the
same time, they are presented in rolling mode: each message
(with a symbol if the case) is shown for an amount of time,
then the next one.
The messages have priorities assigned. Project specific
procedures are defined to treat the priorities - a message
can/cannot be interrupted by a higher priority one, a message
has a minimum display time.
Next are given some additional messages witch can appear
on display and which are object of specific tests:
fuel level
coolant temperature
outside temperature
warning messages
oil level
service interval indication
3. Test environment CANoe
Real system software testing of instrumental clusters (IPC) is
related to the usage of special software environment which is
emulating the work of all or most of the car ECUs. This
environment is Vector CANoe [2]. It can be used for software
development for any car ECU or for any controller using CAN realtime network communications. CANoe is Windows oriented tool
based on the event driven Communication Access Programming
Language CAPL[3]. The simulations of CANoe are based on
software nodes (each node corresponds to one car ECU). The nodes
are connected via virtual or real CAN network. For each node CAN
messages and signals (events) can be defined and the
intercommunication of virtual CAN network can be simulated and
61
MACHINES, TECHNOLOGIES, MATERIALS. ISSN 1313-0226. ISSUE 12/2013
tested. When the nodes' software is tested and verified it can be
uploaded to real ECUs or can be used to further tests.
is not corresponding to the tests requirements. It is also found that
non numeric values can be set in this area because the data is not
interpreted as number but as a string.
For the test purposes of IPC the CANoe simulation interprets
the behaviour of eternal ECUs and sensors which are sending
messages to IPC. So via well organized graphical panels (Fig. 8) the
simulation is sending a messages to the IPC and the tester is able to
analyze (compare) whether the IPC visualize correctly them. With
other words - if the IPC behavior is matching the (customer and
test) requirements.
Fig. 8 View of CANoe Simulation Windows
As can be seen from the description CANoe simulation provides
possibility for manual testing of IPC. There are some extra software
tools based on Excel and Visual Basic macros which can be
connected to the CANoe simulation in order to provide semiautomated tests of IPC. Then the tester who is running the test has
to answer the questions of the test, verifying whether the IPC units
react correctly on the test messages/signals sent by the external SW
tool or to set some specific values of cluster voltages using external
power supply units (Fig. 9) or signal generators.
Fig. 10 Test example with found bug in navigation data
4. Conclusions
The paper presents the technology of automotive SW testing
with regards of IPC unit, which provides very important visual
information to the driver. The main functionalities of IPC that are
object of intensive tests are discussed, as well the corresponding
SW and HW test environments and tools.
The tests of IPC are mostly manual or semi-automated and it is
determined from one hand by the huge number of IPC types and
model and from the other side of lots of SW versions and updates
for these HW IPC models. There are few fully [4 ] automated tests
tools mostly oriented to compare display icons with these in
prepared graphical data base but at the moment they are used for
testing small amount of cars' clusters.
As can be seen automotive testing requires interdisciplinary
skills from the testers. They have to be experienced in embedded
systems, message and event driven programming, as well to have
knowledge in automation, electronics, mechanics and of course in
the field of theory of testing and configuration management.
The volume of the report does not allow detailed explanation
how CANoe simulations are developed. More information about
CANoe and CAPL usage can be found on-line in [5]. The CANoe
simulations are another part of the automotive development process
which is related to validate how the customer requirements are
implemented and mapped in the end automotive SW product.
The tests results and found bugs/errors of manual or semiautomated tests are reported in Excel files and are sent to high
management staff in order to activate bug fixes or change requests,
depending on priority of the bugs.
The real IPC tests require some preparation works related to
IPC software upload (flashing) and EEPROM variables
configuration. Because there are many SW updates of IPC software
there is special procedure for IPC software. So SW modules can be
uploaded in special order, otherwise the cluster will not react
correctly during the tests. The same is valid for setting the
EEPROM variables.
5. References:
1. Giorgio Scuro, Automotive industry: Innovation driven by
electronics, Micron, February 8, 2013, http://embeddedcomputing.com/articles/automotive-industry-innovation-drivenelectronics/
2. CANoe User Manual, Vector Informatik GmbH, Stuttgart, 2006
3. Programming With CAPL, Vector CAN Tech Inc, MI, USA,
2005
Fig. 9 Hardware and Software environment for IPC tests
Next example is related to real Navigation tests of a car cluster
and a found bug when Distance to Destination (Fig. 10) is reported
by Navigation ECU. It can be seen that in the CANoe simulation
bigger value in kilometres (upper red area) is set and that the value
on the cluster display (down red area) is cut to first 8 digits which
4. Mahendra M, Shreyas C., Alicia A. Taking Control of the
Integration Factor, dSPACE, March 2008
5. Developing CANopen Networks with CANoe.CANopen
http://canopen-solutions.com/canopen_canoe_en.html
62