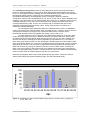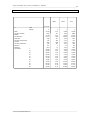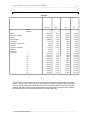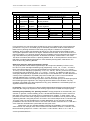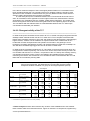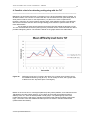
1
T.L.T. Tower of London Test For Windows® 9X/ME/2000/NT/XP/Vista/7/8 Version 3.0 MANUAL Copyright © 2013 F. Kovács Tower of London Test version 3.0 build 6.0 – Manual ____________________________________________________________________________________2 Contents 1. Short manual: quick start……………………………………………………………… 3 1.1. 1.2. Description of the test, system requirements and the TLT indices……………………………………………………………………… 3 Administering the TLT: procedures and instructions.................... 5 1.2.1. Starting the test………………………………….……………….. 5 1.2.2. Instructions………………………………………………………… 7 1.2.3. Storing the TLT results……….………………………………….. 10 1.2.4. Tips for an optimal administration of the TLT……………… 10 1.2.5. Interpreting the TLT results: a short guide………………….. 11 1.2.6. Interpreting the TLTscore …….……………………………… 14 2. Theoretical background of the Tower of London Test………………………… 15 2.1. Intermezzo: Executive functions…………………………………………………. 15 3. Norm research and psychometric characteristics……….…………………….. 3.1. Norm research of the TLT.……………………………………………… 19 19 3.2. Intermezzo about statistics: normal distributions, normal probabilities and reliability intervals…..……………………………………………….. 34 3.3. Discriminative power of the TLT: sensitivity and specificity……… 35 3.4. Reliability and validity………..……………………………………........... 42 3.4.1. Reliability………..………………………………………………… 42 3.4.2. Validity..……………………………………………….…….......... 44 3.4.2.1. Convergent validity of the TLT……………………………... 44 3.4.2.2. Divergent validity of the TLT……………………………….. 48 3.4.2.3. Validity problems of the TLT?............................................ 50 4. Possible criteria for detecting malingering with the TLT…….......................... 53 5. Literature……………………………………………………………………………… . 57 Appendix I: example of print-out of the TLT data………….……………………….. 60 Appendix II: differences with the earlier versions 1 and 2.………………............. 61 Appendix III: coding system for education and diagnosis…..……………........... 62 _____________________________________________________________________________________ © 2013 Pyramid Productions Tower of London Test version 3.0 build 6.0 – Manual ____________________________________________________________________________________3 1. Short manual: quick start! ______________________________________________________ 1.1. Short description of the test, system requirements and the test indices The computer version is suitable for computers with Windows95/98/ME/2000/NT/XP/Vista/7/8 and consists of 5 files: - TLT.EXE: - PIEP.WAV: - TLT_Manual.pdf: - NORMGRAPHTLT.TXT: - DATASTORAGE.TXT: executable file: the TLT test program file wave file in which a beep is presented online manual data of the norm graph of the TLT (Do NOT change it!!) path of directory to store the TLT results (to be changed manually if necessary) In the installation directory several more files are seen but these belong to the security program which is linked to the TLT: !! TLT.EXE.CM !! CMINSTALL.EXE !! TLT.EXE.CM.INI System requirements: the TLT needs a mouse to administer it! The test runs under Windows95/98/ME/2000/NT/XP/Vista/7 stand-alone or in a network. Screen resolution should preferably be 1024x768 pixels but this is not necessary because this resolution will be changed automatically. The Tower of London test version 3.0 consists of a standaard configuration of 3 in length differing pegs with three colored cubes: a yellow, red, and a blue one. On the first most left peg (nr 3) 3 cubes can be placed, on the second and middle peg (nr 2) 2 cubes can be placed and on the most right and smallest peg (nr 1) only 1 cube is possible. The standard configuration is presented on the computer screen below the goal position which is placed on top of the screen. A mouse cursor is present in the form of a small cross. With this mouse cursor the cubes can be picked up and replaced. The goal of the test is to rearrange the cubes starting from the standard configuration position to the goal position. This has to be done one by one and in as few moves as possible. The subject has to point first at the cubes he or she wants to move and then to point at the place where he or she wants to have the cube. The test administrator follows the subject with the mouse cursor and actually moves the cubes for the subject. N.B.: There are in total 16 items but you will only get these 16 items whenever the test score will be 90% or higher. The length of administration varies from 10 to 20 minutes, depending on the speed and capability of the subject. When the test is ended the computer has registered the following (see also Appendix I for an example of the print-out): Per item: the moves actually made in code. For example “B1-R2” means that as a first step the blue cube has been moved to peg 1 (right) and the second step is moving the red cube to peg 2 (middle). the Decision time per attempt in seconds (DT): that is the time between presenting the item ánd touching the first cube (no matter if this first cube is actually moved or not). It is assumed that decision time is in fact the true time to think ahead, to really plan. the Total time per attempt in seconds (TT): the time from presenting the item till the correct solution or till the end of the attempt when the computer breaks off the attempt. _____________________________________________________________________________________ © 2013 Pyramid Productions Tower of London Test version 3.0 build 6.0 – Manual ____________________________________________________________________________________4 Considering all items: The number of correctly solved items (NS) varying from 0 – 16, no matter the number of times an attempt is repeated (with a maximum of 2 attempts per item). NS12 means the same but then for the 12-items version (when only 12 items were presented NS12=NS). The number of correctly solved items during the 1st attempt (NS1) varying from 0 – 16. Here again: NS12_1 is for the 12-items version. When only 12 items were presented then NS12_1=NS1. The total number of times an attempt is repeated (AR) varying from 0 – 16. AR12 is for the 12-items version. The mean Decision time (DT) calculated over all legitimate and correct items (= maximally two attempts and with a correct solution) for the 16 items. With 12 items: mean DT12=mean DT. The mean Total time (TT) calculated over all legitimate and correct items for the 16 items. With the 12 items: mean TT12= mean TT. The mean Decision time with all correctly solved items with only 1 attempt (DT1) for the 16 items version. For the 12 items version: mean DT12_1 = mean DT1 if only 12 items have been presented. The mean Total time with all correctly solved items with only 1 attempt (TT1) for the 16 items version. For the 12 items version: mean TT12_1 = mean TT1 if only 12 items have been presented. The Total score: each item can yield some points (3 x number of moves). Whenever an item with 3 moves is correctly solved in the first attempt the points are calculated as follows: 3 x 3 = 9 points. With the same item but solved correctly in 2 attempts the number of points will be: 3 x 1 = 3 points. A second attempt is only 1 point worth each move. And whenever the total time of the 2 attempts together exceeds the 60 seconds limit 1 point is subtracted from the total due to mental slowness. With this scoring method the first attempt is rewarded much higher than the second attempt. Secondly, the more difficult items (9 till 16) are rewarded more points than the simpler items. In this way, planning (the actual ‘looking ahead’) is quantified more exactly and rewarded as it should. The total score can vary from 0 to 138 points (12 items) or to 216 points (16 items). It is denoted as Total score 12 or Total score (for 16 items). A Percentage correct score is calculated as well: the total score divided by the maximum number of points possible (=138 or 216). Range: 0 – 100%. Denoted as Score percentage12 (for 12 items) or ‘Score percentage’ (for 16 items). A Decile score which is based on a healthy norm group of 260 people without brain damage and 14 to 93 years of age. Remarkable is that a lot of these healthy volunteers have quite some problems to really plan correctly. Only a few do manage to solve all 16 items in only 1 attempt. See also ‘Norms research and psychometric characteristics’. Blocking error, Floating error, Monitoring error. See ‘Tips for an optimal administration’. Ratioscore: score on items 9 till 12 divided by the sumscore on the items 5 till 8. This is a score to be used in detecting malingering. _____________________________________________________________________________________ © 2013 Pyramid Productions Tower of London Test version 3.0 build 6.0 – Manual ____________________________________________________________________________________5 1.2. Administering the TLT: procedures and instructions ______________________________________________________ Place the patient on a for him or her comfortable distance from the computer screen, usually at a distance of about 70 cm. The keyboard is placed on the left or right to the patient, only to be touched by the examiner. 1.2.1. Starting the test The test can be started by double clicking on the file TLT.EXE in for example Windows Explorer. It may be wise to install a pictogram of the TLT on the desktop. However, the easiest way to start the test is to go to the Main Menu: Start–> Programs -> TLT -> and then to click on the option Tower of London Test. On screen the colored introduction screen of the Tower of London Test appears with the name of the author (Figure 1). Then press ALT-F4 or click with the computer mouse on the Exit button X on the top right of the screen to move further. Figure 1. Introduction screen: close with ALT-F4 or click on X on the top right _____________________________________________________________________________________ © 2013 Pyramid Productions Tower of London Test version 3.0 build 6.0 – Manual ____________________________________________________________________________________6 On the screen the patient data input screen appears (Figure 2): Figure 2. Input Patient data screen Walk through each option with TAB or just use ENTER/RETURN; close with NEXT or click on the X After closing the input data screen a gray screen appears with a bar at the top with the buttons: PRACTICE, START (both activated), NEXT, REPEAT, MONITORING (all three not activated) and END (activated). Most buttons are quite clear. Only the button MONITORING needs some explanation which will be given later in this text. First of all the examiner has to start the PRACTICE trial by just clicking on the button PRACTICE with the left mouse button. The PRACTICE screen of the TLT appears with the standard begin position of the TLT. Now the moving of the cubes can be practised by the examiner. Moving the cubes: Only a practised psychological assistant or a psychologist is allowed to move the cubes! The patient only has to point out which cubes he wants to move. He may actually touch the screen to show which cubes exactly have to be moved. If it is more convenient the patient may verbalize his planned moves. However, care has to taken that this kind of verbalisation is truly reliable. In practice, it is recommended to urge the patient to point at the cubes because that normally is easier than to verbalize all moves. Notice: it may be possible to let the patient move the cubes with the computer mouse. Especially for people who are quite used to a computer mouse this gives an extra motivation to do the test. However, it must then be very clear that a patient really can handle a computer mouse without much effort. _____________________________________________________________________________________ © 2013 Pyramid Productions Tower of London Test version 3.0 build 6.0 – Manual ____________________________________________________________________________________7 For the examiner: go with the cursor to a cube that you want to move. Press once on the left mouse button (there has to be a BEEP; when there is no beep, please click again), release this left mouse button (do not HOLD!) and move the cursor to the spot where you want the cube to go. Then press once again on the left mouse button. The cursor does not need to be placed on exactly the middle of a cube-place but it should be in about the square where a cube can be placed. Meanwhile the instructions below are being explained. 1.2.2. Instructions ______________________________________________________ When the PRACTICE-screen is on and the examiner has mastered moving the cubes around the instructions for the patient are as follows: " Here you see three pegs differing in length and 3 colored cubes. What kind of colors do you see in these cubes? " The examiner has to be sure that the patient has no form of color blindness. Color blindness does not rule out doing the test but it must be certain that the patient can clearly distinguish the different cubes (without any effort) in a reliable way. " The cubes can be placed as follows on the 3 pegs. Here only one cube can be placed (go with the red cube to the smallest, most right peg (nr. 1), here two cubes can be placed (place red cube on top of the blue one), and here 3 cubes can be put (place the red one on the yellow one and place the blue one on top; set the blue one back to the middle peg and place the red one on top of this blue one). You need to know two further rules: the blue cube can not be moved right now because of the fact that the red one is on top. First you have to move the red one (place the red one on top of the yellow one). Now the blue one can be moved, you see? But now the yellow is blocked because a red one is on top of it. So, first of all you’ll move the red one (place red on the blue one) and then you can move the yellow one. The yellow one can be moved to the other end as well (show this because some people think the left cube is blocked by the two cubes in the middle)." This rule, the blocking rule, seems so obvious for healthy people but it normally isn’t for brain damaged patients. That is why it has to be explained explicitly. " The second rule you have to know is that a block can never float in the air. For example, this red cube can not float on top here because it always falls down on the other cube. " (show that the red cube cannot be placed on top of the peg 3 (largest one) but always places itself directly next to the yellow cube) This rule is called the ‘floating rule’. " What you have to do now is to move the cubes, one by one, to get this configuration (show the configuration on top of the screen, see figure 3). Move the cubes with as few moves as possible! Please try this once. Show me which cubes have to be moved and where they should be put. " (usually this assignment has to be repeated; sometimes even the first step has to be shown by the examiner) Notice: here the instruction is different than sometimes is used in different Tower of London versions. The number of minimum moves is NOT to be mentioned! Emphasis has to be put on the fact that ‘as few moves as possible’ have to be made. Usually the instruction “So look carefully” has to be added. This instruction is very important to disencourage impulsive reactions (also see Bull, Espy and Senn, 2004). _____________________________________________________________________________________ © 2013 Pyramid Productions Tower of London Test version 3.0 build 6.0 – Manual ____________________________________________________________________________________8 Figure 3. Example screen of the TLT 3.0 " Fine. This was very easy. Now an example will be shown and this one is a little bit more difficult. Please try again. " (Click on Next in order to show the example on screen. When the patient is not able to do the item help should be provided by moving just one cube. The example will be repeated once by the examiner in order to be sure the patient has understood the instructions. Only then the first real item will be started) " I will let you do the test now. Maybe you will make a mistake now and then. Please tell me because you can ask for a Reset of the test item. So you have another chance of starting over. Or the computer will start over automatically whenever you have used too many steps. On screen you will then see “Wrong! Start again”. There are 12 items but if you are doing very well you will be awarded with 16 items. Let’s see how far you can come with this test. (Click on Start). Immediately after closing the test Figure 4 appears: a graphical display of the results on the test. You can see how the planning evolves during the test (the blue circles are the achieved scores per item and they should increase in a stepwise fashion) and the decision time during the first attempt (DT1: line in red). This graph will be stored automatically when closing! _____________________________________________________________________________________ © 2013 Pyramid Productions Tower of London Test version 3.0 build 6.0 – Manual ____________________________________________________________________________________9 Figure 4. Graphical display of the test results on the TLT (here in Dutch) In earlier versions of the TLT Figure 5 appeared: the results on the test variables TLTscore, TT1, DT1 and AO1 compared to the average values of 5 different norm groups: normal controls, stroke, traumatic brain injury, other neurological disorders and Whiplash-Associated-Disorders patients. In this way you can immediately see how someone’s scores compare with what is healthy and which group of patients are most similar to the patient’s profile. As you can see the mean pattern follows a line from high to low. This graph is still stored automatically when closing this image but is NOT shown automatically anymore to prevent patients’ distress. Figure 5. Test results of the TLT for 4 variables compared to 5 different patient groups (here in Dutch) _____________________________________________________________________________________ © 2013 Pyramid Productions Tower of London Test version 3.0 build 6.0 – Manual ____________________________________________________________________________________10 1.2.3. Storing the TLT results ______________________________________________________ Only when closing the REMARKS screen at the end of the test (Figure 4) will all data be stored. That is why you shouldn’t wait too long to input some remarks. When there is a power failure all data can be lost when this Remarks screen has not been closed. The test data are stored in a file with the extension NameTLT.txt. When your name is POWER the test data file will be POWERTLT.txt. This raw data file is stored in the directory that is written down in the DATASTORAGE.TXT file. For example, when C:\Program Files\TLT is written down, all test data are stored in this directory. N.B.: When you want your test data to be stored elsewhere you can easily edit the DATASTORAGE.Txt file with Notepad and write the exact directory down in which you want to store the data. If the directory does not exist yet (because you have forgotten to create it), then the program will issue a warning and store all test data automatically in the Default directory. That is the directory where the test was installed. In this way no test data will be lost. Figure 6. Remarks screen 1.2.4. Tips for an optimal administration of the TLT ______________________________________________________ Optimising the test conditions: It is important with every neuropsychological test administration to optimise the testing conditions. Every reassurance, encouragement or extra explanation that you think is necessary for a patient should be given. However, please do not forget that too much explanation can seriously change the test results. In the TLT you must NOT stress that a patient has to think as long as possible befóre moving the cubes. Just tell them the instructions as outlined on page 7. Prevent any disturbances during testing: _____________________________________________________________________________________ © 2013 Pyramid Productions Tower of London Test version 3.0 build 6.0 – Manual ____________________________________________________________________________________11 Please pay attention to irritating noises like a (mobile) phone that can ring in the testing room or background noises coming from other rooms. Try to prevent such distracting noises as much as possible. Starting anew with the test item: Every test item will be offered anew as soon as the patient shows (verbally or nonverbally) that the solution is wrong. The examiner can then suggest starting over and when the patient agrees the RESTART button should be clicked. The test item starts again immediately. The patient is only allowed two attempts to solve a test item. Registering errors: Errors of the patient can be coded automatically by the program. The Blocking error (code ‘b’) occurs whenever the patient wants to move a cube on which another cube lies. The cube above blocks the cube below. The Floating error occurs whenever the patient tries to move a cube to a space where immediately below this space there is no cube. A normal wooden cube can not float in the air as well, so this is a Floating error (represented with ‘z’ for the Dutch word: Zweven, meaning Floating). Finally, there is the Monitoring error (code ‘m’). This is the only error that has to be coded manually by the examiner. It is the error that occurs whenever a configuration is very close to the right move but the patient does not see it. In fact, when looking closely you should see very clearly which move you have to make. It clearly is an error of not matching the goal position with the configuration you are making on the screen. After such an error the examiner should click on the Monitoring button above. Normally, a patient will not notice this. But the computer encodes this click as a ‘m’ class error. Using more than the permitted time or the number of steps: When the number of moves/steps exceeds the maximum number of allowed steps ánd it still is within the maximum limit of 3 minutes, then the computer automatically stops this attempt and all cubes are placed in the original position again. On screen the warning states: “Wrong. Please try again!”. The examiner has to explain explicitly that “this was a detour. It can be shortcut. Please try again.” In clinical practice some patients do not understand this immediately and so this should be explained more than once when it occurs. Usually I say: “it was correct but you can do it with less steps. Please try that.” Restart yourself: Sometimes it is necessary to click on the Restart button yourself. That happens when the maximum limit of 3 minutes is over but the computer has not automatically restarted the item yet. Normally, in such cases on screen the warning states: “we go to the next item”. Whenever the patient becomes tired or irritated, a quick restart is necessary with some stimulation to continue the test. Questions about being timed: Whenever the patient asks whether he is being timed the examiner should answer: “please solve the items in your own pace, but clearly you haven’t got all day”. Writing down remarks: At the end of the test the computer asks for several remarks. The examiner can write down short remarks. For example, how much help was given for an item or if there were any distractions during the test. Aborting the TLT: The TLT can be aborted at any time by clicking on the END button on the right top. This only works whenever at least one step has been made. It is not recommended to abort the TLT. Only in extraordinary circumstances like when a patient is totally exhausted or isn’t motivated anymore to continu, then exiting the test is possible. All data up to this point are then saved safely. Printing the test results: Printing has not been programmed automatically to reduce the chances of errors in the program. The test data are always stored in a data file called NameTLT.TXT. It is an ASCII text file easy to be edited in Notepad or Word. Storing the test results: Please remember that when two patients have the same surname like Broderick, the second patient’s test results will be automatically attached to a file BroderickTLT.txt, no matter how old that file is! _____________________________________________________________________________________ © 2013 Pyramid Productions Tower of London Test version 3.0 build 6.0 – Manual ____________________________________________________________________________________12 1.2.5. Interpreting the TLT results: a short guide ______________________________________________________ Example of print of TLT test data Tower of London Test for Windows version 3.0.6. Surname: kovacsf Date of birth and age: 28-08-1964 40 Test Date: 25-6-2005 20:48 Educational code: 7 Gender: m Diagnosis: healthy Remarks: Ex. R1-G2-R3-|- 1.7- 3.5-|-R1-G2-R3-|- 2.9- 5.8-|--|| SumDT: 2.9 SumTT: 5.8 REstart: 0 Score: 9 1. B1-R2-|- 1.4- 2.8-|--|| SumDT: 1.4 SumTT: 2.8 REstart: 0 Score: 6 2. b-R1-G2-|- 2.4- 6.9-|--|| SumDT: 2.4 SumTT: 6.9 REstart: 0 Score: 6 3. B1-R2-B3-|- 1.8- 4.4-|--|| SumDT: 1.8 SumTT: 4.4 REstart: 0 Score: 9 4. B1-R2-B2-|- 1.5- 3.8-|--|| SumDT: 1.5 SumTT: 3.8 REstart: 0 Score: 9 5. R2-G1-R3-B3-|- 1.8- 4.6-|--|| SumDT: 1.8 SumTT: 4.6 REstart: 0 Score: 12 6. B1-R2-G2-B3-|- 1.4- 4.6-|--|| SumDT: 1.4 SumTT: 4.6 REstart: 0 Score: 12 7. R2-G1-R3-G3-|- 2.8- 6.1-|--|| SumDT: 2.8 SumTT: 6.1 REstart: 0 Score: 12 8. B1-R2-B2-G1-|- 4.2- 7.2-|--|| SumDT: 4.2 SumTT: 7.2 REstart: 0 Score: 12 9. R2-G1-R3-G3-B3-|- 2.4- 9.2-|--|| SumDT: 2.4 SumTT: 9.2 REstart: 0 Score: 15 10. B1-R2-G2-B3-G3-|- 1.9- 6.6-|--|| SumDT: 1.9 SumTT: 6.6 REstart: 0 Score: 15 11. R2-G1-R3-B3-G3-|- 1.3- 5.7-|--|| SumDT: 1.3 SumTT: 5.7 REstart: 0 Score: 15 12. B1-R2-B2-G1-B3-|- 1.6- 6.2-|--|| SumDT: 1.6 SumTT: 6.2 REstart: 0 Score: 15 13. R2-G1-R3-B3-G2-B2-|-18.9-24.1-|--|| SumDT: 18.9 SumTT: 24.1 REstart: 0 Score: 18 14. B1-R2-G2-B3-G3-R1-|-13.4-18.1-|--|| SumDT: 13.4 SumTT: 18.1 REstart: 0 Score: 18 15. R2-G1-R3-B3-G2-B2-R1-|-32.7-39.1-|--|| SumDT: 32.7 SumTT: 39.1 REstart: 0 Score: 21 16. B1-R2-G2-B3-G3-R1-G2-|-26.4-38.8-|--|| SumDT: 26.4 SumTT: 38.8 REstart: 0 Score: 21 2 AO12 = 12 AO12_1 = 12 RE12 = meanDT12_1 = 2.0 meanTT12_1 = Score percentage12: 100.0 0 meanDT12 = 2.0 meanTT = 5.7 Total score12 = 138 5.7 1 AO = 16 AO1 = 16 RE = 0 meanDT = 7.2 meanTT = 11.8 meanDT1 = 7.2 meanTT1 = 11.8 Total score = 216 Score percentage: 100.0 Blocking errors: 1 Floating errors: 0 3 Monitoring errors: 0 Client compared to 260 healthy controls, 14-93 yrs(mean 28.3 yrs) for 12 items: percentiles min 5 10 20 30 40 50 60 70 80 90 95 max |----|--1-|---2--|---3--|---4--|---5--|---6--|---7--|---8--|---9--|-10-|----| very severe |severe insufficient reasonable suff. (quite) good very good perfect 39.9 50.7 57.4 63.2 67.4 71.0 75.4 78.3 81.9 86.1 92.8 99.0 100 TLTSC-|----|----|------|------|------|------|------|------|------|------|----|----| 4 6 6 7 8 8 9 9 10 10 11 12 12 AO1---|----|----|------|------|------|------|------|------|------|------|----|----| 1.8 2.4 2.7 3.2 3.6 4.2 4.8 5.9 7.0 9.1 11.6 14.2 24.9 DT1---|----|----|------|------|------|------|------|------|------|------|----|----| 5.6 6.6 7.1 7.9 8.7 9.6 10.2 11.5 13.4 17.4 22.1 25.4 62.5 TT1---|----|----|------|------|------|------|------|------|------|------|----|----| Excellent planning decile 10 5 4 1.92 standard deviation from the mean (here: 74.43); in the Z-table one can find the chance Compared to a right-hemisphere stroke group N=271: 9th decile that someone scores lower Compared to a left-hemisphere stroke group N=288: 9th decile Compared to a Traumatic Brain Injury group N=99: 8th decile (p=.973). This is the 97th Compared to Other neurological group N=254: 8th decile percentile (decile 10). A Compared to WAD type II group N=19: 7th decile negative Z-score (-1.92) would mean that it would be the 2.7th Profile suggests malingering when this is a healthy person! (1-.973) percentile. Ratioscore is: 1.70 _____________________________________________________________________________________ © 2013 Pyramid Productions Calculated Z-score for the healthy control group: 1.92 7 6 Tower of London Test version 3.0 build 6.0 – Manual ____________________________________________________________________________________13 1 2 3 4 The total score is 138 points for the 12 items. For the 16 items it is 216 points. The score percentage is the number of points divided by the maximum obtainable points. It is the most important variable or index of this computer version of the TLT. Not only it is a direct measure of how well the TLT has been done, in other words: how well the planning went, but it is the only index that has a normal distribution in the healthy controls group. So with this score a Z-score can be calculated. The mean Decision Time score for the 12 items at the first attempt is important to see how short the time was that a patient really thought about the test item before actually moving the first block. Whenever this time is extremely short ánd the total score is very low, you can interpret this as a very impulsive act of planning (or actually: no planning at all). To see how well someone remembered the rules of this test, you can look at the type of errors. This is only a qualitative measure because these errors are not used in any scoring system. A patient with a relatively good total score can still have some interesting blocking errors. However, usually when a patient has a good total score, he does not have much errors. In fact, healthy controls hardly make any errors at all and also patients usually have only 2 errors max. Blocking errors are the most common. The deciles of the four main indexes can give you an idea how the test was done. Of course, the TLTsc (total score) is the most important index. The AO12_1 is the total number of solved items at the first attempts in the 12 items version. As you can see this index is heavily skewed and most healthy controls do have a score of 8 or higher. This score does not differentiate patients or controls very much. Although much used in research, it does not tell you much. st The two time indexes DT1 and TT1 represent the mean Decision Time at the 1 attempt and the mean Total time to solve an item at the first attempt. Although recorded it does not tell you very much. When you have a long decision time (a long time before actually a move is made) it can mean anything: either someone has is very carefully planning or someone who has really trouble in planning. Only when taking the total score into account you can interpret such times more clearly. For example, when the mean Decision Time is 20 seconds ánd the total score is very high, you can assume someone has given some thought for each item. However, you still can not be certain that this amount of time was not due to really having a problem with the test. Usually, the mean Decision Time in the healthy controls group can give you a clue as to the time taken to think was really quite normal or not. 5 The decile is just another indication how well the test was done, compared to healthy controls. Below this sentence the score is also compared to the other neurological groups so the severity of the planning problems can be interpreted even better. 6 The Z-score gives an indication of how far the test score was from the normal average compared to the healthy controls. 7 The actual lines shown are: “This Profile suggests malingering when this is a healthy person (or: ‘a neurological patient’)! Please look closely for any other indications of malingering and be sure to administer at least one other malingering test. Ratioscore is: 1.75”. See Paragraph 4.1 for more information about detecting possible malingering. Whenever the scores do not raise any suspicion about malingering these warning lines are NOT shown. Further considerations Step 1: The most important variable to look at is the TLTscore, as mentioned before. However, a low TLTscore can be caused not only by a genuine planning disorder. A very limited working memory or attentional span, a disturbed visuospatial sketchpad, a serious inattention or concentration disorder, are all possible alternative explanations and have to be assessed with other tests. _____________________________________________________________________________________ © 2013 Pyramid Productions Tower of London Test version 3.0 build 6.0 – Manual ____________________________________________________________________________________14 Step 2: Serious visuo-spatial deficits show up pretty soon during the first items of the TLT. The same goes for very severe attention span deficits. Step 3: In general one can presume that the performance in the TLT is getting better whenever someone gets accustomed to the test. Also picking up the strategy to do the test explains why items later in the test seem to be done more easily (e.g. less decision times are necessary). Step 4: Please look carefully at the raw data and see if there are no very atypical scores. For example, an extremely long decision time, a very varying scoring across items, all this can mean a strongly varying motivation or effort. The difference between deficit or disorder and a problem: The Tower of London Test generates a description of the severity of the planning disorder. The underlying assumption is that there is a continuum of planning from being severely disturbed to an excellent planning ability. On this continuum one can probably label one end the ‘disorder’ end and the other end the ‘problem’ end. A disorder is considered to be a test score 2 standard deviations or more from the mean of a healthy control group. A ‘problem’ with planning however, is statistically NOT a disorder but can lie closely to the cut-off point. Whenever the TLT speaks of a ‘slight planning problem’ there may be planning problems but there still is NOT a disorder because the score isn’t that bad. However, when the TLT speaks about a ‘slight planning deficit’ there certainly IS a planning disorder but, considering the severity of this disorder, it is not a very severe disorder. Whenever the TLT uses the terminology of a ‘planning deficit or disorder’ then one has to realize what exactly is meant by planning. The TLT is especially designed to measure ‘Planning ahead’, sometimes called preplanning. It really is looking ahead, seeing all necessary steps BEFORE any steps are actually taken. The ability to solve any problems during taking actions steps is measured by this version of the TLT, but less so than the preplanning. A first wrong step (problem in preplanning) will be ‘punished’ quite severely with a relatively high drop in points. Although one can start over rather quickly and correct everything in the second attempt, the total score will be significantly less when such preplanning mistakes are made. One has to realize this and has to review the scores on other planning tests such as the BADS zoo test, or the Picture Arrangement subtest, or the Porteus Mazes test. 1.2.6. Interpreting the TLTscore ______________________________________________________ To determine the level of planning problems the TLTscore is the best representative score. This score has been divided into ten parts (deciles) in the healthy controls group (n=260): TLTscore 0 tot 44.8%: < minimum: very severe planning disorder TLTscore >=44.8 tot 52.9%: < deciel 1: severe planning disorder TLTscore >=52.9 tot 56.9%: deciel 1: slight planning disorder TLTscore >=56.9 tot 63.2%: deciel 2: obvious planning problem (not a disorder!) TLTscore >=63.2 tot 67.4%: deciel 3: moderate planning problems TLTscore >=67.4 tot 71.0%: deciel 4: slight planning problem TLTscore >=71.0 tot 75.4%: deciel 5: average planning ability TLTscore >=75.4 tot 78.3%: deciel 6: sufficient planning ability TLTscore >=78.3 tot 81.9%: deciel 7: more than sufficient planning ability TLTscore >=81.9 tot 86.1%: deciel 8: good planning ability TLTscore >=86.1 tot 92.8%: deciel 9: very good planning ability TLTscore >=92.8 t/m 100% : deciel 10: excellent planning ability In interpreting the TLTscores the presence of blocking-, floating- or monitoring errors is an important indication for a planning disorder. As already mentioned healthy controls do not show many of such errors (especially not monitoring errors). Furthermore, a comparison with the neurological patient groups will be presented automatically, also in the decile form. _____________________________________________________________________________________ © 2013 Pyramid Productions Tower of London Test version 3.0 build 6.0 – Manual ____________________________________________________________________________________15 2. Theoretical background of the Tower of London Test The Tower of London test (Lezak, 1995, p. 657) is seen as one of the best tests to assess disturbances in planning, one of the so-called executive functions. The goal of this test is to rearrange three colored cubes from their initial position on three upright pegs to a new set of predetermined positions on one or more of the pegs. This has to be done in as few moves as possible. There are 16 test items and the level of complexity is determined by gradually increasing the minimum number of moves possible from 2 to 7. The original Tower of London test had been developed out of research in artificial intelligence and problem solving. In this kind of research so-called “look-ahead" puzzles were used such as the Tower of Hanoi (Anzai & Simon, 1979). Together with McCarthy Shallice (1982) developed an experiment in which he introduced the Tower of London task. A derivative and simplification of the Tower of Hanoi puzzle, this test consisted of three wooden pegs and three colored beads (red, green, blue). The beads could be manoeuvred and placed onto the pegs. With this test Shallice showed that patients with largely left anterior brain lesions had serious difficulties to solve all items, compared to left or right posterior lesions and healthy control subjects. Especially frontal lobe patients seemed to perform badly on this test (Shallice & Burgess, 1991). The computer version presented here differs in some detail from the original Shallice version but largely follows his essential points in his 1982 article. These essential points are registering the moves a subject makes to solve the puzzle, registering the time to make the first move (decision time), registering the total time needed to solve one item, and the number of items solved in the first attempt. Differences with his version are: the presentation of the test on a computer screen. The largest advantage here is that possible movement disorders or problems are not confounding the planning behaviour and are not part of the total time needed to solve an item. the limit of 60 seconds to solve an item has been retained but there are now 2 attempts possible per item. the scoring procedure explicitly rewards the first attempt to solve an item. The second (last) correct attempt is rewarded with far fewer points than the first one to emphasize that real planning actually takes place in the first attempt. the time and the moves are registered much more accurately by the computer than a human being can do. A more difficult and therefore more unreliable administration is prevented. some mistakes that patients tend to make regularly are being registered in this computerized edition. Both a quantitative and qualitative analysis of errors is therefore possible. Since 2005: an extra long version has been developed: from 12 to 16 items. Especially when subjects do find the test very easy several more complex items were added to prevent serious ceiling effects. However, the test score has to lie on 90% or higher before the additional 4 items will be presented. the goal position has been put on the computer screen. This change has not had any noticeable influence on the test performances. 2.1. Intermezzo: Executive Functions ______________________________________________________ The Tower of London test is now considered one of the so-called executive function tests (Culbertson & Zillmer, 1998; Rainville, Amieva, Lafont, Dartigues, Orgogozo & Fabrigoule, 2002 ; Riccio, Wolfe, Romine, Davis & Sullivan, 2003) but it is not quite clear how planning is related to the broader concept of ‘executive functioning’. When planning is described it largely overlaps with given definitions of ‘executive functions’. I think, like many researchers, that ‘executive functions’ are a conglomerate of more specific cognitive functions like initiating and sustaining attention, planning and strategic thinking, evaluating feedback and the capacity to react flexibly to errors, all this in largely new tasks (Geurts, 2003; Huizinga, 2006). Miyake, _____________________________________________________________________________________ © 2013 Pyramid Productions Tower of London Test version 3.0 build 6.0 – Manual ____________________________________________________________________________________16 Friedman, Emerson, Witzki, Howerter and Wager (2000) have confirmed 3 often mentioned factors or components of executive functioning in a factor-analysis: working memory (called ‘Updating’), attention shifting and response inhibition. This has been replicated by Fisk and Sharp (2004). For a good executive functioning in a new task it is necessary to plan and execute several different steps. Several substeps are needed that deliver specific outcomes and actions. All these have to be maintained in active working memory, meanwhile ignoring other irrelevant information or suppressing prepotent responses so that the final goal can be maintained and reached. Such a description closely resembles the ‘goal-maintenance’ model of Miller and Cohen (2001). Using Shallice’s model (1982) as a start they focused their model around the concept of ‘cognitive control’. In fact, this is essentially the same concept as Shallice his ‘Supervisory Attentional Control and it is almost the same concept as the ‘Attention Director’ in Shiffrin and Schneider’s work (1977). However, the description of cognitive control in Miller and Cohen’s model is much more specific, so much so that the homunculus problem does not seem to pop up. Cognitive control is the ‘active maintenance of (neural) activity patterns that represent goals and their means’. In keeping these goals active (‘on-line’) in working memory, it is possible to direct the automatic information processing so that goal-directed behaviour becomes possible. For a schematic explanation see Figure 7. Cognitive control, as described by Miller and Cohen, resembles very strongly the concept of the Supervisory Attention Control of Shallice. Unfortunately, confusion remains because several researchers keep using different terminology for the same processes. Miller and Cohen about cognitive control: “the internal representation, maintenance, and updating of context information in the service of exerting control over thoughts and behavior. …We define context as any task-relevant information that is internally represented in such a form that it can bias processing in the pathways responsible for task performance” (Braver and Barch, 2002). Somewhat further in the text: “…the context processing functions of our model demonstrate how a single underlying mechanism, operating under different task conditions, might subserve three cognitive functions that are often treated as independent—attention (selection and support of task-relevant information for processing), active memory (on-line maintenance of such information), and inhibition (suppression of task-irrelevant information).” These three functions are the same as Miyake et al (2000) have extracted in their factor-analysis of executive function tests. Figure 7. The Goal-maintenance Model van Miller and Cohen (2001). _____________________________________________________________________________________ © 2013 Pyramid Productions Tower of London Test version 3.0 build 6.0 – Manual ____________________________________________________________________________________17 In Table I I have tried to summarize several concepts of different researchers and to show how they are related to each other. Table I. Researchers: Terminology: Specification: Concepts used in the scientific literature to describe Executive Functioning Shallice Supervisory Attentional Control Automatic processing (contention scheduling); controlled processing Baddeley Central Executive Miller en Cohen Cognitive control Miyake et al Executive functioning Phonological loop and visuospatial scratchpad; working memory Active goal maintenance Updating, Shifting, Responseinhibition Unfortunately, in clinical neuropsychology the concept of cognitive control still isn’t used much. The concept of “executive functions” however is much more common, although it signifies the same as the concept of Cognitive Control. The Goal Maintenance Model shows that 3 concepts, still heavily used in neuropsychology, can be integrated into one model and can be considered as the sides of the same coin: inhibition, working memory and attention. In summary: Executive functions (cognitive control) consist of: 1. Attentional control: Initiating and maintaining a focus/goal, despite interference of other (irrelevant) information and/or responses (inhibition); 2. Planning: making of a plan and the necessary action steps; 3. Executing and monitoring: the actual execution of these steps and the monitoring of these actions; 4. Flexibility: correcting and adjusting the plan and the action steps based on the feedback about the execution. Planning As stated above planning is seen as a part of executive functions. Below I will summarize what several researchers say about planning. Planning is the ability to subdivide goals into subgoals and to execute actions in a specific sequence to reach all subgoals one by one. Formulating a goal, dividing it into smaller subgoals and to coordinate all subgoals (i.e. programming), executing all necessary steps according to the plan and finally monitoring (and correcting) and executing all steps is seen as the most important steps (Morris, Miotto, Feigenbaum, Bullock, & Polkey, 1997). Lezak (1995, p. 654) further states that it is necessary to notice changes compared to the present circumstances (look ahead), to consider alternatives and to maintain a certain sequence and hierarchy in ideas. A well functioning impuls control, sustained attention and a reasonable working memory are necessary as well. Furthermore, Goel and Grafman (1995) distinguish between making a plan and executing a plan. Especially, the control over a ‘prepotent response’ (reacting immediately to a trigger) is seen as a very important planning component. The same idea comes from Bull, Espy and Senn (2004) as well. According to Goel and Grafman (1995) the original Tower Of London Test of Shallice can not be considered a real planning test because every step can be made. A step can be undone as well. In this way, real ‘look-ahead’ thinking isn’t necessary because one always reaches a solution. This reasoning has a point whenever the TLT’s scoring system does not count the number of (extra) steps. Shallice (1982, 1988) considers the Supervisory Attentional System (SAS) as responsible for planning. It is this system that executes non-routine action sequences. This takes up a lot of ‘energy’, attention. The chances of making errors in such a system is therefore higher than in a system that uses routine tasks largely based on automatisms. The TLT gradually increases the load on the SAS. In the most simple items (2 or 3 steps) the moves are very easy to see and to follow to reach a solution. In the more challenging TLT items one has to have an efficient _____________________________________________________________________________________ © 2013 Pyramid Productions Tower of London Test version 3.0 build 6.0 – Manual ____________________________________________________________________________________18 monitoring procedure (= a check and error correction procedure). The last and most difficult problems rely heavily on thinking ahead (Krikorian et al., 1994; Shallice, 1982). Recent neuro-imaging studies still haven’t uncovered clearly what brain regions are really involved in the planning process. A lot of studies use several different computer versions of the Tower of London Test (Schall, Johnston, Lagopoulos, Jüptner, Jentzen, Thienel, Dittmann-Balçar, Bender & Ward, 2003). However, there is some consensus that the TLT task uses a complex neural network in which dorsolateral prefrontal, parietal, cerebellar and basal ganglia are activated. A predominantly left or right hemisphere activation in planning has not been confirmed yet. However, Newman, Carpenter, Varma and Adam Just (2003) state clearly that as well as left and right dorsolateral prefrontal regions are active in planning. Making a plan is largely depended on the activation of right prefrontal areas (strategic planning). Unterrainer et al. (2004, 2005) also see the right prefrontal area as being responsible for strategic planning (see also Goethals, Audenaert, Jacobs, van de Wiele, Pyck, Ham, Vandierendonck, van Heeringen, & Dierckx, 2004). These regions become more active whenever the planning tasks are getting more complex as well. The left prefrontal regions monitor and control (adjust) the plan whenever it is being executed. Newman et al. (p. 1678) propose a model in which several TLT processes are integrated. In their view, two main cognitive processes play a role during the TLT execution: a routinely based more perceptually driven process and a non-routine based strategy-oriented process. The first process can perform the first TLT items with ease because here only perceptual comparisons have to be made. However, with more steps the strategic system is more and more involved because now goals have to be formulated and compared with the end goal. When a correct sequence of subgoals has been made (planned), the more automatic perceptual system is activated again and the execution of steps can be done without much attention. _____________________________________________________________________________________ © 2013 Pyramid Productions Tower of London Test version 3.0 build 6.0 – Manual ____________________________________________________________________________________19 3. Norm research and psychometric characteristics ______________________________________________________ 3.1. Norm research of the TLT The norms have been collected, as happens often, rather opportunistically. There has not been a carefully planned and randomly stratified norm search study. No, instead, in 1994 it was decided to carefully collect all data of the TLT in patients who were being tested in standard patient care neuropsychological assessment. Then a plan was made to collect TLT data from normal (healthy) controls. The resulting norm groups therefore consist of 2 large groups: a group of healthy controls (N=260) and a group of neurological patients (N=912). There also exists a small group of Whiplash Associated Disorders type II patients (n=19) with no known neurological damage. N.B.: The norms collected below are only valid for the 12 items version. That is because for the 16 items version of the TLT there are not enough people who have taken this long version. The usage of the TLT is not hindered by this fact because both the scores for the 12 items edition and the 16-items version are being registered. The healthy control group (N=260) without known and verified brain damage (now and in the past) consists of 4 groups: a group of volunteers in Voorhout (a small place in the Netherlands near Leiden) who participated in a voluntary norm research study, recruited via a local newspaper ad at the end of 1997 and the beginning of 1998 (N=39). Other healthy controls participated in the years thereafter and were drawn from family members of patients, employees of the Rehabilitation Centre Zeehospitium in Katwijk aan Zee (and later in Leiden, N=32) and a group of volunteers collected via Internet in 2005 (n=16). The largest group of healthy controls came from a study at the University of Leuven in Belgium, where students had to take tests like the TLT (N=173). The Internet group was collected in the following way: on a website they were stimulated to download the TLT and install this programme on their computer at home. The test was programmed so that it installed itself automatically and started itself as well. The instructies were written on the screen. Furthermore, the test could only be done once, to prevent multiple learning trials. After taking the test, people could send the coded data to me so that I could translate these data into readable data. Their results were returned via email in which also was verified if they had done the test according to the instructions, or if they really did not have any brain damage (now or earlier in life), and if they did not use any medication that could interfere with their attention. Only if it was absolutely certain these people had followed the instructions and met the selection criteria (not having brain damage, not using medication), their test results were collected for this norm study. Furthermore, an extra control was made. The group of Internet people were statistically compared to the larger group of healthy controls on the 4 main TLT indices and on the demographic data like gender, education and age. On all four TLT variables there was a significant difference between both groups: TLTscore and AO1 (p <.05), and DT1 and TT1 (p <.01). The Internet-people were better on the TLTscore (mean 12.7% better), and Number st solved at the 1 attempt (AO1) (mean: 1.4 higher). There were also quicker in solving the TLT: respectively 6.3 (DT1) and 11.5 (TT1) seconds faster than the other healthy controls. The demographic data showed that the Internetgroup was significantly younger (mean 14.4 yrs), higher educated (6.4 versus 5.0), and there were more women than men. This shows that the Internetgroup is much younger and more clever. However, this was not considered to exclude this group from the other healthy controls so a large group of 260 people was formed. To see if the norm collection during all those years since 1994 has altered the norms itself, a statistical difference analysis was made. The healthy control group before 2003 (n=65) and the group after this date (n=195) were compared. Only speed differed: the group after 2003 was on the average 6.7 seconds faster on DT1 and (mean) 12.0 seconds faster on TT1. This probably has to do with the fact that the group áfter 2003 was significantly younger (mean 27.5 yrs) and higher educated (mean 6.0 versus 5.5). However, on planning capacity both groups did NOT differ. _____________________________________________________________________________________ © 2013 Pyramid Productions Tower of London Test version 3.0 build 6.0 – Manual ____________________________________________________________________________________20 Further analysis revealed that only Education has a very small but significant linear correlation with the TLTscore (Spearman’s rho= .15, Kendall’s tau_b=.12, both p<.05). So, the higher the education the larger the chance that the TLT is being done perfectly (see Figure 8). The correlation between age and decision time is significant as well, and much higher than with the TLTscore: Spearman’s Rho=.50, Pearson’s R=.70, p<.01. The same goes for the Total time spent to solve the test item: .77 (Pearson’s R) and .50 (Rho). N.B.: because the TLTscore has no significant correlation with age, age-related norm scores were not considered appropriate. 100,0 75,0 TLTscore 50,0 R-Square = 0,03 25,0 2 4 6 Education according to Verhage (1-7) Figure 8. The weak but significant correlation (R=.17, p<.01) between Education and TLTscore in the healthy group (N=260) 10 0,0 TLTscore 75 ,0 50 ,0 R-Square = 0,01 25 ,0 20 ,0 0 40 ,0 0 60 ,0 0 80 ,0 0 Le eftijd in jaren Figure 9. The non-significant relationship (R=-.08) between Age and TLTscore _____________________________________________________________________________________ © 2013 Pyramid Productions Tower of London Test version 3.0 build 6.0 – Manual ____________________________________________________________________________________21 Healthy NORMAL Controls (N=260): 140 120 100 Freq 80 60 40 20 0 115 79 24 11 4 13 10 3 1 14-19 20-29 30-39 40-49 50-59 60-69 70-79 80-89 90-99 Age Figure 10. Age distribution in the Healthy NORMAL controls (N=260): mean 28.3 yr (14-93 yr), SD= 16.8 Table II. Distribution of Gender in the group HEALTHY CONTROLS (N=260) Gender: 1 =male; 2 =female Valid 1 2 Total Table III. Frequency 71 Percent 27,3 Valid Percent 27,3 189 260 72,7 100,0 72,7 100,0 Cumulative Percent 27,3 100,0 Distribution of Education in the Healthy NORMAL controls (N=260); mean: 5.89 (range: 3-7), SD=.66 Education according to Verhage system (1 t/m 7) Valid 3 4 Frequency 6 6 Percent 2,3 2,3 Valid Percent 2,3 2,3 Cumulative Percent 2,3 4,6 5 18 6,9 6,9 11,5 6 211 81,2 81,2 92,7 100,0 7 Total 19 7,3 7,3 260 100,0 100,0 _____________________________________________________________________________________ © 2013 Pyramid Productions Tower of London Test version 3.0 build 6.0 – Manual ____________________________________________________________________________________22 Table IV. Percentiles of most important variables HEALTHY controls (N=260) Statistics N Valid Missing Mean Std. Error of Mean Median Std. Deviation Skewness Std. Error of Skewness Kurtosis Std. Error of Kurtosis Minimum Maximum Percentiles 5 10 20 30 40 50 60 70 80 90 95 TLTscore 260 0 74,581 ,8203 75,400 13,2277 -,142 ,151 -,335 ,301 39,9 100,0 50,700 57,350 63,160 67,400 71,000 75,400 78,300 81,900 86,060 92,800 99,045 Number correct st at 1 attempt o AO1 260 0 8,67 ,107 9,00 1,733 -,114 ,151 -,369 ,301 4 12 6,00 6,00 7,00 8,00 8,00 9,00 9,00 10,00 10,00 11,00 12,00 Mean Decision time DT1 259 1 6,176 ,2386 4,800 3,8401 1,615 ,151 3,056 ,302 1,8 24,9 2,400 2,700 3,200 3,600 4,200 4,800 5,900 7,000 9,100 11,600 14,200 Mean total time TT1 259 1 12,714 ,4217 10,200 6,7859 2,548 ,151 11,826 ,302 5,6 62,5 6,600 7,100 7,900 8,700 9,600 10,200 11,500 13,400 17,400 22,100 25,400 _____________________________________________________________________________________ © 2013 Pyramid Productions Tower of London Test version 3.0 build 6.0 – Manual ____________________________________________________________________________________23 The neurological norm group consists of 912 patients with varying neurological disorders. Here they are differentiated in 4 major groups: Right Hemisphere Stroke patients (RH-Stroke, N=271), Left Hemisphere Stroke (N=288), severe Traumatic Brain Injury (TBI), N=99, and Other Neurological deficits (N=254). This last group consisted of disorders like hypoxia/anoxia/postanoxic encephalopathy (n=52), meningitis, Parkinson’s disease, encephalitis, systemic lupus erythematosis (n=17), tumour (n=29, with or without extirpation and radiation), brain stem stroke (n=15), mild traumatic brain injury (n=13), multiple sclerosis (n=33), cerebellar infarction (n=20), some form of dementia (n=9), epilepsy and other lesser known neurological diseases (n=66). There is also a small group of 19 patients with the Chronic Whiplash Associated Syndrome (WAD) Type II, largely suffering from neck pain but no confirmed neurological damage. The neurological group (and WAD) data were collected with the help of 2 rehabiliation centers. Since the end of 1994 the rehab center in Katwijk (since 1-4-2003 in Leiden) it was the in-treatment and daycare-group (N=912). In 2003 the rehab center in Arnhem Groot Klimmendaal provided some more patients with mostly a severe TBI (n=11). To check whether the norm collection since 2003 had any influence on the norm data for the neurological group (N=912), a difference analysis was performed on the data of 2002 and earlier (N=483) and the data of 2003 and later (N=429). On only one major variable (DT1: st decision time at the 1 attempt) there was a significant (p<.05) difference of 1.5 seconds in favor of the group 2003 and later. On the demographic variables Age, Sex and Education there were no significant differences. It may be concluded that the norm groups did not have changed significantly across time. This would not be expected theoretically because in this time period there has not been any change in admission policies in the two rehab centers. Furthermore, there is not much reason to assume that many more patients of the same type would change these norm data significantly. However, it would be wise to collect more data on all different age levels to further study the relation between age and TLT performance. Below the demographic data of the 4 major patient groups (RH-stroke, LH-stroke, TBI and Other) and the WAD-group will be displayed (Age, Sex and Educational level). The RH-Stroke group (N=271): Figure 11. Distribution of Age in the RH-Stroke group (N=271): mean is 58.3 yr (range 2581 yr), SD=11.6 _____________________________________________________________________________________ © 2013 Pyramid Productions Tower of London Test version 3.0 build 6.0 – Manual ____________________________________________________________________________________24 Table V. Distribution of Gender in the RH-Stroke group (N=271) Gender: 1 =male; 2 =female Valid 1 Frequency 161 Percent 59,4 Valid Percent 59,4 110 271 40,6 100,0 40,6 100,0 2 Total Table VI. Cumulative Percent 59,4 100,0 Distribution of Education in the RH-Stroke group (N=271): mean 4.6, (range 1-7), SD=1.3 Education according to Verhage (1 t/m 7) Valid Frequency 2 1 Percent ,7 Valid Percent ,7 Cumulative Percent ,7 2 8 3,0 3,0 3,7 3 46 17,0 17,0 20,7 4 68 25,1 25,1 45,8 5 71 26,2 26,2 72,0 6 60 22,1 22,1 94,1 7 16 5,9 5,9 100,0 271 100,0 100,0 Total Table VII. Percentiles of most important variables in the RH-Stroke group (N=271) Statistics AO1 N Valid Missing DT1 TT1 TLTscore 271 271 270 0 0 1 13,106 267 4 Mean 61,842 7,24 Std. Error of Mean 1,2497 ,137 ,5175 ,9514 Median 65,900 8,00 11,100 22,000 20,5729 2,248 8,5034 15,5463 -,759 -,579 3,080 2,664 Std. Error of Skewness ,148 ,148 ,148 ,149 Kurtosis ,130 ,021 14,451 9,761 Std. Error of Kurtosis ,297 Std. Deviation Skewness 25,992 ,295 ,295 ,295 Minimum 5,1 1 3,9 9,3 Maximum 100,0 12 74,5 122,9 5 17,960 3,00 5,210 11,440 10 29,840 4,00 5,900 13,460 20 47,800 6,00 7,600 15,760 30 52,900 6,00 8,700 17,140 40 60,100 7,00 9,640 19,400 50 65,900 8,00 11,100 22,000 60 69,600 8,00 12,300 24,460 70 75,300 9,00 14,270 26,960 80 79,000 9,00 16,480 32,480 90 85,360 10,00 21,270 43,580 95 88,980 10,00 28,570 53,140 Percentiles _____________________________________________________________________________________ © 2013 Pyramid Productions Tower of London Test version 3.0 build 6.0 – Manual ____________________________________________________________________________________25 The LH-Stroke group (N=288): Figure 12. Distribution of Age in the LH-Stroke group (N=288): mean 57.7 yr, range 2383 yr, SD 13.2 Table VIII. Distribution of Gender in the LH-Stroke group (N=288) Gender: 1 =male; 2 =female Valid Missing 1 Frequency 164 Percent 56,9 Valid Percent 57,1 Cumulative Percent 57,1 2 123 42,7 42,9 100,0 Total 287 1 99,7 ,3 100,0 288 100,0 System Total Table IX. Distribution of Education in the LH-Stroke group (N=288): mean 4.7, range 2-7, SD=1.2 Education according to the Verhage system (1-7) Valid 2 Frequency 6 Percent 2,1 Valid Percent 2,1 Cumulative Percent 2,1 3 42 14,6 14,7 16,8 4 71 24,7 24,8 41,6 5 93 32,3 32,5 74,1 6 53 18,4 18,5 92,7 7 21 7,3 7,3 100,0 286 99,3 100,0 Total Missing Total System 2 ,7 288 100,0 _____________________________________________________________________________________ © 2013 Pyramid Productions Tower of London Test version 3.0 build 6.0 – Manual ____________________________________________________________________________________26 Table X. Percentiles of most important variables in the LH-Stroke group (N=288) Statistics AO1 N Valid Missing TLTscore 288 0 TT1. DT1 288 0 288 0 288 0 Mean 60,875 7,16 Std. Error of Mean 1,3340 ,147 ,5717 ,9853 Median 64,500 7,00 12,400 23,450 22,6384 2,499 9,7027 16,7205 -,717 -,511 2,726 2,616 ,144 ,144 ,144 ,144 -,136 -,323 9,359 8,526 ,286 ,286 ,286 ,286 Std. Deviation Skewness Std. Error of Skewness Kurtosis Std. Error of Kurtosis 15,079 28,063 Minimum 4,3 1 3,5 10,2 Maximum 100,0 12 66,7 123,0 5 13,000 2,00 5,845 13,125 10 23,900 3,00 7,490 15,190 20 44,760 5,00 8,580 17,480 30 52,900 6,00 10,270 19,440 40 59,400 7,00 11,400 21,260 50 64,500 7,00 12,400 23,450 60 69,600 8,00 14,340 25,440 70 75,400 9,00 16,100 28,460 80 80,400 9,00 18,620 34,220 90 86,280 10,00 23,210 46,090 95 92,000 11,00 33,445 61,040 Percentiles _____________________________________________________________________________________ © 2013 Pyramid Productions Tower of London Test version 3.0 build 6.0 – Manual ____________________________________________________________________________________27 The TBI group (N=99): Figure 13. Distribution of Age in the TBI group (N=99): mean 39.9 yr, range 14-78, SD=16.8 Table XI. Distribution of Gender in the TBI group (N=99) Gender: 1 =male; 2 =female Valid Cumulative Percent 68,7 1 Frequency 68 Percent 68,7 Valid Percent 68,7 2 30 30,3 30,3 99,0 5 1 1,0 1,0 100,0 99 100,0 100,0 Total Table XII. Distribution of Education in the TBI group (N=99): mean 4.7, range 2-7, SD=1.3 Education according to Verhage (1 t/m 7) Valid 2 3 4 Frequency 3 12 Percent 3,0 12,1 Valid Percent 3,0 12,1 Cumulative Percent 3,0 15,2 30 30,3 30,3 45,5 5 26 26,3 26,3 71,7 6 19 9 19,2 9,1 19,2 9,1 90,9 100,0 99 100,0 100,0 7 Total _____________________________________________________________________________________ © 2013 Pyramid Productions Tower of London Test version 3.0 build 6.0 – Manual ____________________________________________________________________________________28 Table XIII. Percentiles of most important variables in the TBI group (N=99) Statistics AO1 N Valid Missing DT1 TT1 TLTscore 99 99 98 98 0 0 1 1 Mean 70,100 8,16 9,968 Std. Error of Mean 1,7197 ,191 ,5418 ,8968 Median 71,000 8,00 8,600 17,050 17,1112 1,904 5,3635 8,8779 -,969 -,571 1,654 1,977 ,243 ,243 ,244 ,244 1,667 1,089 2,813 4,734 Std. Error of Kurtosis ,481 ,481 ,483 ,483 Minimum 11,6 2 3,4 8,6 Maximum 100,0 12 28,4 55,6 5 34,800 5,00 4,095 10,085 10 53,600 6,00 4,500 11,770 20 58,000 7,00 6,080 13,280 30 63,000 7,00 7,170 14,700 40 68,100 8,00 7,800 15,480 50 71,000 8,00 8,600 17,050 60 75,000 9,00 9,500 18,640 70 79,700 9,00 10,900 20,690 80 86,100 10,00 12,520 23,440 90 91,300 11,00 17,080 31,140 95 92,000 11,00 22,765 36,065 Std. Deviation Skewness Std. Error of Skewness Kurtosis Percentiles 19,486 _____________________________________________________________________________________ © 2013 Pyramid Productions Tower of London Test version 3.0 build 6.0 – Manual ____________________________________________________________________________________29 The OTHER neurological group (N=254): Figure 14. Age distribution in the OTHER neurological group (N=254): mean 51.5 yr, range 12-81, SD=15.9 yr Table XIV. Distribution of Gender in the OTHER neurological group (N=254) Gender: 1 =male; 2 =female Valid 1 Frequency 144 Percent 56,7 Valid Percent 56,7 110 254 43,3 100,0 43,3 100,0 2 Total Table XV. Cumulative Percent 56,7 100,0 Distribution of Education in the OTHER neurological group (N=254): mean 4.9, range 1-7, SD=1.2 Education according to Verhage (1 - 7) Valid Percent 1,2 7 18 2,8 7,1 2,8 7,1 4,0 11,1 5 63 87 24,8 34,3 25,0 34,5 36,1 70,6 6 52 20,5 20,6 91,3 7 22 8,7 8,7 100,0 252 99,2 100,0 1 2 3 4 Total Missing Total System 2 ,8 254 100,0 Valid Percent 1,2 Cumulative Percent 1,2 Frequency 3 _____________________________________________________________________________________ © 2013 Pyramid Productions Tower of London Test version 3.0 build 6.0 – Manual ____________________________________________________________________________________30 Table XVI. Percentiles of most important variables in the OTHER neurological group (N=254) Statistics N Valid Missing TLTscore 254 0 DT1 AO1 254 0 TT1 254 254 0 0 Mean 65,282 7,65 13,078 24,743 Std. Error of Mean 1,1422 ,127 ,5402 ,9334 Median Std. Deviation Skewness 67,050 8,00 10,750 20,550 18,2029 2,023 8,6090 14,8754 2,968 -,738 -,359 3,459 Std. Error of Skewness ,153 ,153 ,153 ,153 Kurtosis ,515 -,168 19,795 11,886 Std. Error of Kurtosis ,304 ,304 ,304 ,304 8,0 2 3,2 9,3 Minimum Maximum Percentiles 100,0 12 82,7 119,7 5 31,875 4,00 5,475 12,000 10 39,150 5,00 6,050 13,550 20 50,700 6,00 7,600 15,200 30 58,000 7,00 8,550 16,850 40 64,500 7,00 9,800 18,600 50 67,050 8,00 10,750 20,550 60 71,700 8,00 12,400 22,400 70 76,100 9,00 13,850 25,050 80 81,100 9,00 17,100 31,400 90 86,200 10,00 21,600 39,700 95 91,300 11,00 28,200 49,425 _____________________________________________________________________________________ © 2013 Pyramid Productions Tower of London Test version 3.0 build 6.0 – Manual ____________________________________________________________________________________31 The WHIPLASH type II group (N=19): Figure 15. Distribution of Age in the WHIPLASH group (N=19): mean 32.8 yr, range 18-52 yr, SD=11.2 Table XVII. Distribution of Gender in the WHIPLASH group (N=19) Gender: 1 =male; 2 =female Valid 1 Frequency 3 Percent 15,8 Valid Percent 15,8 Cumulative Percent 15,8 2 16 84,2 84,2 100,0 Total 19 100,0 100,0 Table XVIII. Distribution of Education in the WHIPLASH group (N=19): mean 5.7, range 4-7, SD=.885 Education according to Verhage (1 t/m 7) Valid 4 Frequency 1 Percent 5,3 Valid Percent 5,3 Cumulative Percent 5,3 47,4 5 8 42,1 42,1 6 6 31,6 31,6 78,9 7 Total 4 21,1 21,1 100,0 19 100,0 100,0 _____________________________________________________________________________________ © 2013 Pyramid Productions Tower of London Test version 3.0 build 6.0 – Manual ____________________________________________________________________________________32 Table XIX. Percentiles of most important variables in the WHIPLASH group (N=19) Statistics N Valid Missing TLTscore 19 0 AO1 TT1 DT1 19 0 18 18 1 1 Mean 83,379 9,11 13,150 23,106 Std. Error of Mean 2,7485 ,285 1,3731 1,9912 Median 86,100 9,00 12,050 20,700 11,9805 1,243 5,8257 8,4479 -1,237 -,026 1,192 1,506 ,524 ,524 ,536 ,536 Std. Deviation Skewness Std. Error of Skewness Kurtosis Std. Error of Kurtosis ,680 -,757 ,840 1,485 1,014 1,014 1,038 1,038 14,0 Minimum 55,8 7 6,9 Maximum 94,4 11 27,6 44,7 5 55,800 7,00 6,900 14,000 10 60,100 7,00 7,080 16,250 20 78,300 8,00 7,840 16,700 30 80,600 8,00 9,230 17,610 40 83,300 9,00 10,880 19,400 50 86,100 9,00 12,050 20,700 60 91,700 9,00 12,920 21,780 70 91,700 10,00 13,370 22,290 80 94,200 10,00 19,820 31,020 90 94,400 11,00 22,740 38,130 95 94,400 11,00 27,600 44,700 Percentiles For an overview of the distribution of the TLTscore in the 6 larger groups (Healthy=0, StrokeRight=1, Stroke-Left=3, TBI=5, WAD=7 and OTHER=15) Figure 16 below is quite informative. You can clearly see that most distributions are not normally distributed, except for the Healthy controls, TBI and the WAD groups (determined with the Kolmogorov-Smirnov test). However, the WAD group is too small to do these kind of normality tests with. _____________________________________________________________________________________ © 2013 Pyramid Productions Tower of London Test version 3.0 build 6.0 – Manual ____________________________________________________________________________________33 0 1 3 5 7 15 Count 30 20 10 0 Count 30 20 10 0 25,0 50,0 75,0 100,0 25,0 50,0 TLTscore 75,0 100,0 25,0 50,0 TLTscore 75,0 100,0 TLTscore Figure 16. Frequency distributions of the TLTscore in the 6 groups 0 1 3 5 7 15 Count 60 40 20 0 Count 60 40 20 0 2 4 6 8 10 Aantal in 1 keer goed 2 4 6 8 10 Aantal in 1 keer goed 2 4 6 8 10 Aantal in 1 keer goed Figure 17. Frequency distributions of AO1 (number of items solved at the 1st attempt) in the 6 groups Just for comparison purposes Figure 17 shows the AO1 variable. This variable was used by Shallice in his original article about the Tower of London Test. Remarkably this index did not _____________________________________________________________________________________ © 2013 Pyramid Productions Tower of London Test version 3.0 build 6.0 – Manual ____________________________________________________________________________________34 show any normality distribution in most groups, only in the very (too) small WAD group. In the other indices DT1 and TT1, which represent the time taken to complete the task, the same findings were seen: no normality. Figure 18 shows the distribution of the DT1 index (very similar to that of the TT1 index). 0 1 3 5 7 15 Count 100 75 50 25 0 Count 100 75 50 25 0 10,0 20,0 30,0 40,0 50,0 gem.decisietijd (DT1) 60,0 10,0 20,0 30,0 40,0 50,0 gem.decisietijd (DT1) 60,0 10,0 20,0 30,0 40,0 50,0 60,0 gem.decisietijd (DT1) Figure 18. Frequency distributions of DT1 (mean decision time in items solved at the 1st \ attempt) in 6 groups 3.2. Intermezzo about statistics: normal distributions, probability distributions and reliability intervals ______________________________________________________ Probably the reader wonders why frequency distributions are so important. In statistics it is assumed that most variables in tests are normally distributed. However, this is by far not the case in many tests. Especially not in screening tests which have been developed so that the scores are heavily skewed (against a 100% score). The significance of a normal distributed variable lies in the fact that only then you can use a probability distribution. With a so-called Zor T-score (a standardized score, respectively with a mean of 0 or 50 and a standard deviation of 1 or 10), you can use such a probability distribution to calculate the probability or likelihood that the attained score will show up. For example, a Z-score of 1.96 means that the score is 1.96 standard deviations away from the population mean. Such a score has a chance or probability of only 0.025 (2.5%) to occur in a normal population. Such a small probability is then (by definition) considered as non-significant. The chance of a score falling between a Z-score of -1.96 and 1.96 is 1 – (2x 0.025)=.95. That’s the reason that most cut-off scores of a test are centered around 2 standard deviations of the mean. Outside these 2 standard deviations a score is considered ‘abnormal’= not belonging to the ‘normal’ range (or to a healthy population). However, the whole line of reasoning here depends largely on the assumption of a normally distributed variable. With the Tower of London Test the classical variable AO1 is NOT normally distributed. However, the newly developed TLTscore IS normally distributed in the 260 normal controls. So this can serve as a probability model for the TLTscore. For a further discussion it is important to realize what one wants with a neuropsychological test score. In fact, the most common question in neuropsychological _____________________________________________________________________________________ © 2013 Pyramid Productions Tower of London Test version 3.0 build 6.0 – Manual ____________________________________________________________________________________35 diagnostics is whether the test results resemble a ‘normal’ profile. In other words: does the obtained score deviate significantly from the population a client is compared with? Does this client belong to a normal (healthy) population or not? More specifically, is a specific TLT score evidence for a planning disorder or not? Used in such a way, a neuropsychological tests becomes a detection instrument: can an abnormal state be detected or not? A second important question is: if there is an abnormal state of affairs, if there is a disorder, hów severe is this disorder? For this you will need a good comparison group, for example a group of brain injured patients. In this way, a test score can be interpreted more intelligently. A concrete example can illustrate my point: the group Normal controls is represented by the TLTscore with a mean of 74.58%. The standard deviation is 13.28. Suppose we convert an attained test score of 43.4% to a Z-score (43.4-74.58)/13.28= -2.35. With this Z-score we can calculate the probability that this score belongs to a group of normals or not. It turns out that in the Z-score probability distribution the probability of a Z-score of -2.35 is only .0099, a very small chance indeed. Such a score differs significantly (more than the 0.05% boundary) from the mean of the Normal controls group. So it is concluded that such a score represents an abnormal state: there is a planning disorder. 3.3. Discriminative power of the TLT: sensitivity and specificity A (neuropsychological) test has a certain discriminative power. That’s the diagnostic value of the test. This means that the test can detect as correctly as possible (sensitivity) and classifies correctly as possible which patient has a planning disorder or not (specificity). In medicine such discriminative power of a test is often determined with a so-called ‘gold standard’. A gold standard is a test that has shown with almost absolute certainty that there is a disease/disorder or not. For example, an MRI- or CT-scan that can show whether or not there is a tumor in the brain or not. A diagnostic screening test is often used to prevent more invasive techniques such as surgery. Within the field of neuropsychology this is almost always much more complex. First of all, there usually are not any ‘gold standards’. Cognitive deficits are measured indirectly and do not show a 1-to-1 relationship with tissue damage. Secondly, the overlap with ‘normal’ cognitive processes is usually much larger then in physical diseases (although there also are quite a few overlapping areas between what is healthy and not). Therefore, normally one determines a certain cut-off point so that a clinician can conclude if there is an abnormality or not. This cut-off point is usually the 5% boundary: there has to be a 5% or less probability of a score X. This score X is then the cut-off point. Fortunately, we have mathematical methods to find these cut-off points as optimally as possible. Ideally, both sensitivity and specificity should be as high as possible. In a test we have a so-called positive predictive value (the probability of a disorder when the test result is positive) and the negative predictive value (the probability of NOT having a disorder when the test result is negative). Before you can calculate these values an optimal cut-off point has to be found. With the TLT this was determined as follows. Unfortunately, with planning disorders there still isn’t a ‘gold standard’. So here I have used a hypothesized gold standard. The reasoning is as follows: it has to be sure that many healthy people score highly of a specific test variable. Within the TLT there are only two variables of interest that represent the concept ‘planning’: the TLTscore and the AO1 score. The AO1 score is the most skewed of the two scores: most healthy controls score fairly high on this test variable (mean 8.67 and median 9.00). You can use this score as the ‘gold standard’ score for a planning disorder. Choose a 95% cut-off score, I mean: 95% of all scores should fall above a certain cut-off score. This cut-off score is 6.00 for the AO1 variable. Meaning, with a score of 6.0 or lower one certainly has a planning disorder because such low scores are not seen in healthy controls (well, at least with a probability of 5% or lower). A technique like the Receiver Operating Curve (ROC)-analysis can determine the most optimal cut-off point. For every cut-off point the sensitivity and specificity of the variable is calculated. Below you can see in Figure 19 that the ROC-curve has been calculated with different TLT-indices. It can be clearly seen that the time indices (DT1 and TT1) do not contribute very much to the sensitivity nor specificity of the TLT. However, as can be predicted, the new TLTscore does. Table XIX shows the diagnostic values: the bigger the area beneath the curve, the better it is. With the TLTscore _____________________________________________________________________________________ © 2013 Pyramid Productions Tower of London Test version 3.0 build 6.0 – Manual ____________________________________________________________________________________36 having an area of .974 it is obvious the best test index to have the highest predictive values. ROC Curve Source of the Curve 1,0 TLTscore DT1 0,8 TT1 Sensitivity 0,6 0,4 0,2 0,0 0,0 0,2 0,4 0,6 0,8 1,0 1 - Specificity Figure 19. The ROC-curve for 3 different TLT-indices in the sample of 1184 (7 missing) people. Table XX. The areas beneath the ROC-curves for the 3 different TLT-variables Area Under the Curve Test Result Variable(s) Area Asymptotic 95% Confidence Interval Std. Error Asymptotic b Sig. Lower Bound Upper Bound a TLTscore ,974 ,005 ,000 ,964 ,983 DT1 ,410 ,019 ,000 ,372 ,447 TT1 ,376 ,020 ,000 ,338 ,415 The test result variable(s): have at least one tie between the positive actual state group and the negative actual state group. Statistics may be biased. a. Under the nonparametric assumption b. Null hypothesis: true area = 0.5 _____________________________________________________________________________________ © 2013 Pyramid Productions Tower of London Test version 3.0 build 6.0 – Manual ____________________________________________________________________________________37 Based on this ROC-analysis the best cut-off point of the TLTscore is 56.85. Here you have the highest possible sensitivity and specificity. Sensitivity is 94.7% and specificity is 90.2%. N.B.: this cut-off point found with the ROC-analysis is different than the boundary one would find using the 5th percentile. This cut-off score would be 50.7%. So the ROCanalysis uses a more stringent cut-off point than the 5% boundary. TLTscore 55,450 56,150 sensitivity ,970 ,956 1-specificity ,129 ,119 56,850 ,947 ,098 57,600 58,350 59,050 ,936 ,925 ,916 ,088 ,081 ,078 In using this cut-off point of the TLTscore 56.85%, a 2x2 classification Table can be made to show how sensitivity, specificity and the number of false positives and negatives and the negative and positive predictive values are calculated. (see Table XXI). In SPSS you can use Crosstabs. N.B.: ROC graphs are made by using the values higher than the cut-off score. In the TLT and many other neuropsychological tests it is the other way around: a score lówer than the cut-off score usually means a ‘positive’ indication for a disorder. That is why the value under sensitivity in the row of the ROC-analysis is exactly the same value that is presented in the Classification Table under specificity. The value in this Table depicts the real sensitivity (so in the TLT it is 90.2%). Table XXI. ClassificationTable for the entire sample of 1184 people (7 missing): 260 normal controls, 905 neurological and 19 WAD patients disorder + true positive test + 266 false negative 29 all disease 295 N= 1184 people: 260 healthy, 905 neurological and 19 WAD falsepositive all test positives Positive predictive value:¹ 47 313 84,98 true negative all test negatives Negative predictive value:² 842 871 96,67 all healthy Everyone 889 1184 LR+: 17,0554634 pretest odds: 0,331833521 90,2% 94,7% 92,4% posttest odds 5,659574468 0,8498403 sensitivity specificity Pre-test Probability: 24,9% posttest odds with TLTscore as predictor: 0,744797786 0,4268677 The positive predictive value is the probability of a planning disorder if the test result is positive (in this case: 84.98% = posttest odds). The negative predictive value is the probability of NOT having a planning disorder if the test result is negative (in this case: 96.7%). De LR+ is the Likelihood ratio for a positive test result: the ratio between true positive and a false positive test result (see also Field, 2005; Howell, 2002). The larger this ratio, the better the test is. Because, the more real true positives and the lesser false positives, the better the test detects correctly a planning disorder. In the following Tables you can see that this LR can vary largely, depending on the population in which it is calculated. The pretest odds is the probability of a planning disorder _____________________________________________________________________________________ © 2013 Pyramid Productions Tower of London Test version 3.0 build 6.0 – Manual ____________________________________________________________________________________38 given the prevalence in a population (prevalence/(1-prevalence)). Above there is a 0.33 to 1 chance that there is a planning disorder. However, it is 5.7 against 1 (about 6/7=85.7%, the positive predictive value) that there is indeed a planning disorder if the test result is positive, with a prevalence in the population of 24.9%. The posttest odds is identical to the positive predictive value. So please be warned that the above Table XXI uses the whóle population! Below you can see in the different tables for the different populations that sensitivity and specificity vary depending on the prevalence in a population. That makes sense: when planning disorders are less common in a population it is also harder to detect them and the probability of a false positive test result increases. Table XXII. ClassificationTable for the sample of 260 Normal controls Planning disorder + true positive false positive test + 20 3 False negative true negative 7 230 all disease all healthy 27 233 260 NORMAL Controls all test positives : 23 86,96 all test negatives Negative predictive value: 237 97,05 everyone 260 LR+: 57,5308642 pretest odds: 0,115879828 74,1% 98,7% 86,4% posttest odds 6,666666667 0,8695652 sensitivity specificity Pre-test Probability: 10,4% In the Table XXII above you can see that with a prevalence of only 10.4% (in the sample of normal controls) the sensitivity of the TLT is only 74.1%. Compared with detecting a planning disorder in the total sample wherein the prevalence is twice as high (24.9%), that is a poor detection rate. The specificity however, remains high. Table XXIII. ClassificationTable for the sample of 288 Left-Stroke patients planning disorder + false true positive positive test + 89 15 false true negatief negative 9 175 all disease all healthy 98 190 288 Left-STROKE all test positives Positive predictive value: 104 85,58 all test negatives Negative predictive value: 184 95,11 everyone 288 LR+: 11,50340136 pretest odds: 0,515789474 90,8% 92,1% 91,5% posttest odds 5,933333333 0,8557692 sensitivity specificity Pre-test Probability: 34,0% _____________________________________________________________________________________ © 2013 Pyramid Productions Tower of London Test version 3.0 build 6.0 – Manual ____________________________________________________________________________________39 Table XXIV. Classification Table for the sample of 271 Right-STROKE patients planning disorder + false true positive positive test + 82 13 false true negatief negative 10 166 all disease all healthy 92 179 271 Right-STROKE all test positives Positive predictive value: 95 86,32 all test negatives Negative predictive value: 176 94,32 everyone 271 LR+: 12,27257525 pretest odds: 0,51396648 89,1% 92,7% 90,9% posttest odds 6,307692308 0,8631579 sensitivity specificity Pre-test Probability: 33,9% Table XXV. Classification Table for the sample of 99 Traumatic Brain Injury patiënts planning disorder + false true positive positive test + 14 3 false true negatief negative 0 82 all disease all healthy 14 85 99 TBI all test positives Positive predictive value: 17 82,35 all test negatives Negative predictive value: 82 100,00 everyone 99 LR+: 28,33333333 pretest odds: 0,164705882 100,0% 96,5% 98,2% posttest odds 4,666666667 0,8235294 sensitivity specificity Pre-test Probability: 14,1% Table XXVI. Classification Table for the sample of 19 WAD type II patients planning disorder + false true positive positive test + 0 1 False true negatief negative 0 18 all disease all healthy 0 19 sensitivity all test positives Positive predictive value: 1 all test negatives Negative predictive value: 18 everyone 19 LR+: pretest odds: 94,7% posttest odds specificity Pre-test Probability: 0,00 100,00 0 0,0% _____________________________________________________________________________________ © 2013 Pyramid Productions Tower of London Test version 3.0 build 6.0 – Manual ____________________________________________________________________________________40 Table XXVII. Classification Table for the sample of 254 OTHER neurological patients planning disorder + false true positive positive test + 61 12 false true negatief negative 5 176 all disease all healthy 66 188 OTHER neurology N=254 all test positives Positive predictive value: 73 83,56 all test negatives Negative predictive value: 181 97,24 everyone 254 LR+: 14,47979798 pretest odds: 0,35106383 92,4% 93,6% 93,0% posttest odds 5,083333333 0,8356164 sensitivity specificity Pre-test Probability: 26,0% From the above one can see that the sensitivity per group is relatively high, except where the prevalence is very low. In the WAD-group no sensitivity calculation could be made because there were no planning disorders in this small group sample. Furthermore, the positive predictive value is rather high (between 82 and 87%) in the neurological and healthy groups. The negative predictive value is even higher: between 94 and 100%. In other words: if the TLT result is negative (= no planning disorder) then the probability of having NO planning disorder is high. Remember that ‘planning disorder’ is defined here with the criterium AO1 is 6 or lower. This does not mean that there are no planning disorder at all. In clinical practice it can be found that there are indeed planning disorders on more abstract planning tasks, whereas the TLT does not show any planning disorder. Difference analyses: differences between groups The group Normal controls differs significantly on all 4 major test variables (TLTscore, AO1, DT1 and TT1) from the Right-STROKE group (respectively: 12.7%, 1.6, -7.0 sec, -13.3 sec in favor of the Normal group), from the Left-STROKE group (respectively 13.7%, 1.5, -8.9 sec, 15.3 sec), from the TBI group (respectively: 4.5%, 0.5, -3.8 sec, -6.8 sec), and from the OTHER neurological group (respectively: 9.3%, 1.0, -6.9 sec, -12.0 sec). The difference with the very small group WAD (N=19) is significant as well except on the variable AO1. And this difference is contrary to the expectations: the WAD group does a better job on the TLT than the Normal controls! (Differences in TLTscore: -8.8%, DT1: -7.0 sec, and TT1: -10.4 sec). The differences between the TBI group and the other two STROKE groups, the WAD group and the OTHER group are significant. The TBI group performs better on all variables. The only exception is the WAD group that outperforms every group. Between the 2 STROKE groups no significant differences were found. In summary: The TLT seems to be able to differentiate between different neurological groups. Especially the TBI group outperforms the Stroke groups and the OTHER neurological group. Predicting the probability of a ‘planning disorder’ strongly depends on what boundary one chooses. In general, a 2 SD boundary (in fact 1.96 standard deviations) is chosen: a bit more than 95% of the scores in a normal group is considered to be ‘healthy’. In other words, a 5% percentile or lower score within a group of normals can be considered a cut-off point for having a planning disorder. Using this point the TLTscore in the normal sample is 50.7%. Because the TLTscore is the only test variable that is normally distributed, we can use this to calculate probabilities. We can convert all scores to a Z-score with a mean of 0 and a SD of 1. With the zscore Table we can determine a percentile with every test score. Furthermore, we can calculate reliability intervals: the probability of a score between value A and B. For example, 95% of all normal scores fall between X=mean ± 1.96*SD. In the Normal Controls group this is: 74.58 ± 1.96*13.23 = 74.58 ± 25.93= 48.65 <= X <= 100. A _____________________________________________________________________________________ © 2013 Pyramid Productions Tower of London Test version 3.0 build 6.0 – Manual ____________________________________________________________________________________41 TLTscore of 48.65 or lower represents abnormal scores. That is almost identical to the 5th th percentile (in fact, the 5 percentile is somewhat less restrictive than the 2SD boundary). Earlier we saw that on the basis of a ROC-analysis the best cut-off point for the TLTscore was 56.85% (page 31). That was the point where the best sensitivity and specificity was reached. This th TLTscore is just below the 10 percentile within the Normal controls group. So it is more lenient th than the formal 5 percentile or 2SD boundary. Nevertheless, we consider this cut-off point as adequate for a planning disorder. In the TLT programme, the z-score will be calculated as well. In summary: Only the TLTscore is normally distributed in the Normal Controls group so we can calculate a z-score with the following formula: (X – 74.58%) Z = -------------------------13.23 _____________________________________________________________________________________ © 2013 Pyramid Productions Tower of London Test version 3.0 build 6.0 – Manual ____________________________________________________________________________________42 3.4. Reliability and validity ______________________________________________________ 3.4.1. Reliability Lezak (1995, p. 119) already points out why determining the reliability and validity of neuropsychological tests is a tedious enterprise. Test-retest reliability is a difficult concept for a test in which there are possible learning effects and one can consider a patients group not really stable over time. However, test-retest reliability remains a vital part of a good test. It can not be the case that the TLT shows very different test results when administered at different times. That said, it should also be noted that especially executive tests do not have a record of high test-retest reliabilities. That is because the essence of an executive test just is about challenging new problem solving skills in a patient. And such skills are bound to vary (almost by definition) each time the test is administered. Two studies have been done that shine a light on the test reliability of the TLT version 3.0. A pilot-study of A. Onderwater (2004) studied 27 neurological patients with a time interval of maximally 3 weeks in which several neuropsychological tests were administered. The following results were found: test-retest correlations for the TLTscore were .66 (Pearson’s R, p<.001, Spearman’s Rho=.54, p<.01), for the AO1 variable this correlation was .48, p<.05 (Spearman’s Rho=.52, p<.01), for the DT1 it was Pearson’s R=.48, p<.05 (Spearman’s Rho=.62, p<.01) and for the TT1 it was Pearson’s R=.44, p<.05 (Rho=.72). Considering the difference between the two types of correlation coefficients it seems that they are nog linear but curvilinear (for the DT1 and TT1). Furthermore, the TLTscore is more reliable than the AO1 score and this reliability is reasonable. In Onderwater’s study the increase on the TLTscore due to possible learning nd effects in only 3 weeks was 4.4% (mean: 61.0% versus 65.4% at the 2 administration) and non-significant. On the other test variables (AO1, DT1, TT1) these differences were very small and non-significant as well. So, the learning effect was not clearly visible within 3 weeks. Figure st nd 20 shows the correlation between the 1 and 2 TLTscore. 80,0 TLT score 2nd time 60,0 40,0 40,0 60,0 80,0 TLTscore 1st time Figure 20. Correlation between the TLTscore at the 1st and 2nd time in 27 neurological patients (Onderwater, 2004) _____________________________________________________________________________________ © 2013 Pyramid Productions Tower of London Test version 3.0 build 6.0 – Manual ____________________________________________________________________________________43 The second study in which test-retest reliability was studied was done by F. Kovács (from 1998 th to April 20 2007). Fifty-six neurological patients were found in which the TLT was administered twice with a mean interval of 15.4 weeks (median: 14 weeks, SD=5.6 weeks, range: 5-33 weeks). The correlations found are comparable with those found in the Onderwater study (2004). On the most important TLT variable TLTscore the Pearson’s R is .58, p<.001 (Spearman’s Rho=.53, p<.001), for the AO1 Pearson’s R=.53, p<.001 (Spearman’s Rho=.47, p<.001) and for the DT1 Pearson’s R=.12 n.s. (Spearman’s Rho=.23, n.s.). Unfortunately, testretest reliability has not been done in normal controls yet. In summary: several analyses tend to show a reasonable test-retest reliability of the most important TLT variable, the TLTscore, varying from .58 to .66 (the shorter the test-retest interval, the higher the correlation). For the variables DT1 and TT1 (the time variables) the test-retest correlations vary between .12 and .52 so that can not be considered as good enough for individual diagnostics. The classic TLT score AO1 has also a somewhat lower test-retest reliability score varying between .48 en .53. Another form of reliability, the split-half reliability, two halves of a test are compared. With the TLT this is not feasable because the difficulty level of the items gradually increases. The two halves can therefore not be considered as equal. However, there are always two items with the same difficulty level so the test can be split up in two halves using the even and odd item numbers. Two variables were made in SPSS: a first half in which the item numbers 1, 3, 5, 7, 9, 11 were used and a second half in which the item numbers 2, 4, 6, 8, 10, 12 were represented. In the healthy group (N=254) and as well in the group of neurological patients (N=231) these split-half correlations were very low: respectively Pearson’s R=.11 (n.s., p=.08) and .16 (p<.01). A Cronbach’s alpha reliability calculation shows an alpha of .30 (in the neurological group N=231) in which very low inter-item correlations were found (most under .10!). This is hardly surprising because in an executive test the items should all differ from each other in order to reduce any routine building. The same was true in the Normal controls group (N=254) in which Cronbach’s alpha was .36. Furthermore, it was remarkable that the odd items were slightly easier than the even numbered items (see Table XXVIII, the more points the better the item was done). Table XXVIII. Difficulty level of the TLT items in both healthy controls as in neurological patients (n=545); the higher the mean, the better the item was done Descriptive Stati stics N opgav e1score Opgav e2score opgav e3score opgav e4score opgav e5score opgav e6score opgav e7score opgav e8score opgav e9score opgav e10score opgav e11score opgav e12score Valid N (list wise) 545 545 543 542 537 527 520 518 514 510 503 502 502 Minimum 0 0 0 0 0 0 0 0 0 0 0 0 Maximum 6 6 9 9 15 12 12 12 15 15 15 15 Mean 5,44 5,79 8,69 6,94 8,61 7,54 11,22 6,18 12,31 9,84 7,89 7,04 Std. Dev iat ion 1,540 1,007 1,445 3,316 4,812 5,143 2,552 5,281 5,069 6,270 6,646 6,449 Variance 2,372 1,013 2,089 10,998 23,154 26,450 6,511 27,886 25,692 39,310 44,164 41,584 In summary: split-half reliability analyses and internal consistency analyses do not show a reliable item pool. This is hardly surprising since for an executive test all items should be different enough to trigger a constant new fresh problem solving mind-set. _____________________________________________________________________________________ © 2013 Pyramid Productions Tower of London Test version 3.0 build 6.0 – Manual ____________________________________________________________________________________44 3.4.2. Validity Validity can be divided in 2 major concepts (Evers et al., 2000, p. 1416): 1. Construct- or content validity. The construct (concept) of 'planning' has to be embedded in a theory about concentration in which the relationships between this concept (of attention) and others is considered. Construct validity is concerned with the question whether there are any relationships between the operationalisations of the constructs. Two extracted concepts of construct validity are convergent and divergent validity. Convergent validity concerns the relationship between a test and other tests measuring the same construct (e.g. TLT and the Porteus Mazes). Divergent validity concerns the relationship between a test and other tests measuring something else (e.g. the TLT and a memory test). 2. Criterion validity: This concerns the question how good a test score predicts a performance outside the test situation (in retrospect, right now or in the future). Usually, for clinical purposes, the predictive validity (predicting into the future) and the concurrent validity (predicting right now) are used. A criterion is chosen that has either a strong relation with the test score and of which the theory predicts that it is a good predictor of the to be measured construct. International studies show that the TLT (or TOL as it is usually referred to) is considered to be a planning task in which taking the initiative and the sequencing and monitoring of steps is essential (Beauchamp, Dagher, Aston & Doyon, 2003; Bull, Espy & Senn, 2004; Frauenfelder, Schuepbach, Baumgartner & Hell, 2004; Rainville, Amieva, Lafont, Dartigues, Orgogozo & Fabrigoule, 2002; Schall, Johnston, Lagopoulos, Jüptner, Jentzen, Thienel, Dittmann-Balçar, Bender & Ward, 2003; Van den Heuvel, Groenewegen, Barkhof, Lazeron, Van Dyck & Veltman, 2003). Especially the group of Unterrainer, Rahm, Kaller, Leonhart, Quiske, Hoppe-Seyler, Meier, Muller en Halsband (2004) has demonstrated that the TLT measures planning and problem solving and not something else. However, there is some criticism that will be considered later on (Kafer en Hunter, 1997). 3.4.2.1. Convergent validity of the TLT ______________________________________________________ As already mentioned by Shallice (1982) the TLT next to a planning component also has a visuospatial element. Furthermore, a working memory (attention) component has been found as well. Especially, impuls control has been mentioned as a critical factor in a succesful TLT score (Goel & Grafman, 1995; Bull et al., 2004). According to these task analyses there could be a relationship between WAIS Block Design, WAIS Digit forwards, Digit backwards, Block span and especially the Wisconsin Card Sorting Test and the Stroop task. It is even possible that several mental calculus tasks do show a correlation with the TLT. This remains to be seen (see the work of Unterrainer and colleagues in 2004 and 2005). Another observation in performing the TLT is that in planning several executive functions play an important role. Especially self-monitoring and self-correction seem to be important here. A relation between impuls control and TLT test scores has already been suggested (Bull et al., 2004; Goel & Grafman, 1995). The first pilot-study that demonstrated convergent validity in the TLT is the study of Onderwater (2004). Although only 27 neurological patients were studied, her data show the following correlations (Table XXIX) between tests that are supposed to overlap with the TLT: _____________________________________________________________________________________ © 2013 Pyramid Productions Tower of London Test version 3.0 build 6.0 – Manual ____________________________________________________________________________________45 Table XXIX. Correlations between the TLT, WAIS-R Digit Span (total score and backwards), RAVEN progressive matrices, Stroop Card III, TOSSA and the TODA in 27 neurological patiënts (Onderwater, 2004). Correlations digit span bckwards TLTscore TLTscore digit span backwards RAVEN digitspan total score stroop card 3 in Seconds TOSSA CS TODA Pearson Correlation Sig. (2-tailed) N Pearson Correlation Sig. (2-tailed) N Pearson Correlation Sig. (2-tailed) N Pearson Correlation Sig. (2-tailed) N Pearson Correlation Sig. (2-tailed) N Pearson Correlation Sig. (2-tailed) N Pearson Correlation Sig. (2-tailed) N 1 28 ,614** ,001 27 digitspan total RAVEN ,614 ** ,555 ** ,001 27 1 27 stroop card 3 in Seconds TOSSA CS TODA ,509 ** -,186 ,300 ,555 ,006 23 ,007 27 ,363 26 ,120 28 ,253 6 ,620** ,912** -,401* ,641** ,463 ,002 22 ,000 27 ,042 26 ,000 27 ,355 6 ,582** -,118 ,448* ,154 ,005 22 ,610 21 ,032 23 ,770 6 1 -,300 ,630** -,079 ,000 27 ,882 6 ,555** ,620** 1 ,006 23 ,002 22 ,509** ,912** ,582** ,007 27 ,000 27 ,005 22 27 ,136 26 -,186 -,401* -,118 -,300 1 -,409* -,777 ,363 26 ,042 26 ,610 21 ,136 26 26 ,038 26 ,069 6 ,300 ,641** ,448* ,630** -,409* 1 ,807 ,120 28 ,000 27 ,032 23 ,000 27 ,038 26 28 ,052 6 ,555 ,463 ,154 -,079 -,777 ,807 1 ,253 6 ,355 6 ,770 6 ,882 6 ,069 6 ,052 6 6 23 **. Correlation is significant at the 0.01 level (2-tailed). *. Correlation is significant at the 0.05 level (2-tailed). It can clearly be seen that the TLT correlates especially with the Digit span backwards and Digit Span Total and the RAVEN Progressive Matrices Total score. The working memory component of the TLT is represented by the Digit Span. The logical problem solving component probably is represented by the RAVEN. The TLT does NOT correlate here with the attention component of the TOSSA (Test of Sustained Selective Attention, 2007) or of the TODA (Test of Divided Attention). The largest study to date into the convergent and divergent validity of the TLT is the one of Kovács (2007), conducted to get norms for the TLT and TOSSA (see manual TOSSA, 2012). In this study a total of 1278 people were analysed: 224 healthy controls, 972 neurological patients and 82 Whiplash Associated Disorder patients), over an extensive period of 12 years. Besides the TLT, other tests were administered and analysed as well. Such as WAIS-R Picture Arrangement, Digit span, Wisconsin Card Sorting Test, Rey Auditory Verbal Learning Test, all computerized editions. The non-computer (paper and pencil) tests are: the Trail Making Test and the Stroop Colour-Word test. The new tests were the Test of Sustained Selective Attention (TOSSA) and the Test of Divided Attention (TODA). Some tests were slightly adapted in their administration and scoring, due to the computerized format. These slight changes will shortly be discussed beneath. Then the correlations between all tests will be presented, first the convergent validity and then the _____________________________________________________________________________________ © 2013 Pyramid Productions Tower of London Test version 3.0 build 6.0 – Manual ____________________________________________________________________________________46 divergent validity. Finally, a factor analysis will be presented to study whether the construct ‘planning’ can be shown to correlate between the right tests. The Stroop Colour-Word test with 100 stimuli was administered according to the instructions in the norming study of Schmand, Houx and de Koning (2003). The largest difference is that the reading of the words takes place columnwise instead of row-wise. In more than 95% of the cases áll 100 words were spoken aloud and the Stroop Test was never interrupted halfways (as was possible in the Schmand study). This test was administered in 104 neurological patients. The variable used in the correlation matrix was the time in seconds of the Color-Word card. The Trail Making Test A and B was administered to 70 neurological patients who did not have any signs of visual field defects or a visual inattention. When an error was made the tester immediately gave this feedback so that the patient could restore the error. Meanwhile the timer continued. The variable analysed was the Trailmaking B in seconds. The Dutch version of the Rey Auditory Verbal Learning Test was administered via a computer. All words were clearly spoken aloud and digitalized in a MP3 file to ensure strict standardized presentation. This test was done with 195 neurological patients. The variables analysed were the total number of immediately recalled words (range: 0-75 and the number of correctly recognized words (range: 0-30). The WAIS-R Picture Arrangement was computerized as well and administered to 249 neurological patients. However, 3 ambiguous items were removed: Flirt, Fish and Taxi. The instructions were exactly the same as in the WAIS-R paper and pencil version but now the patient just had to point at the places where the pictures had to be put. The tester could move the pictures by using the mouse. This is a subtle difference with the paper and pencil version where it only matters in what sequence the pictures are laid down. In this computerized task, not only the sequence mattered but also the right kind of place and how quickly this was realized. This means that this version of Picture Arrangement becomes much more a planning task in which one has to plan ahead (before just moving the pictures around) to get the right sequence and places right. In this way, this task resembles much more the Tower of London test in which sequencing and planning ahead are important as well. Two variables were calculated in this task. The first is the normal raw score as calculated according to the WAIS-R instructions. The second variable was new (and used in the correlation matrix) and it represented both the number of moves and the number of rightly placed items (sequence). The formula was: Score = (2 * n of pictures on right position – abs[number of moves – correct minimum nr of moves]) / total number of points according to WAIS-R manual. An example: if there is an item with 5 pictures like ENTER and it needs a minimum of 4 moves to get the sequence and all positions right, and the patient has used 5 instead of 4 moves with all 5 positions correct the score is: 2*5 – abs(5-4)/66= 10-1= 9/66= 0.136. Times 100% is 13.6%. The score of 66 is the maximum score when using these 6 items (house, romeo, louie, enter, hunt, hill, robber). The range of this score is 0-100%. The WAIS-R Digit Span numbers were digitalized into a MP3 file to ensure strict standardized presentation of the numbers. It was administered to 363 neurological patients. Two variables were used in the analysis: the total raw score (range: 0-24) and the total raw score Backwards (range: 0-12). The Wisconsin Card Sorting Test was digitalized as well and two variables were analysed: the commonly used Perseverative Response (PR) and a new score: the number of times a rule was changed (maximum 6). This was put in this formula: (n of rule changes * 10 / 60)* 100%. When only colour and form were found the score could be: 2*10/60= 0.33*100= 33.3%. This test was administered to 238 neurological patients. The Test of Sustained Selective Attention (TOSSA) version 2.0 is a computerized continuous performance test (Kovács, Manual TOSSA, 2013). One has to detect a target of 3 beeps in groups of 2, 3 and 4 beeps and then press the space bar. In 8 minutes 240 stimuli are presented in which the interstimulus interval varies from high to low and backwards. Impulsive _____________________________________________________________________________________ © 2013 Pyramid Productions Tower of London Test version 3.0 build 6.0 – Manual ____________________________________________________________________________________47 responses to the 2 distractors are recorded as well. The variable used here is the CS (concentration strength) representing both the accuracy of detection of the target as well as the response inhibition. This test has been administered in 972 neurological patients. The Test of Divided Attention (TODA) is a newly developed computerized divided attention test (Kovács, Manual, 2009). On a computer screen a sum is displayed vertically (e.g. 2 + 3 = 5) and at the same time a group of 2, 3, or 4 beeps is heard (just as in the TOSSA test). The instruction is that a patient has to judge whether he hears 3 beeps and whether the sum is correct. Only 3 reactions are possible: 1. both are correct (i.e., the sum is correct and there were 3 beeps) 2. one is correct (either the sum or the 3 beeps) 3. both are wrong (i.e., the sum is incorrect and there were 2 or 4 beeps Reactions are possible via the arrow keys on the numerical keypad. (= both correct, ↓= only one is correct, = both are wrong) and only the 3 middle fingers of one (dominant) hand have to be used. This task requires quite some divided attention but is much easier than the Paced Auditory Serial Addition Task (PASAT). This TODA has been administered in 212 neurological patients. The Word Memory Test (Green, 2005) is a computerized memory test and has only been administered in 41 neurological patients because administration was started recently in 2006. Table XXX. Correlations between the TLT, WAIS-R Picture Arrangement, TrailMaking Test B, TOSSA, TODA, WAIS-R Digit Span (total score and backwards) and the Wisconsin Card Sorting Test in a group of neurological patients (N=390). Correlations TLTscore TLTscore plaatjesordenen percentage Trailmaking in sec; part B TOSSA CS TODA totaal perc. digit span cijf ers achteruit totale score digitspan WCST totaalgoed percentage Pearson Correlation Sig. (2-tailed) N Pearson Correlation Sig. (2-tailed) N Pearson Correlation Sig. (2-tailed) N Pearson Correlation Sig. (2-tailed) N Pearson Correlation Sig. (2-tailed) N Pearson Correlation Sig. (2-tailed) N Pearson Correlation Sig. (2-tailed) N Pearson Correlation Sig. (2-tailed) N 1 382 ,432** plaatjesord enen percentage Trailmaking in sec; part B ,432** -,388** ,000 232 ,001 67 1 -,609** ,000 58 TOSSA CS TODA totaal perc. ,347** ,321** digit span cijf ers achteruit totale score digit span WCST totaalgoed percentage ,318** ,298** ,239** ,000 382 ,000 144 ,000 287 ,000 289 ,000 223 ,462** ,389** ,346** ,376** ,487** ,000 248 ,000 103 ,000 192 ,000 193 ,000 182 ,000 232 248 -,388** -,609** 1 -,621** -,624** -,485** -,416** -,326* ,001 67 ,000 58 70 ,000 70 ,000 35 ,000 70 ,000 70 ,016 54 ,347** ,462** ,445** ,444** ,416** ,292** ,000 382 ,000 248 ,000 212 ,000 323 ,000 363 ,000 238 ,321** ,389** ,361** ,314** ,259** ,000 144 ,000 103 ,000 125 ,000 126 ,006 111 ,318** ,346** ,851** ,305** ,000 287 ,000 192 ,000 323 ,000 202 ,298** ,376** ,000 289 ,000 193 ,239** ,487** ,000 223 ,000 182 -,621** 1 ,000 70 972 -,624** ,445** ,000 35 -,485** ,000 70 -,416** ,000 70 -,326* ,016 54 ,000 212 1 212 ,444** ,361** 1 ,000 323 ,000 125 ,416** ,314** ,851** ,000 363 ,000 126 ,000 323 ,292** ,259** ,305** ,314** ,000 238 ,006 111 ,000 202 ,000 202 323 1 363 **. Correlation is signif icant at the 0.01 lev el (2-tailed). *. Correlation is signif icant at the 0.05 lev el (2-tailed). _____________________________________________________________________________________ © 2013 Pyramid Productions ,314** ,000 202 1 238 Tower of London Test version 3.0 build 6.0 – Manual ____________________________________________________________________________________48 In the above mentioned sample of 972 neurological patients Pearson´s R correlations have been calculated despite the non-normality of the many variables. Often the had to be used Spearman´s Rho correlation coefficient does not give very different results unless there are extreme outliers and the data are not linearly correlated. In Table XXX (above) the correlations between the TLT and several other tests can be seen. All correlations reach significance but the highest values are reached with the Picture Arrangement, the Trailmaking test, the TOSSA, TODA and the Digit Span. The relation with Picture Arrangement seems to be the most logical because of the planning aspect in this test. The correlations with the attention tests are understandable because the TLT draws upon concentration and divided your attention. 3.4.2.2. Divergent validity of the TLT ______________________________________________________ In Table XXXI zijn de correlaties te zien tussen de TLT en enkele neuropsychologische tests die duidelijk minder verband houden met de TLT. Indien de TLT een complexe executieve taak betreft welke meerdere aspecten in zich heeft, dan zullen functies als aandacht, werkgeheugen, logisch denken, verdelen van de aandacht en respons-inhibitie meer verband met de TLT houden dan functies als bijvoorbeeld: het opslaan van woorden in het geheugen en het herkennen van eerder aangeboden woorden. Dit wordt bevestigd in Table XXX. Duidelijk is te zien dat deze correlaties lager liggen dan die van de tests in Table XXIX. In Table XXXI the correlations between the TLT and other neuropsychological tests which are not supposed to measure planning, can be found. As can be seen, basic memory functions do not correlate well with the TLT. However, components of the TLT that tap into working memory, concentration and impuls control, seem to be related to test variables that are supposedly measuring such factors. But overall low of no correlations seem to exist between the TLT and tasks that do not measure planning skills. Table XXXI. Correlations between the TLT, the Dutch Rey Auditory Verbal Learning test, the Stroop Color-Word task, the Word Memory Test Item MC and the TOSSA Response-inhibition-variabele in a group of neurological patients (N=378). Correlati ons tltascore wt 15her wt 15t ot stroop kaart 3 in Seconden WMT MC item RIS blok1+2 Pearson Correlation Sig. (2-tailed) N Pearson Correlation Sig. (2-tailed) N Pearson Correlation Sig. (2-tailed) N Pearson Correlation Sig. (2-tailed) N Pearson Correlation Sig. (2-tailed) N Pearson Correlation Sig. (2-tailed) N tltascore 1 wt 15her ,117 382 ,117 ,117 179 ,188* ,011 180 -,110 ,277 99 ,292 ,064 41 ,278** ,000 378 ,117 179 1 194 ,679** ,000 194 -,267 ,076 45 ,707** ,001 18 ,131 ,069 194 wt 15t ot ,188* ,011 180 ,679** ,000 194 1 195 -,442** ,002 46 ,774** ,000 18 ,232** ,001 195 stroop kaart 3 in Seconden -,110 ,277 99 -,267 ,076 45 -,442** ,002 46 1 104 -,266 ,303 17 -,412** ,000 104 WMT MC item ,292 ,064 41 ,707** ,001 18 ,774** ,000 18 -,266 ,303 17 1 41 ,096 ,550 41 RIS blok1+2 ,278** ,000 378 ,131 ,069 194 ,232** ,001 195 -,412** ,000 104 ,096 ,550 41 1 966 *. Correlation is signif icant at the 0.05 lev el (2-t ailed). **. Correlation is signif icant at the 0.01 lev el (2-t ailed). A factor-analysis has been done to detect any clusters of test variables and to see whether these clusters make some theoretical sense. Figure 21 shows the 3 components, together they _____________________________________________________________________________________ © 2013 Pyramid Productions Tower of London Test version 3.0 build 6.0 – Manual ____________________________________________________________________________________49 explain more than 75% of the variance. The first component can be called Working Memory or better yet Attentional span. It is the maintaining of focus or maintaining relevant information in working memory without getting distracted. Tests like Digit Span and the TOSSA load on this factor. The second component can be called Planning: tests like the TLT, Picture Arrangement, the WCST and the detection variable of the TOSSA load on this factor. Probably the last variable represents the focus part of planning. The third component is the Verbal Memory component of the planning process, the Rey Auditory Verbal Learning test only loads on this one factor. One must be reminded that this factor-analysis was performed on only 79 neurological patients. Component Plot in Rotated Space Component 2 1,0 plordper tltscore ds mksttot 0,5 ris wt15her 0,0 digtotal wt15tot digback -0,5 -1,0 -1,0 -0,5 0,0 0,5 Componen t1 Figure 21. 1,0 1,0 0,5 0,0 -0,5 -1,0 nt 3 pone m o C Depicting three components after principal component factor-analysis in 79 neurological patients on the Dutch Rey Auditory Verbal Learning test (wt15), Picture Arrangement (plordper), Wisconsin Card Sorting Test (mksttot), TOSSA (ris and ds), Digit span (digtotal, digback) and the Tower of London Test (tltscore). In summary: both the correlation analyses and the factor analysis more or less show that the TLTscore has something to do with what can be called “planning”. Assuming that tests like Picture Arrangement and the Wisconsin Card Sorting test also measure relevant components of planning. _____________________________________________________________________________________ © 2013 Pyramid Productions Tower of London Test version 3.0 build 6.0 – Manual ____________________________________________________________________________________50 Table XXXII. The rotated component matrix belonging to Figure 21. 1st component=Attentional focus; 2nd component=Planning; 3rd component=Verbal Memory Rotated Component Matrixa tltascore mkst t otaalgoed percentage plaatjesordenen percentage totale score digitspan Digit span acht eruit score wais-r DetectieSterkte RIS blok1+2 wt 15t ot wt 15her 1 ,011 Component 2 ,767 3 ,070 ,181 ,421 ,327 ,032 ,774 ,274 ,901 -,066 ,175 ,859 -,017 ,212 ,624 ,749 ,197 ,038 ,561 ,251 ,227 ,125 -,047 ,003 ,855 ,880 Extraction Method: Principal Component Analy sis. Rotation Method: Varimax wit h Kaiser Normalization. a. Rotation conv erged in 5 iterations. 3.4.2.3. Validity problems of the TLT? ______________________________________________________ In the literature you can find some critical views about the content validity of the Tower of London test. One of the problems in judging a neuropsychological test is that there are so many variants of the test, both in research and in clinical practice (Unterrainer et al., 2003). A study that uses one variant of the test and bases its conclusions on this version, cannot be generalized as simply as one thinks to other test versions. Unterrainer et al. showed that the influence of instructions and cueing on the learning effect and the planning ability of the TLT is large. Kafer and Hunter (1997) criticize firmly the content validity of the TLT: it was supposedly too weak. They conclude this by using a variant of the TLT in which only the number of steps was measured, independent of the time. This means that the underlying construct “planning” probably wasn’t measured accurately because the instruction strongly suggested to just begin the task (and adjusting your actions only during the task performance). No hints were given about how many steps were needed for each item. Furthermore, a 3 and a 4-pen version of the TLT was used. Obviously, a 4-pen construction of the TLT is more difficult than a 3-pen version and can not be compared that easily. Thirdly, most of their TLT variables had a constricted range and that has a negative influence on the correlation with other test variables. Although the range of their timing variables was sufficiently large one can not just assume that a longer time spent on the TLT signifies planning (see Unterrainer, Kaller, Halsband and Rahm, 2006). Timing the TLT is common but does not seem to say much and does not add anything to the sensitivity of the TLT. Finally, Kafer and Hunter’s use of other tests is questionable. It can be doubted that the used tests have something in common with planning. An exception being the Six Elements test but this test has a very restricted scoring range (2-6). Another critical study about the merits of the TLT comes from Riccio, Wolfe, Romine, Davis and Sullivan (2003) shows hardly or no correlations between the TLT variables (Drexler University version) and other tests. Analysing this study it seems that very few test variables have been used that can be seen as reflecting planning ability. Of the WAIS-III only the full IQ score was used and 3 known variables of the Wisconsin Card Sorting test. The only variable to _____________________________________________________________________________________ © 2013 Pyramid Productions Tower of London Test version 3.0 build 6.0 – Manual ____________________________________________________________________________________51 show a small but significant relation with the total number of steps of the TLT (R=-.21) was the ‘failure to maintain set’ of the WCST. However, the used version of the TLT here differs from more commonly used versions in research and from the TLTscore used in this computerized TLT version. An especially important difference is that only one try is allowed in this Drexler version. A second problem is the use of the common variable “number correct during the first attempt”. The range of this variable is restricted (0-12). Another variable is the total number of steps used, no matter the time. However, it can be argued that such an operationalization has not much to do with actual planning or thinking ahead. It probably represents more of a sort of ‘trial and error’-strategy. Both Goel and Grafman (1995) and Newman et al. (2003) argue that there is a serious difference between planning before actually making some steps and the planning after having made the first step. Whenever a large amount of time is allowed to make the steps, a trial and error strategy cannot be ruled out. Another indication that planning ahead is not that easily used by healthy controls is the finding in the Kovács study that only 9 out of 12 st items were correct during the 1 attempt. In contrast to the above mentioned critical studies, several other studies show that the Tower of London task can actually differentiate between groups of patients and between children of different age groups on their planning abilities. A study of Rainville et al. (2002) shows that patients with Alzheimer’s disease perform worse on the TLT than healthy controls, controlling for differences in working memory, inhibition-strength or visuospatial problems. The study of Huizinga, Dolan, and van der Molen (2006) shows age differences in TLT performances that correspond with the theory that planning abilities only mature above the age of 20. However, differences in working memory and divided attention could not be ruled out. One of the most important and even funny studies into the criterium validity of the Tower of London test is the one of Unterrainer, Kaller, Halsband and Rahm (2006). If planning is indeed an important aspect of the TLT then chess players should do better on the TLT than healthy controls without any chess playing experience. That is exactly the case, especially on the items using 5 or more steps (up till a maximum of 7). _____________________________________________________________________________________ © 2013 Pyramid Productions Tower of London Test version 3.0 build 6.0 – Manual ____________________________________________________________________________________52 4. Possible criteria for detecting malingering with the TLT ______________________________________________________ Malingering is performing less than on the basis of one’s technical abilities seems possible, for whatever reason. In the Tower of London task this can sometimes be seen quite easily when a client performs rather worse on the simple items (1-4) than on the more complex items. However, during the TLT there is also a learning effect: most patients can have some difficulty with the first few items but then learn the right strategy and continue to perform better on the more difficult items. On the basis of these clinical experiences and the fact that indeed the last items of the TLT are more difficult than the first (see Figure 22), formulas can be constructed that can detect possible malingering efforts. The formula is based on the graph and the two tables below. Figure 22. Difficulty level of the TLT items in the HEALTHY controls group (N=257) and in the NEUROLOGICAL group (N=271). As can clearly be seen, the 2 groups start to differ more at 4 step-items (item 5 and higher). Based on the scores of 271 neurological patients (mainly stroke patiënts, some mild and severe TBI patients) and 257 healthy persons, it can clearly be seen that the gradual increase in difficulty of the TLT items is almost parallel in both groups. The patient groups have more trouble with the items 5 and higher, probably representing their planning problems after head injury. The mean score and standard deviation per item is shown in the two Tables below (Tabels XXXIII and XXXIV). _____________________________________________________________________________________ © 2013 Pyramid Productions Tower of London Test version 3.0 build 6.0 – Manual ____________________________________________________________________________________53 Table XXXIII. Mean score of the TLT items in the HEALTHY controls group (n=257) Descriptive Statistics N Item 1 Item 2 Item 3 Item 4 Item 5 Item 6 Item 7 Item 8 Item 9 Item 10 Item 11 257 257 257 257 257 257 257 257 257 257 255 254 254 Item 12 Valid N (listwise) Minimum 0 0 0 0 0 0 3 0 0 0 0 0 Maximum 6 6 9 9 15 12 12 12 15 15 15 15 Mean 5,25 5,75 8,88 7,14 9,52 8,47 11,77 6,47 13,40 10,49 8,73 6,96 Std. Deviation 1,785 1,115 ,952 3,167 4,240 4,814 1,354 5,246 3,965 5,959 6,571 6,534 Table XXXIV. Mean score of the TLT items in the NEUROLOGICAL group (n=271) Descriptive Statistics N Item 1 Item 2 Item 3 Item 4 Item 5 Item 6 Item 7 Item 8 Item 9 Item 10 Item 11 Item 12 Valid N (listwise) 271 271 269 268 263 253 246 244 240 236 231 231 231 Minimum 0 0 0 0 0 0 0 0 0 0 0 0 Maximum 6 6 9 9 12 12 12 12 15 15 15 15 Mean 5,62 5,81 8,52 6,67 7,58 6,65 10,63 5,90 11,00 8,82 6,96 7,10 Std. Deviation 1,247 ,927 1,767 3,483 5,192 5,314 3,278 5,303 5,877 6,540 6,610 6,357 As can be seen, item 7 is somewhat easier than item 6. Item 8 seems to be the most difficult item, even harder than items 11 or 12. To alternate the difficulty levels a little bit and to ensure that the first step of adjacent items is not always similar, this specific sequence was chosen. That there has to be constant flexibility in planning, even in the items of the same category or number of steps, can be inferred from the simple fact that most second items are less well performed than the first item (all significantly differing from each other, p<.01). The difficulty level in the neurological patients group (n=271) has almost the same table as in the healthy group. Item 8 is again the most difficult, just as items 11 and 12. _____________________________________________________________________________________ © 2013 Pyramid Productions Tower of London Test version 3.0 build 6.0 – Manual ____________________________________________________________________________________54 The following philosophy can now be followed. Both groups will gradually have more difficulty with the TLT items, especially with the last ones. This will be more valid for the patients group. Furthermore, it will be rare that the former items (e.g. 5 – 8) are performed much worse than the last items 9 till 12. This can be put into formula in which the total score of the last items is compared with the sum score of the earlier items 5-8. Using a frequency distribution, one can then see whether such a ratio score is rare or not. Whenever there is a very atypical or uncommon ratio score one could think of a possible malingering effort or a very serious cognitive disorder (e.g. in the case of a dementia). In table XXXV the frequency distribution of this ratio score can be found for the healthy control group. The cut-off point has been set to 4%, somewhat more conservative than the normal 5%. Table XXXV. Frequency distribution of the ratio score within the HEALTHY controls group (n=254) ratio item9_12sum divided by item5_8sum N Valid 254 Missing 6 Mean Median 1,1493 1,0714 Mode 1,25 Std. Deviation ,48961 Variance ,240 Minimum ,00 5,00 Maximum Percentiles 4 ,5000 10 ,6351 20 ,8333 30 ,9152 40 50 1,0000 60 70 1,2500 80 1,4516 90 1,6667 96 2,0833 1,0714 1,2500 One can assume that whenever a person without clear neurological deficits or symptoms (meaning: presumably healthy) has a ratio score of 2.08 or higher, this is rather atypical or rare. That would mean that the last items 9 till 12 would be performed much better than the items 5 till 8; something that would be so for less than 4% of the healthy sample. The higher the ratio score, the less unlikely, and probably a greater chance of malingering efforts. One has to consider though, that in healthy subjects the items 5 till 8 will be better made than items 9 till 12. The ratio in which this is so has to be considered. A ratio score lower than 0.50 is hardly likely in a normal sample. That means that here as well, the option of malingering has to be considered, if the person comes from a presumably healthy population. To be even more sure of malingering efforts, the data of the neurological group is shown in Table XXXVI. _____________________________________________________________________________________ © 2013 Pyramid Productions Tower of London Test version 3.0 build 6.0 – Manual ____________________________________________________________________________________55 Table XXXVI. Frequency distribution of the ratio score within the NEUROLOGICAL group (n=254) ratio item9_12sum divided by item5_8sum N Valid 230 Missing Mean 681 1,2440 1,1270 Median Mode 1,00 ,78855 Std. Deviation Variance ,622 Minimum ,00 Maximum Percentiles 5,67 4 ,3175 10 ,5278 20 ,6667 30 ,7979 40 ,9750 50 1,1270 60 1,2473 1,3566 70 80 1,6071 90 2,2125 96 2,7647 The ratio score distribution is almost the same as in the healthy controls group. Except that the 96th percentile is slightly higher, mainly caused by some outliers. A ratio score of 2.20 is out of the normal range in the normal group, and almost out of the normal range in the neurological group. When that is so, one has to be very careful in interpreting the TLTscore and the option of malingering has to be taken very seriously. More indications for malingering have to been considered and more malingering tests should be administered. The TLT automatically generates a flat .txt file with all data, including the ratio score and a warning for possible malingering. To do so the boundaries were set even more sensitive: for presumably healthy persons the alarm is already triggered at a ratio score of <=0.64 or >=1.67. With a neurological patient a warning will only be shown at a ratio score of <=0.53 or >=2.21. No warning is shown when these thresholds are not reached. _____________________________________________________________________________________ © 2013 Pyramid Productions Tower of London Test version 3.0 build 6.0 – Manual ____________________________________________________________________________________56 5. Literature ______________________________________________________ Anzai, Y., & Simon, H. (1979). The theory of learning by doing. Psychological Review, 86, 124-140. Beauchamp, M.H., Dagher, A., Aston, J.A.D., & Doyon, J. (2003). Dynamic functional changes associated with cognitive skill learning of an adapted version of the Tower of London task. NeuroImage, 20, 1649-1660. Braver, T.S., & Barch, D.M. (2002). A theory of cognitive control, aging cognition, and neuromodulation. Neuroscience and Biobehavioral Reviews, 26, 809-817. Bull, R., Espy, K.A., & Senn, T.E. (2004). A comparison of performance on the Towers of London and Hanoi in young children. Journal of Child Psychology and Psychiatry, 45, 743-54. DX Culbertson, W.C., & Zillmer, E.A. (1998). The Tower of London : A standardized approach to assessing executive functioning in children. Archives of Clinical Neuropsychology, 13, 285-301. Evers, A., Van Vliet-Mulder, J.C., Groot, C. (2000). Documentatie van Tests en Testresearch in Nederland. Van koninklijke Gorcum b.v. Field, A. (2005). Discovering statistics using SPSS (2 nd edition). London: Sage Publications. Fisk, J. E., & Sharp, C. A. (2004). Age-related impairment in executive functioning: Updating, inhibition, shifting, and access. Journal of Clinical and Experimental Neuropsychology, 26(7), 874–890. Frauenfelder, B.A., Schuepbach, D., Baumgartner, R.W., & Hell, D. (2004). Specific alterations of cerebral hemodynamics during a planning task: a transcranial Doppler sonography study. NeuroImage, 22, 1223-30. Geurts, H. (2003). Executive functioning profiles in ADHD and HFA. PhD-thesis, University of Amsterdam. Goel, V., & Grafman, J. (1995). Are the frontal lobes implicated in “planning” functions? Interpreting data from the Tower of Hanoi. Neuropsychologia, 33, 623-42. Goethals, I., Audenaert, K., Jacobs, F., Van de Wiele, C., Pyck, H., Ham, H., Vandierendonck, A, van Heeringen, C., & Dierckx, R. (2004). Application of a neuropsychological activation probe with SPECT: the ‘Tower of London’ task in healthy volunteers. Nuclear Medicine Communications, 25, 177-82. Green, P. (2005). Green’s Word Memory Test User’s manual. Green’s Publishing Inc. Edmonton, Seattle. th Howell, D.C. (2002). Statistical methods for psychology (5 edition). Belmont, CA: Duxbury. Huizinga, M. (2006). Fractionation of executive function: A developmental approach. PhDthesis. University of Amsterdam. Huizinga, M., Dolan, C.V., & van der Molen, M.W.(2006). Age-related change in executive function: Developmental trends and a latent variable analysis. Neuropsychologia, 44, 2017-2036. Kafer, K.L, & Hunter, M. (1997). On testing the face validity of planning/problem-solving tasks in a normal population. Journal of the International Neuropsychological Society, 3, 108119. _____________________________________________________________________________________ © 2013 Pyramid Productions Tower of London Test version 3.0 build 6.0 – Manual ____________________________________________________________________________________57 Kaller, C.P., Unterrainer, J.M., Rahm, B., & Halsband, U. (2004). The impact of problem structure on planning: insights from the Tower of London task. Brain Research: Cognitive Brain Research, 20, 462-72. Kovács, F. (2009). TODA: Handleiding. Pyramid Productions. Kovács, F. (2013). TOSSA: Manual. Pyramid Productions. Krikorian, R., Bartok, J., & Gay, N. (1994). Tower of London procedure: A standard method and developmental data. Journal of Clinical and Experimental Neuropsychology, 16, 840-850. Lezak, M.D. (1995). Neuropsychological assessment (3rd edition). New York: Oxford University Press. Miller, E.K., & Cohen, J.D. (2001). An integrative theory of prefrontal cortex functions. Annual Review of Neuroscience, 24, 167-202. Miyake, A., Friedman, N. P., Emerson, M. J., Witzki, A. H., Howerter, A., & Wager, T. D. (2000). The unity and diversity of executive functions and their contributions to complex frontal lobe tasks: A latent variable analysis. Cognitive Psychology, 41, 49-100. Morris, R.G., Miotto, E.C., Feigenbaum, J.D., Bullock, P., & Polkey, C.E. (1997). The effect of goal-subgoal conflict on planning ability after frontal- and temporal-lobe lesions in humans. Neuropsychologia, 35, 1147-57. Newman, S.D., Carpenter, P.A., Varma, S., & Just, M.A. (2003). Neuropsychologia, 41, 16681682. Onderwater, A. (2004). Validating a new attention test: the TOSSA; a pilot-study. MA Thesis University of Leiden. Rainville, C., Amieva, H., Lafont, S., Dartigues, J.F., Orgogozo, J.M., & Fabrigoule, C. (2002). Executive function deficits in patients with dementia of the Alzheimer’s type. A study with a Tower of London task. Archives of Clinical Neuropsychology, 17, 513-30. Riccio, C.A., Wolfe, M.E., Romine, C, Davis, B., & Sullivan, J.R. (2003). The Tower of London and neuropsychological assessment of ADHD in adults. Archives of Clinical Neuropsychology, 19, 661-671. Schall, U., Johnston, P., Lagopoulos, J., Jüptner, M., Jentzen, W., Thienel, R., Dittmann-Balçar, A., Bender, S., & Ward, P.B. (2003). Functional brain maps of Tower of London performance: a positron emission tomography and functional magnetic resonance imaging study. NeuroImage, 20, 1154-61. Schmand B, Houx P & de Koning I. Normen voor Stroop Kleurwoord Tests, Trail Making Test en Story Recall van de Rivermead Behavioral Memory Test. Sectie Neuropsychologie, Nederlands Centrum voor Psychologen, Amsterdam, Ref Type: Report, 2005 Shallice, T. (1982). Specific impairments of planning. Philosophical Transactions of the Royal Society of London, 298, 199-209. Shallice, T. (1988). From neuropsychology to mental structure. New York: Cambridge Press. Shallice, T., & Burgess, P. (1991). Higher-order cognitive impairments and frontal lobe lesions in man. In H.S. Levin, H.M. Eisenberg, & A.L. Benton (Eds.), Frontal lobe function and dysfunction. New York: Oxford University Press. _____________________________________________________________________________________ © 2013 Pyramid Productions Tower of London Test version 3.0 build 6.0 – Manual ____________________________________________________________________________________58 Unterrainer, J.M., Kaller, C.P., Halsband, U, & Rahm, B. (2006). Planning abilities and chess: A comparison of chess and non-chess players on the Tower of London task. British Journal of Psychology, 97, 299-311. Unterrainer,J.M., Rahm, B., Kaller, C.P., Leonhart, R., Quiske, K., Hoppe-Seyler, K., Meier, C., Muller, C., & Halsband, U. (2004). Planning abilities and the Tower of London: is this task measuring a discrete cognitive function? Journal of Clinical and Experimental Neuropsychology, 26, 846-56. Unterrainer, J.M., Rahm, B., Leonhart, R., Ruff, C.C., & Halsband, U. (2003). The Tower of London: the impact of instructions, cueing, and learning on planning abilities. Cognitive Brain Research, 17, 675-683. Unterrainer, J.M., Ruff, C.C., Rahm, B., Kaller, C.P., Spreer, J. Schwarzwald, R., & Halsband, U. (2005). The influence of sex differences and individual task performance on brain activation during planning. NeuroImage, 24, 586-90. Van den Heuvel, O.A., Groenewegen, H.J., Barkhof, F., Lazeron, R.H.C., van Dyck, R. & Veltman, D.J. (2003). Frontostriatal system in planning complexity: a parametric functional magnetic resonance version of Tower of London task. NeuroImage, 18, 36774. _____________________________________________________________________________________ © 2013 Pyramid Productions Tower of London Test version 3.0 build 6.0 – Manual ____________________________________________________________________________________59 Appendix I: Example of print-out of the TLT data ______________________________________________________ Example of print of TLT test data Tower of London Test for Windows version 3.0.6. Surname: kovacsf Date of birth and age: 28-08-1964 40 Test Date: 25-6-2005 20:48 Educational code: 7 Gender: m Diagnosis: healthy Remarks: Ex. R1-G2-R3-|- 1.7- 3.5-|-R1-G2-R3-|- 2.9- 5.8-|--|| SumDT: 2.9 SumTT: 5.8 REstart: 0 Score: 9 1. B1-R2-|- 1.4- 2.8-|--|| SumDT: 1.4 SumTT: 2.8 REstart: 0 Score: 6 2. b-R1-G2-|- 2.4- 6.9-|--|| SumDT: 2.4 SumTT: 6.9 REstart: 0 Score: 6 3. B1-R2-B3-|- 1.8- 4.4-|--|| SumDT: 1.8 SumTT: 4.4 REstart: 0 Score: 9 4. B1-R2-B2-|- 1.5- 3.8-|--|| SumDT: 1.5 SumTT: 3.8 REstart: 0 Score: 9 5. R2-G1-R3-B3-|- 1.8- 4.6-|--|| SumDT: 1.8 SumTT: 4.6 REstart: 0 Score: 12 6. B1-R2-G2-B3-|- 1.4- 4.6-|--|| SumDT: 1.4 SumTT: 4.6 REstart: 0 Score: 12 7. R2-G1-R3-G3-|- 2.8- 6.1-|--|| SumDT: 2.8 SumTT: 6.1 REstart: 0 Score: 12 8. B1-R2-B2-G1-|- 4.2- 7.2-|--|| SumDT: 4.2 SumTT: 7.2 REstart: 0 Score: 12 9. R2-G1-R3-G3-B3-|- 2.4- 9.2-|--|| SumDT: 2.4 SumTT: 9.2 REstart: 0 Score: 15 10. B1-R2-G2-B3-G3-|- 1.9- 6.6-|--|| SumDT: 1.9 SumTT: 6.6 REstart: 0 Score: 15 11. R2-G1-R3-B3-G3-|- 1.3- 5.7-|--|| SumDT: 1.3 SumTT: 5.7 REstart: 0 Score: 15 12. B1-R2-B2-G1-B3-|- 1.6- 6.2-|--|| SumDT: 1.6 SumTT: 6.2 REstart: 0 Score: 15 13. R2-G1-R3-B3-G2-B2-|-18.9-24.1-|--|| SumDT: 18.9 SumTT: 24.1 REstart: 0 Score: 18 14. B1-R2-G2-B3-G3-R1-|-13.4-18.1-|--|| SumDT: 13.4 SumTT: 18.1 REstart: 0 Score: 18 15. R2-G1-R3-B3-G2-B2-R1-|-32.7-39.1-|--|| SumDT: 32.7 SumTT: 39.1 REstart: 0 Score: 21 16. B1-R2-G2-B3-G3-R1-G2-|-26.4-38.8-|--|| SumDT: 26.4 SumTT: 38.8 REstart: 0 Score: 21 AO12 = 12 AO12_1 = 12 RE12 = meanDT12_1 = 2.0 meanTT12_1 = 0 meanDT12 = 2.0 meanTT = 5.7 Total score12 = 138 5.7 Score percentage12: 100.0 AO = 16 AO1 = 16 RE = 0 meanDT = 7.2 meanTT = 11.8 meanDT1 = 7.2 meanTT1 = 11.8 Total score = 216 Score percentage: 100.0 Blocking errors: 1 Floating errors: 0 Monitoring errors: 0 Client compared to 260 healthy controls, 14-93 yrs(mean 28.3 yrs) for 12 items: percentiles min 5 10 20 30 40 50 60 70 80 90 95 max |----|--1-|---2--|---3--|---4--|---5--|---6--|---7--|---8--|---9--|-10-|----| very severe |severe insufficient reasonable suff. (quite) good very good perfect 39.9 50.7 57.4 63.2 67.4 71.0 75.4 78.3 81.9 86.1 92.8 99.0 100 TLTSC-|----|----|------|------|------|------|------|------|------|------|----|----| 4 6 6 7 8 8 9 9 10 10 11 12 12 AO1---|----|----|------|------|------|------|------|------|------|------|----|----| 1.8 2.4 2.7 3.2 3.6 4.2 4.8 5.9 7.0 9.1 11.6 14.2 24.9 DT1---|----|----|------|------|------|------|------|------|------|------|----|----| 5.6 6.6 7.1 7.9 8.7 9.6 10.2 11.5 13.4 17.4 22.1 25.4 62.5 TT1---|----|----|------|------|------|------|------|------|------|------|----|----| Excellent planning decile 10 Calculated Z-score for the healthy control group: 1.92 Compared Compared Compared Compared Compared to to to to to a right-hemisphere stroke group N=271: a left-hemisphere stroke group N=288: a Traumatic Brain Injury group N=99: Other neurological group N=254: WAD type II group N=19: 9th 9th 8th 8th 7th decile decile decile decile decile Profile suggests malingering when this is a healthy person! Ratioscore is: 1.70 _____________________________________________________________________________________ © 2013 Pyramid Productions Tower of London Test version 3.0 build 6.0 – Manual ____________________________________________________________________________________60 Appendix II: differences with the earlier versions 1 and 2 ______________________________________________________ The most important change between this version 3 and the earlier versions 1 and 2 is that this test has been expanded to 16 items instead of just 12. Furthermore, the goal positions are displayed on screen instead of in a paper booklet. The reasoning behind the scoring system of this version 3 is as follows: 1. 2. 3. The scoring procedure is also very different in version 3.0 then often can be found in the literature. It is more common to count the total number of steps taken to do an item. The less steps, the better the performance. Furthermore, often 3 attempts are allowed. However, the difficulty level is NOT represented is such scoring systems. The first items are certainly much easier than the later items so it only seems obvious that one can earn more points for the more difficult items. In this TLT version, the number of correct steps is multiplied with 3 during the first attempt; during the second attempt the number of steps are multiplied with 1. In this way the first attempt, which more specifically tells us something about planning (‘thinking ahead’), is rewarded more than the second attempt. Furthermore, the slowness of someone (i.e., exceeding the 60 seconds time limit for each item) is punished with the subtraction of 1 point. Slowness is taken into account but is not a main factor. It can be that good planning requires quite some time. There is no way to tell that taking your time has anything to do with planning problems or good planning skills. Usually, 3 attempts are allowed. Here in this version only 2 attempts can be made. The TLT is supposed to measure planning, largely taking place in one’s working memory. It is considered here that such kind of planning is mainly represented in the first attempt. Shallice thought the same thing when he decided to consider the decision times of the first attempt as the most important variable. Another reason to allow only 2 attempts is the total test administration time. In this way, it can be shortened considerably A helpdesk in now available whenever there are any questions about thet test or whenever there are technical problems. You can contact [email protected]. _____________________________________________________________________________________ © 2013 Pyramid Productions Tower of London Test version 3.0 build 6.0 – Manual ____________________________________________________________________________________61 Appendix III: coding system for education and diagnosis ______________________________________________________ In the Patient Input data screen (Fig. 2, page 6) a specific coding system has been used in the norming study. This helps in further collecting norm data. However, sometimes a diagnosis is difficult to sort into the 18 used numbers and can then be written down in plain text. N.B.: Type a surname without spaces and use the main name. For example, mrs van den Berg becomes ‘Bergvden’. No numbers or special characters are possible in the Name input screen. The format in the Birth day input screen is DD-MM-YYYY (European style), so please use 01-03-1954 and not 1-3-54. With the Sex input screen only M (Male) or F (female) is allowed (small or capitols). Education according to the Verhage system (1964) 1. less than primary school/ primary school not completed; less than 8 years of education 2. primary school completed; 8 years of education 3. primary school completed but not completed further education; between 8 to 10 years of education 4. education at a level lower than lower general secondary education (MAVO), e.g. lower economic and administrative education (LEAO), domestic science school (LHNO), technical school (LTS); between 10 to 12 years of education 5. lower general secondary education (MAVO), intermediate technical school (MTS), intermediate business education (MEAO); between 12 to 14 years of education 6. higher general secondary education (HAVO), pre-university eduction (VWO), higher vocational education (HBO) with certificate; between 13 and 17 years of education 7. University degree with certificate Coding for diagnosis 1 Right hemisphere STROKE 3 Left hemisphere STROKE 5 Traumatic Brain Injury (abnormal or normal brain scan but duration of impaired consciousness more than 15 minutes) 6 mild Traumatic Brain Injury (normal brain scan with less than 15 minutes of impaired consciousness 7 Whiplash Associated Disorder (WAD) type II 8 Multiple Sclerose (MS) (all types: relapsing/remitting, primary or secundary progressive) 9 Systemic Lupus Erythematosus (SLE) 10 Brain stem stroke (basal ganglia, pons, thalamus) 11 Cerebellum stroke, either left or right 12 Tumor-/cyst- extirpation or -radiation 13 Hypoxic encephalopathy (e.g., after cardiac arrest and resuscitation) 14 Diffuse general cognitive damage / forms of general encephalopathy and dementia 15 Other diagnoses not to be placed in this categorization system 16 Parkinson’s disease or Parkinsonism 17 Meningitis 18 Encephalitis _____________________________________________________________________________________ © 2013 Pyramid Productions