1
CUDA-GDB
CUDA DEBUGGER
DU-05227-042 _v5.0 | October 2012
User Manual
TABLE OF CONTENTS
Chapter 1. Introduction.........................................................................................1
1.1 What is CUDA-GDB?...................................................................................... 1
1.2 Supported Features...................................................................................... 1
1.3 About This Document.................................................................................... 2
Chapter 2. Release Notes...................................................................................... 3
Chapter 3. Getting Started..................................................................................... 6
3.1 Installation Instructions..................................................................................6
3.2 Setting Up the Debugger Environment................................................................ 6
3.2.1 Linux...................................................................................................6
3.2.2 Mac OS X............................................................................................. 6
3.2.3 Temporary Directory................................................................................ 7
3.3 Compiling the Application...............................................................................8
3.3.1 Debug Compilation.................................................................................. 8
3.3.2 Compiling for Fermi GPUs......................................................................... 8
3.3.3 Compiling for Fermi and Tesla GPUs............................................................. 8
3.4 Using the Debugger...................................................................................... 8
3.4.1 Single GPU Debugging.............................................................................. 9
3.4.2 Multi-GPU Debugging............................................................................... 9
3.4.3 Multi-GPU Debugging in Console Mode.......................................................... 9
3.4.4 Multi-GPU Debugging with the Desktop Manager Running.................................... 9
3.4.5 Remote Debugging................................................................................. 11
3.4.6 Multiple Debuggers................................................................................ 11
3.4.7 Attaching/Detaching...............................................................................12
3.4.8 CUDA/OpenGL Interop Applications on Linux................................................. 12
Chapter 4. CUDA-GDB Extensions........................................................................... 13
4.1 Command Naming Convention........................................................................ 13
4.2 Getting Help............................................................................................. 13
4.3 Initialization File........................................................................................ 13
4.4 GUI Integration.......................................................................................... 14
Chapter 5. Kernel Focus...................................................................................... 15
5.1 Software Coordinates vs. Hardware Coordinates.................................................. 15
5.2 Current Focus............................................................................................ 15
5.3 Switching Focus..........................................................................................16
Chapter 6. Program Execution...............................................................................17
6.1 Interrupting the Application...........................................................................17
6.2 Single Stepping.......................................................................................... 17
Chapter 7. Breakpoints........................................................................................ 19
7.1 Symbolic Breakpoints................................................................................... 19
7.2 Line Breakpoints.........................................................................................20
7.3 Address Breakpoints.................................................................................... 20
www.nvidia.com
CUDA Debugger
DU-05227-042 _v5.0 | ii
7.4 Kernel Entry Breakpoints.............................................................................. 20
7.5 Conditional Breakpoints................................................................................ 20
Chapter 8. Inspecting Program State....................................................................... 22
8.1 Memory and Variables.................................................................................. 22
8.2 Variable Storage and Accessibility....................................................................22
8.3 Inspecting Textures..................................................................................... 23
8.4 Info CUDA Commands.................................................................................. 23
8.4.1 info cuda devices.................................................................................. 24
8.4.2 info cuda sms.......................................................................................24
8.4.3 info cuda warps.................................................................................... 25
8.4.4 info cuda lanes.....................................................................................25
8.4.5 info cuda kernels.................................................................................. 26
8.4.6 info cuda blocks................................................................................... 26
8.4.7 info cuda threads.................................................................................. 27
Chapter 9. Context and Kernel Events.................................................................... 29
9.1 Display CUDA context events......................................................................... 29
9.2 Display CUDA kernel events........................................................................... 29
9.3 Examples of displayed events.........................................................................29
Chapter 10. Checking Memory Errors...................................................................... 31
10.1 Increasing the Precision of Memory Errors With Autostep.......................................31
10.1.1 Usage............................................................................................... 32
10.1.2 Related Commands............................................................................... 33
10.1.2.1 info autosteps............................................................................... 33
10.1.2.2 disable autosteps n......................................................................... 33
10.1.2.3 delete autosteps n.......................................................................... 33
10.1.2.4 ignore n i..................................................................................... 33
10.2 GPU Error Reporting...................................................................................33
Chapter 11. Walk-Through Examples....................................................................... 36
11.1 Example 1: bitreverse................................................................................ 36
11.1.1 Walking through the Code...................................................................... 37
11.2 Example 2: autostep.................................................................................. 40
11.2.1 Debugging with Autosteps.......................................................................40
11.3 Example 3: Debugging an MPI CUDA Application................................................. 41
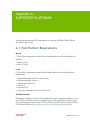
Appendix A. Supported Platforms...........................................................................44
A.1 Host Platform Requirements.......................................................................... 44
Appendix B. Known Issues.................................................................................... 46
www.nvidia.com
CUDA Debugger
DU-05227-042 _v5.0 | iii
LIST OF FIGURES
Figure 1 deviceQuery Output................................................................................. 11
www.nvidia.com
CUDA Debugger
DU-05227-042 _v5.0 | iv
LIST OF TABLES
Table 1 CUDA Exception Codes............................................................................... 34
www.nvidia.com
CUDA Debugger
DU-05227-042 _v5.0 | v
www.nvidia.com
CUDA Debugger
DU-05227-042 _v5.0 | vi
Chapter 1.
INTRODUCTION
This document introduces CUDA-GDB, the NVIDIA® CUDA™ debugger for Linux and
Mac OS.
1.1 What is CUDA-GDB?
CUDA-GDB is the NVIDIA tool for debugging CUDA applications running on Linux
and Mac. CUDA-GDB is an extension to the x86-64 port of GDB, the GNU Project
debugger. The tool provides developers with a mechanism for debugging CUDA
applications running on actual hardware. This enables developers to debug applications
without the potential variations introduced by simulation and emulation environments.
CUDA-GDB runs on Linux and Mac OS X, 32-bit and 64-bit. CUDA-GDB is based on
GDB 7.2 on both Linux and Mac OS X.
1.2 Supported Features
CUDA-GDB is designed to present the user with a seamless debugging environment
that allows simultaneous debugging of both GPU and CPU code within the same
application. Just as programming in CUDA C is an extension to C programming,
debugging with CUDA-GDB is a natural extension to debugging with GDB. The existing
GDB debugging features are inherently present for debugging the host code, and
additional features have been provided to support debugging CUDA device code.
CUDA-GDB supports C and C++ CUDA applications. All the C++ features supported by
the NVCC compiler can be debugged by CUDA-GDB.
CUDA-GDB allows the user to set breakpoints, to single-step CUDA applications, and
also to inspect and modify the memory and variables of any given thread running on the
hardware.
CUDA-GDB supports debugging all CUDA applications, whether they use the CUDA
driver API, the CUDA runtime API, or both.
www.nvidia.com
CUDA Debugger
DU-05227-042 _v5.0 | 1
Introduction
CUDA-GDB supports debugging kernels that have been compiled for specific CUDA
architectures, such as sm_10 or sm_20, but also supports debugging kernels compiled at
runtime, referred to as just-in-time compilation, or JIT compilation for short.
1.3 About This Document
This document is the main documentation for CUDA-GDB and is organized more
as a user manual than a reference manual. The rest of the document will describe
how to install and use CUDA-GDB to debug CUDA kernels and how to use the new
CUDA commands that have been added to GDB. Some walk-through examples are also
provided. It is assumed that the user already knows the basic GDB commands used to
debug host applications.
www.nvidia.com
CUDA Debugger
DU-05227-042 _v5.0 | 2
Chapter 2.
RELEASE NOTES
5.0 Release
Dynamic Parallelism Support
CUDA-GDB fully supports Dynamic Parallelism, a new feature introduced with the
5.0 toolkit. The debugger is able to track the kernels launched from another kernel
and to inspect and modify variables like any other CPU-launched kernel.
Attach/Detach
It is now possible to attach to a CUDA application that is already running. It is also
possible to detach from the application before letting it run to completion. When
attached, all the usual features of the debugger are available to the user, as if the
application had been launched from the debugger. This feature is also supported with
applications using Dynamic Parallelism.
Attach on exception
Using the environment variable CUDA_DEVICE_WAITS_ON_EXCEPTION, the
application will run normally until a device exception occurs. Then the application
will wait for the debugger to attach itself to it for further debugging.
API Error Reporting
Checking the error code of all the CUDA driver API and CUDA runtime API function
calls is vital to ensure the correctness of a CUDA application. Now the debugger
is able to report, and even stop, when any API call returns an error. See set cuda
api_failures for more information.
Inlined Subroutine Support
Inlined subroutines are now accessible from the debugger on SM 2.0 and above. The
user can inspect the local variables of those subroutines and visit the call frame stack
as if the routines were not inlined.
www.nvidia.com
CUDA Debugger
DU-05227-042 _v5.0 | 3
Release Notes
4.2 Release
Kepler Support
The primary change in Release 4.2 of CUDA-GDB is the addition of support for the
new Kepler architecture. There are no other user-visible changes in this release.
4.1 Release
Source Base Upgraded to GDB 7.2
Until now, CUDA-GDB was based on GDB 6.6 on Linux, and GDB 6.3.5 on Darwin
(the Apple branch). Now, both versions of CUDA-GDB are using the same 7.2 source
base.
Now CUDA-GDB supports newer versions of GCC (tested up to GCC 4.5), has better
support for DWARF3 debug information, and better C++ debugging support.
Simultaneous Sessions Support
With the 4.1 release, the single CUDA-GDB process restriction is lifted. Now,
multiple CUDA-GDB sessions are allowed to co-exist as long as the GPUs are not
shared between the applications being processed. For instance, one CUDA-GDB
process can debug process foo using GPU 0 while another CUDA-GDB process
debugs process bar using GPU 1. The exclusive of GPUs can be enforced with the
CUDA_VISIBLE_DEVICES environment variable.
New Autostep Command
A new 'autostep' command was added. The command increases the precision of
CUDA exceptions by automatically single-stepping through portions of code.
Under normal execution, the thread and instruction where an exception occurred
may be imprecisely reported. However, the exact instruction that generates the
exception can be determined if the program is being single-stepped when the
exception occurs.
Manually single-stepping through a program is a slow and tedious process. Therefore
'autostep' aides the user by allowing them to specify sections of code where they
suspect an exception could occur. These sections are automatically single-stepped
through when the program is running, and any exception that occurs within these
sections is precisely reported.
Type 'help autostep' from CUDA-GDB for the syntax and usage of the command.
Multiple Context Support
On GPUs with compute capability of SM20 or higher, debugging multiple contexts on
the same GPU is now supported. It was a known limitation until now.
Device Assertions Support
The R285 driver released with the 4.1 version of the toolkit supports device assertions.
CUDA_GDB supports the assertion call and stops the execution of the application
www.nvidia.com
CUDA Debugger
DU-05227-042 _v5.0 | 4
Release Notes
when the assertion is hit. Then the variables and memory can be inspected as usual.
The application can also be resumed past the assertion if needed. Use the 'set cuda
hide_internal_frames' option to expose/hide the system call frames (hidden by
default).
Temporary Directory
By default, the debugger API will use /tmp as the directory to store temporary files.
To select a different directory, the $TMPDIR environment variable and the API
CUDBG_APICLIENT_PID variable must be set.
www.nvidia.com
CUDA Debugger
DU-05227-042 _v5.0 | 5
Chapter 3.
GETTING STARTED
Included in this chapter are instructions for installing CUDA-GDB and for using NVCC,
the NVIDIA CUDA compiler driver, to compile CUDA programs for debugging.
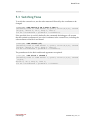
3.1 Installation Instructions
Follow these steps to install CUDA-GDB.
1. Visit the NVIDIA CUDA Zone download page:
http://www.nvidia.com/object/cuda_get.html
2. Select the appropriate operating system–MacOS X or Linux.
(See Host Platform Requirements.)
3. Download and install the CUDA Driver.
4. Download and install the CUDA Toolkit.
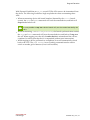
3.2 Setting Up the Debugger Environment
3.2.1 Linux
Set up the PATH and LD_LIBRARY_PATH environment variables:
export PATH=/usr/local/cuda-5.0/bin:$PATH
export LD_LIBRARY_PATH=/usr/local/cuda-5.0/lib64:/usr/local/
cuda-5.0/
lib:$LD_LIBRARY_PATH
3.2.2 Mac OS X
Set up the PATH and DYLD_LIBRARY_PATH environment variables:
export PATH=/usr/local/cuda-5.0/bin:$PATH
www.nvidia.com
CUDA Debugger
DU-05227-042 _v5.0 | 6
Getting Started
export DYLD_LIBRARY_PATH=/usr/local/cuda-5.0/lib:
$DYLD_LIBRARY_PATH
Also, if you are unable to execute CUDA-GDB or if you hit the Unable to find Mach
task port for processid error, try resetting the correct permissions with the
following commands:
sudo chgrp procmod /usr/local/cuda-5.0/bin/cuda-binary-gdb
sudo chmod 2755 /usr/local/cuda-5.0/bin/cuda-binary-gdb
sudo chmod 755 /usr/local/cuda-5.0/bin/cuda-gdb
You must also make sure that the taskgated daemon allows the processes in the
procmod group to access Task Ports. That option is turned on by default by launching
the taskgated with the -p option. To make it a permanent option, edit /System/
Library/LaunchDaemons/com.apple.taskgated.plist. See man taskgated
for more information. Here is an example:
<?xml version="1.0" encoding="UTF-8"?>
<!DOCTYPE plist PUBLIC "-//Apple Inc.//DTD PLIST 1.0//EN" "http://www.apple.com/
DTDs/PropertyList-1.0.dtd">
<plist version="1.0">
<dict>
<key>Label</key>
<string>com.apple.taskgated</string>
<key>MachServices</key>
<dict>
<key>com.apple.taskgated</key>
<dict>
<key>TaskSpecialPort</key>
<integer>9</integer>
</dict>
</dict>
<key>ProgramArguments</key>
<array>
<string>/usr/libexec/taskgated</string>
<string>-p</string>
<string>-s</string>
</array>
</dict>
</plist>
After editing the file, the system must be rebooted or the daemon stopped and
relaunched for the change to take effect.
As every application in the procmod group will have higher priviledges, adding the -p
option to the taskgated daemon is a possible security risk.
3.2.3 Temporary Directory
By default, CUDA-GDB uses /tmp as the directory to store temporary files. To select a
different directory, set the $TMPDIR environment variable.
www.nvidia.com
CUDA Debugger
DU-05227-042 _v5.0 | 7
Getting Started
3.3 Compiling the Application
3.3.1 Debug Compilation
NVCC, the NVIDIA CUDA compiler driver, provides a mechanism for generating the
debugging information necessary for CUDA-GDB to work properly. The -g -G option
pair must be passed to NVCC when an application is compiled in order to debug with
CUDA-GDB; for example,
nvcc -g -G foo.cu -o foo
Using this line to compile the CUDA application foo.cu
‣ forces -O0 compilation, with the exception of very limited dead-code eliminations
and register-spilling optimizations.
‣ makes the compiler include debug information in the executable
3.3.2 Compiling for Fermi GPUs
For Fermi GPUs, add the following flags to target Fermi output when compiling the
application:
-gencode arch=compute_20,code=sm_20
It will compile the kernels specifically for the Fermi architecture once and for all. If the
flag is not specified, then the kernels must be recompiled at runtime every time.
3.3.3 Compiling for Fermi and Tesla GPUs
If you are targeting both Fermi and Tesla GPUs, include these two flags:
-gencode arch=compute_20,code=sm_20
-gencode arch=compute_10,code=sm_10
It is highly recommended to use the -gencode flag whenever possible.
3.4 Using the Debugger
Debugging a CUDA GPU involves pausing that GPU. When the graphics desktop
manager is running on the same GPU, then debugging that GPU freezes the GUI and
makes the desktop unusable. To avoid this, use CUDA-GDB in the following system
configurations:
www.nvidia.com
CUDA Debugger
DU-05227-042 _v5.0 | 8
Getting Started
3.4.1 Single GPU Debugging
In a single GPU system, CUDA-GDB can be used to debug CUDA applications only if
no X11 server (on Linux) or no Aqua desktop manager (on Mac OS X) is running on that
system. On Linux you can stop the X11 server by stopping the gdm service. On Mac OS
X you can log in with >console as the user name in the desktop UI login screen. This
allows CUDA applications to be executed and debugged in a single GPU configuration.
3.4.2 Multi-GPU Debugging
Multi-GPU debugging is not much different than single-GPU debugging except for a
few additional CUDA-GDB commands that let you switch between the GPUs.
Any GPU hitting a breakpoint will pause all the GPUs running CUDA on that system.
Once paused, you can use info cuda kernels to view all the active kernels and the
GPUs they are running on. When any GPU is resumed, all the GPUs are resumed.
If the CUDA_VISIBLE_DEVICES environment is used, only the specified devices
are suspended and resumed.
All CUDA-capable GPUs may run one or more kernel. To switch to an active kernel,
use cuda kernel <n>, where n is the ID of the kernel retrieved from info cuda
kernels.
The same kernel can be loaded and used by different contexts and devices at the
same time. When a breakpoint is set in such a kernel, by either name or file name
and line number, it will be resolved arbitrarily to only one instance of that kernel.
With the runtime API, the exact instance to which the breakpoint will be resolved
cannot be controlled. With the driver API, the user can control the instance to
which the breakpoint will be resolved to by setting the breakpoint right after its
module is loaded.
3.4.3 Multi-GPU Debugging in Console Mode
CUDA-GDB allows simultaneous debugging of applications running CUDA kernels on
multiple GPUs. In console mode, CUDA-GDB can be used to pause and debug every
GPU in the system. You can enable console mode as described above for the single GPU
console mode.
3.4.4 Multi-GPU Debugging with the Desktop Manager
Running
This can be achieved by running the desktop GUI on one GPU and CUDA on the other
GPU to avoid hanging the desktop GUI.
www.nvidia.com
CUDA Debugger
DU-05227-042 _v5.0 | 9
Getting Started
On Linux
The CUDA driver automatically excludes the GPU used by X11 from being visible to
the application being debugged. This might alter the behavior of the application since, if
there are n GPUs in the system, then only n-1 GPUs will be visible to the application.
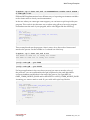
On Mac OS X
The CUDA driver exposes every CUDA-capable GPU in the system, including the one
used by Aqua desktop manager. To determine which GPU should be used for CUDA,
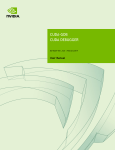
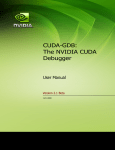
run the deviceQuery app from the CUDA SDK sample. The output of deviceQuery
as shown in Figure 1 deviceQuery Output indicates all the GPUs in the system.
For example, if you have two GPUs you will see Device0: "GeForce xxxx" and
Device1: "GeForce xxxx". Choose the Device<index> that is not rendering the
desktop on your connected monitor. If Device0 is rendering the desktop, then choose
Device1 for running and debugging the CUDA application. This exclusion of the
desktop can be achieved by setting the CUDA_VISIBLE_DEVICES environment variable
to 1:
export CUDA_VISIBLE_DEVICES=1
www.nvidia.com
CUDA Debugger
DU-05227-042 _v5.0 | 10
Getting Started
Figure 1 deviceQuery Output
3.4.5 Remote Debugging
To remotely debug an application, use SSH or VNC from the host system to connect to
the target system. From there, CUDA-GDB can be launched in console mode.
3.4.6 Multiple Debuggers
In a multi-GPU environment, several debugging sessions may take place simultaneously
as long as the CUDA devices are used exclusively. For instance, one instance of CUDAGDB can debug a first application that uses the first GPU while another instance of
CUDA-GDB debugs a second application that uses the second GPU. The exclusive use
of a GPU is achieved by specifying which GPU is visible to the application by using the
CUDA_VISIBLE_DEVICES environment variable.
CUDA_VISIBLE_DEVICES=1 cuda-gdb my_app
www.nvidia.com
CUDA Debugger
DU-05227-042 _v5.0 | 11
Getting Started
3.4.7 Attaching/Detaching
CUDA-GDB can attach to and detach from a CUDA application running on Fermi or
Kepler GPUs, using GDB's built-in commands for attaching to or detaching from a
process.
Additionally, if the environment variable CUDA_DEVICE_WAITS_ON_EXCEPTION is
set to 1 prior to running the CUDA application, the application will run normally till a
device exception occurs. The application will then wait for CUDA-GDB to attach itself to
it for further debugging.
3.4.8 CUDA/OpenGL Interop Applications on Linux
Any CUDA application that uses OpenGL interoperability requires an active windows
server. Such applications will fail to run under console mode debugging on both Linux
and Mac OS X. However, if the X server is running on Linux, the render GPU will not be
enumerated when debugging, so the application could still fail, unless the application
uses the OpenGL device enumeration to access the render GPU. But if the X session
is running in non-interactive mode while using the debugger, the render GPU will be
enumerated correctly.
1. Launch your X session in non-interactive mode.
a) Stop your X server.
b) Edit /etc/X11/xorg.conf to contain the following line in the Device section
corresponding to your display:
Option "Interactive" "off"
c) Restart your X server.
2. Log in remotely (SSH, etc.) and launch your application under CUDA-GDB.
This setup works properly for single-GPU and multi-GPU configurations.
3. Ensure your DISPLAY environment variable is set appropriately.
For example:
export DISPLAY=:0.0
While X is in non-interactive mode, interacting with the X session can cause your
debugging session to stall or terminate.
www.nvidia.com
CUDA Debugger
DU-05227-042 _v5.0 | 12
Chapter 4.
CUDA-GDB EXTENSIONS
4.1 Command Naming Convention
The existing GDB commands are unchanged. Every new CUDA command or option is
prefixed with the CUDA keyword. As much as possible, CUDA-GDB command names
will be similar to the equivalent GDB commands used for debugging host code. For
instance, the GDB command to display the host threads and switch to host thread 1 are,
respectively:
(cuda-gdb) info threads
(cuda-gdb) thread 1
To display the CUDA threads and switch to cuda thread 1, the user only has to type:
(cuda-gdb) info cuda threads
(cuda-gdb) cuda thread 1
4.2 Getting Help
As with GDB commands, the built-in help for the CUDA commands is accessible from
the cuda-gdb command line by using the help command:
(cuda-gdb) help cuda name_of_the_cuda_command
(cuda-gdb) help set cuda name_of_the_cuda_option
(cuda-gdb) help info cuda name_of_the_info_cuda_command
4.3 Initialization File
The initialization file for CUDA-GDB is named .cuda-gdbinit and follows the same
rules as the standard .gdbinit file used by GDB. The initialization file may contain
www.nvidia.com
CUDA Debugger
DU-05227-042 _v5.0 | 13
CUDA-GDB Extensions
any CUDA- GDB command. Those commands will be processed in order when CUDAGDB is launched.
4.4 GUI Integration
Emacs
CUDA-GDB works with GUD in Emacs and XEmacs. No extra step is required other
than pointing to the right binary.
To use CUDA-GDB, the gud-gdb-command-name variable must be set to cuda-gdb
annotate=3. Use M-x customize-variable to set the variable.
Ensure that cuda-gdb is present in the Emacs/XEmacs $PATH.
DDD
CUDA-GDB works with DDD. To use DDD with CUDA-GDB, launch DDD with the
following command:
ddd --debugger cuda-gdb
cuda-gdb must be in your $PATH.
www.nvidia.com
CUDA Debugger
DU-05227-042 _v5.0 | 14
Chapter 5.
KERNEL FOCUS
A CUDA application may be running several host threads and many device threads. To
simplify the visualization of information about the state of application, commands are
applied to the entity in focus.
When the focus is set to a host thread, the commands will apply only to that host thread
(unless the application is fully resumed, for instance). On the device side, the focus is
always set to the lowest granularity level–the device thread.
5.1 Software Coordinates vs. Hardware
Coordinates
A device thread belongs to a block, which in turn belongs to a kernel. Thread, block,
and kernel are the software coordinates of the focus. A device thread runs on a lane. A
lane belongs to a warp, which belongs to an SM, which in turn belongs to a device. Lane,
warp, SM, and device are the hardware coordinates of the focus. Software and hardware
coordinates can be used interchangeably and simultaneously as long as they remain
coherent.
Another software coordinate is sometimes used: the grid. The difference between a grid
and a kernel is the scope. The grid ID is unique per GPU whereas the kernel ID is unique
across all GPUs. Therefore there is a 1:1 mapping between a kernel and a (grid,device)
tuple.
5.2 Current Focus
To inspect the current focus, use the cuda command followed by the coordinates of
interest:
(cuda-gdb) cuda device sm warp lane block thread
block (0,0,0), thread (0,0,0), device 0, sm 0, warp 0, lane 0
(cuda-gdb) cuda kernel block thread
kernel 1, block (0,0,0), thread (0,0,0)
(cuda-gdb) cuda kernel
www.nvidia.com
CUDA Debugger
DU-05227-042 _v5.0 | 15
Kernel Focus
kernel 1
5.3 Switching Focus
To switch the current focus, use the cuda command followed by the coordinates to be
changed:
(cuda-gdb) cuda device 0 sm 1 warp 2 lane 3
[Switching focus to CUDA kernel 1, grid 2, block (8,0,0), thread
(67,0,0), device 0, sm 1, warp 2, lane 3]
374 int totalThreads = gridDim.x * blockDim.x;
If the specified focus is not fully defined by the command, the debugger will assume
that the omitted coordinates are set to the coordinates in the current focus, including the
subcoordinates of the block and thread.
(cuda-gdb) cuda thread (15)
[Switching focus to CUDA kernel 1, grid 2, block (8,0,0), thread
(15,0,0), device 0, sm 1, warp 0, lane 15]
374 int totalThreads = gridDim.x * blockDim.x;
The parentheses for the block and thread arguments are optional.
(cuda-gdb) cuda block 1 thread 3
[Switching focus to CUDA kernel 1, grid 2, block (1,0,0), thread
(3,0,0),
device 0, sm 3, warp 0, lane 3]
374 int totalThreads = gridDim.x * blockDim.
www.nvidia.com
CUDA Debugger
DU-05227-042 _v5.0 | 16
Chapter 6.
PROGRAM EXECUTION
Applications are launched the same way in CUDA-GDB as they are with GDB by using
the run command. This chapter describes how to interrupt and single-step CUDA
applications
6.1 Interrupting the Application
If the CUDA application appears to be hanging or stuck in an infinite loop, it is possible
to manually interrupt the application by pressing CTRL+C. When the signal is received,
the GPUs are suspended and the cuda-gdb prompt will appear.
At that point, the program can be inspected, modified, single-stepped, resumed, or
terminated at the user's discretion.
This feature is limited to applications running within the debugger. It is not possible to
break into and debug applications that have been launched outside the debugger.
6.2 Single Stepping
Single-stepping device code is supported. However, unlike host code single-stepping,
device code single-stepping works at the warp level. This means that single-stepping
a device kernel advances all the active threads in the warp currently in focus. The
divergent threads in the warp are not single-stepped.
In order to advance the execution of more than one warp, a breakpoint must be set at the
desired location and then the application must be fully resumed.
A special case is single-stepping over a thread barrier call: __syncthreads(). In
this case, an implicit temporary breakpoint is set immediately after the barrier and all
threads are resumed until the temporary breakpoint is hit.
On GPUs with sm_type lower than sm_20 it is not possible to step over a subroutine in
the device code. Instead, CUDA-GDB always steps into the device function. On GPUs
with sm_type sm_20 and higher, you can step in, over, or out of the device functions
as long as they are not inlined. To force a function to not be inlined by the compiler, the
__noinline__ keyword must be added to the function declaration.
www.nvidia.com
CUDA Debugger
DU-05227-042 _v5.0 | 17
Program Execution
With Dynamic Parallelism on sm_35, several CUDA APIs can now be instantiated from
the device. The following list defines single-step behavior when encountering these
APIs:
‣ When encountering device side kernel launches (denoted by the <<<>>> launch
syntax), the step and next commands will have the same behavior, and both will
step over the launch call.
It is not possible to step into a device launch call (nor the routine launched by the
call).
‣ When encountering cudaDeviceSynchronize, the launch synchronization routine,
the step and next commands will have the same behavior, and both will step over
the call. When stepping over the call, the entire device is resumed until the call has
completed, at which point the device is suspended (without user intervention).
‣ When stepping a device grid launch to completion, focus will automatically switch
back to the CPU. The cuda kernel focus switching command must be used to
switch to another grid of interest (if one is still resident).
www.nvidia.com
CUDA Debugger
DU-05227-042 _v5.0 | 18
Chapter 7.
BREAKPOINTS
There are multiple ways to set a breakpoint on a CUDA application. Those methods are
described below. The commands to set a breakpoint on the device code are the same as
the commands used to set a breakpoint on the host code.
If the breakpoint is set on device code, the breakpoint will be marked pending until the
ELF image of the kernel is loaded. At that point, the breakpoint will be resolved and its
address will be updated.
When a breakpoint is set, it forces all resident GPU threads to stop at this location when
it hits that corresponding PC.
When a breakpoint is hit by one thread, there is no guarantee that the other threads will
hit the breakpoint at the same time. Therefore the same breakpoint may be hit several
times, and the user must be careful with checking which thread(s) actually hit(s) the
breakpoint.
7.1 Symbolic Breakpoints
To set a breakpoint at the entry of a function, use the break command followed by the
name of the function or method:
(cuda-gdb) break my_function
(cuda-gdb) break my_class::my_method
For templatized functions and methods, the full signature must be given:
(cuda-gdb) break int my_templatized_function<int>(int)
The mangled name of the function can also be used. To find the mangled name of a
function, you can use the following command:
(cuda-gdb) set demangle-style none
(cuda-gdb) info function my_function_name
(cuda-gdb) set demangle-style auto
www.nvidia.com
CUDA Debugger
DU-05227-042 _v5.0 | 19
Breakpoints
7.2 Line Breakpoints
To set a breakpoint on a specific line number, use the following syntax:
(cuda-gdb) break my_file.cu:185
If the specified line corresponds to an instruction within templatized code, multiple
breakpoints will be created, one for each instance of the templatized code.
7.3 Address Breakpoints
To set a breakpoint at a specific address, use the break command with the address as
argument:
(cuda-gdb) break *0x1afe34d0
The address can be any address on the device or the host.
7.4 Kernel Entry Breakpoints
To break on the first instruction of every launched kernel, set the break_on_launch
option to application:
(cuda-gdb) set cuda break_on_launch application
Possible options are:
application
kernel launched by the user application
system
any kernel launched by the driver, such as memset
all
any kernel, application and system
none
no kernel, application or system
Those automatic breakpoints are not displayed by the info breakpoints command and
are managed separately from individual breakpoints. Turning off the option will not
delete other individual breakpoints set to the same address and vice-versa.
7.5 Conditional Breakpoints
To make the breakpoint conditional, use the optional if keyword or the cond command.
(cuda-gdb) break foo.cu:23 if threadIdx.x == 1 && i < 5
(cuda-gdb) cond 3 threadIdx.x == 1 && i < 5
www.nvidia.com
CUDA Debugger
DU-05227-042 _v5.0 | 20
Breakpoints
Conditional expressions may refer any variable, including built-in variables such as
threadIdx and blockIdx. Function calls are not allowed in conditional expressions.
Note that conditional breakpoints are always hit and evaluated, but the debugger
reports the breakpoint as being hit only if the conditional statement is evaluated
to TRUE. The process of hitting the breakpoint and evaluating the corresponding
conditional statement is time-consuming. Therefore, running applications while using
conditional breakpoints may slow down the debugging session. Moreover, if the
conditional statement is always evaluated to FALSE, the debugger may appear to be
hanging or stuck, although it is not the case. You can interrupt the application with
CTRL-C to verify that progress is being made.
Conditional breakpoints can only be set on code from CUDA modules that are already
loaded. Otherwise, CUDA-GDB will report an error that it is unable to find symbols
in the current context. If unsure, first set an unconditional breakpoint at the desired
location and add the conditional statement the first time the breakpoint is hit by using
the cond command.
www.nvidia.com
CUDA Debugger
DU-05227-042 _v5.0 | 21
Chapter 8.
INSPECTING PROGRAM STATE
8.1 Memory and Variables
The GDB print command has been extended to decipher the location of any program
variable and can be used to display the contents of any CUDA program variable
including:
‣ data allocated via cudaMalloc()
‣ data that resides in various GPU memory regions, such as shared, local, and global
memory
‣ special CUDA runtime variables, such as threadIdx
8.2 Variable Storage and Accessibility
Depending on the variable type and usage, variables can be stored either in registers or
in local, shared, const or global memory. You can print the address of any variable
to find out where it is stored and directly access the associated memory.
The example below shows how the variable array, which is of type shared int *, can
be directly accessed in order to see what the stored values are in the array.
(cuda-gdb) print &array
$1 = (@shared int (*)[0]) 0x20
(cuda-gdb) print array[0]@4
$2 = {0, 128, 64, 192}
You can also access the shared memory indexed into the starting offset to see what the
stored values are:
(cuda-gdb) print *(@shared int*)0x20
$3 = 0
(cuda-gdb) print *(@shared int*)0x24
$4 = 128
(cuda-gdb) print *(@shared int*)0x28
www.nvidia.com
CUDA Debugger
DU-05227-042 _v5.0 | 22
Inspecting Program State
$5 = 64
The example below shows how to access the starting address of the input parameter to
the kernel.
(cuda-gdb) print &data
$6 = (const @global void * const @parameter *) 0x10
(cuda-gdb) print *(@global void * const @parameter *) 0x10
$7 = (@global void * const @parameter) 0x110000</>
8.3 Inspecting Textures
The debugger can always read/write the source variables when the PC is on the
first assembly instruction of a source instruction. When doing assembly-level
debugging, the value of source variables is not always accessible.
To inspect a texture, use the print command while de-referencing the texture recast to
the type of the array it is bound to. For instance, if texture tex is bound to array A of type
float*, use:
(cuda-gdb) print *(@texture float *)tex
All the array operators, such as [], can be applied to (@texture float *)tex:
(cuda-gdb) print ((@texture float *)tex)[2]
(cuda-gdb) print ((@texture float *)tex)[2]@4
8.4 Info CUDA Commands
These are commands that display information about the GPU and the application's
CUDA state. The available options are:
devices
information about all the devices
sms
information about all the SMs in the current device
warps
information about all the warps in the current SM
lanes
information about all the lanes in the current warp
kernels
information about all the active kernels
blocks
information about all the active blocks in the current kernel
threads
information about all the active threads in the current kernel
www.nvidia.com
CUDA Debugger
DU-05227-042 _v5.0 | 23
Inspecting Program State
A filter can be applied to every info cuda command. The filter restricts the scope of
the command. A filter is composed of one or more restrictions. A restriction can be any
of the following:
‣
‣
‣
‣
‣
‣
‣
‣
device n
sm n
warp n
lane n
kernel n
grid n
block x[,y] or block (x[,y])
thread x[,y[,z]] or thread (x[,y[,z]])
where n, x, y, z are integers, or one of the following special keywords: current, any,
and all. current indicates that the corresponding value in the current focus should be
used. any and all indicate that any value is acceptable.
8.4.1 info cuda devices
This command enumerates all the GPUs in the system sorted by device index. A *
indicates the device currently in focus. This command supports filters. The default is
device all. This command prints No CUDA Devices if no GPUs are found.
(cuda-gdb) info cuda devices
Dev/Description/SM Type/SMs Warps/SM Lanes/Warp Max Regs/Lane/
Active SMs Mask
* 0
gt200
sm_13
24
32
32
128
0x00ffffff
8.4.2 info cuda sms
This command shows all the SMs for the device and the associated active warps on the
SMs. This command supports filters and the default is device current sm all. A *
indicates the SM is focus. The results are grouped per device.
(cuda-gdb) info cuda sms SM Active Warps Mask Device 0
* 0 0xffffffffffffffff
1 0xffffffffffffffff
2 0xffffffffffffffff
3 0xffffffffffffffff
4 0xffffffffffffffff
5 0xffffffffffffffff
6 0xffffffffffffffff
7 0xffffffffffffffff
8 0xffffffffffffffff
...
www.nvidia.com
CUDA Debugger
DU-05227-042 _v5.0 | 24
Inspecting Program State
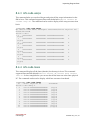
8.4.3 info cuda warps
This command takes you one level deeper and prints all the warps information for the
SM in focus. This command supports filters and the default is device current sm
current warp all. The command can be used to display which warp executes what
block.
(cuda-gdb) info cuda warps
Wp /Active Lanes Mask/ Divergent Lanes Mask/Active Physical PC/
Kernel/BlockIdx
Device 0 SM 0
* 0
0xffffffff
0x00000000 0x000000000000001c
0
(0,0,0)
1
0xffffffff
0x00000000 0x0000000000000000
0
(0,0,0)
2
0xffffffff
0x00000000 0x0000000000000000
0
(0,0,0)
3
0xffffffff
0x00000000 0x0000000000000000
0
(0,0,0)
4
0xffffffff
0x00000000 0x0000000000000000
0
(0,0,0)
5
0xffffffff
0x00000000 0x0000000000000000
0
(0,0,0)
6
0xffffffff
0x00000000 0x0000000000000000
0
(0,0,0)
7
0xffffffff
0x00000000 0x0000000000000000
0
(0,0,0)
...
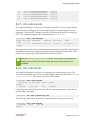
8.4.4 info cuda lanes
This command displays all the lanes (threads) for the warp in focus. This command
supports filters and the default is device current sm current warp current
lane all. In the example below you can see that all the lanes are at the same physical
PC. The command can be used to display which lane executes what thread.
(cuda-gdb) info cuda lanes
Ln
State Physical PC
ThreadIdx
Device 0 SM 0 Warp 0
* 0
active 0x000000000000008c
(0,0,0)
1
active 0x000000000000008c
(1,0,0)
2
active 0x000000000000008c
(2,0,0)
3
active 0x000000000000008c
(3,0,0)
4
active 0x000000000000008c
(4,0,0)
5
active 0x000000000000008c
(5,0,0)
6
active 0x000000000000008c
(6,0,0)
7
active 0x000000000000008c
(7,0,0)
8
active 0x000000000000008c
(8,0,0)
9
active 0x000000000000008c
(9,0,0)
10
active 0x000000000000008c (10,0,0)
11
active 0x000000000000008c (11,0,0)
www.nvidia.com
CUDA Debugger
DU-05227-042 _v5.0 | 25
Inspecting Program State
12
13
14
15
16
...
active
active
active
active
active
0x000000000000008c
0x000000000000008c
0x000000000000008c
0x000000000000008c
0x000000000000008c
(12,0,0)
(13,0,0)
(14,0,0)
(15,0,0)
(16,0,0)
8.4.5 info cuda kernels
This command displays on all the active kernels on the GPU in focus. It prints the SM
mask, kernel ID and the grid ID for each kernel with the associated dimensions and
arguments. The kernel ID is unique across all GPUs whereas the grid ID is unique per
GPU. This command supports filters and the default is kernel all.
(cuda-gdb) info cuda kernels
Kernel Dev Grid SMs Mask
GridDim
Args
{...}
1
0
2
0x00ffffff (240,1,1)
parms=
BlockDim
(128,1,1)
Name
acos_main
This command will also show grids that have been launched on the GPU with Dynamic
Parallelism. Kernels with a negative grid ID have been launched from the GPU, while
kernels with a positive grid ID have been launched from the CPU.
With the cudaDeviceSynchronize routine, it is possible to see grid launches
disappear from the device and then resume later after all child launches have
completed.
8.4.6 info cuda blocks
This command displays all the active or running blocks for the kernel in focus. The
results are grouped per kernel. This command supports filters and the default is kernel
current block all. The outputs are coalesced by default.
(cuda-gdb) info cuda blocks
BlockIdx
To BlockIdx Count
Kernel 1
* (0,0,0)
(191,0,0)
192
State
running
Coalescing can be turned off as follows in which case more information on the Device
and the SM get displayed:
(cuda-gdb) set cuda coalescing off
The following is the output of the same command when coalescing is turned off.
(cuda-gdb) info cuda blocks
BlockIdx
State
Dev SM
Kernel 1
www.nvidia.com
CUDA Debugger
DU-05227-042 _v5.0 | 26
Inspecting Program State
*
(0,0,0)
(1,0,0)
(2,0,0)
(3,0,0)
(4,0,0)
(5,0,0)
(6,0,0)
(7,0,0)
(8,0,0)
...
running
running
running
running
running
running
running
running
running
0
0
0
0
0
0
0
0
0
0
3
6
9
12
15
18
21
1
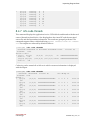
8.4.7 info cuda threads
This command displays the application's active CUDA blocks and threads with the total
count of threads in those blocks. Also displayed are the virtual PC and the associated
source file and the line number information. The results are grouped per kernel. The
command supports filters with default being kernel current block all thread
all. The outputs are coalesced by default as follows:
(cuda-gdb) info cuda threads
BlockIdx ThreadIdx To BlockIdx ThreadIdx Count
Virtual PC
Filename
Line
Device 0 SM 0
* (0,0,0 (0,0,0)
(0,0,0) (31,0,0)
32 0x000000000088f88c
acos.cu
376
(0,0,0)(32,0,0) (191,0,0) (127,0,0) 24544 0x000000000088f800
acos.cu
374
...
Coalescing can be turned off as follows in which case more information is displayed
with the output.
(cuda-gdb) info cuda threads
BlockIdx ThreadIdx Virtual PC
Filename Line
Kernel 1
* (0,0,0)
(0,0,0) 0x000000000088f88c
376
(0,0,0)
(1,0,0) 0x000000000088f88c
376
(0,0,0)
(2,0,0) 0x000000000088f88c
376
(0,0,0)
(3,0,0) 0x000000000088f88c
376
(0,0,0)
(4,0,0) 0x000000000088f88c
376
(0,0,0)
(5,0,0) 0x000000000088f88c
376
(0,0,0)
(6,0,0) 0x000000000088f88c
376
(0,0,0)
(7,0,0) 0x000000000088f88c
376
www.nvidia.com
CUDA Debugger
Dev SM Wp Ln
0
0
0
0
acos.cu
0
0
0
1
acos.cu
0
0
0
2
acos.cu
0
0
0
3
acos.cu
0
0
0
4
acos.cu
0
0
0
5
acos.cu
0
0
0
6
acos.cu
0
0
0
7
acos.cu
DU-05227-042 _v5.0 | 27
Inspecting Program State
(0,0,0)
376
(0,0,0)
376
...
(8,0,0)
0x000000000088f88c
0
0
0
8
acos.cu
(9,0,0)
0x000000000088f88c
0
0
0
9
acos.cu
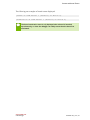
In coalesced form, threads must be contiguous in order to be coalesced. If some
threads are not currently running on the hardware, they will create holes in the
thread ranges. For instance, if a kernel consist of 2 blocks of 16 threads, and only
the 8 lowest threads are active, then 2 coalesced ranges will be printed: one range
for block 0 thread 0 to 7, and one range for block 1 thread 0 to 7. Because threads
8-15 in block 0 are not running, the 2 ranges cannot be coalesced.
www.nvidia.com
CUDA Debugger
DU-05227-042 _v5.0 | 28
Chapter 9.
CONTEXT AND KERNEL EVENTS
Within CUDA-GDB, kernel refers to your device code that executes on the GPU, while
context refers to the virtual address space on the GPU for your kernel.
You can turn ON or OFF the display of CUDA context and kernel events to review the
flow of the active contexts and kernels.
9.1 Display CUDA context events
‣ (cuda-gdb) set cuda context_events 1
Display CUDA context events.
‣ (cuda-gdb) set cuda context_events 0
Do not display CUDA context events.
9.2 Display CUDA kernel events
‣ (cuda-gdb) set cuda kernel_events 1
Display CUDA kernel events.
‣ (cuda-gdb) set cuda kernel_events 0
Do not display CUDA kernel events.
9.3 Examples of displayed events
The following are examples of context events displayed:
[Context Create of context 0xad2fe60 on Device 0]
[Context Pop of context 0xad2fe60 on Device 0]
[Context Destroy of context 0xad2fe60 on Device 0]
www.nvidia.com
CUDA Debugger
DU-05227-042 _v5.0 | 29
Context and Kernel Events
The following are examples of kernel events displayed:
[Launch of CUDA Kernel 1 (kernel3) on Device 0]
[Termination of CUDA Kernel 1 (kernel3) on Device 0]
The kernel termination event is only displayed when a kernel is launched
asynchronously, or when the debugger can safely assume that the kernel has
terminated.
www.nvidia.com
CUDA Debugger
DU-05227-042 _v5.0 | 30
Chapter 10.
CHECKING MEMORY ERRORS
The CUDA memcheck feature detects global memory violations and mis-aligned global
memory accesses. This feature is off by default and can be enabled using the following
variable in CUDA-GDB before the application is run.
(cuda-gdb) set cuda memcheck on
Once CUDA memcheck is enabled, any detection of global memory violations and misaligned global memory accesses will be reported.
When CUDA memcheck is enabled, all the kernel launches are made blocking, as if the
environment variable CUDA_LAUNCH_BLOCKING was set to 1. The host thread launching
a kernel will therefore wait until the kernel has completed before proceeding. This may
change the behavior of your application.
You can also run the CUDA memory checker as a standalone tool named CUDAMEMCHECK. This tool is also part of the toolkit. Please read the related documentation
for more information.
By default, CUDA-GDB will report any memory error. See Increasing the Precision of
Memory Errors With Autostep for a list of the memory errors. To increase the number
of memory errors being reported and to increase the precision of the memory errors,
CUDA memcheck must be turned on.
10.1 Increasing the Precision of Memory Errors
With Autostep
Autostep is a command to increase the precision of CUDA exceptions to the exact lane
and instruction, when they would not have been otherwise.
Under normal execution, an exception may be reported several instructions after the
exception occurred, or the exact thread where an exception occurred may not be known
unless the exception is a lane error. However, the precise origin of the exception can be
determined if the program is being single-stepped when the exception occurs. Singlestepping manually is a slow and tedious process; stepping takes much longer than
normal execution and the user has to single-step each warp individually.
www.nvidia.com
CUDA Debugger
DU-05227-042 _v5.0 | 31
Checking Memory Errors
Autostep aides the user by allowing them to specify sections of code where they suspect
an exception could occur, and these sections are automatically and transparently singlestepped the program is running. The rest of the program is executed normally to
minimize the slow-down caused by single-stepping. The precise origin of an exception
will be reported if the exception occurs within these sections. Thus the exact instruction
and thread where an exception occurred can be found quickly and with much less effort
by using autostep.
10.1.1 Usage
autostep [LOCATION]
autostep [LOCATION] for LENGTH [lines|instructions]
‣ LOCATION may be anything that you use to specify the location of a breakpoint, such
as a line number, function name, or an instruction address preceded by an asterisk. If
no LOCATION is specified, then the current instruction address is used.
‣ LENGTH specifies the size of the autostep window in number of lines or instructions
(lines and instructions can be shortened, e.g., l or i). If the length type is not specified,
then lines is the default. If the for clause is omitted, then the default is 1 line.
‣ astep can be used as an alias for the autostep command.
‣ Calls to functions made during an autostep will be stepped over.
‣ In case of divergence, the length of the autostep window is determined by the
number of lines or instructions the first active lane in each warp executes.
Divergent lanes are also single stepped, but the instructions they execute do not count
towards the length of the autostep window.
‣ If a breakpoint occurs while inside an autostep window, the warp where the
breakpoint was hit will not continue autostepping when the program is resumed.
However, other warps may continue autostepping.
‣ Overlapping autosteps are not supported.
If an autostep is encountered while another autostep is being executed, then the second
autostep is ignored.
If an autostep is set before the location of a memory error and no memory error is
hit, then it is possible that the chosen window is too small. This may be caused by
the presence of function calls between the address of the autostep location and the
instruction that triggers the memory error. In that situation, either increase the size of
the window to make sure that the faulty instruction is included, or move to the autostep
location to an instruction that will be executed closer in time to the faulty instruction.
Autostep requires Fermi GPUs or above.
www.nvidia.com
CUDA Debugger
DU-05227-042 _v5.0 | 32
Checking Memory Errors
10.1.2 Related Commands
Autosteps and breakpoints share the same numbering so most commands that work
with breakpoints will also work with autosteps.
10.1.2.1 info autosteps
Shows all breakpoints and autosteps. Similar to info breakpoints.
(cuda-gdb) info autosteps
Num Type
Disp Enb Address
What
1
autostep keep y
0x0000000000401234 in merge at sort.cu:30
for 49 instructions
3
autostep keep y
0x0000000000489913 in bubble at
sort.cu:94 for 11 lines
10.1.2.2 disable autosteps n
Disables an autostep. Equivalent to disable breakpoints n.
10.1.2.3 delete autosteps n
Deletes an autostep. Equivalent to delete breakpoints n.
10.1.2.4 ignore n i
Do not single-step the next i times the debugger enters the window for autostep n. This
command already exists for breakpoints.
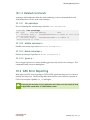
10.2 GPU Error Reporting
With improved GPU error reporting in CUDA-GDB, application bugs are now easier to
identify and easy to fix. The following table shows the new errors that are reported on
GPUs with compute capability sm_20 and higher.
Continuing the execution of your application after these errors are found can lead
to application termination or indeterminate results.
www.nvidia.com
CUDA Debugger
DU-05227-042 _v5.0 | 33
Checking Memory Errors
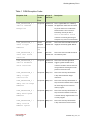
Table 1 CUDA Exception Codes
Exception Code
Precision
of the
Error
Scope of
the Error
CUDA_EXCEPTION_0 :
"Device Unknown
Exception"
Not precise
Global error This is a global GPU error caused by
on the GPU
Description
the application which does not match
any of the listed error codes below.
This should be a rare occurrence.
Potentially, this may be due to
Device Hardware Stack
overflows or a kernel generating an
exception very close to its termination.
CUDA_EXCEPTION_1 :
"Lane Illegal
Address"
Precise
Per lane/
(Requires
thread error illegal(out of bounds) global address.
CUDA_EXCEPTION_2 :
"Lane User Stack
Overflow"
Precise
CUDA_EXCEPTION_3 :
"Device Hardware
Stack Overflow"
Not precise
This occurs when a thread accesses an
memcheck
on)
Per lane/
This occurs when a thread exceeds its
thread error stack memory limit.
Global error This occurs when the application
on the GPU
triggers a global hardware stack
overflow. The main cause of this error
is large amounts of divergence in the
presence of function calls.
CUDA_EXCEPTION_4 :
"Warp Illegal
Instruction"
Not precise
CUDA_EXCEPTION_5 :
"Warp Out-of-range
Address"
Not precise
CUDA_EXCEPTION_6 :
"Warp Misaligned
Address"
Not precise
CUDA_EXCEPTION_7 :
"Warp Invalid
Address Space"
Not precise
www.nvidia.com
CUDA Debugger
Warp error
This occurs when any thread within
a warp has executed an illegal
instruction.
Warp error
This occurs when any thread within a
warp accesses an address that is outside
the valid range of local or shared
memory regions.
Warp error
This occurs when any thread within a
warp accesses an address in the local
or shared memory segments that is not
correctly aligned.
Warp error
This occurs when any thread within
a warp executes an instruction that
DU-05227-042 _v5.0 | 34
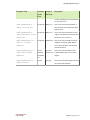
Checking Memory Errors
Exception Code
Precision
of the
Error
Scope of
the Error
Description
accesses a memory space not permitted
for that instruction.
CUDA_EXCEPTION_8 :
"Warp Invalid PC"
Not precise
CUDA_EXCEPTION_9 :
"Warp Hardware Stack
Overflow"
Not precise
CUDA_EXCEPTION_10 :
"Device Illegal
Address"
Not precise
CUDA_EXCEPTION_11 :
"Lane Misaligned
Address"
Precise
Per lane/
(Requires
thread error a global address that is not correctly
CUDA_EXCEPTION_12 :
"Warp Assert"
Precise
www.nvidia.com
CUDA Debugger
Warp error
This occurs when any thread within a
warp advances its PC beyond the 40-bit
address space.
Warp error
This occurs when any thread in a warp
triggers a hardware stack overflow. This
should be a rare occurrence.
Global error This occurs when a thread accesses an
illegal(out of bounds) global address.
For increased precision, use the cuda
memcheck feature.
memcheck
This occurs when a thread accesses
aligned.
on)
Per warp
This occurs when any thread in the warp
hits a device side assertion.
DU-05227-042 _v5.0 | 35
Chapter 11.
WALK-THROUGH EXAMPLES
The chapter contains two CUDA-GDB walk-through examples:
‣ Example 1: bitreverse
‣ Example 2: autostep
‣ Example 3: Debugging an MPI CUDA Application
11.1 Example 1: bitreverse
This section presents a walk-through of CUDA-GDB by debugging a sample
application–called bitreverse–that performs a simple 8 bit reversal on a data set.
Source Code
1
#include <stdio.h>
2
#include <stdlib.h>
3
4
// Simple 8-bit bit reversal Compute test
5
6
#define N 256
7
8
__global__ void bitreverse(void *data) {
9
unsigned int *idata = (unsigned int*)data;
10
extern __shared__ int array[];
11
12
array[threadIdx.x] = idata[threadIdx.x];
13
14
array[threadIdx.x] = ((0xf0f0f0f0 & array[threadIdx.x]) >> 4) |
15
((0x0f0f0f0f & array[threadIdx.x]) << 4);
16
array[threadIdx.x] = ((0xcccccccc & array[threadIdx.x]) >> 2) |
17
((0x33333333 & array[threadIdx.x]) << 2);
18
array[threadIdx.x] = ((0xaaaaaaaa & array[threadIdx.x]) >> 1) |
19
((0x55555555 & array[threadIdx.x]) << 1);
20
21
idata[threadIdx.x] = array[threadIdx.x];
22 }
23
24 int main(void) {
25
void *d = NULL; int i;
26
unsigned int idata[N], odata[N];
27
28
for (i = 0; i < N; i++)
29
idata[i] = (unsigned int)i;
www.nvidia.com
CUDA Debugger
DU-05227-042 _v5.0 | 36
Walk-Through Examples
30
31
32
33
34
35
36
37
38
39
40
41
42
43
44
45 }
cudaMalloc((void**)&d, sizeof(int)*N);
cudaMemcpy(d, idata, sizeof(int)*N,
cudaMemcpyHostToDevice);
bitreverse<<<1, N, N*sizeof(int)>>>(d);
cudaMemcpy(odata, d, sizeof(int)*N,
cudaMemcpyDeviceToHost);
for (i = 0; i < N; i++)
printf('%u -> %u\n', idata[i], odata[i]);
cudaFree((void*)d);
return 0;
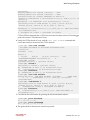
11.1.1 Walking through the Code
1. Begin by compiling the bitreverse.cu CUDA application for debugging by
entering the following command at a shell prompt:
$ nvcc -g -G bitreverse.cu -o bitreverse
This command assumes that the source file name is bitreverse.cu and that no
additional compiler flags are required for compilation. See also Debug Compilation
2. Start the CUDA debugger by entering the following command at a shell prompt:
$ cuda-gdb bitreverse
3. Set breakpoints. Set both the host (main) and GPU (bitreverse) breakpoints
here. Also, set a breakpoint at a particular line in the device function
(bitreverse.cu:18).
(cuda-gdb) break main
Breakpoint 1 at 0x18e1: file bitreverse.cu, line 25.
(cuda-gdb) break bitreverse
Breakpoint 2 at 0x18a1: file bitreverse.cu, line 8.
(cuda-gdb) break 21
Breakpoint 3 at 0x18ac: file bitreverse.cu, line 21.
4. Run the CUDA application, and it executes until it reaches the first breakpoint (main)
set in 3.
(cuda-gdb) run
Starting program: /Users/CUDA_User1/docs/bitreverse
Reading symbols for shared libraries
..++...........................................................
done
Breakpoint 1, main () at bitreverse.cu:25
25 void *d = NULL; int i;
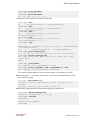
5. At this point, commands can be entered to advance execution or to print the program
state. For this walkthrough, let's continue until the device kernel is launched.
(cuda-gdb) continue
www.nvidia.com
CUDA Debugger
DU-05227-042 _v5.0 | 37
Walk-Through Examples
Continuing.
Reading symbols for shared libraries .. done
Reading symbols for shared libraries .. done
[Context Create of context 0x80f200 on Device 0]
[Launch of CUDA Kernel 0 (bitreverse<<<(1,1,1),(256,1,1)>>>) on
Device 0]
Breakpoint 3 at 0x8667b8: file bitreverse.cu, line 21.
[Switching focus to CUDA kernel 0, grid 1, block (0,0,0),
thread (0,0,0), device 0, sm 0, warp 0, lane 0]
Breakpoint 2, bitreverse<<<(1,1,1),(256,1,1)>>> (data=0x110000)
at bitreverse.cu:9
9 unsigned int *idata = (unsigned int*)data;
CUDA-GDB has detected that a CUDA device kernel has been reached. The debugger
prints the current CUDA thread of focus.
6. Verify the CUDA thread of focus with the info cuda threads command and
switch between host thread and the CUDA threads:
(cuda-gdb) info cuda threads
BlockIdx ThreadIdx To BlockIdx ThreadIdx Count
Virtual PC
Filename
Line
Kernel 0
* (0,0,0)
(0,0,0)
(0,0,0) (255,0,0)
256
0x0000000000866400 bitreverse.cu
9
(cuda-gdb) thread
[Current thread is 1 (process 16738)]
(cuda-gdb) thread 1
[Switching to thread 1 (process 16738)]
#0 0x000019d5 in main () at bitreverse.cu:34
34
bitreverse<<<1, N, N*sizeof(int)>>>(d);
(cuda-gdb) backtrace
#0 0x000019d5 in main () at bitreverse.cu:34
(cuda-gdb) info cuda kernels
Kernel Dev Grid
SMs Mask GridDim BlockDim
Name Args
0
0
1 0x00000001 (1,1,1) (256,1,1) bitreverse
data=0x110000
(cuda-gdb) cuda kernel 0
[Switching focus to CUDA kernel 0, grid 1, block (0,0,0),
thread (0,0,0), device 0, sm 0, warp 0, lane 0]
9
unsigned int *idata = (unsigned int*)data;
(cuda-gdb) backtrace
#0
bitreverse<<<(1,1,1),(256,1,1)>>> (data=0x110000) at
bitreverse.cu:9
7. Corroborate this information by printing the block and thread indexes:
(cuda-gdb) print blockIdx
$1 = {x = 0, y = 0}
(cuda-gdb) print threadIdx
$2 = {x = 0, y = 0, z = 0)
8. The grid and block dimensions can also be printed:
www.nvidia.com
CUDA Debugger
DU-05227-042 _v5.0 | 38
Walk-Through Examples
(cuda-gdb) print gridDim
$3 = {x = 1, y = 1}
(cuda-gdb) print blockDim
$4 = {x = 256, y = 1, z = 1)
9. Advance kernel execution and verify some data:
(cuda-gdb) next
12
array[threadIdx.x] =
(cuda-gdb) next
14
array[threadIdx.x] =
array[threadIdx.x]) >> 4) |
(cuda-gdb) next
16
array[threadIdx.x] =
array[threadIdx.x]) >> 2) |
(cuda-gdb) next
18
array[threadIdx.x] =
array[threadIdx.x]) >> 1) |
(cuda-gdb) next
idata[threadIdx.x];
((0xf0f0f0f0 &
((0xcccccccc &
((0xaaaaaaaa &
Breakpoint 3, bitreverse <<<(1,1),(256,1,1)>>> (data=0x100000)
at bitreverse.cu:21
21
idata[threadIdx.x] = array[threadIdx.x];
(cuda-gdb) print array[0]@12
$7 = {0, 128, 64, 192, 32, 160, 96, 224, 16, 144, 80, 208}
(cuda-gdb) print/x array[0]@12
$8 = {0x0, 0x80, 0x40, 0xc0, 0x20, 0xa0, 0x60, 0xe0, 0x10,
0x90, 0x50,
0xd0}
(cuda-gdb) print &data
$9 = (@global void * @parameter *) 0x10
(cuda-gdb) print *(@global void * @parameter *) 0x10
$10 = (@global void * @parameter) 0x100000
The resulting output depends on the current content of the memory location.
10.Since thread (0,0,0) reverses the value of 0, switch to a different thread to show
more interesting data:
cuda-gdb) cuda thread 170
[Switching focus to CUDA kernel 0, grid 1, block (0,0,0),
thread
(170,0,0), device 0, sm 0, warp 5, lane 10]
11.Delete the breakpoints and continue the program to completion:
(cuda-gdb) delete breakpoints
Delete all breakpoints? (y or n) y
(cuda-gdb) continue
Continuing.
Program exited normally.
(cuda-gdb)
www.nvidia.com
CUDA Debugger
DU-05227-042 _v5.0 | 39
Walk-Through Examples
11.2 Example 2: autostep
This section shows how to use the autostep command and demonstrates how it helps
increase the precision of memory error reporting.
Source Code
In this small example, we have an array of pointers to integers, and we want to do some
operations on the integers. Suppose, however, that one of the pointers is NULL as shown
in line 38. This will cause CUDA_EXCEPTION_10 "Device Illegal Address" to be
thrown when we try to access the integer that corresponds with block 3, thread 39. This
exception should occur at line 16 when we try to write to that value.
11.2.1 Debugging with Autosteps
1. Compile the example and start CUDA-GDB as normal. We begin by running the
program:
(cuda-gdb) run
Starting program: /home/jitud/cudagdb_test/autostep_ex/example
[Thread debugging using libthread_db enabled] [New Thread
0x7ffff5688700 (LWP 9083)]
[Context Create of context 0x617270 on Device 0]
[Launch of CUDA Kernel 0 (example<<<(8,1,1),(64,1,1)>>>) on
Device 0]
Program received signal CUDA_EXCEPTION_10, Device Illegal
Address.
[Switching focus to CUDA kernel 0, grid 1, block (1,0,0),
thread (0,0,0), device 0, sm 1, warp 0, lane 0]
0x0000000000796f60 in example (data=0x200300000) at
example.cu:17
17
*(data[idx1]) = value3;
As expected, we received a CUDA_EXCEPTION_10. However, the reported thread
is block 1, thread 0 and the line is 17. Since CUDA_EXCEPTION_10 is a Global error,
there is no thread information that is reported, so we would manually have to inspect
all 512 threads.
2. Set autosteps. To get more accurate information, we reason that since
CUDA_EXCEPTION_10 is a memory access error, it must occur on code that accesses
memory. This happens on lines 11, 12, 16, 17, and 18, so we set two autostep windows
for those areas:
(cuda-gdb) autostep 11 for 2 lines
Breakpoint 1 at 0x796d18: file example.cu, line 11.
Created autostep of length 2 lines
(cuda-gdb) autostep 16 for 3 lines
Breakpoint 2 at 0x796e90: file example.cu, line 16.
www.nvidia.com
CUDA Debugger
DU-05227-042 _v5.0 | 40
Walk-Through Examples
Created autostep of length 3 lines
3. Finally, we run the program again with these autosteps:
(cuda-gdb) run
The program being debugged has been started already.
Start it from the beginning? (y or n) y
[Termination of CUDA Kernel 0 (example<<<(8,1,1),(64,1,1)>>>)
on Device 0]
Starting program: /home/jitud/cudagdb_test/autostep_ex/example
[Thread debugging using libthread_db enabled]
[New Thread 0x7ffff5688700 (LWP 9089)]
[Context Create of context 0x617270 on Device 0]
[Launch of CUDA Kernel 1 (example<<<(8,1,1),(64,1,1)>>>) on
Device 0]
[Switching focus to CUDA kernel 1, grid 1, block (0,0,0),
thread (0,0,0),
device 0, sm 0, warp 0, lane 0]
Program received signal CUDA_EXCEPTION_10, Device Illegal
Address.
[Current focus set to CUDA kernel 1, grid 1, block (3,0,0),
thread
(32,0,0), device 0, sm 1, warp 3, lane 0]
Autostep precisely caught exception at example.cu:16 (0x796e90)
This time we correctly caught the exception at line 16. Even though
CUDA_EXCEPTION_10 is a global error, we have now narrowed it down to a warp
error, so we now know that the thread that threw the exception must have been in the
same warp as block 3, thread 32.
In this example, we have narrowed down the scope of the error from 512 threads down
to 32 threads just by setting two autosteps and re-running the program.
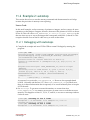
11.3 Example 3: Debugging an MPI CUDA
Application
For doing large MPI CUDA application debugging, NVIDIA recommends using
parallel debuggers supplied by our partners Allinea and Totalview. Both make excellent
parallel debuggers with extended support for CUDA. However, for debugging smaller
applications, or for debugging just a few processes in a large application, CUDA-GDB
can easily be used.
If the cluster nodes have xterm support, then it is quite easy to use CUDA-GDB. Just
launch CUDA-GDB in the same way you would have launched gdb.
$ mpirun -np 4 -host nv1,nv2 xterm -e cuda-gdb a.out
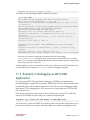
You may have to export the DISPLAY variable to make sure that the xterm finds its way
back to your display. For example, with Open MPI you would do something like this.
www.nvidia.com
CUDA Debugger
DU-05227-042 _v5.0 | 41
Walk-Through Examples
$ mpirun -np 4 -host nv1,nv2 -x DISPLAY=host.nvidia.com:0 xterm e cuda-gdb a.out
Different MPI implementations have different ways of exporting environment variables
to the cluster nodes so check your documentation.
In the case where you cannot get xterm support, you can insert a spin loop inside your
program. This works in just the same way as when using gdb on a host only program.
Somewhere near the start of your program, add a code snippet like the following.
{
}
int i = 0;
char host[256];
printf("PID %d on node %s is ready for attach\n",
getpid(), host);
fflush(stdout);
while (0 == i) {
sleep(5);
}
Then recompile and run the program. After it starts, ssh to the nodes of interest and
attach to the process. Set the variable i to 1 to break out of the loop.
$ mpirun -np 2 -host nv1,nv2 a.out
PID 20060 on node nv1 is ready for attach
PID 5488 on node nv2 is ready for attach
[nv1]$ cuda-gdb --pid 5488
[nv2]$ cuda-gdb --pid 20060
For larger applications in the case where you may just want to attach to a few of
the processes, you can conditionalize the spin loop based on the rank. Most MPIs
set an environment variable that is the rank of the process. For Open MPI it is
OMPI_COMM_WORLD_RANK and for MVAPICH it is MV2_COMM_WORLD_RANK.
Assuming you want to attach to rank 42, you could add a spin loop like this.
{
}
char *stoprank;
stoprank = getenv("OMPI_COMM_WORLD_RANK");
if (42 == atoi(stoprank) {
int i = 0;
char hostname[256];
printf("PID %d on %s ready for attach\n",
getpid(), hostname);
fflush(stdout);
while (0 == i) {
sleep(5);
}
}
www.nvidia.com
CUDA Debugger
DU-05227-042 _v5.0 | 42
Walk-Through Examples
Note that there is currently a limitation of running only one CUDA-GDB process per
node. The workaround described in Multiple Debuggers does not work with MPI
applications. If CUDA_VISIBLE_DEVICES is set, it may cause problems with the GPU
selection logic in the MPI application. It may also prevent CUDA IPC working between
GPUs on a node. Therefore, for the current release, use only one CUDA-GDB per node
with an MPI application.
www.nvidia.com
CUDA Debugger
DU-05227-042 _v5.0 | 43
Appendix A.
SUPPORTED PLATFORMS
The general platform and GPU requirements for running NVIDIA CUDA-GDB are
described in this section.
A.1 Host Platform Requirements
Mac OS
CUDA-GDB is supported on both 32-bit and 64-bit editions of the following Mac OS
versions:
‣ Mac OS X 10.7
‣ Mac OS X 10.8
Linux
CUDA-GDB is supported on both 32-bit and 64-bit editions of the following Linux
distributions:
‣
‣
‣
‣
‣
‣
Red Hat Enterprise Linux 5.5+ (64-bit only)
Red Hat Enterprise Linux 6.x
Ubuntu 10.04, and 11.10
Fedora 16
OpenSuse 12.1
Suse Linux Enterprise Server 11.1 and 11 SP2
GPU Requirements
Debugging is supported on all CUDA-capable GPUs with a compute capability of 1.1 or
later. Compute capability is a device attribute that a CUDA application can query about;
for more information, see the latest NVIDIA CUDA Programming Guide on the NVIDIA
CUDA Zone Web site: http://developer.nvidia.com/object/gpucomputing.html.
www.nvidia.com
CUDA Debugger
DU-05227-042 _v5.0 | 44
Supported Platforms
These GPUs have a compute capability of 1.0 and are not supported:
‣
‣
‣
‣
‣
‣
‣
‣
‣
‣
GeForce 8800 GTS
GeForce 8800 GTX
GeForce 8800 Ultra
Quadro Plex 1000 Model IV
Quadro Plex 2100 Model S4
Quadro FX 4600
Quadro FX 5600
Tesla C870
Tesla D870
Tesla S870
www.nvidia.com
CUDA Debugger
DU-05227-042 _v5.0 | 45
Appendix B.
KNOWN ISSUES
The following are known issues with the current release.
‣ Setting the cuda memcheck option ON will make all the launches blocking.
‣ Conditional breakpoints can only be set after the CUDA module is loaded.
‣ Device memory allocated via cudaMalloc() is not visible outside of the kernel
function.
‣ On GPUs with sm_type lower than sm_20 it is not possible to step over a subroutine
in the device code.
‣ Requesting to read or write GPU memory may be unsuccessful if the size is larger
than 100MB on Tesla GPUs and larger than 32MB on Fermi GPUs.
‣ On GPUs with sm_20, if you are debugging code in device functions that get called
by multiple kernels, then setting a breakpoint in the device function will insert the
breakpoint in only one of the kernels.
‣ In a multi-GPU debugging environment on Mac OS X with Aqua running, you may
experience some visible delay while single-stepping the application.
‣ Setting a breakpoint on a line within a __device__ or __global__ function
before its module is loaded may result in the breakpoint being temporarily set on
the first line of a function below in the source code. As soon as the module for the
targeted function is loaded, the breakpoint will be reset properly. In the meantime,
the breakpoint may be hit, depending on the application. In those situations, the
breakpoint can be safely ignored, and the application can be resumed.
‣ The scheduler-locking option cannot be set to on.
‣ Stepping again after stepping out of a kernel results in undetermined behavior. It is
recommended to use the 'continue' command instead.
‣ OpenGL applications may require to launch X in non-interactive mode. See CUDA/
OpenGL Interop Applications on Linux for details.
www.nvidia.com
CUDA Debugger
DU-05227-042 _v5.0 | 46
Notice
ALL NVIDIA DESIGN SPECIFICATIONS, REFERENCE BOARDS, FILES, DRAWINGS,
DIAGNOSTICS, LISTS, AND OTHER DOCUMENTS (TOGETHER AND SEPARATELY,
"MATERIALS") ARE BEING PROVIDED "AS IS." NVIDIA MAKES NO WARRANTIES,
EXPRESSED, IMPLIED, STATUTORY, OR OTHERWISE WITH RESPECT TO THE
MATERIALS, AND EXPRESSLY DISCLAIMS ALL IMPLIED WARRANTIES OF
NONINFRINGEMENT, MERCHANTABILITY, AND FITNESS FOR A PARTICULAR
PURPOSE.
Information furnished is believed to be accurate and reliable. However, NVIDIA
Corporation assumes no responsibility for the consequences of use of such
information or for any infringement of patents or other rights of third parties
that may result from its use. No license is granted by implication of otherwise
under any patent rights of NVIDIA Corporation. Specifications mentioned in this
publication are subject to change without notice. This publication supersedes and
replaces all other information previously supplied. NVIDIA Corporation products
are not authorized as critical components in life support devices or systems
without express written approval of NVIDIA Corporation.
Trademarks
NVIDIA and the NVIDIA logo are trademarks or registered trademarks of NVIDIA
Corporation in the U.S. and other countries. Other company and product names
may be trademarks of the respective companies with which they are associated.
Copyright
© 2007-2012 NVIDIA Corporation. All rights reserved.
www.nvidia.com