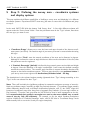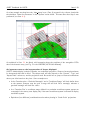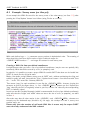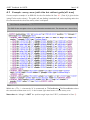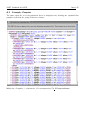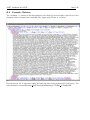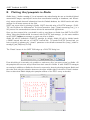
1
EUROPEAN SOUTHERN OBSERVATORY
Organisation Européene pour des Recherches Astronomiques dans l’Hémisphère Austral
Europäische Organisation für astronomische Forschung in der südlichen Hemisphäre
ESO - European Southern Observatory
Karl-Schwarzschild Str. 2, D-85748 Garching bei München
ESO Survey Telescopes
Survey Area Definition Tool
SADT Cookbook for VISTA
Doc. No. VLT-MAN-ESO-19200-5168
Issue 2.1, Date 18/12/2013
Prepared
Michael Hilker
Name
Approved
Date
Signature
Francesca Primas
. . . . . . . . . . . . . . . . . . . . . . . . . . . . . . . . . . . . . . . . . .
Name
Released
18 December 2013
. . . . . . . . . . . . . . . . . . . . . . . . . . . . . . . . . . . . . . . . . .
Date
Signature
Fernando Comerón
. . . . . . . . . . . . . . . . . . . . . . . . . . . . . . . . . . . . . . . . . .
Name
Date
Signature
SADT Cookbook for VISTA
This page was intentionally left blank
Issue 2 ii
SADT Cookbook for VISTA
Issue 2 iii
Change Record
Issue/Rev.
Issue 1.0
Issue 1.1
Issue 1.2
Issue 1.3
Issue 2
Issue 2.1
Date
Section/Parag. affected
29/09/09 all
21/12/09 small changes in most sections
22/06/10 small changes in Sects. 2.2, 3.1,
3.2, 4.1, 4.2, 7.1; update of figures;
major additions to Appendices A.1
and C.2
16/12/10 some changes in Sects. 3.1, 3.2,
4.1, 4.2, 7.1, 7.2, 8 and Appendix
C.2; update of figures
16/08/11 small changes of title and in Sects.
1.1, 2.2, 3.2, 4.2, 7, 7.2, C.2; update of figures and web links
18/12/13 some changes due to new feature
of guide star search in 1st pawprint
only in Sects. 3.2, 4.1, 5.1, 5.2, 6.2
and 7.2; update of figures
Reason/Initiation/Remarks
First release, for SV and Dry Runs
Version for first official period
Version for P86 (SADT version
4.06)
Version for P87 (SADT version
5.02)
Version for VISTA P88 (SADT version 5.04)
Version for VISTA P93 (SADT version 5.1)
SADT Cookbook for VISTA
Issue 2 iv
This page was intentionally left blank
SADT Cookbook for VISTA
Issue 2 v
Contents
1 Introduction
1.1 Scope of this document . . . .
1.2 Contents of this document . . .
1.3 Contact information . . . . . .
1.4 Credits and acknowledgements
1.5 Abbreviations and Acronyms . .
.
.
.
.
.
1
1
1
1
1
2
2 The SADT concept and limitations: read this first
2.1 What does SADT do? . . . . . . . . . . . . . . . . . . . . . . . . . . . . . . . .
2.2 Some important limitations of the tool . . . . . . . . . . . . . . . . . . . . . . .
3
3
3
3 Step 0: Getting ready – define your survey layout and observing strategy
3.1 What you need . . . . . . . . . . . . . . . . . . . . . . . . . . . . . . . . . . . .
3.2 The Guide/aO star input catalog . . . . . . . . . . . . . . . . . . . . . . . . . .
3.3 Splitting the survey into survey areas . . . . . . . . . . . . . . . . . . . . . . . .
4
4
5
5
4 Step 1: Starting SADT and setting some basic parameters
4.1 Configuration preferences . . . . . . . . . . . . . . . . . . . . . . . . . . . . . .
4.2 Further basic settings . . . . . . . . . . . . . . . . . . . . . . . . . . . . . . . .
6
7
9
.
.
.
.
.
.
.
.
.
.
.
.
.
.
.
.
.
.
.
.
.
.
.
.
.
.
.
.
.
.
.
.
.
.
.
.
.
.
.
.
.
.
.
.
.
.
.
.
.
.
.
.
.
.
.
.
.
.
.
.
.
.
.
.
.
.
.
.
.
.
.
.
.
.
.
5 Step 2: Defining the survey area – coordinate systems and
5.1 Case A: defining and displaying a non-contiguous area . . .
5.2 Case B: defining and displaying an area with exclusions . . .
5.3 Display options . . . . . . . . . . . . . . . . . . . . . . . .
.
.
.
.
.
.
.
.
.
.
.
.
.
.
.
.
.
.
.
.
.
.
.
.
.
.
.
.
.
.
.
.
.
.
.
.
.
.
.
.
.
.
.
.
.
.
.
.
.
.
.
.
.
.
.
display options
. . . . . . . . . . . .
. . . . . . . . . . . .
. . . . . . . . . . . .
11
14
16
17
some tile operations
. . . . . . . . . . . . . . . .
. . . . . . . . . . . . . . . .
. . . . . . . . . . . . . . . .
20
20
22
24
7 Step 4: The search for guide and aO stars – the final tiling procedure
7.1 Case A: a smooth tiling run near the Galactic plane . . . . . . . . . . . . . . . .
7.2 Case B: a tiling run close to the Galactic pole . . . . . . . . . . . . . . . . . . . .
26
26
30
8 Step 5: Saving, opening, and other file options
32
A XML files
A.1 Example:
A.2 Example:
A.3 Example:
A.4 Example:
34
35
36
37
38
6 Step 3: Tiling the survey area – a first test run and
6.1 Case A: Tiling of non-contiguous survey areas . . .
6.2 Case B: Tiling of areas with excluded sub-areas . . .
6.3 Tile operations in the display window . . . . . . . .
Survey areas (no tiles yet) . . . . .
survey areas (with tiles but without
Pawprint . . . . . . . . . . . . . .
Refstars . . . . . . . . . . . . . .
. . . . . . . . .
guide/aO stars)
. . . . . . . . .
. . . . . . . . .
.
.
.
.
.
.
.
.
.
.
.
.
.
.
.
.
.
.
.
.
.
.
.
.
.
.
.
.
.
.
.
.
.
.
.
.
.
.
.
.
.
.
.
.
SADT Cookbook for VISTA
Issue 2 vi
B Plotting tiles/pawprints in Aladin
39
C Help menu and configuration files
C.1 Instrument package settings for SADT . . . . . . . . . . . . . . . . . . . . . . .
C.2 Configuration Files . . . . . . . . . . . . . . . . . . . . . . . . . . . . . . . . . .
41
41
42
SADT Cookbook for VISTA
1
1.1
Issue 2 1
Introduction
Scope of this document
The document explains the necessary steps an astronomer has to perform to define an area on the
sky that shall be covered by observations with the ESO Survey Telescope VISTA. It is written in a
linear fashion and is supposed to be followed step by step, i.e. section by section.
1.2
Contents of this document
The document contains only the basic knowledge on SADT needed to define a survey. This version
of the Cookbook is tailored for observations with VISTA only. It describes the main functionalities
of the tool, but does not describe the installation of the tool (see the SADT web page for that)
nor the use of its output files for the further phase 2 preparation with P2PP version 3.4 for Public
Surveys. For those actions please consult the following web pages:
http://www.eso.org/sci/observing/phase2/SMGuidelines/SADT.html
http://www.eso.org/sci/observing/phase2/SMGuidelines/SADT/SADTInstall.html
http://www.eso.org/sci/observing/phase2/P2PP3.html
1.3
Contact information
In case of specific questions related to SADT and its use together with P2PP for Public Surveys
please contact the ESO User Support Department via this email address:
[email protected]
1.4
Credits and acknowledgements
This Cookbook is mainly based on the document ‘Survey Area Definition Tool: User Manual for
VISTA’ (issue 2.0) by Jim Emerson, the VISTA Data Flow System project leader. This manual can
be downloaded from the web page of the VISTA consortium:
http://www.vista.ac.uk/observing/sadt/
The SADT is part of the UK’s software in kind contribution on joining ESO and was written
by members of STFC’s United Kingdom Astronomy Technology Centre, an establishment of the
Science and Technology Facilities Council. Specifically (in time order) by: Martin Folger, Nuria
Lorente, and Albert Heyrovsky. The above interacted closely with Jim Emerson (VISTA PI) who
set the requirements and latterly modified some code.
In 2013, the SADT code was further updated and modified by the Data Flow Infrastructure (DFI)
department of ESO. Particular thanks goes to Paula Correia dis Santos from DFI.
SADT Cookbook for VISTA
1.5
Abbreviations and Acronyms
aO
CCD
ESO
GUI
OB
P2PP
PLASTIC
SADT
TCS
USD
VLT
VISTA
VST
active Optics (to differentiate it from AO=Adaptive Optics)
Charge Coupled Device
European Southern Observatory
Graphical User Interface
Observation Block
Phase II Proposal Preparation
Platform for Astronomical Tool Interconnection
Survey Area Definition Tool
Telescope Control System
User Support Department
Very Large Telescope
Visible and Infrared Survey Telescope for Astronomy
VLT Survey Telescope
Issue 2 2
SADT Cookbook for VISTA
2
2.1
Issue 2 3
The SADT concept and limitations: read this first
What does SADT do?
SADT is a software tool that, in the end, produces a file that you must import into P2PP for
Public Surveys to generate the Observation Blocks (OBs) of your survey. That file, called XML
Survey Definition file (or just XML file in the following), contains a list of all pointing positions
for each tile and its pawprints within a survey. In addition it contains the positions of suitable guide
and wave front sensor (or active optics (aO)) stars for each pawprint that are necessary to observe
each survey tile under optimal telescope performance. SADT searches for the guide and aO stars
using public star catalogs from the web. It iteratively adjusts the tile positions if an insufficient
number of suitable guide/aO stars is found. Thus, SADT is an auxiliary, but also mandatory
tool that facilitates the creation of the numerous OBs of a survey together with P2PP. SADT is
not concerned about the observing strategy except some input parameters regarding the tile and
jitter pattern (see Sects. 3 and 4).
Creating one or several XML files is your goal. Before you start with SADT, you need to have
a clear idea about your survey layout (boundaries, overlap) and observing strategy (tile pattern,
jittering, etc., see Sect. 3.1). How to get from these input parameters to your desired output
product is explained step by step in this Cookbook.
2.2
Some important limitations of the tool
SADT supports the definition of areas using coordinate ranges or geodesic rectangles/circles in
different coordinate systems, like FK5 (J2000), Galactic or Ecliptic coordinates. However, not all
kinds of coordinate definitions are appropriate for all areas on the sky, i.e. one should use geodesic
rectangles and not coordinate ranges for areas with declinations/latitudes below −60 deg. Trying
to define areas with coordinate ranges close to the poles of a coordinate system results in a wrong
graphical representation of the tiles. Even when using geodesic rectangles and choosing the plot
type ‘South Polar Plot’ some tile borders of tiles that cover the polar region might not be correctly
represented in the display window, although the output files are correct.
A single tile defined directly on the Southern Galactic Pole is not possible with the current version
of SADT (i.e. a small circle or rectangle area centred on the pole). A possible work around is
either to define a very large region that starts far from the pole or to make the tiles near the pole
in another coordinate system with a different pole (e.g. Galactic or Ecliptic).
The tiles within one survey area definition will all have the same orientation. If more than one
orientation is needed within a survey, the total survey area has to be split up into several independent
area definitions with different tile orientations.
The allocation of tiles in a survey area will always start in the South-West (lower right) corner of
each survey area. It is not possible to choose another starting point of the tile allocation.
The SADT display does not show the location of any targets, like bright stars or extended galaxies.
To avoid bright stars either define some sub-areas that shall be excluded from a survey area
(Sect. 5.2) or delete individual tiles after the survey area tiles were defined (Sect. 6.3). There
exists the possibility to plot tiles (or overlay them on sky images) in Aladin or other VO tools
communicating via a ‘PLASTIC’ hub (see Appendix B).
SADT Cookbook for VISTA
3
Issue 2 4
Step 0: Getting ready – define your survey layout and
observing strategy
This step describes the preparations done outside SADT. Having all the following parameters and
information in hand is an important prerequisite to successfully run SADT.
3.1
What you need
This Cookbook assumes that you are already familiar with the instrument used for the survey
observations. In particular, you should know the layout of the detector array, i.e. the pawprint,
and the total size of the tile you want to use to uniformly cover an area. A tile is a filled and fully
sampled area of sky formed by combining multiple pawprints. Because of the detector spacing,
the minimum number of pointed observations (with fixed offsets) required for reasonably uniform
coverage of a VIRCAM tile is 6. This exposes each piece of sky, away from the edges of the tile,
to at least 2 camera pixels. All this information can be found in the VIRCAM/VISTA User Manual
(in particular, Fig. 5 and Table 15), which can be downloaded from this web page:
http://www.eso.org/sci/facilities/paranal/instruments/vircam/doc/
In the following the parameters that are relevant for SADT are summarized:
• Borders of your survey or survey areas: this can either be a coordinate range in right
ascension/declination (in the FK5 (J2000) or FK4 (B1950) system) or longitude/latitude (in
the Galactic or ecliptic system), or it can be a geodesic rectangle or circle with a central
coordinate (in either of the coordinate systems mentioned before) and a width/height or
radius in degrees.
• Position Angle of your survey area: in case your survey area shall be tilted with respect
to a specific coordinate system you should be prepared to provide a position angle (with the
usual counter-clockwise convention North = 0 degrees, East = 90 degrees).
• Orientation of the tiles: The orientation of the Y-axis of the tiles with respect to the
survey area can be chosen in steps of 90 degrees: 0, 90, 180 and 270 degrees. Note that
within a survey area definition the tile orientation cannot be changed.
• Overlap of adjacent tiles: depending on your observing strategy you might want to change
the default overlap of 60 arcsecs in X and Y to another value. SADT computes the position
of the adjacent tiles taking the desired overlaps into account.
• Tile pattern: to fully cover an area by VIRCAM pawprints, six pre-defined offsets are
necessary. Different offset patterns are described in the template description of the VIRCAM/VISTA User Manual (see Fig. 21). The tile pattern has to be predefined in SADT and
will be automatically transfered to the OBs (no later change possible). Further details are
given in Sect. 4.2.
• Maximum jitter amplitude: during the preparation of the OBs different jitter patterns
with different maximum amplitudes and microsteps can be chosen (see VIRCAM/VISTA
User Manual, Fig. 22 and Table 8). SADT has to know the maximum jitter+microstep
amplitude (+/-, i.e. from 0 to max or min) in order to reduce the search area for suitable
SADT Cookbook for VISTA
Issue 2 5
guide and aO stars accordingly (such that none of the stars falls outside the autoguider and
wave front sensor CCDs). Note that the jitter scale factor has to be taken into account when
calculating the maximum jitter amplitude.
3.2
The Guide/aO star input catalog
SADT needs star catalogs in order to search for guide and active optics stars. The autoguider
and wave front sensor CCDs have peak sensitivity the I band (see Sect. 4.2). Four catalogs are
selectable from a pull-down menu within SADT. Those are UCAC3, GSC-2, 2MASS and USNO.
From P88 onwards we recommend to use the 2MASS catalog for high Galactic latitude fields,
and GSC-2 or UCAC3 for fields close to the Galactic plane and bulge. Regarding completeness,
homogeneity and accuracy 2MASS is the most appropriate catalog for the search of guide/aO
stars. SADT calculates synthesised I-band magnitudes from JHK colours. The colour range
of valid stars was restricted to (J − H) < 0.8 mag in order to avoid very red stars for which
the transformation from JHK to I has a large scatter. In case 2MASS does not give the desired
result, GSC-2 should be used, since it has been extensively tested during commissioning and science
verification. Another option for crowded regions is UCAC3. And, of course, you need an enabled
network connection to access the external catalogs.
Based on the experience gained in the first year of survey operations with VISTA the limiting
magnitudes for the search of guide and active optics stars were adjusted towards brighter magnitudes
at the beginning of P87. The same brighter limits are also valid after the mirror recoating (for
P88 OBs). That means that in certain areas for which guide/aO stars were found with previous
versions of SADT (before P87), tiling may fail or may need more backtracking with the current
SADT version. Note that the suitable magnitude ranges of guide/aO stars are adjusted for each
catalog individually.
For P93, a new feature has been added to SADT. For surveys with short exposures (e.g. VVV and
VHS), where a very accurate guiding is not necessary, the guide star search can be performed for
the first pawprint of a tile 6 pattern only. This might result in a smaller number of backtrackings
in areas where are only few guide stars available.
3.3
Splitting the survey into survey areas
If you belong to the happy astronomers who got approved an ESO Public Survey that lasts over
several years, you probably have a large area to cover (or a very deep field). In principle, you
can define the whole survey area at once with SADT. Practically, your survey observations will be
scheduled in semesters/periods, i.e. you will be asked to submit the OBs that correspond to the
total execution time allocated per semester. Thus, a natural split of your survey would be into
individual survey areas that shall be covered in a certain observing period. Of course, the chosen
areas should be observable in that semester.
Another reason for splitting the total survey into individual survey area definitions might be a
different observing strategy in different regions, for example different filter sets, different exposure
times, different jitter patterns, etc. In this respect, be reminded that SADT is an auxiliary tool to
help you create a large number of OBs that share the same structure.
Yet another reason is to reduce the very long catalog search times for large surveys to manageable
chunks.
Of course, the above considerations also apply to users who got approved a normal programme
with VISTA.
SADT Cookbook for VISTA
4
Issue 2 6
Step 1: Starting SADT and setting some basic parameters
Do you have all the information ready pointed out in Step 0? Do you have installed SADT and P2PP
for Public Surveys on your machine? Did you set the correct path to P2PP’s VIRCAM instrument
package (check the SADT installation web page if you do not know what this is about)? If yes,
you are ready to start SADT. To do so go to the bin directory of your SADT installation and type:
> ./sadt -c vista &
and you should see the following window pop-up (here under Mac OS X):
This is the main SADT window, or SADT GUI (Graphical User Interface).
The first thing you can do is to give your survey area a name. Type this name into the ’Survey ID’
field on the upper left, for example ‘vista survey’ (case A in the following). The output XML file
will then get the name ‘vista survey.xml’.
Note: The ‘Survey ID’ will also form part of the name of the OBs and parameter files created for
your survey by SADT/P2PP, so use something brief but clear.
Next some basic parameters have to be set.
SADT Cookbook for VISTA
4.1
Issue 2 7
Configuration preferences
From the pull-down menu ‘Options’,
select the entry ‘Configure...’. You will see popping up the following ‘Configuration preferences’
window:
• First, you can define the desired overlap in X and Y for the adjacent tiles. The overlap size
is given in arcsecs. Note that for all pawprint patterns, except Tile1 00, there exists an upper
and lower horizontal strip of about 330 arcsec width that is covered only once by a pawprint,
thus these strips are singly exposed (see Fig. 16 of the VIRCAM/VISTA User Manual).
Since it is assumed that all the survey area shall be covered by at least two pawprints (doubly
exposed), the definition of the Y overlap excludes the 330 arcsec wide horizontal strips on the
top and bottom of the tile. In other words, the following overlaps in X and Y should be applied
for different situations (see also the VISTA web page http://vista.ac.uk/observing/sadt/):
– overlap X = 0, overlap Y = 0: adjacent tiles do not overlap in X, but they overlap
in Y by 330 arcsec. This ensures that the whole survey area, except at the upper/lower
edges, is covered by two exposures at least (= doubly exposed).
– overlap X = 0, overlap Y = -330: adjacent tiles just butt in X and Y, there is no
overlap of tiles. This means that there will be 660 arcsec wide strips within the survey
area that are only singly exposed (covered by only one exposure). This option is not
recommended.
SADT Cookbook for VISTA
Issue 2 8
– overlap X > 0, overlap Y > 0 and < +330: adjacent tiles will overlap in X and
Y by this amount. Overlapping areas are partially 2× singly exposed in the middle
of the overlap, and partially 1× singly and 1× doubly exposed, thus covered by three
exposures at least. For an overlap Y > +330, the overlapping regions are exposed
minimum 4×.
– overlap X = 60, overlap Y = 60: doubly exposed areas of adjacent tiles will overlap
in X and Y by 60 arcsec. These default values are recommended for ease of tying
together adjacent tiles during data processing.
There will be a warning message if you enter values outside the ranges 0 to 120 and -330 to
390 for the X and Y overlap, respectively. This is to make you aware that the chosen values
might not be the optimal ones.
• Second, you should define the Maximum Jitter Amplitude to be used in the OBs. It is
defined as the largest modulus of all the offset values (in arcsecs) of a jitter pattern rounded
up. The selectable jitter patterns and their offset values are given in the VIRCAM/VISTA
User Manual (see Fig. 22 and Table 8). Note that the jitter offset may be scaled by the
multiplicative factor ‘Jitter scale value’ in the OB definition, so ‘Maximum size of jitter’
must be multiplied by ‘Jitter scale value’ if a value other than the default of 1.0 is used. A
maximum jitter amplitude of 15 arcsec (the default value) is large enough to accommodate
all pre-defined jitter patterns with ‘Jitter scale value = 1’.
Important note: If the maximum jitter amplitude is set larger than necessary, the area over
which guide/aO stars will be sought will be smaller than necessary, which could be a problem
especially in regions of low star surface density.
If the maximum jitter amplitude is set smaller than the actual maximum jitter amplitude used
in the OBs some guide/aO stars may fall off the CCD during a jitter, causing the failure of
the OB execution. This has to be avoided.
Thus, the maximum jitter amplitudes set in SADT MUST NOT be smaller than the values
implicitly chosen for the OBs created in P2PP (by choice of ‘Name of Jitter pattern’ and
‘Jitter Scale Multiplier’).
There will be a warning message if you enter a value outside the range 6.4 to 33.1 (which
encompasses most of the standard use cases). This is to make you aware that the chosen
value might not be an appropriate one.
• Next, the Tile Orientation can be chosen from a pull-down menu to be 0, 90, 180 or 270
degrees. This rotates the tiles with respect to the position angle of a given survey area. The
angle is defined counter-clockwise, with the positive Y-axis of the IR detector array (which
is the short axis of the rectangular tile) being at 0 degrees.
Because VISTA tiles are rectangular, not square, a more efficient tiling of a small survey area
(fewer tiles to cover it) can result from choosing an appropriate tile orientation.
• Finally, the Backtrack Step defines the amount in arcsecs by which the SADT’s guide/aO
star search algorithm shifts a tile back along the row of tiles. The backtrack step is repeated
until guide/aO stars are found or the previous tile position is reached. Note that backtracking
has the following effects: 1) more tiles may be needed than are found with the ‘Find guide/aO
Stars’ selection set to ‘Off’ in the ‘Options’ menu; 2) the X boundaries of tiles in adjacent
rows will not match up (or Y boundaries in case of tile orientations of 90 or 270 degrees);
and 3) the tile centres at the end of the process will differ from those at the start.
SADT Cookbook for VISTA
Issue 2 9
There will be a warning message if you enter a value outside the range 20 to 531. This is to
make you aware that the chosen value might not be an appropriate one. A change of less
than 20 arcsec would lead to many backtrack steps in low density regions, and thus might
slow down the tiling process considerably. A value larger than 531 arcsec would shift the field
by more than the size of the auxiliary detectors.
Confirm all your settings by clicking the ’OK’ button.
Important note: SADT does not remember the last values used when it was last shutdown so
these options will need to be set each time SADT is started up.
4.2
Further basic settings
In the main SADT window you have two pull-down menus in the lower half, one to set the tile
pattern, the other to choose a catalog.
Select Tile Pattern: In this pull-down menu you have to define the tile pattern you want to use
for your observations. This tile pattern will automatically be transfered to the OBs. It must not
be changed in P2PP later! The different tile patterns, their acronyms and their sequences of
offsets are explained in detail in the VIRCAM/VISTA User Manual (see Fig. 21).
Seelect Catalogue: The second pull-down menu allows you to choose the catalog that shall be
used by SADT to search for appropriate guide and aO stars.
Note that the guide/aO star CCDs have their peak sensitivity in the I-band (0.60-0.87 micron)
and so the use of catalogs that do not provide equivalent magnitudes is not optimal. Most catalogs
provide R-band magnitudes (which is close to the guide/aO CCDs response). The SADT version
for P88 (v5.04), however, offers the search of guide/aO stars with the 2MASS catalog based on
synthesised I-band magnitudes derived from JHK colours. The extended 2MASS catalog has
been successfully tested on sky and is from P88 onwards the recommended catalog, in particular
for high Galactic latitude fields. In low Galactic latitude fields, due to high and patchy extinction,
SADT Cookbook for VISTA
Issue 2 10
2MASS synthesised I-band magnitudes have larger uncertainties, and therefore optical catalogs,
in particular GSC-2 and UCAC3, may be more appropriate.
VISTA commissioning work has been done using GSC-2 at ESO which in general works well, and
therefore should be used whenever the 2MASS catalog does not give the expected results.
An appropriate alternative to GSC-2 is the UCAC3 at ESO catalog. Also for this catalog, the
suitable magnitude range was optimized but has not been tested on sky yet.
If you experience that the selection of guide/aO stars is difficult (many backtrackings) you may
either change the area definition in DEC or latitude a little bit to cover areas with the auxiliary chips
that are unexplored by backtracking, or you can play around with different selection parameters for
the catalogs, like star/galaxy classifiers. The rejection of possible guide/aO stars according to those
parameters can be toggled on/off in the sadt.cfg file. Also the log output on the console that lists
the rejection or acceptance of a star in full detail can be toggled on/off in that file. See Appendix C.2
for a detailed explanation of those options. The change of catalog selection parameters should be
done with care and is generally recommended to expert users only. It is furthermore recommended,
if the catalog parameters are modified, to check on sky images that the selected guide/aO stars are
ok (i.e. that they are not extended or double sources) and that they are not too faint in the optical.
As of period 93 there exists the possibility to search for appropriate guide stars in the first pawprint of a tile 6 pattern only, see the ‘Options’ menu. This is, however, only appropriate for
surveys/observations with short exposures, where a very accurate guiding does not play an important role (e.g. the VVV and VHS Public Surveys). Also, it should be applied to areas in the sky,
where only very few guide stars are available (i.e towards the Galactic poles), or where the star
density is so high that overlapping stars contaminate the guide star catalog and make the execution
of an OB difficult.
If more appropriate catalogs become available in the future there exists the possibility to include
these in the configuration files. This is explained In Appendix B.
SADT Cookbook for VISTA
5
Issue 2 11
Step 2: Defining the survey area – coordinate systems
and display options
This step explains the different possibilities of defining a survey area and displaying it in different
coordinate systems. Experienced SADT users may just want to enter their coordinates and jump
to step 3.
In the main SADT GUI click the button ‘Add Survey Area’. A line with different columns will
appear under the ‘Survey Areas’ folder. From the pull-down menu in the ‘Type’ column, first select
the area type you want to use:
• ‘Coordinate Range’ allows you to enter the lower and upper bounds of the chosen coordinate system (see below). No rotation angle of your survey area can be entered when choosing
this type.
• For the option ’Circle’ enter the central coordinate of the area and a diameter in degrees.
Although it is allowed to enter an angle this has no effect on the orientation of the tiles, thus
this parameter can be neglected.
• A ‘Geodesic Rectangle’ (default) is defined by its geometric centre and a width and height
in degrees. Here the definition of an angle is meaningful. It will rotate the defined rectangle
around the central position. The rotation angle increases in counter-clockwise direction with
respect to the chosen coordinate system. This area type should be your preferred choice if
your survey area covers regions with declinations/latitudes below −60 deg.
The descriptions in the column headers running rightwards from ‘Type’ change according to the
‘Type’ in the row selected for that ‘Type’.
Note: There will inevitably be significant problems in automatic contiguous coverage of areas defined as coordinate ranges, especially at high Dec/Latitude because: (i) coordinate ranges actually
define differently shaped areas at different declinations/latitudes, and (ii) the SADT aligns the
bottoms of coordinate range tiles along lines of constant Dec/Latitude (or at an angle relative to
Dec/Latitude). Therefore, and given that the VISTA field of view is itself rectangular on the sky,
it is recommended that geodesic rectangles are used as the most reliable way to cover
areas of the sky fully and efficiently. For example, to tile the whole Southern hemisphere
requires 13.029 tiles in ‘Geodesic Rectangle’ mode, and 13.235 tiles in ‘Coordinate Range’ mode
which actually fails to cover the South pole region completely.
SADT Cookbook for VISTA
Issue 2 12
The next parameter you want to select is the type of coordinate system in which your area will be
defined. From the pull-down menu in the ‘System’ column you can select one of these options:
• FK5 (J2000) (default): requires input in RA and Dec.
• FK4 (B1950): requires input in RA and Dec.
• Galactic: requires input of Longitude and Latitude.
• Ecliptic: requires input of Longitude and Latitude.
The descriptions in the column headers running rightwards from ‘Type’ change according to the
‘System’ in the row selected for that ‘Type’.
In most cases, either the ‘FK5 (J2000)’ or the ‘Galactic’ system should suffice.
The entry fields for all coordinate and size related parameters (RA, Dec, Lon, Lat, Width, Height,
Diameter and Angle) can be activated by a fast double click with the left mouse button. Just
overwrite the default values or move with your arrow keys or left mouse button to the digit you
want to edit/change. Press carriage return to close the cell and save the new value, or single click
elsewhere to achieve the same effect. Here are some important conventions you should be aware
of:
• For RA and Dec coordinates use the format “HH:MM:SS.SS” or “HH MM SS.SS”. For
Longitude and Latitude definitions use decimal degrees (not decimal hours).
• The (position) angle (in degrees) on the sky is the angle between North in the selected
coordinate system and the ‘Height’ axis of the survey area. It has the usual convention:
North=0 deg, East=90 deg. SADT applies the ‘Angle’ and ‘Tile orientation’ to derive
the ‘offangle’ in the output XML file that must be sent to the Telescope Control System
(TCS) in an OB. Note that ‘offangle’ correctly obeys the ESO TCS convention and is not a
conventional (net) astronomical position angle.
• Regardless of the input coordinate system used, the tiles in the output XML files are specified
in RA, Dec (J2000) for use at the telescope (although named “long=..” and “lat=...”).
The survey area that you want to save in the end does not have to be restricted to one definition
of a coordinate range or geodesic rectangle. You can add as many areas as you like, and they
can be of different types. Just click the ‘Add Survey Area’ button again and a new entry line will
appear. You even can exclude sub-areas from a larger area or from further processing in SADT
by clicking the checkbox of the ‘Exclude’ field, the rightmost item in the column headers. If you
are not happy with one of your area definitions you can delete this area by clicking on the ‘Delete
Survey Area’ button and confirming the deletion. After deleting an area click on ‘View / Update
Areas’ to refresh the display.
SADT Cookbook for VISTA
Issue 2 13
In the following figure we show an overview on the different ways of defining survey areas, either by
coordinate ranges (diagrams a & c) or geodesic rectangles (diagrams b & d). In all four diagrams
the darker blue lines represent a fixed coordinate system (e.g. RA/Longitude, Dec/Latitude). The
lighter blue lines in c & d represent the rotated coordinate system in which the survey area was
defined.
Diagram (a) shows a (green) coordinate range painted on a spherical coordinate system with a
red dot marking the centre, diagram (c) shows a (green) coordinate range defined in a different
(rotated) spherical coordinate system painted on the different (light blue rotated) spherical coordinate system with a red dot marking the centre. The dark blue grid represents RA/Dec. The yellow
angle shows the (position) angle from the RA/Dec frame to the new frame and is used internally
in SADT.
Panel (b) shows a (green) geodesic rectangle with position angle zero projected on a fixed spherical
coordinate system (dark and light blue grid) with a red dot marking the centre, panel (d) shows a
(green) geodesic rectangle defined in a different (rotated - light blue) spherical coordinate system,
and projected on the fixed spherical coordinate system (as in b) with a red dot marking the centre.
The dark blue grid generally represents RA/Dec. The yellow angle shows the (position) angle when
looking out from the inside of the fixed system.
In the next two subsections, we give two examples of survey area definitions and describe the
different viewing options.
SADT Cookbook for VISTA
5.1
Issue 2 14
Case A: defining and displaying a non-contiguous area
Under the name ‘vista survey’ we defined four sub-areas using different area types and different
coordinate systems. Our definitions look like this:
To get a quick look of the layout of these area definitions first make sure that the checkboxes in
the ‘Options’ menu (at the top of the main window) are correctly set. When clicking the ‘Options’
button you get the following list of checkboxes:
• Find Guide/aO Stars (all pawprints) or Find Guide/AO Stars (guide stars for first
pawprint only): if you don’t want to perform a (time-consuming) guide/aO star search in
your first attempt to define a survey area and see the tiling, leave this box unchecked (the
default when starting SADT). Check this box only if you think that the survey area definitions
are finalized. See more about the two guide star finding options in Sect. 7.
• Fixed Aspect Ratio: by default this box is checked. This allows you to see your survey
area on the same scale in the X and Y coordinate. If not checked the smaller side of your
area will be scaled such that the display window is homogeneously filled. This parameter has
only an effect on the SADT plotting in the display window.
SADT Cookbook for VISTA
Issue 2 15
• Draw Pawprints: by default this box is checked. If you want to see only the tile borders
(without pawprints) you can uncheck this box. Still the pawprint centres are shown as dots.
For very large survey areas this might be the preferred option.
• Draw Aux Detectors: by default this box is checked. You will see the location of the
auxiliary detectors for guiding and wave front sensing. This option only works if the ‘Draw
Pawprints’ box also is checked. The autoguider CCD on top of the positive Y axis of the
detector array is painted in black. This allows a clear identification of the pawprint orientation
(see example in Sect. 5.3). You might want to uncheck this box for large survey areas.
• Include Overlap: this option only matters if your total area definition contains sub-areas
that are excluded (see our Case B, Sect. 5.2). Tiles which lie partially in an included survey
area and partially in an excluded survey area are included (box checked). Otherwise they are
excluded (box unchecked). By default this box is checked.
• Configure ...: the configuration preferences were already explained in Sect. 4.1.
Now is the time to display our area definitions. We chose the ‘Fixed Aspect Ratio’ option ticked.
By clicking the button ‘View / Update Areas’ on the lower left in the main SADT window the
following ‘Survey Areas’ window will pop up:
In the header of this window you see the actual ‘Display Coordinate System’, ‘Plot Type’ and
‘Zoom’ option. How to change these display options is explained in Sect. 5.3.
As seen, pressing the ‘View / Update Areas’ button allows viewing of survey areas specified in
the text box without generating pawprints and allocating the guide/aO stars (even if the ‘Find
Guide/aO Stars’ checkbox is ticked.
Also use ‘View / Update Areas’ to update and view a change to the survey areas defined in the
‘Survey Areas’ table.
SADT Cookbook for VISTA
5.2
Issue 2 16
Case B: defining and displaying an area with exclusions
Our second case, which we call ‘eso survey’, consists of three independent geodesic rectangles and
five rectangle sub-areas that were excluded from those three main areas. To exclude the sub-areas
the corresponding checkboxes in the ‘Exclude’ column were ticked. All coordinates were defined in
the FK5 (J2000) coordinate system. The survey area definitions look like this:
Clicking the ‘View / Update Areas’ button and having the ‘Fixed Aspect Ratio’ box in the ‘Options’
menu ticked and the ‘Include Overlap’ box unticked gives the following result in the display window:
Surprise, surprise! What a nice survey area!
SADT Cookbook for VISTA
5.3
Issue 2 17
Display options
The display window offers different options to change the display coordinate system and plot type,
and to get positional information. All these options are triggered by cursor commands.
Keeping the middle mouse button pressed on the display window will pop-up a line below the
display window which shows the coordinates at the cursor position in the current coordinate system.
To get information on another cursor position you have to release the middle mouse button first
and then move to the desired position pressing the middle button again.
A click on the right mouse button on the display window (except in a selected, cyan tile) will
pop-up a menu with the following options:
• Zoom: the number indicates the actual zoom factor (in steps of factor 2 from 1/16 to 1024,
1 is the default). You can either tick the checkbox ‘Zoom In’ or the checkbox ‘Zoom Out’
which will directly bring you back to the display window. A click with the left mouse button
will perform a ‘zoom in’ or ‘zoom out’, centred on the cursor position. To get back to the
default display for your survey area choose the ‘Reset Zoom’ option in the ‘Zoom’ menu.
• Display Coordinate System: here you can choose the coordinate system in which the
survey area is displayed. The options are the same as in the SADT main GUI (see Sect. 5).
The default is the ‘FK5 (J2000)’ coordinate system. Note that the choice of a coordinate
system only affects the displayed plots. It is not converting the coordinates displayed in the
‘Survey Areas’ table between systems. In most cases, you probably want to use for displaying
the same coordinate system you used for the coordinate definition in the main GUI.
• Plot Type: The default is ‘Cartesian Plot’. But you also can choose a ‘North Polar Plot’
or ‘South Polar Plot’, both with respect to the chosen ‘Display Coordinate System’. Those
representations are very useful if your areas are close to one of the poles. Needless to say
that the plot type ‘North Polar Plot’ makes no sense if your area is defined at negative
declinations/latitudes, and vice versa.
SADT Cookbook for VISTA
Issue 2 18
To illustrate the effect of changing the coordinate system, the area ‘eso survey’ as defined in
Sect. 5.2 (Case B) is shown here in Galactic coordinates (with ‘Fixed Aspect Ratio’ unticked and
as Cartesian Plot):
And just for fun, the same area in ‘Galactic’ coordinates as ‘South Polar Plot’ , the ‘Fixed Aspect
Ratio’ ticked and zoomed once out (factor 1/2):
Note that this area is located close to the Galactic South Pole, a region that has a low density of
foreground stars, and thus finding suitable guide/aO stars may be difficult (see Sect. 7.2).
SADT Cookbook for VISTA
Issue 2 19
As a last example we show here the ‘vista survey’ area (Case A) zoomed in by a factor 4 and with
the checkbox ‘Draw Aux Detectors’ in the ‘Options’ menu ticked. This was done after Step 3 was
performed (see Sect. 6.1).
As explained in Sect. 5.1 the black, solid rectangles show the positions of the autoguider CCDs
above the detector array (see Fig. 5 in the VIRCAM/VISTA User Manual).
An important note on the interpretation of shapes displayed:
SADT’s default display is simple Cartesian, not a spherical projection. Shapes of areas plotted must
be interpreted with this in mind. The shapes seen will also depend on the ‘System’, ‘Type’ and
‘Aspect Ratio’ values set, and the projection used. Be careful not to jump to incorrect conclusions
about your tiles based on the plots. Some examples are:
• In the Cartesian plot a ‘Geodesic Rectangle’ and a ‘Coordinate Range’ will look similar close
to the equator, however near the pole a range will still look like a rectangle, whereas a
geodesic rectangle will look like a slice.
• In a ‘Cartesian Plot’ a coordinate range defined in a particular coordinate system appears as
a rectangle in the survey area display only if the same coordinate system is selected as display
coordinate system.
• Equivalent (but different) considerations arise when plotting in ‘South Polar’ projections.
SADT Cookbook for VISTA
6
Issue 2 20
Step 3: Tiling the survey area – a first test run and some
tile operations
If you are happy with the definition of your survey areas, you now probably want to see how the tiles
will get distributed across the areas, and approximately how many tiles you need to cover them.
Still, at this point we do not intend to search for guide/aO stars which is the most time-consuming
procedure of the SADT session. So please leave both ‘Find Guide/aO Stars (...)’ checkboxes in
the ‘Options’ menu of the SADT GUI unticked.
Again, we will demonstrate the allocation of tiles to the survey areas for our two examples, Case
A and Case B.
6.1
Case A: Tiling of non-contiguous survey areas
The survey area ‘vista survey’ was defined in Sect. 5.1 and we had a look at the layout by choosing
the ‘View / Update Areas’ button. Now, click the button ‘Start / Resume’ in the lower part of the
SADT GUI and you will see the following in the display window:
Note: The allocation of tiles always starts in the lower right hand corner of the area to be filled
(South-West corner in case of RA/Dec coordinates). First the lower row is filled from right to left,
and then the next row up (higher Dec) is filled from right to left (increasing RA). This is continued
until the area is filled. In case of rotated areas the red borders of the tiles do not align with the
pawprints borders. This is a known feature of the current SADT version that will be fixed in an
upcoming version.
At the same time the tiles are shown in the display window there will pop-up two new windows: 1)
the ‘Guide Star Acquisition’ window which is empty at this stage because we left unselected the
SADT Cookbook for VISTA
Issue 2 21
option of finding guide/aO stars, and 2) a window called ‘Finished’ which shows a summary of the
tile allocation.
In our case the ‘Finished’ window looks like this:
As you can see our ‘vista survey’ needs 60 tiles to cover the full area, which implies 360 pawprints
because the tile pattern ‘VIRCAM Tile6n’ was selected. The further information about backtracking during the guide star search and the corresponding statistics table makes no sense in case the
‘Find Guide/aO Stars (...)’ options are unticked.
To continue with any other action you have to confirm the tile generation by clicking the ‘OK’
button in the ‘Finished’ window.
The allocation of tiles can be stopped, resumed and after finishing reset. For that use the buttons
in the lower row of the SADT main GUI and the ‘Stop’ button in the ‘Progress’ pop-up window .
Their functionalities are summarized here:
• Stop: A ‘Progress’ pop-up window will appear when starting the tiling. You can press the
stop button in this window at any time if you are not happy with the tiling process.
• Start / Resume: This begins or resumes the process of filling the defined survey areas
with tiles/pawprints, and – if ‘Find Guide/AO Stars’ option on the ‘Options’ menu is on – it
starts/resumes finding guide/aO stars.
• Reset: This resets the plots and deletes any tiles/pawprints made. It does not affect the
surveys defined in the main GUI – just the display. The user is asked to confirm the reset in a
pop-up window. Note that it is sometimes necessary to use ‘Reset’ before finding guide/aO
stars will work (e.g if they have just been toggled on).
Note: Users are advised to be careful when using ‘Stop’ and ‘Resume’ as there have been reports
that some material may sometimes be lost during a Start/Stop/Resume sequence. Check that tiles
or guide/aO stars have not gone missing around the sky position you pressed ‘Stop’ at.
SADT Cookbook for VISTA
6.2
Issue 2 22
Case B: Tiling of areas with excluded sub-areas
Our case B is the ‘eso survey’ (see Sect. 5.2). As for case A, we do not select any of the two ‘Find
Guide/aO Stars (...)’ options. We just want to see the proposed tiling by clicking the ‘Start /
Resume’ button (with ‘Fixed Aspect Ratio’ ticked):
The corresponding ‘Finished’ window looks like this:
81 tiles, or 6 × 81 = 486 pawprints, are needed to cover the full ‘ESO’ area. To continue with any
other action confirm the tile generation by clicking the ‘OK’ button.
SADT Cookbook for VISTA
Issue 2 23
Maybe you are not happy with some tiles that only cover a small fraction of the desired area but
are mostly located in the excluded sub-areas. One option to avoid the tiling of excluded areas is
to untick the ’Include Overlap’ checkbox in the ‘Option’ menu. After unchecking the box you will
see a pop-up window telling you to ‘Reset’ and ‘Start’ again the tile allocation for the option to
come into effect. This window will pop-up every time you modify the settings.
So, just confirm this pop-up window by clicking the ‘OK’ button, and then press the ‘Reset’ button
in the main SADT window. Another pop-up window assures that you don’t delete the calculated
tiles by accident. So, please confirm by clicking ‘Yes’ that you would like to continue with the new
tile calculation. Finally, click the ‘Start / Resume’ button. You will see the following:
Most probably, this also does not look like the desired coverage of the area. In the next section it
will be explained how to manually delete only some selected tiles in the display window.
SADT Cookbook for VISTA
6.3
Issue 2 24
Tile operations in the display window
Once you have created the tiles with the ‘Start / Resume’ button, you have various possibilities to
manipulate the tiles with mouse clicks on the display window:
• Select tiles: Click with the left mouse button on a tile. It will be highlighted by a cyan
colour. The selection of that tile disappears if you click on another tile which will be selected
instead. If you want to select multiple tiles you have two options: 1) Press the left mouse
button down and each tile you touch while moving the mouse will be selected; 2) Keep the
Ctrl-button pressed while selecting further tiles with a mouse click or dragging the mouse
along tiles (for Mac OS X: press the Ctrl-button once when selecting the first tile, then
release the Ctrl-button and select other tiles with the left mouse button; finish the selection
by pressing the Ctrl-button once again).
Note that the selection does not work if the ‘Zoom In’ or ‘Zoom Out’ checkbox are ticked.
Also, the selection disappears if you use the display options of the right mouse button, like
zooming or changing the display coordinate system, while tiles are selected.
• Deselect tiles: To deselect all tiles click with the left mouse button outside the survey area,
but within the display window. To deselect an individual tile press the Ctrl-button while
clicking on the tile (for Mac OS X: release the Ctrl-button after deselection of the first tile
and finish the deselection by pressing the Ctrl-button once again).
• Tile operations on selected tiles: Selected tiles can be deleted, restored (with or without
a priority) or have an (internal) 4 step priority. Click with the right mouse button on a
selected tile. A pop-up window labeled ‘Tile Operations’ will appear:
– Delete selected tiles: Select ‘Delete Tile’ and the tile is removed leaving marked only
the location of the centre of each pawprint.
– Restore deleted tiles: First, click with the left mouse button on a deleted tile (i.e.
that only shows the centres of the pawprints). Then click with the right mouse button
on that tile and select in the pop-up window ‘Restore Tile’. The pawprint patterns
appear again. You also can restore a tile with a certain priority. To do so choose
‘Restore tile with priority’ in the pop-up window an select a priority in the pull-down
menu.
– Set tile priority: Click the right mouse button on a selected tile. When choosing ‘Set
tile priority’ a pull-down menu with four priority levels from 0 to 3 will appear. Those
levels are colour-coded. The tile borders will be represented in the chosen colour. This
action applies to all tiles that are highlighted in that moment.
Note that the allocated priorities have no affect on the OB priority of that tile. This
information is not transferred to P2PP! Priorities can only be used for displaying
purposes.
SADT Cookbook for VISTA
Issue 2 25
In the following figure we show an example for tile operations. We zoomed on the circle area of
the ‘vista survey’. The two upper left tiles of that area were deleted, only the central positions of
the pawprints are visible as dots. The two upper right tiles were selected, and thus are highlighted
by a cyan colour. The two tiles with blue borders got the priority 2.
An important note: The tile operations are not saved automatically. For example, deleted tiles
can be recovered by the ‘Restore’ option. In order to save the results of the tile operations (deletions
and priorities) choose ‘Save As ...’ in the ‘File’ menu. You might want to give that area definition
a new name, in case you regret some of your deletions at a later stage.
SADT Cookbook for VISTA
7
Issue 2 26
Step 4: The search for guide and aO stars – the final
tiling procedure
Now the time has come to perform the final run of SADT which includes the search for guide
and aO stars. Make sure that you selected the appropriate catalog: since the guide star and aO
CCDs work in the optical (at roughly I-band wavelength), one of extended 2MASS catalogs, i.e.
‘2MASS at CDS (Imag synthesised from JKHs)’, is the recommended choice at the moment! In
the ‘Options’ menu tick the checkbox ‘Find Guide/aO Stars (all pawprints)’. Before you start the
tiling click on the ‘Reset’ button in the lower row and confirm the pop-up window ‘Delete existing
tiles/pawprints?’ by clicking on ‘Yes’. The tiles from the dry-run will disappear.
In the following, we again show the tiling process including the search for guide and aO stars for
our two examples, Case A and Case B.
7.1
Case A: a smooth tiling run near the Galactic plane
Having successfully executed steps 1 to 3 and having pressed the ‘Reset’ button, we see our defined
areas of the ‘vista survey’ in green in the display window.
Press the ‘Start / Resume’ button in the main SADT window. The following ‘Progress’ pop-up
window will appear:
You can press the stop button at any time if you are not happy with the tiling process. To resume
the guide/aO star search press the ‘Start / Resume’ button in the main SADT window again.
Pressing the stop button may also be necessary if the internet connection to the catalog is slow,
or the run is taking longer than expected. After hitting the stop button it is possible to save intermediate results to an XML file by choosing the ‘Save As ...’ task in the ‘File’ menu (see Sect. 8).
This file can later be opened again using the ‘Open’ task in the ‘File’ menu. The generation of
pawprints can then be resumed where it had stopped before.
Apart from the ‘Progress’ window, the ‘Guide Star Acquisition’ window is now active and shows the
search of guide/aO star in each detector. The borders of the detectors are given as black rectangles
for the Autoguider CCDs and black squares for the active Optics CCDs. The header of the window
indicates the name of the actual CCD (see VIRCAM/VISTA User Manual) and its coordinates in
RA/Dec. The different colours for the catalog stars and the background of the window have the
following meaning:
• Colour of stars:
– cyan: Star is in the detector range and has the suitable magnitude range, it is valid.
– yellow: Star is in the detector range but is invalid because of wrong magnitude range.
– blue: Star is valid, but not in the detector range.
SADT Cookbook for VISTA
Issue 2 27
– magenta: Star is not in the detector range and not in the valid magnitude range.
– green: Stars that finally are selected as guide/aO stars. These are only shown if suitable
stars on all guide/aO detectors have been found.
• Background colour:
– grey: Normal mode of operation, no backtracking needed.
– red: No guide/aO star found yet, backtracking.
– pink: Backtracking was successful.
– red and yellow flash: No guide/aO star was found. The backtracking was unsuccessful. Therefore, this pawprint is saved with an incomplete set of guide and/or aO
stars.
Note: when pressing the ‘Stop’ button in the ‘Progress’ window its background colour might be
red, although backtracking is not really executed. Similarly, the detector display might sometimes
stay red even though backtracking has already finished.
This figure shows an example for the search of guide stars for the ‘vista survey’ area:
11 suitable guide stars were found for this autoguider CCD. The one that will be selected will be
coloured green in the next instance.
Note: The autoguider and wavefront sensor detectors will (if you don’t have a slow connection
to the catalog) flash by very fast so it will usually be too quick to see much. A log of difficulties
encountered (i.e. information about backtracking and rejection/acceptance of guide/aO stars)
appears in the terminal window from which you started SADT. The output can be controlled via
parameters in the sadt.cfg file (see Appendix C.2).
SADT Cookbook for VISTA
Issue 2 28
The progress of the tiling is also shown in the display window. In the following figure we show a
snapshot of the moment when seven tiles already have successfully been assigned to the upper right
survey area. The three pink pawprints are provisional until guide/aO stars for all the pawprints in
the tile are found. Then the pawprints become permanent and are displayed in black.
After the search for guide/aO stars has finished the tiling of our ‘vista survey’ looks like this:
Backtracking was only needed twice. So, there basically is no difference to the tiling of our dry-run
(see Sect. 6.1), since for all except two pawprints suitable guide/aO stars were found without the
need of backtracking.
SADT Cookbook for VISTA
Issue 2 29
This is confirmed in the ‘Finished’ window where the statistics of pawprints, tiles and backtracking
are given:
Only two times backtracking had to be used to find a guide star. If you are happy with the results
you should confirm this window by pressing ‘OK’.
At this point, you also have the possibility to use the tile operations as explained in Sect. 6.3.
Maybe you want to delete one or more tiles before you save the final survey area definition.
SADT Cookbook for VISTA
7.2
Issue 2 30
Case B: a tiling run close to the Galactic pole
The ‘eso survey’ is close to the Galactic pole. Therefore, the stellar density is not the highest.
Indeed, when searching for guide/aO stars (by pressing the ‘Start / Resume’ button in the main
SADT window) the ‘Guide Star Acquisition’ window often turns red. This indicates that no guide
and/or aO star was found in the originally foreseen tile position. The pawprints are shifted by
the ‘Backtrack Step’ (an adjustable parameter in the ‘Configure...’ menu, see Sect. 4.1), and the
search is started again. This is repeated until enough guide/aO stars have been found. We chose
for this tiling run the ‘GSC-2 at ESO’ catalog and the option ‘Find Guide/aO Stars (guide stars
for first pawprint only)’, which is only recommended if one has very short exposures.
The following figure shows two snapshots of the guide/aO star search where backtracking is needed
(red background, left) and backtracking was successful (pink background, right):
The effect of the frequent backtracking on the final tiling can be seen in the display window:
SADT Cookbook for VISTA
Issue 2 31
Many rows are shifted with respect to the original tiling without the search for guide/aO stars (see
Sect. 6.2). Also the ‘Finished’ window confirms the difficult search for guide/aO stars:
Instead of originally envisioned 81 tiles, now 114 tiles are needed to cover the ‘ESO’ survey.
Backtracking had to be used to find an appropriate guide or aO star 445 times in total.
This result was obtained using GSC-2, since all other catalogs, 2MASS, UCAC3 and USNO were
not able to find suitable guide/aO stars in this high Galactic latitude region for some sub-areas,
despite the restriction to search for guide stars in the first pawprint of each tile only.
The resulting tiling does not seem optimal, but there is not much one can do about this. Maybe
you can try whether better results can be obtained (with less backtracking steps) if one shifts the
total survey area a bit towards North or South (in case of the equatorial coordinate system). Since
backtracking only uses the East-West direction there is some unexplored area north and south of
the auxiliary detectors.
Also, to clean up the tiling you might want to delete some heavily overlapping tiles or tiles at the
periphery of the survey areas. You can do that with the tile operations (see Sect. 6.3).
Always, before starting a new guide/aO star search with new parameters, press the ‘Reset’ button
and confirm that you really want to delete the previously created tile/pawprint pattern.
SADT Cookbook for VISTA
8
Issue 2 32
Step 5: Saving, opening, and other file options
You are nearly done! CONGRATULATIONS!
The only action left is to save your results, and go on with the OB preparations using P2PP for
Surveys. The ‘File’ menu offers some options to save and re-open your results.
Save: Assuming that you are happy with the final tiling of your survey – including the search for
guide and aO stars – you should now save the results. Do so by selecting ‘Save As ...’ in the ‘File’
menu:
The pop-up window ‘Save’ will appear. There you can give the XML file a new name (but it
must have the suffix ‘.xml’) and can choose the directory in which it should be saved. Confirm by
pressing the ‘Save’ button on the lower right of that window.
Of course, you already can save any intermediate step before the final tiling in the course of your
SADT session.
Note that the saved file will not include deleted tiles or excluded survey areas.
Open: If at some later time you wish to revise the survey area or delete some unnecessary tiles,
just press ‘Open’ in the ‘File’ menu and select the XML file in the pop-up browser window. In
case you already had loaded a survey area, you will first be asked whether you want to replace the
current survey area by a new one.
It is important to note that, as soon as ‘Start/Resume’ is pressed, SADT starts to generate a
new set of tiles/pawprints from scratch overwriting in memory those that were produced before!
In particular, when ‘Start/Resume’ is pressed after a previously saved XML file has been read back
in with ‘Open’ all changes made to the tiles that SADT originally generated will be lost.
For example, a user who kept the same survey area but generated a complex geometry with many
deleted tiles would find that SADT would recompute all the tile positions based on the survey area,
and the previous, manually made changes would be undone.
Create survey areas from tiles in XML file: This feature converts tiles within a survey area
saved in a XML file into multiple survey areas, one for each tile. To do so select an (already
saved) XML file containing the survey areas and tiles that you wish to work on again in SADT.
You will be prompted for the name of an output XML file. The resulting output file will define
each individual tile as its own survey area containing a single geodesic rectangle, thereby protecting
each tile from being changed by SADT’s tiling algorithms. For each survey area tileOverlapX and
SADT Cookbook for VISTA
Issue 2 33
tileOverlapY will be set to zero, but the original tile overlaps will remain preserved in the positions
of the geodesic rectangle survey area/tiles. You can then work with the converted file as with any
other VISTA SADT XML file.
This option may be useful for users who want to preserve their tile positions fixed within their
survey areas, so that the area is not retiled (and the user’s work adjusting it undone) when SADT
is next asked to tile the survey (e.g. to find guide/aO stars for a complex set of tiles).
The width and height of the geodesic rectangle will depend on whether a Tile1, Tile3 or Tile6
pattern is selected for that tile. Approximate values are shown in the following table:
Width (X) [deg] Height (Y) [deg] Width (X) [deg] Height (Y) [deg]
Coverage
at least 1×
at least 1×
at least 2×
> 1× coverage
Tile1 (pawprint) 1.292119
1.017301
–
–
Tile3
1.292119
1.2005
1.292119
1.017301
Tile6
1.475
1.2005
1.475
1.017301
You can then work with the converted file as with any other VISTA SADT XML file.
Network Preferences..: Specify a proxy server if required (e.g. in connection with a firewall) in
this pop-up window:
Exit: Exit the SADT program. It is important to note that the parameters set in the menus are
not stored within SADT when exiting. Be sure to save your work as an XML file or note your
settings.
SADT Cookbook for VISTA
A
Issue 2 34
XML files
Viewing XML files:
After tile and guide/aO star generation VISTA’s XML files can become very long. It is recommended to open them with a viewer/editor that recognises XML structures and allows them to be
collapsed to a shorter more readable form, e.g. a web browser such as Firefox.
XML schema:
The XML schema is included as cfg/vista/sad.xsd in the directory sadtdirectoryname/cfg/vista.
The schema must be recognized by P2PP when it imports XML files made in SADT.
Users must not edit this file!
Structure of SADT XML files:
The XML file is structured as follows for a VISTA survey:
<SURVEY> element
which contains one or more
<SURVEY AREA> elements
which contain one or more
<TILE> elements
which each contains (typically 6)
<PAWPRINT> elements
which each contains
<REFSTARS> elements
giving coordinates and magnitudes of the guide and aO stars
which are converted into .paf files attached to the OB
</REFSTARS>
</PAWPRINT>
</TILE>
</SURVEY AREA>
</SURVEY>
In the following four subsections we give examples for different aspects of the XML files created
by our ‘vista survey’ (Case A, see Sect. 5.1).
In Appendix A.1 it is explained how one can create a XML file with pre-defined coordinates that
can be imported to SADT.
SADT Cookbook for VISTA
A.1
Issue 2 35
Example: Survey areas (no tiles yet)
As an example the XML file saved for the survey areas of the vista survey (see Sect. 5.1) after
pressing the ‘View/Update’ button is as follows (using Firefox as a viewer):
Witin each defined type < /> parameter sets are written in alphabetical order. The meaning of
these should be clear from earlier section of this Cookbook except for:
<SURVEY AREA number=“” – an integer ID counter for each survey area.
Creating a XML file from pre-defined coordinates:
It might happen that you have a list of pre-defined coordinates (maybe even not spatially fully
connected) which should be covered by a tile (or pawprint) each.
In principle, it is possible to create a proper XML file outside SADT that then can be loaded into
SADT to search for the aO/guide stars.
Maybe, first define a single dummy survey area in SADT and – without performing the tiling and
search for guide/aO stars, just press the ‘View / Update Areas’ button – save this area with ‘Save
As ...’ in the ‘File’ menu into a dummy XML file.
Then create (copy) for each coordinate in your list the <SURVEY AREA> element, obeying the
structure as given in the figure above, i.e. one <SURVEY AREA> element per line. Replace the
‘long’ values by the RA (or longitude) values in your list, and the ‘lat’ values by the corresponding
DEC (or latitude) values.
In case you use the Geodesic Rectangle (which is recommended for a list of pre-defined coordinates)
make sure that the ‘height’ and ‘width’ values are set to the size of a tile (or pawprint), see table
in Sect. 8.
Also make sure that all other entries in the <SURVEY> and <SURVEY AREA> elements are
correctly set, like backtrack step (should be 0), tile angle, tile overlaps in X and Y, survey area
position angle, etc.
Please note that the creation of self-made XML files is meant only for expert SADT
users who fully understand the XML schema!
SADT Cookbook for VISTA
A.2
Issue 2 36
Example: survey areas (with tiles but without guide/aO stars)
A more complex example of an XML file for the tiles defined in Sect. 6.1 (Case A) is given below
(using Firefox as the viewer). The guide/aO star finding is switched off, and everything under the
tile elements and the three last survey areas is collapsed:
Within the <Tile /> element the ‘id’ is constructed as TileRowNumber TileColumnNumber where
the rows and columns start at 1,1 in the bottom right hand corner of each survey area.
Note that the ‘offangle’ is NOT the position angle input into P2PP (as discussed in Sect. 5).
SADT Cookbook for VISTA
A.3
Issue 2 37
Example: Pawprint
The same ouput file as in the subsection above is displayed next, showing the expanded first
pawprint of the first tile (using Firefox as a viewer):
Within the <Pawprint /> element the ‘id’ is constructed as Tile ID:PawprintNumber.
SADT Cookbook for VISTA
A.4
Issue 2 38
Example: Refstars
The <Refstars /> element of the first pawprint of the first tile from the same ouput file as in the
examples before is shown below expanded fully (again using Firefox as a viewer):
Here the unique ‘ID’ is derived by adding the date and time to the parameter file (paf) name. The
name consists of SurveyID(examp app2)-SurveyAreaNumber(1)-TileID(1 1)-PawprintID.
SADT Cookbook for VISTA
B
Issue 2 39
Plotting tiles/pawprints in Aladin
Aladin (http://aladin.u-strasbg.fr/) is an interactive sky atlas allowing the user to visualize digitized
astronomical images, superimpose entries from astronomical catalogs or databases, and interactively access related data and information from the Simbad database, the VizieR service and other
archives for all known sources in the field.
SADT can export tiles for plotting in Aladin. SADT does this using a PLASTIC manager. PLASTIC, the PLatform for AStronomical Tool InterConnection (http://plastic.sourceforge.net/), is a
VO protocol for communication between client-side astronomical applications.
Once you have created tiles, you should be able to send them to Aladin from SADT’s PLASTIC
dialog. Note that Aladin should be started, with PLASTIC hub manager, (on the same machine
as the SADT) before you attempt to export any tiles to Aladin.
Aladin V4 and V5 launched a PLASTIC manager by default, Aladin V6 will by default launch
a SAMP internal hub and not a PLASTIC internal hub. To launch PLASTIC internal hub you
have to specify in advance the “-plastic” parameter on the Aladin command line (http://aladin.ustrasbg.fr/java/FAQ.htx#ToC34).
The ‘Plastic’ button in the SADT GUI brings up a PLASTIC dialog box:
From this dialog it is currently only possible to send survey tiles (not survey areas) to Aladin. All
the pawprints are sent over and you should see their centres in Aladin. If other PLASTIC managers
are running in addition to Aladin the tiles can be exported to these by choosing between Aladin and
the other tools using the selection button at the upper middle right of the above ‘Plastic’ window.
Here we show how Aladin displays the pawprint centres of the ‘ESO’ survey as rhombs:
SADT Cookbook for VISTA
Issue 2 40
If you want to see the outlines of the pawprints rather than just their centres, you have to click
the right mouse button over the PLASTIC plane on the right hand side of Aladin, and open the
‘Properties’ window of the plane with the pawprints:
Clicking on ‘Show all associated FoVs’ should now show the outline of the boundary of each tile
(but not the individual detectors):
It also is possible to overlay the tiles onto an image of the field loaded into Aladin.
Disclaimer: ESO is not supporting the PLASTIC interface actively. If the export of SADT XML
files to Aladin or other VO tools fails due to the further development of those tools, ESO is not
responsible for finding a solution for the user.
SADT Cookbook for VISTA
C
Issue 2 41
Help menu and configuration files
Clicking on the ‘Help’ menu in the SADT GUI brings up the following window:
• Cookbook etc...: Refers the reader to the ESO web page of SADT from which the SADT
Cookbook can be downloaded.
• About...: Gives the version number of SADT and the VIRCAM Instrument Package it uses,
and some developer information, together with terms and conditions of use, and a disclaimer.
To download the newest version of SADT please visit the ESO SADT web page:
http://www.eso.org./sci/observing/phase2/SMGuidelines/SADT.html
C.1
Instrument package settings for SADT
The file default.isf in the VIRCAM Instrument Package contains, inter alia, some information that
SADT reads. Much of it is about the geometry of the IR detectors and CCDs and will not be
discussed here.
Another part deals with parameters that SADT (optionally) reads, separately for each of the 2
autoguider and 2 wavefront sensor CCDs, which defines how SADT will find the potential guide/aO
stars in the catalogs it is searching. The relevant values and their settings are:
Parameter Name
NUMIN
NUMAX
SEPMIN
Value
1
5
10.0
MAGDELTA
2.5
MAXECC
MINPMER
0.3
5.0
MINMAG (LOWFS)
MINMAG (AG)
MAXMAG (LOWFS)
MAXMAG (AG)
11.0
10.0
15.0
16.3
Description of value
Minimum number of stars SADT should find
Maximum number of stars SADT should find
Minimum separation (arcsec) from neighbouring stars whose
magnitude difference is less than MAGDELTA
Smallest acceptable magnitude difference to neighbouring
stars within distance SEPMIN. The aO/guide stars are only
selected if any neighbours they might have within SEPMIN
are at least MAGDELTA fainter than themselves.
(for GSC-2 only) Maximum eccentricity allowed
Minimum value of proper motion / proper motion error ratio
for which SADT applies proper motion correction. If total
proper motion is <MINPMER times its total error then the
guide star is not proper motion corrected by SADT. Guide
stars are not rejected based on their proper motion regardless
of whether or not the proper motion is corrected.
Brightest acceptable aO star for this chip
Brightest acceptable guide star for this chip
Faintest acceptable aO star for this chip
Faintest acceptable guide star for this chip
The user must not change any of those settings!
SADT Cookbook for VISTA
C.2
Issue 2 42
Configuration Files
The XML schema (sadt.xsd) defining the format of the output XML files is the directory sadtdirectoryname/cfg/vista. The output of SADT is used By P2PP version 3 to generate a large
number of similar OBs. The SADT configuration directory contains naother two files in which
various configuration parameters are set:
sadt.cfg: Configures most default parameters in SADT. An explanation of all these parameters
is provided in the sadt.cfg file itself. Most of them should not be changed by the user. However,
some might influence the performance of the guide/aO star search, and thus might be altered for
difficult survey areas by expert users. Warning: if you are not sure about what you are doing do
not change the default values of the parameters in the sadt.cfg file. Any loss of time during the
execution of OBs that may be caused by inappropriate modifications of the parameters in this file
will be subtracted from the allocated time for your observing run.
The level of information that is logged to the console can be regulated by several parameters that
can be toggled on or off. In the following the most important parameters for the user are listed
(the default values are given in brackets):
• MAX JITTER (15.0): Maximum amount of jitter (in arcsec). This value should only be
changed via the ‘Configure...’ panel in the ‘Options’ menu.
• TOGGLE MAG FROM IP (false): The magnitude limits for guide and aO stars are either
taken from the instrument package (= true) or from this configuration file (= false). If you
choose any catalog other than GSC-2 it is important that this parameter is set to ‘false’, since
the magnitude limits are optimized for the different reference magnitudes of the catalogs.
Selection parameters for UCAC3:
• CCD.AG PY.MINMAG UCAC3 (10.7), CCD.AG NY.MINMAG UCAC3 (10.7), CCD.AG PY.
MAXMAG UCAC3 (17.0), CCD.AG NY.MAXMAG UCAC3 (17.0): magnitude limits for
guide stars. Do not change!
• CCD.LOWFS PY.MINMAG UCAC3 (11.7), CCD.LOWFS NY.MINMAG UCAC3 (11.7),
CCD.LOWFS PY.MAXMAG UCAC3 (15.7), CCD.LOWFS NY.MAXMAG UCAC3 (15.7):
magnitude limits for aO stars. Do not change!
• TOGGLE CHECK UCAC3 2MASSID (true): entry in 2MASS catalog; source accepted if
id2MASS > 0.
• TOGGLE CHECK UCAC3 CLBL (false): SuperCosmos star/galaxy classifier and quality flag;
source accepted (= true) if clbl = 2. Tests have shown that this parameter invalidates too
many suitable stars. Therefore, its default value is set to ‘false’.
• TOGGLE CHECK UCAC3 DOUBLE (true): Double star check; source accepted if double
star flag = 0.
• TOGGLE CHECK UCAC3 LEDA (true): LEDA galaxy match flag; source accepted if leda
= 0.
• TOGGLE CHECK UCAC3 NU1 (true): Number of CCD images used for this star; source
accepted if nu1 > 0.
SADT Cookbook for VISTA
Issue 2 43
• TOGGLE CHECK UCAC3 TYPE (true): Star/galaxy classifier; source accepted if type = 0
or 1.
Selection parameters for 2MASS:
• CCD.AG PY.MINMAG 2MASSJ (10.1), CCD.AG NY.MINMAG 2MASSJ (10.1), CCD.AG PY.
MAXMAG 2MASSJ (16.4), CCD.AG NY.MAXMAG 2MASSJ (16.4): magnitude limits for
guide stars. Do not change!
• CCD.LOWFS PY.MINMAG 2MASSJ (11.1), CCD.LOWFS NY.MINMAG 2MASSJ (11.1),
CCD.LOWFS PY.MAXMAG 2MASSJ (15.1), CCD.LOWFS NY.MAXMAG 2MASSJ (15.1):
magnitude limits for aO stars. Do not change!
• TOGGLE CHECK 2MASS QFLG (true): 2MASS quality flag; source accepted if QFLG = A
or B.
Selection parameters for GSC-2:
• CCD.AG PY.MINMAG GSC2 (10.0), CCD.AG NY.MINMAG GSC2 (10.0), CCD.AG PY.
MAXMAG GSC2 (16.3), CCD.AG NY.MAXMAG GSC2 (16.3): magnitude limits for guide
stars. Do not change!
• CCD.LOWFS PY.MINMAG GSC2 (11.0), CCD.LOWFS NY.MINMAG GSC2 (11.0), CCD.
LOWFS PY.MAXMAG GSC2 (15.0), CCD.LOWFS NY.MAXMAG GSC2 (15.0): magnitude limits for aO stars. Do not change!
• TOGGLE CHECK GSC2 ELLIPTICITY (true): Ellipticity check; source accepted if eccentricity < 0.3.
• TOGGLE CHECK GSC2 CLASS (true): Star/galaxy classifier; source accepted if class = 0.
• GSC2 REMOVE DOUBLES (true): SADT filters out erroneous double entries from GSC-2.
• GSC2 REMOVE DOUBLES DIST (1.0): Maximum distance in arcsec of two GSC-2 entries
that are interpreted as double entries.
Selection parameters for USNO:
• CCD.AG PY.MINMAG USNO (10.0), CCD.AG NY.MINMAG USNO (10.0), CCD.AG PY.
MAXMAG USNO (16.3), CCD.AG NY.MAXMAG USNO (16.3): magnitude limits for guide
stars. Do not change!
• CCD.LOWFS PY.MINMAG USNO (11.0), CCD.LOWFS NY.MINMAG USNO (11.0), CCD.
LOWFS PY.MAXMAG USNO (15.0), CCD.LOWFS NY.MAXMAG USNO (15.0): magnitude limits for aO stars. Do not change!
Note that if a parameter is not present in one of the catalogs (value = -999), this parameter is
ignored as selection criterium, i.e. the source is accepted if none of the other existing parameters
would reject it.
Control parameters for the logging to the console:
SADT Cookbook for VISTA
Issue 2 44
• TOGGLE PRINT VALID CONSOLE (false): prints coordinates of valid (accepted) stars in
the rectangular area of the CCD.
• TOGGLE PRINT INVALID CONSOLE (false): prints coordinates of invalid (rejected) stars
in the rectangular area of the CCD.
• TOGGLE PRINT OUTOFRANGE CONSOLE (false): prints coordinates of valid and invalid
stars that are contained in the circular search area but not in the rectangular area of the
CCD.
• TOGGLE PRINT ACCEPTED STARS AT STAGE CONSOLE (false): prints output whenever a star is accepted, including the tests passed.
• TOGGLE PRINT PROPER MOTION CONSOLE (false): prints coordinates of stars with
information on proper motions, and whether the proper motion was taken into account or
not.
• TOGGLE PRINT MAG REJECTED STARS CONSOLE (false): prints coordinates of all stars
that are rejected because they lie outside the acceptable magnitude range.
• TOGGLE PRINT OTHER REJECTED STARS CONSOLE (true): prints coordinates of all
stars that are rejected because of reasons other than not falling in the acceptable magnitude
range.
skycat.cfg: The guide/aO stars are searched in a selected catalog over the internet, and skycat.cfg
sets up the available catalogs that appear in the catalog choice box of the SADT.
The guide/aO CCDs work close to I-band, and therefore guide/aO stars should ideally be chosen
by their magnitude in I-band. The current recommended catalog is ‘2MASS at CDS’ or ‘2MASS
at CADC’ since SADT provides a synthesised I-band magnitude from the JHK colours of 2MASS
stars. Also the GSC-2 catalog gives very reliable results.
The list of catalogs available in SADT is a selection of entries of serv type: catalog contained in
the standard skycat.cfg in Dec 2009. In principle SADT can also read other catalogs that can be
read by tools such as GAIA and JSkyCat. Adding a new catalog can be done as follows:
• Create/copy/edit a skycat.cfg file such as this distribution’s.
• Put all the catalogs you want to use into the skycat.cfg file.
• Edit the entry jsky.catalog.skycat.config=../cfg/skycat.cfg in the sadt.cfg file of this SADT
distribution so that the value of jsky.catalog.skycat.config is the path of the skycat.cfg you
want to use.
• GAIA/SkyCat/JSky catalogs can be online as well as in a local file conforming with the
GAIA (http://star-www.dur.ac.uk/˜pdraper/gaia/gaia.html)
SkyCat (http://archive.eso.org/cms/tools-documentation/skycat/)
JSky (http://archive.eso.org/cms/tools-documentation/jsky/)
catalog conventions.
Note that the use of local GAIA/SkyCat/JSky catalogs has not been tested.