1
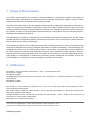
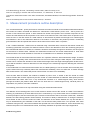
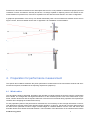
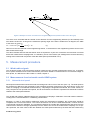
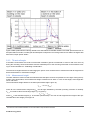
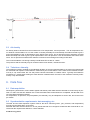
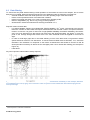
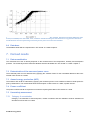
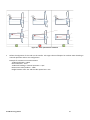
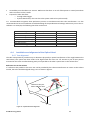
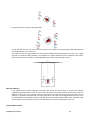
Downloaded from orbit.dtu.dk on: Dec 18, 2015 Procedure for wind turbine power performance measurement with a two-beam nacelle lidar Wagner, Rozenn; Rivera, Rebeca L.; Antoniou, Ioannis; Davoust, Samuel; Friis Pedersen, Troels; Courtney, Michael; Diznabi, Babak Publication date: 2013 Document Version Publisher final version (usually the publisher pdf) Link to publication Citation (APA): Wagner, R., Rivera, R. L., Antoniou, I., Davoust, S., Friis Pedersen, T., Courtney, M., & Diznabi, B. (2013). Procedure for wind turbine power performance measurement with a two-beam nacelle lidar. DTU Wind Energy. (DTU Wind Energy E; No. 0019). General rights Copyright and moral rights for the publications made accessible in the public portal are retained by the authors and/or other copyright owners and it is a condition of accessing publications that users recognise and abide by the legal requirements associated with these rights. • Users may download and print one copy of any publication from the public portal for the purpose of private study or research. • You may not further distribute the material or use it for any profit-making activity or commercial gain • You may freely distribute the URL identifying the publication in the public portal ? If you believe that this document breaches copyright please contact us providing details, and we will remove access to the work immediately and investigate your claim. DTU Vindenergi E Rapport 2013 Procedure for wind turbine power performance measurement with a two-beam nacelle lidar Rozenn Wagner, Rebeca L Rivera, Ioannis Antoniou, Samuel Davoust, Troels F Pedersen, Mike Courtney, Babak Diznabi DTU Wind Energy-E-0019 January 2013 1 Authors: Rozenn Wagner, Rebeca L Rivera, Ioannis Antoniou, Samuel Davoust, Troels F Pedersen, Mike Courtney, Babak Diznabi Titel: Procedure for wind turbine power performance measurement with a two-beam nacelle lidar Abstract (max 2000 char.): This report describes the main steps to use a two-beam nacelle mounted lidar to measure a wind turbine power curve including the preparation of the measurement campaign, the installation of the lidar on the turbine nacelle, the measurement of the wind speed and the wind direction, and the reporting. Project no.: [Tekst] Pages: 28 ISBN: 978-87-92896-28-5 Technical University of Denmark DTU Wind Energy Nils Koppels Allé Bygning 403 2800 Kgs. Lyngby Telefon www.vindenergi.dtu.dk Preface The report presents the procedure to perform a power curve measurement with a two-beam nacelle lidar. This procedure was developed in the EUDP project: “Nacelle lidar for power curve measurement”, based on the results of two measurement campaigns with two-beam nacelle mounted lidars. The purpose of the report is to describe, in a practical manner, the main steps to use a two-beam nacelle mounted lidar to measure a wind turbine power curve and to highlight the main challenges of using this new technology. Content 1. Scope of the document ....................................................................................................... 5 2. References .......................................................................................................................... 5 3. Measurement procedure outline description ....................................................................... 6 4. 4.1 4.2 4.3 4.4 Preparation for performance measurement ........................................................................ 7 Wind turbine ........................................................................................................................ 7 Test site ............................................................................................................................... 8 Measurement set up in distance and height ....................................................................... 8 Measurement sector............................................................................................................ 9 5. 5.1 5.2 5.3 5.4 Measurement procedure ................................................................................................... 10 Wind turbine signals .......................................................................................................... 10 Measurements from horizontal nacelle LIDAR system ..................................................... 10 Air density .......................................................................................................................... 14 Turbulence intensity .......................................................................................................... 14 6. 6.1 6.2 6.3 6.4 Data flow ........................................................................................................................... 14 Data acquisition ................................................................................................................. 14 Synchronization requirements, data averaging, etc. ......................................................... 14 Data filtering ...................................................................................................................... 15 Data base .......................................................................................................................... 16 7. 7.1 7.2 7.3 7.4 7.5 Derived results .................................................................................................................. 16 Data normalization ............................................................................................................ 16 Determination of the measured power curve .................................................................... 16 Annual energy production (AEP) ....................................................................................... 16 Power coefficient ............................................................................................................... 16 Uncertainty assessment .................................................................................................... 16 8. Reporting format................................................................................................................ 19 Appendix A Recommendation for installation of the lidar on the turbine nacelle (informative) .......................................................................................................... 20 A.1 Scope ................................................................................................................................ 20 A.2 Safety ................................................................................................................................ 20 A.3 Preparing the installation ................................................................................................... 20 A.4 Installation and alignment of the Optical Head ................................................................. 23 A.5 Practical tips: ..................................................................................................................... 26 1. Scope of the document The purpose of this document is to provide a uniform methodology of measurement, analysis, and reporting of power performance characteristics for individual electricity producing wind turbines utilising a 2-beam forwardlooking nacelle lidar device to measure the horizontal wind speed. The intent of this methodology is that the methods presented herein be utilised as a supplement to IEC 61400-121:2005. This methodology is feasible for applications in flat terrain, including offshore wind farms where a met mast investment makes the formerly mentioned standard unpractical. This methodology will ensure that the results are as consistent, accurate, and as reproducible as possible within the current state of the art for the particular instrumentation and measurement techniques. This methodology is intended to be applied only to horizontal axis wind turbines of sufficient size that the nacelle mounted lidar does not significantly affect the flow through the turbine’s rotor and around the nacelle and hence does not affect the wind turbine’s performance. This methodology describes how to characterise a wind turbine’s power performance in terms of a measured power curve and the estimated annual energy production (AEP) based on nacelle mounted lidar. In this methodology, the nacelle lidar is located on top of the test turbine’s nacelle. In this location, the nacelle lidar is strongly affected by the nacelle tilt and roll movements while measuring wind speed. This methodology includes methods for determining these effects and applying appropriate level of uncertainty for this interference. Thus the methodology also provides guidance on determination of measurement uncertainty including assessment of uncertainty sources and recommendations for combining them into uncertainties in reported power and AEP. 2. References IEC 60044-1:1996, Instrument transformers – Part 1: Current transformers Amendment 1 (2000) 1 Amendment 2 (2002) IEC 60688:1992, Electrical measuring transducers for converting a.c. electrical quantities to analogue or digital signals Amendment 1 (1997) 2 Amendment 2 (2001) IEC 61400-12-1 ed1.0 (2005-12), Wind turbines - Part 12-1: Power performance measurements of electricity producing wind turbines IEC 61400-2 ed2.0 (2006-03), Wind turbines - Part 2: Design requirements for small wind turbines ISO 2533:1975, Standard atmosphere ISO/IEC GUIDE 98-3 ed1.0 (2008-09), Uncertainty of measurement -- Part 3: Guide to the expression of uncertainty in measurement (GUM:1995) ISO 2533:1975, Standard atmosphere 1 There exists a consolidated edition 1.2 (2003) that includes edition 1 and its amendments 1 and 2. 2 There exists a consolidated edition 2.2 (2002) that includes edition 1 and its amendments 1 and 2. DTU Wind Energy-E-0019 5 DTU Wind Energy-E-0020, Calibrating nacelle lidars, Mike Courtney et al. Note on averaging in nacelle lidar measurements, T.F.Pedersen, S. Davoust Turbulence measurement with a two beam nacelle lidar, Amandine Mioullet, DTU Wind Energy Master Thesis M0016 Note on uncertainty due to lack of shear measurement, I. Antoniou 3. Measurement procedure outline description This ‘nacelle based lidar ’ power performance measurement method is similar to the standard method described in IEC 61400-12-1:2005 in that data are obtained to characterise a wind turbine’s power curve – that is power as a function of free stream wind speed. In both methods free stream wind speed is the horizontal component of free stream wind that would exist at the position of the centre of the turbine’s rotor if the turbine were not present to obstruct the wind. In the IEC 61400-12-1:2005 method, an anemometer is placed at hub height on a meteorological mast between 2 and 4 rotor diameters distance to the turbine. In flat terrain, this position provides a reasonably good estimate of the wind speed that would be at the turbine if the turbine were not present. In this ‘nacelle based lidar ’ method, wind is measured using a horizontal lidar, mounted on the turbine nacelle and measuring upwind the rotor plane at a distance between 2 and 4 rotor diameters. Given the measuring principle of the horizontal lidar based on 2 beams, the method is limited to horizontally homogenous wind flow, thus flow typical for flat onshore or offshore sites. Likewise, the measurement method do not include measurement of wind shear and do therefore not include methods for correction or normalization of non-standard wind profiles. The nacelle tilt and roll movements when the turbine is in operation, affect the lidar measurement height. Therefore it is necessary to quantify these movements and to account for them during the data analysis. This method describes how to minimise the deviation of the measurement height from hub height with appropriate nacelle mounting as well as it defines criteria to determine how the changes in the measuring height are affecting the measured wind speed. If the nacelle lidar is mounted behind the turbine rotor, the blade passing in front of the lidar will occasionally interrupt the beams and may eventually reduce the measurement availability, which can affect the 10 minute average lidar measurements. The method will provide criteria to filter out cases of low availability. Once the lidar data are filtered, the method to establish a power curve, is similar to the IEC 61400-12-1:2005 method. Similar data to those required by the IEC 61400-12-1:2005 standard are obtained: wind speed (from the nacelle-based lidar rather than from a cup anemometer mounted on a meteorological mast), wind direction (through the turbine yaw position rather than use of a wind vane on a meteorological mast), electrical power, air temperature, air pressure, and other conditions. The following points have to be duly noted when using the method described herein: The definition of the resulting power curve in this method is similar to that of IEC 61400-12-1:2005. The turbulence intensity (TI) measured by the lidar differs from the TI measured by a cup anemometer due to the different measurement principles of the two instruments (see Turbulence measurement with a two beam nacelle lidar, Amandine Mioullet, DTU Wind Energy Master Thesis M-0016). This limits our ability to determine the TI during the measurements similar to that of the IEC 61400-12-1:2005. An estimation of the relation between the cup and the lidar TI may be obtained during the calibration of the lidar. This should be clearly stated if the TI is reported. Also shear conditions during the test, cannot be measured and reported due to the method limitations. As the wind shear may influence the power curve measurement results, uncertainty estimation is reported in the report Appendix B. DTU Wind Energy-E-0019 6 Furthermore, this method is based on the assumption that even if it is not possible to characterise properly the wind conditions in terms of turbulence intensity and shear, it is though capable of capturing some of the effects of seasonal variations on performance, if the test is repeated over time with the same turbine in the same configuration. A graphical representation of the set up of a nacelle based lidar power curve measurement method can be seen in Figure 1 and 2, and more details can be seen in Appendix A for installation recommendation. Figure 1 Top view Figure 2 Side view 4. Preparation for performance measurement The specific test conditions related to the power performance measurement of the wind turbine shall be well documented and reported, as detailed in the reporting requirement (chapter 8). 4.1 Wind turbine The wind turbine shall be assessed, described, and reported to uniquely identify the specific machine configuration that is tested. The configuration has significant influence on the measured power curve of the wind turbine. In particular, nacelle dimensions and the dynamic behaviour of tilt and roll movements during operation are important parameters when designing the measurement set up. For the preparation phase of the performance measurement, it is necessary to have enough information on the nacelle dimensions and the turbine tower bending during operation. In this way, the tilt and roll of the optical head of the lidar can be optimised in order to target a certain height at a desired distance from the rotor and ensure that both lidar beams have similar horizontal elevation. The information of the dimensions of the nacelle and the turbine DTU Wind Energy-E-0019 7 tower bending during operation can be provided from the WTG manufacturer or estimated through measurements in an initial phase. In order to target a certain height at a certain distance with the lidar beams, the following input is needed: - the distance from the lidar optical head to the tower centre line (reference for horizontal distances) ; the height of the lidar optical head from the rotor center; the turbine tilt and roll inclinations as a function of the wind speed during operation. 4.2 Test site Since the lidar derives the horizontal wind speed and direction from the radial speeds measured along two lines of sight separated by a given horizontal angle (2α in Figure 1), the use of such a system is limited to measurements in an assumed horizontally homogeneous wind flow, therefore applicable for flat onshore or offshore sites. A suitable measurement sector should be defined taking the location of obstacles and the terrain classification into consideration (see chapter 4.4). Thus the classification of the terrain shall meet the requirements of IEC 61400-121:2005 Annex B. The following factors shall be considered: • topographical variations and reference roughness length (as defined in IEC 61400-12-1:2005 Annex B) • other wind turbines (IEC 61400-12-1:2005 Annex A) • large obstacles (buildings, trees, etc., IEC 61400-12-1:2005 Annex A) 4.3 Measurement set up in distance and height Since the lidar is situated on top of the nacelle, it shall be pre-tilted downwards in order to counteract the height of the lidar optical head above hub height and the backwards turbine tilt during operation. The target is that the lidar beams at 2.5D (D being the diameter of the wind turbine rotor) in front of the rotor will measure as close as possible to hub height. The lidar can be set up to measure at several distances closer and further than 2.5D but with the awareness that those will be then measured at heights different than hub height, due to the downward lidar tilting. Moreover the lidar integrates over a distance of for example 60m when measuring the wind speed. Therefore, due to the tilt relative to the horizontal the wind speed measurement is expected to be marginally influenced by the vertical shear. It is recommended to avoid measuring the wind speed at distances where the edge of the probe volume, including the measurement range uncertainty evaluated during the lidar calibration (see report: “Calibrating nacelle lidars”), is closer than 2D. 𝛽𝑝𝑟𝑒𝑡𝑖𝑙𝑡 = 𝐴𝑟𝑐𝑡𝑎𝑛 � 𝐻 𝑥𝐷+𝐿𝑐𝑙 � + 𝛽𝑡𝑖𝑙𝑡_𝑐𝑜𝑟𝑟 − 𝛽𝑂𝑝𝑒_𝑡𝑖𝑙𝑡 − 𝛽𝑠𝑡𝑎_𝑡𝑖𝑙𝑡 (2) • H is the height of the lidar beams over hub height. • 𝑥. 𝐷 + 𝐿𝑐𝑙 : Measurement distance (D is the turbine rotor diameter, x=number of diameters), and even- • • • tually distance from the lidar optical head to the tower centre line (this distance may be very small). 𝛽𝑡𝑖𝑙𝑡_𝑐𝑜𝑟𝑟 is the tilt correction to contrasts tilt error found in the calibration (thus with opposite sign of the error) ; 𝛽𝑂𝑝𝑒_𝑡𝑖𝑙𝑡 is the operational tilt from the turbine at the predominant wind speed or at maximum Cp. 𝛽𝑠𝑡𝑎_𝑡𝑖𝑙𝑡 static tilt during the installation assuming the WTG nacelle is facing the wind. βsta_tilt ~ 0, if it is very small or if value of inclinometer readings are moving a lot during the installation DTU Wind Energy-E-0019 8 Figure 3 Required dimensions to calculate the pre-tilt angle 4.4 Measurement sector The wind turbine under test and both the lidar lines of sight, at the measurement range, shall not be influenced by the neighbouring wind turbines and obstacles. The criteria for determining a significant obstacle (given its height and distance from the turbine under test) are identical to IEC 61400-12-1:2005, Annex A. The sector defined as in IEC 61400-12-1:2005 will be restricted so that none of the two lidar beams are affected by the wake of a neighbouring turbine or obstacle. Sectors with significant obstacles shall be excluded. DTU Wind Energy-E-0019 9 Figure 4 Example of sector exclusion from neighbouring turbine (turbine under test to the right) The sector to be excluded shall be centred on the direction from the neighbouring obstacle (or wind turbine) to the wind turbine under test. As long as the total beam opening angle of the lidar is smaller than 30 degrees, the width of the sector is given by: 𝐷𝑛 𝛼𝐿 = 1.3𝐴𝑟𝑐𝑡𝑎𝑛 �2.5 + 0.15� + 10 (1) 𝐿𝑛−𝐿𝑏 Where Dn is the rotor diameter of the neighbouring turbine, Ln the distance to the neighbouring turbine and Lb is the lidar measurement range. The above formula assumes that the turbine does not experience a yaw error or that this error has been corrected before the measurement campaign start. A consistency check of the turbine yaw misalignment can be achieved by looking at the transversal component of the lidar wind speed (to be defined in 5.2). 5. Measurement procedure 5.1 Wind turbine signals The net electric power of the wind turbine shall be measured using a power measurement device (e.g. a combination of power transducer and current transformers) and will be based on measurements of current and voltage on each phase, as defined in the IEC 61400-12-1:2005, chapter 2. 5.2 Measurements from horizontal nacelle LIDAR system 5.2.1 Horizontal wind speed Wind speed measurements should be made at hub height at 2.5D in front of the rotor (see 4.3). The wind speed to be measured is defined as the magnitude of the averaged horizontal components of the wind velocity vector (see “Note on averaging in nacelle lidar measurements”), comprising the longitudinal and lateral, but not the vertical, velocity components. All reported wind speeds, and all uncertainties connected to operational characteristics shall be related to this wind speed definition. The nacelle lidar shall be calibrated before the measurement campaign. Calibration of the lidar shall be made according to the recommendations in “Calibrating nacelle lidars”. Moreover, in order to avoid serious malfunction during the measurement campaign, the nacelle lidar should be compared with a control wind sensor. The control wind sensor can be the nacelle anemometer, in which case the cup anometer should be calibrated. The comparison between the nacelle lidar measurements and those from the control sensor should not change significantly from the start to the end of the measurement campaign. For a specific speed bin, the mean value of the ratio between the wind speed measured by the lidar and that measured by DTU Wind Energy-E-0019 10 the control wind sensor during the first and the last thirds of the measurement period should not differ by more than one standard deviation of the ratio between them for the first period. In case this difference exceeds one standard deviation, the lidar shall be post-calibrated, according to the same procedure as for the pre-calibration, at the same site and with a reference instrument of the same make, type and calibration institute. In this case the control wind sensor shall be also re-calibrated in the same wind tunnel as previously, to verify that the anemometer is not the cause of the difference. The difference between the regression lines of pre-calibration and post-calibration shall be within the cup anemometer calibration uncertainty. The transfer function resulting from the lidar calibration should not be used to correct the lidar measurement, unless the lidar-cup deviation is larger than the calibration uncertainty of the reference instrument. If the calibration is used, only the calibration before the measurement campaign shall be used for the performance test. If the difference between the regression lines of pre-calibration and the post-recalibration is larger than the calibration uncertainty of the reference instrument, then the standard uncertainty of the lidar calibration shall be increased by this difference. 5.2.2 Wind direction The instantaneous horizontal wind direction shall be determined and averaged over 10 minutes.The nacelle lidar can only measure the wind direction relative to the lidar axis (see Figure 5); therefore to get a measurement of the wind direction this signal must be combined with the orientation of the nacelle lidar. Figure 5 Measurement of the relative wind direction V is the horizontal wind speed, α is the LOS half opening-angle, Vr is the radial speed for the right LOS: 𝑽𝒓 = 𝑽 𝐜𝐨𝐬(𝜶 + 𝜸), Vl the radial speed for the left LOS: 𝑽𝒍 = 𝑽 𝐜𝐨𝐬(𝜶 − 𝜸). γ is the wind direction to the lidar 𝒇−𝟏 axis: 𝜸 = 𝐭𝐚𝐧−𝟏 where 𝐟 = 𝑽𝒓/𝑽𝒍 𝐭𝐚𝐧 𝜶(𝒇+𝟏) The orientation of the lidar can either be given by a compass mounted in the lidar or by the nacelle yaw indication. If the turbine yaw is used, the following requirements must be fulfilled: 1) While being mounted on the nacelle, the lidar must be carefully aligned with the axis of the turbine (either using landmark on the turbine shaft or using a neighbouring turbine or mast, see Appendix A) 2) The turbine yaw signal must be calibrated prior to the beginning of the measurement campaign; the uncertainty of the turbine yaw signal should be less than 5 degrees. DTU Wind Energy-E-0019 11 3) The turbine yaw signal must be available during the entire measurement campaign, otherwise an external yaw sensor shall be used. The external yaw sensor should also be calibrated prior to the beginning of the measurement campaign. The apparent relative wind direction measured with the lidar shall be reported as a function of the turbine yaw. In case the apparent relative wind direction shows that the lidar measures in the wake of another turbine or obstacle (if there is a sudden change of relative wind direction (see Figure 6) or a sudden change in the difference between the radial speed turbulence intensity of the two lines of sight with yaw direction (see Figure 7)), the available measurement sector shall be reduced by at least 5 degrees from the wake sector. Figure 6 Lidar relative wind direction vs turbine yaw DTU Wind Energy-E-0019 12 Figure 7 Radial speed turbulence intensity, defined as the ratio between the standard deviation of the radial speed and the mean radial speed within 10 minutes, vs turbine yaw. Each dot/square corresponds to a bin average value for a bin width of 10 degrees. Blue dots: beam 1; Purple squares: beam 2. 5.2.3 Tilt and roll angle If the lidar’s inclinometers are used to set the lidar orientation (pre-tilt is mentioned in Annex A and roll is set to 0) during the mounting, these inclinometers must be calibrated prior to the mounting of the lidar on the turbine according to recommendations in “Calibrating nacelle lidars”. The tilt and roll angles shall be recorded during the power curve measurement to measure the lidar tilt angle and to 3 derive the deviation in measurement height . 5.2.4 Measurement height The lidar shall be mounted so that the measurements take place as close as possible to hub height. During the operation of the wind turbine, the measurement height is allowed to be within +/-2.5% of hub height, at the target distance of R=2.5D. The measurement height relative to the lidar optical head height is given by: 𝑧𝑀_𝑟𝑒𝑙 = 𝑅. tan (𝛽𝑙𝑖𝑑𝑎𝑟 ) where R is the measurement range and βlidar the tilt angle indicated by the lidar (including correction if needed). ZM_rel is a relative value.The sensing height a.g.l. is given by 𝑧𝑀 = 𝑧𝑂𝐻 − 𝑧𝑀_𝑟𝑒𝑙 where zOH is the absolute height a.g.l. of the lidar optical head (i.e. the sum of hub height and the height of the optical head above hub height), see Figure 8. 3 The influence of the nacelle acceleration on the inclinometers output should be assessed. DTU Wind Energy-E-0019 13 Figure 7 Required dimensions to convert the tilt angle in measurement height. 5.3 Air density Air density shall be derived from the measurement of air temperature, and air pressure. The air temperature sensor shall be mounted within 10 m of the nacelle. It should preferably be mounted atop the turbine nacelle to give a good representation of the air temperature at the WTGS rotor centre. The air pressure sensor should be mounted below the swept rotor area to give a good representation of the air pressure. It can be mounted at the bottom of the tower. The air pressure measurements shall be corrected to the hub height according to ISO 2533. The recommendations concerning humidity should follow IEC 61400-12-1:2005. The pressure and the humidity may be measured at the tower bottom, outside the tower. 5.4 Turbulence intensity The turbulence intensity, defined as the standard deviation of the wind speed divided by the mean wind speed shall be measured and reported. This turbulence measured by the nacelle lidar is not the same as the turbulence measured by a cup anemometer but can still provide relevant information of relative nature. Typically the turbulence measured by a nacelle lidar tracking the wind direction is between 60% and 90% of the turbulence intensity measured by a cup anemometer. 6. Data flow 6.1 Data acquisition Wind speed, yaw direction, turbine status signals and turbine power data shall be collected as continuously as possible. To make sure the time between two consecutive lidar beam measurements is acceptable, the data with a too low rotor RPM should be excluded. Air temperature, air pressure, and precipitation (if measured), may be sampled at a slower rate, but at least once per minute. 6.2 Synchronization requirements, data averaging, etc. The lidar and the data acquisition system used for the other channels (power, yaw, pressure, and temperature) must be synchronised within 10 seconds. Selected data sets shall be based on 10-min periods derived from contiguous measured data. Data shall be collected until the requirements defined in 7.6 are satisfied. DTU Wind Energy-E-0019 14 6.3 Data filtering To ensure that only data obtained during normal operation of the turbine are used in the analysis, and to ensure data are not corrupted, data sets shall be excluded from the database under the following circumstances: − external conditions other than wind speed are out of the operating range of the wind turbine; − turbine cannot operate because of a turbine fault condition; − turbine is manually shut down or in a test or maintenance operating mode; − failure or degradation (e.g. due to icing or fog) of test equipment; − wind direction outside the measurement sector(s) as defined in 4.3; Rejection criteria for lidar data: − Low lidar availability. Require for example lidar “RWS availability”>T% 4, which corresponds to the ratio between the number of valid radial wind speed measurements and the total number of expected measurements in 10 minute. It is given for each line of sight (RWS0 availability and RWS1 availability).The threshold T has to be determined so that it does not remove the low wind speed data, see Figure 9. It may depend on the average background aerosol level. The same threshold should be applied to both lines of sight. − In order to avoid large gaps due to one blade standing in front of the laser beam, low generator rotation speed should be removed. The data with a 10 minute minimum RPM below a threshold, TRPM, should be discarded. The threshold TRPM depends on the turbine characteristics and should be chosen so that all wind speed bins necessary do derive the bin averaged power curve remain after filtering (see example in Figure 10). − Lidar failure. Any other rejection criteria shall be clearly reported. Figure 8 Example of data selection based on the lidar radial speed measurement availability. In this example, data with an availability below 75% (in gray) were removed in order to reject the least reliable lidar data while keeping the full wind speed range. 4 criteria is specific to a Wind Iris nacelle lidar DTU Wind Energy-E-0019 15 Figure 9 Example of data selection based on the generator RPM. In this example, data with a minimum RPM lower than 0.375 (of max RPM) were discarded. Thus, situations of blade blocking the laser beam for a long period of time were avoided but the full wind speed range necessary for the power curve was still available. 6.4 Data base The database shall fulfil the requirements in IEC 61400-12-1:2005 chapter 2. 7. Derived results 7.1 Data normalization The measurement of the air density depends on the measurement of the temperature, humidity and atmospheric pressure. The air density and the data normalization shall be calculated as in IEC 61400 12-1:2005 chapter 2. 7.2 Determination of the measured power curve The measured power curve is determined by applying the “method of bins” for the normalised dataset as this is described in IEC 61400 12-1:2005. 7.3 Annual energy production (AEP) The turbine’s AEP shall be estimated by applying the measured power curve to different reference wind speed frequency distributions. The method shall follow the description in IEC 61400 12-1:2005, equation 6 and 7. 7.4 Power coefficient The power coefficient shall be reported in line with the reporting described in IEC 61400 12-1:2005. 7.5 Uncertainty assessment 7.5.1 Category A uncertainties Category A uncertainties in electrical power, climatic conditions and site calibration shall be estimated as described in IEC 61400-12-1:2005 DTU Wind Energy-E-0019 16 7.5.2 Category B uncertainties other than in wind speed Catergory B uncertainty in data acquisition, electrical power and air density shall be estimated as described in IEC 61400-12-1:2005 7.5.3 Category B uncertainty in wind speed The uncertainty of the wind speed measurement is a combination of the following uncertainty components: uV1,i: calibration uncertainty (derived from the lidar calibration, see ”Calibrating nacelle lidars” report) uv2,i: Uncertainty related to variation in terrain topography: If the terrain complies to the requirements given in the report: “Calibrating nacelle lidars”, in IEC 61400-12-1:2005, the flow distortion due to the terrain is determined as 2 or 3% depending on the measurement range from the turbine rotor. uv3,i.: uncertainty due to mean measurement height 5 The 10 min average measurement height shall be within hub height +/- 2.5% , at the targeted distance. o If not within +/- 2.5% of hub height: 1) Reject data outside the range (based on 10 min values) or 2) The tilt of the turbine can be translated to a height at which the wind speed measurement took place.For wind speed bins with an average measurement height outside the allowed range, calculate the difference between the closest range limit (hub height +/2.5%) and the mean measurement height plus or minus σ/2 depending on the direction of the deviation (if the mean value is higher than +2.5% then σ/2 shall be added, otherwise it will be subtracted) for that bin, and derive the corresponding wind speed error assuming a power law with a shear exponent of 0.2. The uncertainty is obtained by dividing the error by √3: (𝑢𝑖,𝑚 − 𝑢𝑖,𝑏 )/𝑢𝑖,𝑏 𝑢𝑣3,𝑖 = √3 Where ui,m is the averaged measured wind speed and ui,b the wind speed extrapolated to the closest range boundary: 97.5% of hub height or 102.5% of hub height. Uncertainty of the tilt angle measurement uT1 and uncertainty from the tilt of turbine during lidar mounting uT2 , which depends on the wind conditions, positioning of the nacelle and nacelle roof deformation. The angle uncertainties uT1 and uT2 (in degrees) are converted in an uncertainty in measurement height at the measurement range used for the power curve measurement (R): ∆𝐻 = 𝑅 tan(𝑢 𝑇1 + 𝑢 𝑇2 ) Finally, it is converted to a wind speed uncertainty assuming a power law profile with a shear exponent of 0.2: 1 𝑧𝐻 + ∆𝑧 0.2 �� � − 1� 𝑣𝑖 𝑢𝑣4,𝑖 = 𝑧𝐻 √3 where zH is the hub height and vi the mean wind speed in the bin i. The category B uncertainty in wind speed in bin i, uV,i, can be expressed as: 2 2 2 2 𝑢𝑣,𝑖 = �𝑢𝑣1,𝑖 + 𝑢𝑣2,𝑖 + 𝑢𝑣3,𝑖 + 𝑢𝑣4,𝑖 NOTE: The uncertainty due to the non- linearity of the shear in the vertical range swept by the lidar beam oscillations is considered negligible. 5 DTU Wind Energy-E-0019 17 A user of the standard should be aware of differences that arise from large variations in wind shear and turbulence, and from the chosen criteria for data selection. Therefore, a user should consider the influence of these differences and the data selection criteria in relation to the purpose of the test before contracting the power performance measurements. Wind shear is not part of the IEC61400-12-1:2005 standard wind speed definition and it is not part of the wind speed definition is this procedure. The influence is only included in the electric power variations. Severe non-standard wind shear on large wind turbines might change power curves significantly though, and introduce additional uncertainty. Therefore, for large wind turbines, the uncertainty due to the lack of shear measurement should be taken into account. A way of quantifying this uncertainty is given in “Note on uncertainty due to lack of shear measurement” DTU Wind Energy-E-0019 18 8. Reporting format The test report shall contain the following information: a) An identification of the specific wind turbine configuration under test as this is described in IEC 61400 121:2005 b) A description of the test site as described in IEC 61400 12-1: 2005. Parts which refer to site calibration are not relevant for the nacelle anemometer power curve. c) A description of the arrangement of the nacelle lidar including description of the relevant dimensions and height distances from the nacelle top, and inclination angles d) A description of other equipments and their location above mean sea level. e) Identification of the sensors and data acquisition system, including documentation of calibrations for the sensors transmission lines, and data acquisition system. f) A description of a method of how to control the lidar calibration relative to a nacelle mounted cup for the test duration. Alternative offer a description of the method to confirm the reliability of the lidar calibration after the end of the test period. g) A description of the measurement procedure as described in IEC 61400 12-1:2005 as defined in chapter 2. h) Presentation of measured data as described in IEC 61400 12-1:2005 as defined in chapter 2; in addition: Scatter plot of the lidar tilt vs wind speed (including mean, minimum, maximum and stdv values) Scatter plot of the lidar roll vs wind speed (including mean, minimum, maximum and stdv values) Scatter plot of deviation of measurement height to hub height vs wind speed(including mean, minimum, maximum and stdv values) Scatter plot of lidar radial speed availability vs wind speed, for both lines of sight Scatter plot of the relative direction measured by the lidar vs wind speed Lidar wind speed vs nacelle anemometer Lidar relative wind direction vs nacelle vane or sonic i) Presentation for power curve for air density at sea level and for the site specific air density level in line with IEC 61400 12-1:2005 as defined in chapter 2. j) Presentation of the power curve collected under special operational conditions will be reported in line with IEC 61400 12-1:2005 as defined in chapter 2. To document the function of the nacelle lidar under special atmospheric conditions (e.g. rain), the relation of the nacelle lidar to the nacelle cup anemometer shall be documented. k) Presentation of the estimated AEP for air density at sea level and for a specific air density corresponding to the site specific air density, shall take place in line with IEC 61400 12-1:2005 as defined in chapter 2. l) Presentation of the measured power coefficient shall be in line with IEC 61400 12-1:2005 as defined in chapter 2. m) The uncertainty of the measurement will take place in line with the relevant chapter of this document. n) Any deviations from the requirements of the measurement will be documented and reported in a separate clause. DTU Wind Energy-E-0019 19 Appendix A Recommendation for installation of the lidar on the turbine nacelle (informative) A.1 Scope The present appendix details a general nacelle Lidar installation mounting procedure for power curve measurement. It does not replace a specific Lidar installation manual which should be referred to prior to any installation. A.2 Safety The installation procedures should comply with the safety rules employed by wind turbine manufacturers and operators. Additional safety rules may however apply based on the Lidar user manual provided by the manufacturer. Deploying/servicing the Lidar on top of the turbine nacelle requires mild weather conditions on site, with low winds and no precipitation. The weather conditions should be acceptable for working in and outside of the nacelle according to safe operating practices of the wind turbine. Always follow the wind speed limits described in the wind turbine specific Manuals and the work instructions. Specific requirements could be included. It is highly recommended to check the detailed weather forecast two days before the installation. The installation should not take place in weather conditions involving wind speeds higher than 10 m/s, rain, lightning or snow. A.3 Preparing the installation All the steps from Lidar lifting to Lidar mounting, including Lidar data collection should be prepared prior to the installation. It is recommended to take the following steps prior to the installation day to determine where to install the Lidar Optical Head and Processing Unit outside and inside the nacelle. If needed, support from the on-site maintenance crew or from the Lidar manufacturer should be used. Determine the location of the Optical Head and the Processing Unit on the nacelle, bearing in mind the conduit length (7 or 10m) between the two units. Validate that Lidar beams are not blocked by any obstacle in the chosen position (hub, anemometer/signalization structure, etc…). Different configurations are described in Figure A.1 below. Make sure that the Lidar Optical Head doesn’t disturb the nacelle anemometer. A minimum distance (distance “a” in Figure 2) must be respected. This must be defined with the wind turbine owner or manufacturer. DTU Wind Energy-E-0019 20 Figure A.1 - Lidar optical beams validation Define the alignment of the Lidar on the nacelle. Tilt target value will depend on turbine tower bending in nominal operation and on site configuration. Example for a Power Curve measurement: Turbine hub height = 100m Rotor Diameter = 92 m Turbine tilt bending in nominal operation = +0,5° Distance met mast/turbine = 230m Height between rotor axis and the Lidar optical Axis = 4m DTU Wind Energy-E-0019 21 In this example, Wind Iris Optical Head tilt must be set to -1,5° during installation. For turbine OFF the hub height may be the lower accepted height H-2.5% of H. For turbine ON the hub height may be the higher accepted height H+2.5% of H. DTU Wind Energy-E-0019 22 Accessibility must be taken into account. Make sure that there is no risk of disruption to normal procedures and instruments on the nacelle. Prepare the Lidar data flow: o through a data logger o by data download (in this case the Lidar system needs to be synchronized) It is recommended to organize these preliminary actions in consultation with the Lidar manufacturer. It is also recommended to have an installation checklist detailing all the predetermined settings and actions prior to the installation. For example, the following check-list can be used: Settings Specified Checked / realized Position of the Lidar on the turbine Optical Head Tilt angle Optical Head Roll angle Verification of the Beams passage Yaw Alignment Lidar synchronization Connection to data logger A.4 Installation and alignment of the Optical Head A.4.1 Yaw alignment The Lidar setup needs to provide a way to determine physically its optical axis (bisector of the angle between the two beams). This optical axis then needs to be aligned with the rotor axis. For instance a pair of laser pointer mounted on the Lidar can allow drawing easily a line parallel to the Lidar’s optical axis on the turbine floor. Reference Line on the turbine If a reference line parallel to the rotor axis can be provided by the turbine manufacturer or owner on the turbine nacelle, the Lidar should be aligned along it as it is shown in figure 2. Reference line parallel to the rotor axis b a Figure 10 - Optical Head Yaw alignment DTU Wind Energy-E-0019 23 If there is no reference on the turbine there are two other methods available: Obstacle method: With 2 obstacles - If an obstacle with known geographic position and within the Lidar range is available (for example neighbouring wind turbine, tower or met mast), the turbine can be pointed perpendicular to this direction, if necessary using an external compass: - Then, yaw the Lidar toward the obstacle (here the eastern turbine). In this position detect the left of the obstacle by the left Lidar beam: - Mark on the nacelle floor 2 points a0g and b0g provided by each laser pointers: - Repeat the same operation to detect the right of the obstacle, still with the left beam - Mark on the nacelle floor the 2 points a0d and b0d provided by the laser pointers: - Find the middle a0 of a0d and a0g ; the middle b0 of b0d and b0g in order to find the middle of the obstacle as seen from the left beam: DTU Wind Energy-E-0019 24 - Next perform these steps for the right beam: - Finally, find the center a of a1 and a0, and the center b of b1 and b0. The line joining a and b represents the axis perpendicular to the rotor axis The Lidar can then be aligned with the rotor axis by drawing the perpendicular to this line. It is a good practice to repeat the same procedure, if possible for a second obstacle and the average of the results. The uncertainty of this method is mainly imposed by the turbine yaw position accuracy. - With one obstacle: If an obstacle with known geographic position and within the Lidar range is known (for example neighbouring Wind Turbine, tower or met mast), the turbine can be pointed in this direction in order to define the rotor axis. Then yaw the turbine to the left with the opening angle of the Lidar beam. In this position try to detect the obstacle by the right Lidar beam. The Lidar is then aligned with the rotor axis. It is a good practice to repeat the same for the right direction and the average of the result should be used. The uncertainty of this method is then mainly imposed by the turbine yaw position accuracy. Turbine blade method: DTU Wind Energy-E-0019 25 - If there is no obstacle with known position, then the turbine blade can be used in a similar manner as above. In this case, the Lidar needs to be installed symmetrically at the centre of the nacelle. Then, it is needed to rotate the rotor so that one blade is vertical and pointing downward. Once this is done, yaw the Lidar on its tripod from left to right, and mark on the nacelle floor the Lidar positioning points where the left beam hits the blade root (left and right) and then mark the points where the right beam hits the blade root (left and right). After this, determine the middle of the inner points, the middle of the outer points, which should match. The Lidar then needs to be aligned along those middle points. The uncertainty of this method is then mainly imposed by: o The blade positioning uncertainty o The correct position of the Lidar on the center o The difference between the “inner” and “outer” centre point can be used to measure an error due to finding the center point on the nacelle floor. A variant of this method when the Lidar is not in the center is also possible, and the Lidar position needs to be measured with respect to the vertical blade in order to correct for the offset from not being in the center. A.4.2 Optical Head Tilt and Roll alignment The installation of the Lidar must take place in low wind speed conditions. Under such conditions, the Lidar tilt and roll alignment according to their positions determined during preparation are easier to perform. The following steps should be taken: 1. 2. 3. 4. 5. Manually adjust the Optical Head tilt and roll by unlocking and twisting each tripod handle. Check the inclinometers values through the Lidar software. Go back to point 1 until adjustment is met (tilt and roll at desired position). Verify the Lidar alignment after a few days of wind has allowed the turbine to experience all operational tilt conditions. Eventually adjust after this step NB: It is necessary that the Lidar yaw alignment degree of freedom and the Lidar tilt and roll alignment degrees of freedom are independent. Else the tilt and roll alignment action may have an effect on the Lidar yaw alignment in an uncontrolled manner, or conversely A.5 Practical tips: Reporting An installation report should be written, in order to trace what was realized compared to planned. It is good practise to document throughout the measurement campaign the Lidar mounting, alignment, etc... Notes • Inform turbine maintenance crew of the presence of the Lidar. Don’t touch the optical head during the campaign. • If necessary, clean the Lidar before and after installation with the proper tools. DTU Wind Energy-E-0019 26 DTU Vindenergi er et institut under Danmarks Tekniske Universitet med en unik integration af forskning, uddannelse, innovation og offentlige/private konsulentopgaver inden for vindenergi. Vores aktiviteter bidrager til nye muligheder og teknologier inden for udnyttelse af vindenergi, både globalt og nationalt. Forskningen har fokus på specifikke tekniske og videnskabelige områder, der er centrale for udvikling, innovation og brug af vindenergi, og som danner grundlaget for højt kvalificerede uddannelser på universitetet. Vi har mere end 230 ansatte og heraf er ca. 60 ph.d. studerende. Forskningen tager udgangspunkt i 9 forskningsprogrammer, der er organiseret i tre hovedgrupper: vindenergisystemer, vindmølleteknologi og grundlag for vindenergi. DTU Wind Energy-E-0019 27 Danmarks Tekniske Universitet DTU Vindenergi Nils Koppels Allé Bygning 403 2800 Kgs. Lyngby Telefon 45 25 25 25 [email protected] www.vindenergi.dtu.dk DTU Wind Energy-E-0019 28