1
Using PDtrace™ with SDE and FS2 System
Navigator™ for MIPS® Cores
Document Number: MD00543
Revision 01.01
July 30, 2008
MIPS Technologies, Inc.
955 East Arques Avenue
Sunnyvale, CA 94085-4521
Copyright © 2007 MIPS Technologies Inc. All rights reserved.
Contents
Section 1: Introduction........................................................................................................................... 5
Section 2: MIPS Basic Debug Architecture .......................................................................................... 5
2.1: Overview...................................................................................................................................................... 5
Section 3: MIPS EJTAG Debug Architecture ....................................................................................... 6
3.1: EJTAG Standard Features .......................................................................................................................... 6
3.1.1: Debug Exceptions and Debug Mode ................................................................................................. 6
3.1.2: Software Debug Breakpoint Instruction.............................................................................................. 6
3.1.3: Debug CP0 Registers ........................................................................................................................ 6
3.2: EJTAG Optional Features ........................................................................................................................... 6
3.2.1: Off-board EJTAG Memory ................................................................................................................. 6
3.2.2: EJTAG TAP........................................................................................................................................ 7
3.2.3: Fast Data............................................................................................................................................ 7
3.2.4: PC sampling....................................................................................................................................... 7
3.2.5: Single-Step Execution........................................................................................................................ 7
3.2.6: Simple and Complex Hardware Breakpoints ..................................................................................... 7
Section 4: PDtrace Architecture ............................................................................................................ 8
Section 5: MIPS Trace Tools.................................................................................................................. 9
5.1: Overview...................................................................................................................................................... 9
5.2: Trace Implementations .............................................................................................................................. 10
Section 6: Working with MIPS Trace................................................................................................... 10
Section 7: Using Trace in Application Debug .................................................................................... 15
7.1: Views ......................................................................................................................................................... 16
7.1.1: Trace Mode Window ........................................................................................................................ 17
7.1.1.1: Clock Ratio ............................................................................................................................. 18
7.1.1.2: Synchronization Distance ....................................................................................................... 18
7.1.1.3: Trace Memory ........................................................................................................................ 18
7.1.1.4: Trace Buffer Control ............................................................................................................... 19
7.1.1.5: Inhibit Overflow ....................................................................................................................... 19
7.1.1.6: ASID and Privilege Mode Filtering.......................................................................................... 19
7.1.1.7: Cycle Accurate Trace ............................................................................................................. 19
7.1.1.8: Output PC for all Branches ..................................................................................................... 19
7.1.1.9: Data Trace Collection Options................................................................................................ 20
7.2: Using Hardware Breakpoints to Control Trace .......................................................................................... 20
7.2.1: Trace-To Mode................................................................................................................................. 20
7.3: Trace-From Mode...................................................................................................................................... 20
7.3.1: Hardware Triggers ........................................................................................................................... 20
7.3.2: Instruction Triggered Trace Example ............................................................................................... 21
Section 8: Saving the Trace to a File .................................................................................................. 22
2
Using PDtrace™ with SDE and FS2 System Navigator™ for MIPS® Cores, Revision 01.01
Copyright © 2007 MIPS Technologies Inc. All rights reserved.
Section 9: Conclusion .......................................................................................................................... 23
Section 10: References ........................................................................................................................ 23
Using PDtrace™ with SDE and FS2 System Navigator™ for MIPS® Cores, Revision 01.01
Copyright © 2007 MIPS Technologies Inc. All rights reserved.
3
4
Using PDtrace™ with SDE and FS2 System Navigator™ for MIPS® Cores, Revision 01.01
Copyright © 2007 MIPS Technologies Inc. All rights reserved.
2.1 Overview
1 Introduction
The MIPS® architecture has historically provided a set of primitives for debugging software and systems that is consistent with the RISC philosophy of an integrated hardware/software architecture, providing functionality at a minimum cost in silicon. These primitives have been extended in the MIPS EJTAG Debug Specification. The EJTAG
specification defines a hardware subsystem that provides debugging capabilities to system-on-a-chip components
using MIPS processor cores. EJTAG extends the MIPS instruction set and privileged resource architecture to provide
a standard platform for integrated system debugging.
As SoC’s and applications grew increasingly sophisticated, it became clear that additional On- Chip Debug (OCD)
functionality beyond EJTAG was needed. To address these new debugging/profiling needs, MIPS Technologies
added Program and Data Trace capabilities to its cores, defined the PDtrace™ interface to a MIPS core, and specified
the Trace Control Block (TCB). The PDtrace interface controls the presentation of PC and Data trace information
from each pipeline within a MIPS processor. The Trace Control Block Specification describes the function of an onchip trace block external to the core that captures PDtrace information and writes it to trace memory.
This document reviews the MIPS EJTAG Debug capabilities and describes the PDtrace and TCB functionality as
implemented in the MIPS Technologies family of cores. Concrete examples illustrating the functionality and utility
of MIPS Trace in a real development environment are provided in this paper.
The development environment used for the examples consists of the SDE 6 toolchain, a Malta motherboard and
CoreFPGA2 daughtercard containing a MIPS 24Kc™ bitfile configured with PDtrace, an FS2 System Navigator™
probe and its associated tools.
This document assumes that the development environment has been installed, configured, and is working properly.
Details about installation and set-up of SDE, the Malta 24Kc and the FS2 probe hardware and software are available
from MIPS Technologies and will not be covered here.
2 MIPS Basic Debug Architecture
2.1 Overview
The basic MIPS Debug Architecture includes the following set of primitives:
•
A breakpoint instruction, BREAK, whose execution causes a specific exception
•
A set of trap instructions, whose execution causes a specific exception when certain register value criteria are satisfied.
•
A pair of optional Watch registers that can be programmed to cause a specific exception on a load, store, or
instruction fetch access to a specific 64-bit doubleword in virtual memory.
•
An optional TLB-based MMU that can be programmed to trap on any access to a page of memory.
Using PDtrace™ with SDE and FS2 System Navigator™ for MIPS® Cores, Revision 01.01
Copyright © 2007 MIPS Technologies Inc. All rights reserved.
5
3 MIPS EJTAG Debug Architecture
3 MIPS EJTAG Debug Architecture
The basic debug mechanisms available for most chip architectures assume target-based software support in the form
of at least a monitor that can manage these primitives and communicate with a user. While this debug model works
well in a discrete-chip board based system, it has a number of shortcomings when applied to System-on-Chip (SoC)
development
To improve the SoC debug environment for MIPS-based systems, the Enhanced JTAG (EJTAG) Debug specification
was defined. EJTAG Debug is a scalable technology that can be used both for SoC bring-up and for debug of applications running on SoCs implementing EJTAG Debug. EJTAG exploits the infrastructure provided by the IEEE 1149.1
JTAG Test Access Port (TAP) standard to provide an external hardware interface to the EJTAG features.
3.1 EJTAG Standard Features
3.1.1 Debug Exceptions and Debug Mode
A debug exception with priority over all other non-reset exceptions is introduced. A debug exception causes the CPU
to go into Debug Mode, which is a special mode with no restrictions on access to system resources. The Debug
Exception Return instruction, DERET, is also added.
3.1.2 Software Debug Breakpoint Instruction
The software debug breakpoint instruction, SDBBP, causes a debug exception which places the processor in debug
mode.
3.1.3 Debug CP0 Registers
Four new CP0 registers: Debug, Debug2, DEPC, and DESAVE
•
The Debug registers indicate the internal state of the processor when the last Debug exception or exception in
Debug mode was taken, and they control optional EJTAG Debug features.
•
The Debug Exception Program Counter register (DEPC) indicates the address at which processing resumes after
a Debug Exception is serviced.
•
The Debug Exception Save Register (DESAVE) is a scratchpad register intended for use by the debug exception
handler.
3.2 EJTAG Optional Features
3.2.1 Off-board EJTAG Memory
The EJTAG specification defines optional uncached and unmapped debug segment dseg in kseg3 (kernel mapped
area). dseg appears in the 32-bit virtual address range 0xFF20 0000 to 0xFF3F FFFF or in the 64-bit address range
0xFFFF FFFF FF20 0000 to 0xFFFF FFFF FF3F FFFF. The top half of dseg (drseg) provides access to the optional
memory-mapped EJTAG registers. The lower half of dseg (dmseg) provides access to off-board EJTAG memory.
Implementation of dseg mandates the implementation of the Debug Control Register (DCR) and the EJTAG TAP.
Access to dseg is controlled by the DCR.
6
Using PDtrace™ with SDE and FS2 System Navigator™ for MIPS® Cores, Revision 01.01
Copyright © 2007 MIPS Technologies Inc. All rights reserved.
3.2 EJTAG Optional Features
References by a MIPS processor in Debug Mode to dmseg are converted into transactions on the TAP interface and
transmitted to the host debug system. Both instructions and data can be accessed in EJTAG memory using the
EJTAG probe interface. dmseg also provides a communication channel between debug software executing on the
processor and an external debugging agent.
3.2.2 EJTAG TAP
The TAP controller is an optional feature. Implementations without the TAP allow software executing from RAM or
ROM access to the following EJTAG services: Debug Mode, single-step, and software and hardware breakpoints.
dmseg is required to use the TAP and TAP system access. The combination of dmseg and a TAP provides a powerful
debug tool for resource-constrained SoCs. It is possible to have a Debug Exception handler resident on the debug host
rather than in memory on the SoC. The Debug Exception handler executes through EJTAG memory allowing SoC
bringup or debug of applications without using target resources.
EJTAG uses the five-pin Test Access Port (TAP) signaling protocol defined in IEEE 1149.1 JTAG. A MIPS core
implementing EJTAG can be tied into a JTAG scan chain and debugged. Communication between an SoC and a
debug agent is through a serial protocol. Communication latency between host and target can be lengthy, often on the
order of 200 TCK cycles per 32-bit word.
3.2.3 Fast Data
Revision 2.6 of the EJTAG specification added support for a fast block transfer capability referred to as FASTDATA.
The support added the FASTDATA TAP instruction and the one-bit FASTDATA register.
A FASTDATA ‘upload’ is defined as a load from the target memory and a store to dmseg in EJTAG memory; a
‘download’ is a sequence of loads from dmseg and stores to target (MIPS core) memory. FASTDATA speedup factors of 2 to 7 have been observed, with the controlling factor being primarily block size.
FASTDATA transactions require the use of control software on the target to manage the block transfers. This software would be provided by probe vendors.
3.2.4 PC sampling
PC values can be sampled at a programmable rate. The PC values can be read out through the TAP controller and
used for statistical analysis of program execution.
3.2.5 Single-Step Execution
When single-step mode is enabled in the Debug register, a Debug Single Step exception occurs each time the processor takes a single execution step in Non-Debug mode. Code can be single stepped in either RAM or ROM.
3.2.6 Simple and Complex Hardware Breakpoints
EJTAG defines simple hardware breakpoints and complex breakpoints and triggers. Both simple and complex breakpoints can cause a trigger signal that can be used to start or stop trace collection.
There are two types of simple breakpoints: Instruction breakpoints and Data breakpoints. An instruction breakpoint
can be set on any virtual address, including addresses in ROM. Data breakpoints can be set on load or store references
to any virtual address. The number of breakpoints is implementation dependent. Instruction and data breakpoints can
be can have their address comparisons qualified with an Application Specific ID (ASID) value (See section 7 for
Using PDtrace™ with SDE and FS2 System Navigator™ for MIPS® Cores, Revision 01.01
Copyright © 2007 MIPS Technologies Inc. All rights reserved.
7
4 PDtrace Architecture
more on ASID). Data hardware breakpoints can be qualified with a data comparison and the sense of the qualifier
value can be inverted.
Complex Break and Trigger features are a recent addition to the EJTAG specification. They can be implemented on a
feature-by feature basis.
•
Pass counters enable a breakpoint to be taken after the address/value condition has been met a certain number of
times.
•
‘Tuple” breakpoints fire when both instruction and data conditions match on a single instruction.
•
Qualified Instruction breakpoints fire when a data breakpoint condition is matched after instructions execute in a
certain order.
•
Primed breakpoints allow breaking on a simple sequence of events.
•
Stopwatch timers are counters that can start or stop on specific instruction breakpoints.
4 PDtrace Architecture
4.1 Overview
PDtrace is the interface through which Program and Data information from each pipeline within the core is captured
by the Trace Control Block (TCB) external to the pipeline tracing logic. The TCB captures and compresses PDtrace
information and writes it to trace memory. Trace memory may be either on-chip or off-chip based on use requirements. PDTrace can provide program flow information ranging in detail from Program Counter (PC) trace up to and
including cycle-accurate trace with all load/store instruction and data information.
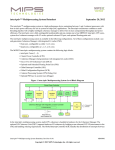
Figure 1 shows an implementation of MIPS Trace. The implementation consists of a core with PDtrace implemented
and a Trace Capture Block that consists of the Trace Control Block (TCB) module, on-chip trace memory, and the
Probe Interface Block (PIB). MIPS Technologies provides a reference PIB design with PDtrace enabled synthesizable cores. The reference design interfaces with the TCB through the TCtrace interface and makes EJTAG TAP and
trace data signals available for connection to an external probe. The trace data signals can be configured in widths of
4, 8 or 16 bits. Figure 1 shows two probes; in reality there would be only one probe, either a trace probe with a 32-pin
Mictor connector or a simple EJTAG probe with a 16-pin connector.
Compressed trace data can either be streamed off chip through the optional Probe Interface Block (PIB) into memory
on a trace capable probe or it can be stored in the on-chip trace memory. The choice of memory is implementation
dependent. Large amounts of data should be transmitted through the PIB’s parallel interface to the attached TRACE
probe. Small amounts of data can be stored in the on-chip memory and accessed through any EJTAG probe. The
EJTAG probe and its associated TAP are only necessary if on-chip memory is being used. A TRACE probe and an
EJTAG probe should not be used together.
8
Using PDtrace™ with SDE and FS2 System Navigator™ for MIPS® Cores, Revision 01.01
Copyright © 2007 MIPS Technologies Inc. All rights reserved.
5.1 Overview
Figure 1 System View of MIPS Trace
In some debug situations it is useful to control tracing from software running on the core rather than through a relatively slow EJTAG control channel. This can be done in a program by overriding the default PDtrace configuration
control.
In cores with PDtrace, the core powers up with PDTrace configuration control defaulted to the EJTAG Trace Control
Block Registers. MIPS Trace is then enabled and configured by an EJTAG probe sending commands through the
EJTAG TAP interface to program the Trace Control Block registers.
Under program control it is possible to pass PDtrace configuration control to the Coprocessor 0 Trace Control registers (CP0 Register 23, selects 1, 2, 3, 4). Application or debug software would then configure or re-configure the
core’s PDtrace features to collect whatever data is required.
5 MIPS Trace Tools
5.1 Overview
Support for MIPS Trace is provided by MIPS Technologies with its SDE tool chain and FS2 EJTAG probes. Basic
software support is provided by the FS2 Console application, which is a Tcl/Tk based command line interface to the
FS2 probes. When using Trace probes, the Command Console application is supplemented with three additional Tcl/
Tk based applications that manage PDtrace setup and operation. The three Tcl/tk based programs are the following:
1.
Trace Mode Window - Configures PDtrace, defining the trace information to be collected. It also sets up the
Trace Control Block and the Probe Interface Block
2.
HW Triggers Window - Configures the trigger features, defining when and under what
condition trace data will be collected.
Using PDtrace™ with SDE and FS2 System Navigator™ for MIPS® Cores, Revision 01.01
Copyright © 2007 MIPS Technologies Inc. All rights reserved.
9
6 Working with MIPS Trace
3.
HW Trace Window - provides various views of the trace results, including source line insertion and variable
name lookup.
More sophisticated source-level debug support is provided for MIPS GDB/Insight and other debug environments that
support the Microprocessor Debug Interface (MDI) software API. The MDI interface is a software library that allows
debuggers to connect to MIPS targets in a device independent manner. The SDE tool chain supports gdb connections
to either MIPSsim (a software target) or to MDI compliant EJTAG probes (a hardware target).
Probe support consists of the System Navigator family of EJTAG and TRACE probes.
5.2 Trace Implementations
All MIPS Technologies synthesizable core families except the 4K® family include PDtrace capability. PDtrace, the
Trace Control Block (TCB) and a reference implementation of the PIB are included as part of the MIPS core deliverables. The PDtrace and the TCB are optional RTL blocks that can be selected at synthesis time. The PIB reference
implementation is unsupported RTL provided as an example of a possible implementation of a PIB. Trace-enabled
bitfiles for use in MIPS’ CoreFPGA™ daughter cards can be built using the scripts provided with core deliverables.
Inclusion of an unmodified MIPS PIB will allow use of the Mictor off-chip trace connector on both types of daughter
cards.
The standard FPGAs provided with the Malta™ Development Systems include MIPS Trace. The FPGAs are built
with both an on-chip trace buffer and a PIB connection. Performance and versatility are significantly enhanced when
using a TRACE probe, but any EJTAG probe that is compliant with the 2.60 or greater version of the MIPS EJTAG
Specification can access the on-chip memory through the EJTAG TAP.
The standard FPGAs are built with the following debug configuration options selected:
•
EJTAG with a single TAP connection
•
4 Instruction and 2 Data breakpoints
•
Minimum 2Kb, max 16K on-chip trace buffer, core and FPGA dependent
•
16 bit trace interface
•
fast data
•
single step
•
no complex breakpoint support
6 Working with MIPS Trace
This section describes building and starting an Application for MIPS Trace analysis.
The FS2 System Navigator software deliverable includes the example fs2_ex.c. Directions to build this application
with SDE are found in the GDB/Insight User Guide delivered with the FS2 software. The application can be used
with either a Windows or Linux host. The remainder of this document assumes operation on a Windows host.
10
Using PDtrace™ with SDE and FS2 System Navigator™ for MIPS® Cores, Revision 01.01
Copyright © 2007 MIPS Technologies Inc. All rights reserved.
5.2 Trace Implementations
Typing sde-insight fs2_exram will bring up the Insight window with the program source loaded as shown in Figure 2.
Figure 2 Insight Source Window
The next step is to configure the target connection. Make sure the probe is connected to the target and the target is
powered on. Select File on the menu bar and then select Target Settings in the drop-down menu to bring up the FS2
Connection dialog as shown in Figure 3.
Using PDtrace™ with SDE and FS2 System Navigator™ for MIPS® Cores, Revision 01.01
Copyright © 2007 MIPS Technologies Inc. All rights reserved.
11
6 Working with MIPS Trace
Figure 3 FS2 Connection Dialog Window
The choices shown is in the dialog box reflect the several FS2 probe offerings and their software capabilities. The
configuration window is used to describe the particular SoC configuration being debugged to the probe software.
SysNav is shorthand for the System Navigator™ series of probes which connects to a host using either USB 2.0 or
10/100 Ethernet. ‘SysNav OE’ is shorthand for the System Navigator Original Edition which uses a parallel port for
connection to the host. The two cable types of interest to MIPS users are EJTAG and Mictor. The EJTAG connector is
the standard 16-pin connector defined in the IEEE spec. It is supplied with FS2 probes that do not have off-chip trace
support. The Mictor connector is a standard 32-pin connector supplied with probes that have off-chip trace support.
Clicking the OK button closes the FS2 configuration window and brings up both the Insight Target Settings window,
shown in Figure 4, and the FS2 Console window.
The Insight window confirms the Target and Device choices made in the FS2 window, and allows you to configure
the MDI interface and Insight. Make sure the default setting of “set breakpoint at ‘main’” is checked; this will stop
the program to be debugged at ‘main’ when the program has been loaded through Insight. Note the ‘Reset on connect’ option – this sets the delay in seconds that GDB/Insight waits after resetting the board; this number needs to be
7 or larger for a Malta board.
12
Using PDtrace™ with SDE and FS2 System Navigator™ for MIPS® Cores, Revision 01.01
Copyright © 2007 MIPS Technologies Inc. All rights reserved.
5.2 Trace Implementations
Figure 4 Insight Target Settings Window
The Console window, shown below in Figure 6, details the startup sequence for the attached probe. At probe startup,
a Tcl script executes that configures the probe and reports the settings. The commands displayed in the console window are detailed in the Console Command Reference manual. This console window is superfluous and should be
deleted. A new console window will be created when Insight is used to download and run the program to be
debugged.
To start the debug session, click on the Running man symbol at the left of the Insight Source window or choose ‘connect. Starting the debug session causes the following actions to take place:
1.
Reset the board. This takes a minimum of 7 seconds for the target to boot up again.
2.
Launch an FS2 configuration window and reconnect the probe to the target.
3.
Attach GDB/Insight to the target.
4.
Download code to be debugged, set a breakpoint at ‘main’ per the Insight configuration window, and start the
application to be debugged.
5.
Display the download status in the Insight Download Status Window, shown in Figure 5.
Using PDtrace™ with SDE and FS2 System Navigator™ for MIPS® Cores, Revision 01.01
Copyright © 2007 MIPS Technologies Inc. All rights reserved.
13
6 Working with MIPS Trace
Figure 5 Insight Download Status Window
With the application code stopped at ‘main’, we can use the FS2 console window to configure more details of the
probe-controlled debug session. To bring up the associated windows, click on the appropriate menu item under the
Console Window menu: The console window provides access to other windows that configure EJTAG and PDtrace
specific features. Clicking on the Window entry on the toolbar will bring up a list of configuration windows available
for the core being used. For example, in the picture below the HW Trace and Trace Mode entries are available
because the core connected to the probe has PDtrace configured; these entries would be missing in a non-trace capable core.
14
Using PDtrace™ with SDE and FS2 System Navigator™ for MIPS® Cores, Revision 01.01
Copyright © 2007 MIPS Technologies Inc. All rights reserved.
5.2 Trace Implementations
Figure 6 FS2 Console Window
The default configuration for a PDtrace-enabled core is trace on, capture only Program Counter changes; trace in
user, kernel, exception and error modes, and continuously trace until turned off with overflow inhibited, and use a
synchronization distance of 32 frames. The default choice of on- or off-chip memory is set by the probe during boot
up when it detects the connection type.
The default settings can be modified through the Trace Mode window. It is not necessary to change any settings for
this demo. The Trace Mode Window is described in a later section of this document.
7 Using Trace in Application Debug
We previously started Insight, loaded the demonstration program fs2_ex into the target, and stopped the application at
main (line 55). This section demonstrates the use of trace in debugging the application. Set a breakpoint at line 66, the
end of the application by clicking on the "-" at the far left of the screen. Execute the program by clicking on the ‘{}’
(continue) symbol. The program will run, trace collection occurs and the Source Window will show the program
stopped at line 66. Additionally, the FS2 console window will be updated, showing the program stopped at a software
breakpoint.
Using PDtrace™ with SDE and FS2 System Navigator™ for MIPS® Cores, Revision 01.01
Copyright © 2007 MIPS Technologies Inc. All rights reserved.
15
7 Using Trace in Application Debug
Figure 7 Source Window
7.1 Views
Trace output is displayed in the HW Trace window. To open the HW Trace window, go to the top of the FS2 Console
and select Windows -> HW Trace. The HW Trace window will appear and after a small delay will display the default
DASM view. Several Views of the collected trace information are possible. For debugging purposes, the most useful
view is intermixed source and disassembly lines. For this introduction, we will extend this view by adding cycle accurate trace, including load and store data and addresses.
To display source, it is necessary to load symbols for this application. On the HW Trace window select Symbols ->
load symbol file. A standard file load dialog will appear. Navigate to your .../sde/examples/fs2_ex directory and
select fs_exram.fs2. The HW Trace window will update with the mixed source and disassembly lines.
To add cycle accurate trace with load and store data and addresses, go to the Console window and select Window ->
Trace Mode as shown in Figure 8 below. In the upper left-hand corner select load and store addresses and data; in the
lower right hand corner select cycle accurate trace.
Go to the Insight window and click on the Continue ({}) symbol to collect the trace data. The HW trace window will
update as shown below in Figure 8.
16
Using PDtrace™ with SDE and FS2 System Navigator™ for MIPS® Cores, Revision 01.01
Copyright © 2007 MIPS Technologies Inc. All rights reserved.
7.1 Views
Figure 8 Hardware Trace Window
The individual trace lines are interpreted as follows:
•
The colored lines are loads and stores, color coded to distinguish data cycles from disassembled code. Green colored lines are loads, red colored lines are stores.
•
The first entry in a trace line, two numbers separated by a dot and terminated by a colon, is the Trace Frame. A
Trace Frame is one 64-bit word in trace memory. The number before the dot is the frame number. Each frame
typically contains several compressed trace messages. The entry after the decimal point indicates the bit position
in the frame where the message begins. For example, in Figure 8 above, the number 1022.46 means Trace Frame
1022, bit position 46. The next entry in a disassembly line is an address, qualified by ASID value. The remaining
entries are the disassembled instruction.
•
The source line precedes the corresponding assembly code. The idle cycles are contained on their own lines.
Additional information on various View options can be found in the GDB/Insight User Guide.
7.1.1 Trace Mode Window
This window is accessed through the Window pull down of the Console Window, shown in Figure 6 above. The
Trace Mode Window is shown in Figure 9 below.
Using PDtrace™ with SDE and FS2 System Navigator™ for MIPS® Cores, Revision 01.01
Copyright © 2007 MIPS Technologies Inc. All rights reserved.
17
7 Using Trace in Application Debug
Figure 9 Trade Mode Window
The Trace Mode window is divided into a number of sections. Each section manages a specific feature of PDtrace.
The following sections describe the features of trace controlled through the Trace Mode window.
7.1.1.1 Clock Ratio
The clock ratio is the ratio between the trace clock and the core clock. The trace clock controls the transmission of
data to a probe through the PIB. The ratio is relevant only for cores supporting off-chip trace. The range of permissible values is defined when the chip is synthesized. The default setting is the fastest clock ratio supported by the core.
The maximum trace clock frequency is set by the probe. Currently the maximum clock rate supported by an FS2
probe is 100 MHz.
7.1.1.2 Synchronization Distance
Trace data is sent in a compressed format with Program Counter values transmitted as differences from the last transmitted value. In order to provide trace reconstruction software the ability to check synchronization with the arriving
compressed trace data a PDtrace enabled core periodically transmits a complete Program Counter value. The Synchronization Distance sets the number of core clock cycles that separate complete Program Counter values.
7.1.1.3 Trace Memory
This section reports whether the core is configured to capture trace data in on-chip trace memory or off-chip trace
memory. FPGAs provided by MIPS Technologies include both on-chip and offchip trace capability; in this case you
would choose where you want the trace captured.
18
Using PDtrace™ with SDE and FS2 System Navigator™ for MIPS® Cores, Revision 01.01
Copyright © 2007 MIPS Technologies Inc. All rights reserved.
7.1 Views
7.1.1.4 Trace Buffer Control
Trace data sent to off-chip (probe) memory flows continuously to the probe, stopping only when the core stops sending trace information.
Trace data sent to on-chip memory can flow continuously, wrapping in trace memory or trace can be turned on by an
event and will stop when trace memory is full. Triggered or event driven trace collection is controlled through the
Triggers and Events window.
7.1.1.5 Inhibit Overflow
Although the PDtrace block in the core contains a FIFO to buffer the data flow between the core and TCB, it is possible for data to be output from the core faster than the TCB can process it. Inhibit overflow causes the processor to
stall if trace data is output from the core arrives faster than the TCB can collect it.
If Inhibit overflow is not selected, it is possible that the FIFO would overflow. If the FIFO overflows, the FIFO is
flushed and tracing is restarted. Only the data in the FIFO at the time of the overflow is lost. A marker is placed at the
beginning of the new trace record, indicating where the break in data occurred.
7.1.1.6 ASID and Privilege Mode Filtering
By default, MIPS Trace collects all program code information. It is of obvious value to limit the quantity of information being collected. In cores that implement a standard TLB-based MMU, the address space identifier (ASID) can be
used to identify program code that will be traced. An ASID is an integer number normally generated and used by
MMU-based operating systems such as Linux to identify a particular address space configuration. The ASID is written by the operating system into the EntryHi CP0 register and can be used by MIPS Trace to enable or disable tracing.
Program code can also be traced in one or more of the specific privilege modes allowed by a core implementation.
The MIPS family of cores implements User, Kernel, Exception, and Debug Privilege Modes. These privilege modes
reflect a hardware state of the core and can be very useful in limiting the amount of trace data collected.
7.1.1.7 Cycle Accurate Trace
PDtrace data transmitted from the core to the Trace Control Block is cycle-by-cycle information, including stalls.
Because including stall cycles in the trace increases the size of the trace and is generally not useful in software debugging, the TCB normally discards the presented stall information. Setting the Cycle Accurate Trace radio button
causes stall information to be included in the stored trace. Cycle accurate information is useful when trying to determine the exact operation of the core, cache and memory subsystem.
7.1.1.8 Output PC for all Branches
PDtrace normally only transmits Program Counter (PC) information for a branch when the branch target can’t be predicted from the static program image (statically predictable), leaving address reconstruction to the trace reconstruction software. Target addresses are statically predictable for branch and all jump-immediate instructions. For
statically predictable branches, a branch-taken flag is inserted in the trace to indicate when the branch is taken.
All jump-register instructions and ERET/DERET instructions have unpredictable target addresses. PC changes due to
exceptions (interrupt, reset, etc.) are also treated as having unpredictable target addresses. In the unpredictable cases,
the complete PC is transmitted unless it is dynamically determined that transmitting the delta value will reduce the
number of bits necessary to indicate the new PC.
Setting the Output PC (Program Counter) check box for all branches cause complete addresses for all branches taken
to be stored. This is not normally necessary, especially since PDtrace transmits a full PC periodically as a synchronization safety check.
Using PDtrace™ with SDE and FS2 System Navigator™ for MIPS® Cores, Revision 01.01
Copyright © 2007 MIPS Technologies Inc. All rights reserved.
19
7 Using Trace in Application Debug
7.1.1.9 Data Trace Collection Options
The Data Trace Radio buttons are used to configure PDtrace trace collection modes. The choices range from a simple
tracking of the Program Counter addresses (PC) when unpredictable program flow occurs to tracking all operand
activity. Choosing only the information needed will minimize the bandwidth needed to move data out of the core and
into the Trace Control Block (TCB)
7.2 Using Hardware Breakpoints to Control Trace
Trace collection can be controlled in any of three ways:
1.
Operate in Trace-To mode. This is the default operating mode.
2.
Operate in Trace-From mode.
3.
Operate under the control of a Hardware Trigger.
7.2.1 Trace-To Mode
Trace data is continually written into the on-chip buffer, wrapping around and overwriting the oldest data. Data collection stops only when the processor reaches an end-of-trace condition. Endof- trace occurs when the processor exits
the processor mode or ASID value in which tracing was requested or when an EJTAG hardware breakpoint trigger
turns tracing off.
7.3 Trace-From Mode
PDtrace data collection starts when the processor enters a start-of-trace condition. A start-of-trace condition occurs
when the processor enters a processor mode or ASID value for which tracing has been enabled or when an EJTAG
hardware breakpoint trigger turns tracing on. Trace data collection will continue until the on-chip buffer is full. The
trace will be a log of processor activity after the trigger. Since tracing starts when some condition is met, trace must
initially be turned off. This is done by clicking on the ‘Turn off trace initially’ button in the Trace Mode Window.
7.3.1 Hardware Triggers
The EJTAG Debug architecture includes hardware instruction and data breakpoints as optional features. These hardware breakpoints can be used to turn tracing on and/or off. This is useful for collecting trace information over limited
sections of code, such as a tracing execution in a single function.
The FPGA implementation of MIPS cores usually includes 4 Instruction and 2 Data hardware breakpoints.
20
•
Instruction hardware breakpoints can be can be configured to generate a debug exception when an instruction is
executed anywhere in the virtual address space. Bit mask and Address Space Identifier (ASID) values may be
used to qualify the address comparison.
•
Data hardware breakpoints can be configured to generate a debug exception on a data transaction. Bit mask and
ASID values may apply in the address compare and byte mask may qualify the value compare.
Using PDtrace™ with SDE and FS2 System Navigator™ for MIPS® Cores, Revision 01.01
Copyright © 2007 MIPS Technologies Inc. All rights reserved.
7.3 Trace-From Mode
7.3.2 Instruction Triggered Trace Example
The GDB/Insight User Guide gives examples of trace collection triggered using hardware breakpoints. This section
will just describe the process used in setting up triggered trace collection.
In order for trace on-off to work, the initial state of trace needs to be turned off in the Trace Mode window. This is
done by clicking on the ‘Turn off trace initially’ button in the Trace Mode Window. Turning trace off will uncheck
“Trace in exceptions and error modes”, “Trace in kernel mode”, and “Trace in user mode”.
The Trigger and Events Window (Figure 10) is used to set up the trigger configurations. The first step is to define the
Events that will cause the trigger. You can either select ‘New’ which allows you to define a breakpoint which can be
connected to a hardware execution trigger or you can select one of the default xbrk or dbrk execution triggers and
select ‘Edit’. Either choice brings up the Edit Event window.
If you have selected ‘New’ you must name the Event and define it as either an execution breakpoint or a data breakpoint. First name the event and then select whether this is an Execution (Instruction) breakpoint or a Data Breakpoint.
Instruction Breakpoints require an address and a mask; use of the mask allows a range of addresses to generate a
break. Data breakpoints can be set to generate a debug exception on a data transaction (read only=load, write
only=store, or read/write=load/store) at an address or a range of addresses. Data breakpoints can be further qualified
by selecting data values by byte lane value (Value Mask) or by byte lane access (Access Mask).
Once the events are defined they must be mapped to the hardware trigger resources. This is done in the HW Triggers
portion of the window. Select either ‘Create Execution Trigger’ or ‘Create Data Trigger’ and choose the action
desired. Your choices currently are Break only without Trace action, Trigger only, or turn Trace on or off.
Using PDtrace™ with SDE and FS2 System Navigator™ for MIPS® Cores, Revision 01.01
Copyright © 2007 MIPS Technologies Inc. All rights reserved.
21
8 Saving the Trace to a File
Figure 10 Trigger and Events Window
8 Saving the Trace to a File
The menu entry File > Save as in the HW Trace window provides a dialog to save all or part of the Trace window formatted data to a file. The contents of the ASCII file will start and end at the selected frames and will reflect whatever
the current display mode is. The Dialog box is shown below.
Figure 11 Save Trace Dialog Box
22
Using PDtrace™ with SDE and FS2 System Navigator™ for MIPS® Cores, Revision 01.01
Copyright © 2007 MIPS Technologies Inc. All rights reserved.
7.3 Trace-From Mode
9 Conclusion
MIPS Trace extends the EJTAG debug environment, providing a hardware mechanism for tracking the history of
execution through a program. The combination of the SDE Toolkit, Insight debugger, and the FS2 Trace Control software provides a powerful debug addition to any programmer’s toolkit.
10 References
1.
EJTAG Specification
MIPS Document: MD00047
2.
The PDtraceTM Interface and Trace Control Block Specification
MIPS Document: MD00439
3.
MIPS32® 34K® Processor Core Family Software User’s Manual
MIPS Document: MD00534
4.
MIPS32® 24K® Processor Core Family Software User’s Manual
MIPS Document:MD00343
5.
MIPS32® 4KETM Processor Core Family Software User’s Manual
MIPS Document: MD00103
6.
MIPS32® M4K® Processor Core Software User’s Manual
MIPS Document: MD00249
7.
Quick Start Guide, System Navigator™ for MIPS® Processor Cores
First Silicon Solutions, Document No. 11607.000
8.
Software User Guide, System Navigator™ for MIPS® Processor Cores
First Silicon Solutions, Document No. 11609.000
9.
GDB/Insight User Guide, System Navigator™ for MIP® Processor Cores
First Silicon Solutions, Document No. 11611.000
10. MIPS SDE 6.x Programmer’s Guide
MIPS Document: MD00428
Using PDtrace™ with SDE and FS2 System Navigator™ for MIPS® Cores, Revision 01.01
Copyright © 2007 MIPS Technologies Inc. All rights reserved.
23
Copyright © 2007 MIPS Technologies, Inc. All rights reserved.
Unpublished rights (if any) reserved under the copyright laws of the United States of America and other countries.
This document contains information that is proprietary to MIPS Technologies, Inc. ("MIPS Technologies"). Any copying, reproducing, modifying or use of this
information (in whole or in part) that is not expressly permitted in writing by MIPS Technologies or an authorized third party is strictly prohibited. At a
minimum, this information is protected under unfair competition and copyright laws. Violations thereof may result in criminal penalties and fines.
Any document provided in source format (i.e., in a modifiable form such as in FrameMaker or Microsoft Word format) is subject to use and distribution
restrictions that are independent of and supplemental to any and all confidentiality restrictions. UNDER NO CIRCUMSTANCES MAY A DOCUMENT
PROVIDED IN SOURCE FORMAT BE DISTRIBUTED TO A THIRD PARTY IN SOURCE FORMAT WITHOUT THE EXPRESS WRITTEN
PERMISSION OF MIPS TECHNOLOGIES, INC.
MIPS Technologies reserves the right to change the information contained in this document to improve function, design or otherwise. MIPS Technologies does
not assume any liability arising out of the application or use of this information, or of any error or omission in such information. Any warranties, whether
express, statutory, implied or otherwise, including but not limited to the implied warranties of merchantability or fitness for a particular purpose, are excluded.
Except as expressly provided in any written license agreement from MIPS Technologies or an authorized third party, the furnishing of this document does not
give recipient any license to any intellectual property rights, including any patent rights, that cover the information in this document.
The information contained in this document shall not be exported, reexported, transferred, or released, directly or indirectly, in violation of the law of any
country or international law, regulation, treaty, Executive Order, statute, amendments or supplements thereto. Should a conflict arise regarding the export,
reexport, transfer, or release of the information contained in this document, the laws of the United States of America shall be the governing law.
The information contained in this document constitutes one or more of the following: commercial computer software, commercial computer software
documentation or other commercial items. If the user of this information, or any related documentation of any kind, including related technical data or manuals,
is an agency, department, or other entity of the United States government ("Government"), the use, duplication, reproduction, release, modification, disclosure,
or transfer of this information, or any related documentation of any kind, is restricted in accordance with Federal Acquisition Regulation 12.212 for civilian
agencies and Defense Federal Acquisition Regulation Supplement 227.7202 for military agencies. The use of this information by the Government is further
restricted in accordance with the terms of the license agreement(s) and/or applicable contract terms and conditions covering this information from MIPS
Technologies or an authorized third party.
MIPS, MIPS I, MIPS II, MIPS III, MIPS IV, MIPS V, MIPS-3D, MIPS16, MIPS16e, MIPS32, MIPS64, MIPS-Based, MIPSsim, MIPSpro, MIPS Technologies
logo, MIPS-VERIFIED, MIPS-VERIFIED logo, 4K, 4Kc, 4Km, 4Kp, 4KE, 4KEc, 4KEm, 4KEp, 4KS, 4KSc, 4KSd, M4K, 5K, 5Kc, 5Kf, 24K, 24Kc, 24Kf,
24KE, 24KEc, 24KEf, 34K, 34Kc, 34Kf, 74K, 74Kf, 74Kc, 1004K, 1004Kc, 1004Kf, R3000, R4000, R5000, ASMACRO, Atlas, "At the core of the user
experience.", BusBridge, Bus Navigator, CLAM, CorExtend, CoreFPGA, CoreLV, EC, FPGA View, FS2, FS2 FIRST SILICON SOLUTIONS logo, FS2
NAVIGATOR, HyperDebug, HyperJTAG, JALGO, Logic Navigator, Malta, MDMX, MED, MGB, OCI, PDtrace, the Pipeline, Pro Series, SEAD, SEAD-2,
SmartMIPS, SOC-it, System Navigator, and YAMON are trademarks or registered trademarks of MIPS Technologies, Inc. in the United States and other
countries.
All other trademarks referred to herein are the property of their respective owners.
Template: nW1.03, Built with tags: 2B
Using PDtrace™ with SDE and FS2 System Navigator™ for MIPS® Cores, Revision: 01.01
Copyright © 2007 MIPS Technologies Inc. All rights reserved.