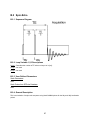
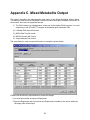
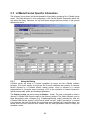
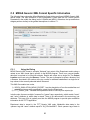
1
Vespa – Simulation User Manual and Reference Version 0.4.0 Release date: May 17th, 2012 Developed by: Brian J. Soher, Ph.D. Philip Semanchuk Duke University Medical Center, Department of Radiology, Durham, NC Karl Young, Ph.D. David Todd, Ph.D. University of California, San Francisco Department of Radiology, San Francisco, CA Developed with support from NIH, grant # EB008387-01A1 1 Table of Contents Overview of the Vespa Package ................................................... 5 Introduction to Vespa-Simulation .................................................. 6 Using Simulation – A User Manual ............................................... 8 1. 3. 4. Overview – How to launch Vespa-Simulation.................................................. 8 The Experiment Notebook............................................................................. 11 The Experiment Tab ...................................................................................... 11 4.1 4.2 4.3 4.4 5. Management Dialogs .................................................................................... 18 5.1 5.2 5.3 6. Loading an existing Experiment .......................................................................... 12 Running a new Experiment ................................................................................. 13 New Experiments with additional user defined parameters................................. 14 Visualizing Experiment Results ........................................................................... 15 Manage Experiments dialog ................................................................................ 18 Manage Metabolites dialog ................................................................................. 18 Manage Pulse Sequences dialog ........................................................................ 20 Results Output .............................................................................................. 26 6.1 6.2 6.3 Results output into standard text editor ............................................................... 26 Plot results to image file formats ......................................................................... 27 Plot results to vector graphics formats ................................................................ 28 Appendix A. Pulse Sequence Design ......................................... 29 A.1 What is under the hood? ............................................................................... 29 A.1.1 Vespa-Simulation Basic Concepts ..................................................................... 29 A.1.2 Experiments ....................................................................................................... 29 A.2 First Steps for Creating Your Own Pulse Sequences .................................... 31 A.2.1 Overview ............................................................................................................ 31 A.2.2 How Simulation Runs Your Pulse Sequence (A Brief Review) .......................... 31 A.2.3 The Interface Between Simulation and Your Pulse Sequences ......................... 31 A.3 Creating a Pulse Sequence without Extra Parameters ................................. 32 A.3.1 How to create a “One-Pulse” pulse sequence ..................................................... 32 A.3.2 A “One-Pulse” pulse sequence that does NOT use binning code ....................... 35 A.3.3 The “Ideal-PRESS” pulse sequence – typical use of standard parameters ........ 37 A.4 Creating a Pulse Sequence with Extra Parameters ...................................... 38 A.4.1 The “PRESS-CP with Variable R-groups” Pulse Sequence ................................ 38 A.5 Creating a Pulse Sequence with an RF Pulse Waveform ............................. 42 A.5.1 A “PRESS” sequence that uses a ‘real’ RF pulse read in from a file................... 42 A.5.2 A “PRESS” sequence that uses a ‘real’ RF pulse from RFPulse ........................ 43 2 Appendix B. Pulse Sequence Diagrams ..................................... 46 B.1 One-Pulse ..................................................................................................... 46 B.1.1 Sequence Diagram .............................................................................................. 46 B.1.2 Loop Variable 1,2,3 Descriptions ........................................................................ 46 B.1.3 User Defined Parameters .................................................................................... 46 B.1.4 General Description ............................................................................................. 46 B.2 Spin-Echo...................................................................................................... 47 B.2.1 Sequence Diagram .............................................................................................. 47 B.2.2 Loop Variable 1,2,3 Descriptions ........................................................................ 47 B.2.3 User Defined Parameters .................................................................................... 47 B.2.4 General Description ............................................................................................. 47 B.3 PRESS Ideal ................................................................................................. 48 B.3.1 Sequence Diagram .............................................................................................. 48 B.3.2 Loop Variable 1,2,3 Descriptions ........................................................................ 48 B.3.3 User Defined Parameters .................................................................................... 48 B.3.4 General Description ............................................................................................. 48 B.4 STEAM Ideal ................................................................................................. 49 B.4.1 Sequence Diagram .............................................................................................. 49 B.4.2 Loop Variable 1,2,3 Descriptions ........................................................................ 49 B.4.3 User Defined Parameters .................................................................................... 49 B.4.4 General Description ............................................................................................. 49 B.5 JPRESS Ideal ............................................................................................... 50 B.5.1 Sequence Diagram .............................................................................................. 50 B.5.2 Loop Variable 1,2,3 Descriptions ........................................................................ 50 B.5.3 User Defined Parameters .................................................................................... 50 B.5.4 General Description ............................................................................................. 50 B.6 PRESS with RFPulse Pulses ........................................................................ 51 B.6.1 Sequence Diagram .............................................................................................. 51 B.6.2 Loop Variable 1,2,3 Descriptions ........................................................................ 51 B.6.3 User Defined Parameters .................................................................................... 51 B.6.4 General Description ............................................................................................. 51 Appendix C. Mixed Metabolite Output......................................... 53 C.1 General Functionality .................................................................................... 54 C.2 GAVA Text Format Specific Information........................................................ 56 C.2.1 Using the Dialog ................................................................................................. 56 C.2.2 Example GAVA Text Output File ........................................................................ 56 C.3 LCModel Format Specific Information ........................................................... 58 C.3.1 Using the Dialog ................................................................................................. 58 C.3.2 Example – Creating an LCModel Basis Set (by Hongji Chen) ........................... 59 3 C.4 jMRUI Data Text Format Specific Information ............................................... 61 C.4.1 Using the Dialog ................................................................................................. 61 C.5 MIDAS Generic XML Format Specific Information ........................................ 63 C.5.1 Using the Dialog ................................................................................................. 63 C.5.2 Example MIDAS Generic XML Output File......................................................... 64 C.6 Analysis Prior XML Format Specific Information ........................................... 65 C.6.1 Using the Dialog ................................................................................................. 65 C.6.2 Example Analysis Prior XML Output File............................................................ 66 Appendix D. Object State in Applications.................................. 67 D.1 Background and Design Philosophy ............................................................. 67 D.2 State Definitions and Usage .......................................................................... 67 D.2.1 Private and Public .............................................................................................. 67 D.2.2 In Use ................................................................................................................. 68 D.2.3 Frozen ................................................................................................................ 68 4 Overview of the Vespa Package The Vespa package enhances and extends three previously developed magnetic resonance spectroscopy (MRS) software tools by migrating them into an integrated, open source, open development platform. Vespa stands for Versatile Simulation, Pulses and Analysis. The original tools that have been migrated into this package include: GAVA/Gamma - software for spectral simulation MatPulse – software for RF pulse design IDL_Vespa – a package for spectral data processing and analysis The new Vespa project addresses current software limitations, including: non-standard data access, closed source multiple language software that complicates algorithm extension and comparison, lack of integration between programs for sharing prior information, and incomplete or missing documentation and educational content. 5 Introduction to Vespa-Simulation Vespa-Simulation is a graphical control and visualization program written in the Python programming language that provides a user friendly front end to the GAMMA/PyGAMMA NMR simulation libraries. The Vespa-Simulation interface allows users to: 1) Create and run a simulated Experiment (consisting of one or more spectral simulations) from lists of metabolites and pulse sequences. 2) Store simulated Experiment results in a database. 3) Display the results in a flexible plotting/graphing tool. 4) Compare side-by-side results from one or more simulated Experiments 5) Output results in text or graphical format 6) Export/Import experiments, metabolites or pulse sequences from other users 7) Design and test their own PyGAMMA pulse sequences for addition to the list of pulse sequences available for use in Experiments. What is an Experiment? An ‘Experiment’ consists of one or more spectral Simulations. Each Experiment uses only one “pulse sequence” but can contain one or more metabolites and one or more sets of timings for the pulse sequence. Each Simulation contains results for a single metabolite for one set of sequence timings. Each call to the PyGAMMA library produces results for a single Simulation. Vespa-Simulation loops through the spectral simulations for all timings and metabolites to completely fill out the Experiment’s results. There are a number of predefined pulse sequences in the Vespa-Simulation environment, and users can also design and test their own Python pulse sequence scripts using the PyGAMMA library. The database also contains prior information (current literature values) for the NMR parameters of available compounds (J-coupling and chemical shift values) necessary to run the simulations. NMR parameters are available in this database for approximately 30 compounds commonly observed for in vivo 1H MRS. The following chapters run through the operation of the Vespa-Simulation program both in general and widget by widget. In this manual, command line instructions will appear in a fixed-width font on individual lines, for example: ˜/Vespa-Simulation/ % ls Specific file and directory names will appear in a fixed-width font within the main text. References: Examples of spectral simulation for pulse optimization, and spectral fitting: Young K, Govindaraju V, Soher BJ and Maudsley AA. Automated Spectral Analysis I: Formation of a Priori Information by Spectral Simulation. Magnetic Resonance in Medicine; 40:812-815 (1998) Young K, Soher BJ and Maudsley AA. Automated Spectral Analysis II: Application of Wavelet Shrinkage for Characterization of Non-Parameterized Signals. Magnetic Resonance in Medicine; 40:816-821 (1998) 6 Soher BJ, Young K, Govindaraju V and Maudsley AA. Automated Spectral Analysis III: Application to in Vivo Proton MR Spectroscopy and Spectroscopic Imaging. Magnetic Resonance in Medicine; 40:822831 (1998) Soher BJ, Vermathen P, Schuff N, Wiedermann D, Meyerhoff DJ, Weiner MW, Maudsley AA. Short TE in vivo (1)H MR spectroscopic imaging at 1.5 T: acquisition and automated spectral analysis. Magn Reson Imaging;18(9):1159-65 (2000). Online Resources: The Vespa project and each of its applications have Trac Wiki sites with extensive information about how to use, and develop new functionality for, each application. These can be accessed through the main portal site at http://scion.duhs.duke.edu/vespa/ 7 Using Simulation – A User Manual This section assumes Vespa-Simulation has been downloaded and installed. See the Vespa Installation guide on the Vespa main project wiki for details on how to install the software and package dependencies. http://scion.duhs.duke.edu/vespa. In the following, screenshots are based on running Simulation on the Windows OS, but aside from starting the program, the basic commands are the same on all platforms. 1. Overview – How to launch Vespa-Simulation Double click on the Simulation icon that the installer created on your Desktop. Shown below is the Vespa-Simulation main window as it appears on first opening. No actual Experiment windows are open, only the ‘Welcome’ banner is displayed. Use the Experiment menu to open existing Experiments into tabs, or to create a tab for designing a ‘new’ spectral simulation Experiment. 8 Shown below is a screen shot of a Vespa-Simulation session with two Experiment tabs opened side by side for comparison. The functionality of all tools will be described further in the following sections. 9 2. The Simulation Main Window This is a view of the main Vespa-Simulation user interface window. It is the first window that appears when you run the program. It contains the Experiment Notebook, a menu bar and status bar. The Experiment Notebook can be populated with one or more Experiment Tabs, each of which contains input data and results from one Experiment. As described above, an Experiment is a group of spectral simulations. Each simulation contains the result for one metabolite that has been run through a simulated pulse sequence for a given set of sequence parameters. Thus, an Experiment may consist of one metabolite for multiple sets of pulse sequence parameters, or multiple metabolites for one set of pulse sequence parameters, or multiple metabolites for multiple collections of pulse sequence parameters. The Experiment Notebook is initially populated with a welcome text window, but no Experiment results. From the Experiment menu bar you can 1) load a previously run Experiment from the Simulation database into a tab, or 2) create a new Experiment and set it up and run it. In either case a tab will appear for each Experiment that is loaded or created. The Management menu allows users to access pop-up dialogs to create, edit, view, delete and import/export Experiments, Metabolites and Pulse Sequences from the Simulation database. The status bar provides information about where the cursor is located within the various plots and images in the interface throughout the program. It also reports short messages that reflect current processing while events are running. On the Menu Bar Experiment→New Experiment →Copy Tab to New Opens a new Experiment Tab in the Experiment Notebook. This will open a new Experiment Tab and populate it with the same values that are listed in the current Experiment. No results are copied to the new tab. This is a short cut for varying simulation parameters to get different results and still being able to compare back to a previous results set without having to save them both to the data base. Experiment→Open Runs the Experiment Browser dialog, from which you can choose an Experiment from the database to open. Experiment→Save Saves the Experiment in the current tab to the data base. Note. Experiment results are not automatically saved to data base after the Run button is hit. Experiment→Output Third Party Saves the Experiment result(s) to third party file formats that can be used in other NMR/MRS applications. See Appendix C for more details. Experiment→Close Closes current Experiment Tab. Will prompt for save if necessary. Management →Manage Experiments Management →Manage Metabolites Launches the Manage Experiments dialog. Allows user to view, clone, delete, import and export Experiments. Launches the Manage Metabolites dialog. Allows user to create, edit, view, clone, (de-)activate, delete, import and export Metabolite prior information. Management 10 →Manage Pulse Sequences Launches the Manage Pulse Sequences dialog. Allows user to create, edit, view, clone, delete, import and export Pulse Sequence information. View→<various> Changes plot options in the Visualize sub-tab of the active Experiment tab, including: display a zero line, turn x-axis on/off or choose units, changing plot color, selecting data type or line shape, turning axes on/off for the Integral or Contour plot windows, and various output options for all plot windows. Help→User Manual Launches the user manual (from vespa/docs) into a PDF file reader. Help→Simulation/Vespa Online Help Help→About 3. Online wiki for the Simulation application and Vespa project Giving credit where credit is due. The Experiment Notebook The Experiment Notebook is an “advanced user interface” widget (AUINotebook). What that means to you and me is a lot of flexibility: Multiple tabs can be opened up inside the window. They can be moved around, arranged and “docked” as the user desires by left-click and dragging the desired tab to a new location inside the notebook boundaries. In this manner, the tabs can be positioned side-by-side, top-to-bottom or stacked (as show in Sections 1 and 4). They can also be arranged in any mixture of these positions. The Experiment Notebook can be populated with one or more Experiment Tabs, each of which contains the results of one Experiment. Tabs can be closed using the X box on the tab or with a middle-click on the tab itself. When a Tab is closed, the Experiment is removed from memory, but can be reloaded from the database at a future time - assuming it was previously saved. 4. The Experiment Tab An Experiment Tab is a tabbed window that is added to the Experiment Notebook. Each tab contains one entire Experiment. An Experiment Tab can be used to run a new Experiment and view the results of that run. It can also be used to load an existing Experiment from the database to view results, or to add more metabolites to the Experiment. Each Experiment Tab has two sub-tabs called Visualize and Simulate. The Simulate tab is where a new experiment is set up and run. It is also where the parameters and settings for an existing Experiment can be reviewed when the Experiment is reloaded. The Visualize tab is where the results of an Experiment can be visualized as 1D plots, stack plots, peak integral maps and/or contour maps. When a new Experiment is set up, there are no results to be displayed so the program defaults to the Simulate tab for New Experiments. When an existing Experiment is loaded, it typically contains results from simulations that have been run, so the program defaults to the Visualize tab. 11 A New Experiment is typically created, set up and run. Results from running an Experiment are only saved to the database when specifically requested by the user. The Visualize tab is updated to display results after each time the Run button is pushed on the Simulate tab (i.e. after each run). Experiments can be run multiple times, until it has been saved to the database. At that point it is considered ‘frozen’ and it can only be “run again” to add additional metabolites. The same parameters will be used for additional “add metabolite” runs. The View menu on the main menu bar can be used to modify the display of the plots in the Visualize tab. The resulting modifications only affect the settings in the currently activated Experiment Tab. The following lists the functions on the View menu item: On the Menu Bar View (this menu affects the plots in the currently active Experiment tab) →Show ZeroLine toggle zero line off/on in 1D and stack display →Xaxis →Show white lines on black background or reversed →Xaxis→PPM/Hz x-axis value in PPM or Hz →Plot Color white lines on black background or reversed →Data Type select Real, Imaginary, or Magnitude spectral data to display →Lineshape select Gaussian or Lorentzian lineshapes for the basis functions plotted →Integral Axes→Show x/y toggles either x or y, or both axes on/off →Show Contour Axes toggles both axes on/off →Output→1D/Stackplot writes the plot, currently in the 1D or StackPlot canvas, to file as either PNG, SVG, EPS or PDF format →Output→Integral Plot writes the plot, currently in the Integral plot canvas, to file as either PNG, SVG, EPS or PDF format →Output→Contour Plot writes the plot, currently in the Contour plot canvas, to file as either PNG, SVG, EPS or PDF format →Output→Text Results opens the operating systems standard text editor and inserts a textual rendering of the Experimental parameters and results. Typically, this is a summary of the general descriptive information, the specific pulse sequence and metabolite parameters included and a listing of all metabolite lines for every loop instance in the Experiment. 4.1 Loading an existing Experiment The Experiment Browser dialog is launched from Experiment→Open menu which is shown below. A list of Experiment names is shown on the left. When an Experiment listed in the browser is clicked on once, its comment and metabolites are displayed on the right. Experiments can be sorted by the isotopes contained within the simulated metabolites. They can also be sorted by field strength (given in MHz). When the Open button is clicked (or an Experiment’s name is double-clicked on), the program loads the information for that Experiment from the database into an Experiment object in memory. This object then creates a set of basis functions for all metabolites for use in the Visualization tab plots. N.B. In the case of a large Experiment, this may take a significant 12 amount of time to calculate, but is indicated on the lower left of the status bar while calculating. 4.2 Running a new Experiment As noted previously, an ‘Experiment’ object consists of one or more spectral Simulation objects. Each Experiment object uses only one “pulse sequence” but can contain one or more metabolites and one or more sets of timings for the pulse sequence. Each Simulation object contains results for a single metabolite for one set of sequence timings. Each call to the PyGAMMA library produces results for a single Simulation object. Vespa-Simulation loops through spectral simulations for all timings and metabolites to completely fill an Experiment object. When a user selects the Experiment→New menu option, a new Experiment Tab is created in the Experiment Notebook and the default view is for the Simulate sub-tab. This panel enables the user to select, define and run a new Experiment from the list of defined pulse sequences provided with the Simulation program. Additional pulse sequences can be created by the user and accessed using the methods covered in the next section. A list of available pulse sequences is kept in the Vespa-Simulation database and can be selected from the Pulse Sequence: Name dropdown menu. The Simulation widget will reconfigure itself based on the parameters needed to run that sequence. Users must fill in the Name, Investigator, Main Field, Peak Search Ranges, Blend Tolerances and all loop Start Value, Step Count and Step Size fields. At least one metabolite must be selected and moved into the In Experiment list. Some default values are already included. Simulation provides the user with four loop variables for use in their pulses sequences. This is covered in detail in Appendix A, however, in brief: The first loop is the list of selected metabolites. The remaining three loops are defined as evenly spaced floating point number series. Each series is defined by a starting value, a number of steps and a step size. So for these values, start = 10.2, steps = 4, size = 2.0, that dimension would contain the following values [10.2, 12.2, 14.2, 16.2]. These values are passed directly to the user’s PyGAMMA code and 13 can be used in any fashion. One might use these values directly as sequence timing values where they represent [ms] timings between RF pulses. Another use might be as an integer series (e.g. [1,2,3,4,5,6]) indexing a series of RF pulses stored in a file. This way an Experiment could “loop” through the effects of different RF pulses in an experiment. Either way, the user can set up three of these loops in the Loops 1, 2 and 3 section of the Simulation sub-tab. Shown in the figure is an example of a new Experiment tab configured for a PRESS simulation. Note: Metabolite Peak Normalization and Blending The transition tables calculated by the GAMMA density matrix simulations frequently contain a large number of transitions caused by degenerate splittings and other processes. At the conclusion of each simulation run a routine is called to extract lines from the transition table. These lines are then normalized using a closed form calculation based on the number of spins. To reduce the number of lines required for display, multiple lines are blended by binning them together based on their PPM locations and phases. The following parameters are used to customize these procedures: Peak Search Range – Low/High (PPM): the range in PPM that is searched for lines from the metabolite simulation. Peak Blending Tolerance (PPM and Degrees): the width of the bins (+/- in PPM and +/- in PhaseDegrees) that are used to blend the lines in the simulation. Lines that are included in the same bin are summed using complex addition based on Amplitude and Phase. 4.3 New Experiments with additional user defined parameters A full explanation of how to create additional pulse sequences, with any additional parameters that may be required, is given in Appendix A. The Vespa-Simulation Manage Pulse Sequences dialog provides an interface for a user to define the additional parameters needed for a given pulse sequence. These are then saved to the VespaSimulation database. This section describes the interface used to run an Experiment using a pulse sequence with additional parameters. When a sequence with additional parameters is selected from the Pulse Sequences drop-list, the Simulate tab will be modified to display input fields where the user can set the values for these additional parameters. These additional parameters are displayed in a list below the loop fields. Each line contains only one parameter description and a field to set a value. When appropriate, a default value is provided. Note: Data types are limited to String, Long or Float data types for data entry. The user is restricted to entering this type of data in any given field. 14 4.4 Visualizing Experiment Results Experiments displayed in the Visualize widget can be considered to contain 2, 3, 4 or 5 dimensions that correspond to the Spectral dimension, the number of metabolites in the experiment, and the number of steps in Loops 1, 2 and 3 respectively. Pulse sequences such as One-Pulse or Spin-Echo only allow 0 or 1 Loop dimensions and are thus the types of available display are appropriately restricted. However, other pulse sequences can typically use most of the plot modes. The three plot modes for displaying results, 1D/StackPlot, Integral Plot and Contour Plot, are shown below: The 1D/StackPlot window is always open and centered in the screen. The Integral Plot and the Contour Plot can be toggled on/off using the check box next to their names (though their windows remain ‘open’ whether they are being plotted or not). Both the Integral and Contour plot windows can be undocked, repositioned and re-docked using the “grab bars” on the left hand side of each window. Under the 1D/StackPlot window, a 1D spectrum for one or more metabolites or a 2D spectral stack plot along any two Loop dimensions for a single metabolite can be selected. If more than one metabolite is selected for a stack plot, only the first metabolite in the list is displayed. 15 The mouse can be use to set the X-axis and Cursor values in the 1D plots. The left mouse button sets the X-axis Min/Max PPM values. Click and hold the left mouse button in the window and a vertical cursor will appear. Drag the mouse either left or right and a second vertical cursor will appear. PPM value changes will be reflected in the Plot Control widget. Release the mouse and the plot will be redisplayed for the Min/Max PPM axis values. This Zoom Span will display its range in a pale yellow that disappears when the left mouse is released. In a similar fashion, two vertical cursors can be set inside the plot window. Click and drag then release to set the two cursors anywhere in the window. This Cursor Span will display as a light gray span. Click in place with the right mouse button and the Cursor span will be turned off. The cursor values are used to determine the “area under the peak” values that are plotted in the Integral and Contour windows. Changes to the cursor settings, either by mouse or in the respective widgets, will be updated in the Integral and Contour plots (described below) after these values are changed by the user. Click and release the left mouse button in place and the plot will zoom out to its max setting. Click and release the right mouse button in place and the cursor span will be turned off. An Integral plot can be created from a 2D Spectral stack plot experiment for a single metabolite. Metabolite areas are measured between the Left and Right Cursor settings in each spectrum and for the real, imaginary or magnitude data shown. The plot will show the integral along the Stack Plot axis displayed in the 1D/StackPlot Once the Integral plot is displayed, changes to the Left and Right Cursor values or to the Loop index widgets are reflected in the plot. The Contour plot works best for Experiments that contain at least two Loop dimensions, but will create a “pseudo-2D” contour plot from an Experiment with only one Loop dimension by repeating the first dimension. Contours are integrated over all steps in the two loop dimensions selected in the Contour Dimensions drop-box, for the Left and Right Cursor settings shown in the Plot control widget and for the real, imaginary or magnitude data shown. Plotted contours change as the cursor settings change, but are only refreshed when the right mouse button is released. On the Visualize Widget Display Mode (drop-list) Selects 1D, or Stack Plots along index 1, 2 or 3 to be displayed in the 1D window. X Axis Max/Min (click fields) Controls the PPM limits of the spectrum displayed in the 1D and 2D plots. Alternatively, the left mouse button can be used interactively in the 1D Display window to set these axes. Click on the left mouse button and drag to set the min/max settings using an interactive ‘rubber-band’ display method. X-axis cursors are displayed in gray/red. Cursor Max/Min (click fields) Controls the PPM limits of the cursors displayed in the 1D and Stack Plots. These also act as the PPM integral regions calculated in the Integral and Contour plots. The cursors are displayed in purple and may not be displayed on the screen if set to values outside the X Axis min/max values. Alternatively, the right mouse button can be used in an interactive ‘rubber-band’ display method in the 1D Display window to set these axes. Click on the left mouse button and drag to set the left/right values. Cursors are displayed in gray/yellow. Index 1, 2, 3 (click fields) These fields allow the user to step thru the Loop1, Loop2 and Loop3 dimensions for the various plot modes. As each Index widget is incremented, the sequence timing’s actual value is shown in the adjoining field. If a given Experiment did not use a Loop dimension, that index is not displayed (e.g. you will often not see Index 3). Metabolites to Plot (list) A list of metabolites in the experiment that can be included in the display. 16 Sum Plots Sums all metabolite plots selected (highlighted) in the list. For 1D display, this sums different metabolite spectra together. For Stack Plots the different sequence timings for one metabolite are summed. Integral Plot - Show (check) Toggles Integral Plot display. Contour Plot - Show (check) Toggles Contour Plot display. Grayscale (check) Toggles whether a grayscale image overlay is applied as a background to the contour plot. Levels (click field) Select the number of levels to display in the Contour Plot. Note that setting too many levels may limit the ability of level values from being displayed. Contour Dimensions (drop-list) Selects index pairs among index 1, 2 and 3 for display in plot. Line Width (click field) Set the full-width half-max linewidth in Hz of the peaks displayed in the plots. Sweep Width (click field) Set the sweep width in Hz used to reconstruct the spectra. Points The number of spectral points used to reconstruct the spectra. ASCII Display Displays the current Experiment results in text form. The information at the top is a summary of the Experiment parameters, which is followed by a line by line report of metabolite results. Each line is tab-delineated and shows a: Metabolite Name, Loop1, Loop2 Index, Loop3 Index, Group Number Index, Line Number Index, Frequency(PPM), Amplitude, and Phase(deg) for each line extracted from the transition table for a given simulation. 17 5. Management Dialogs The Management dialogs allows the user to Create, Delete, Edit, Import, Export or View Metabolites, Experiments and Pulse Sequences. These dialogs therefore allow the user to manage the data in the Simulation database, and to add new metabolite and pulse sequence information that can be used as prior information for simulation and processing. It also provides the means for users to share information between themselves via XML files created using the Import/Export functions. 5.1 Manage Experiments dialog Access this dialog by clicking on the Management→Manage Experiments menu item. The dialog opens and blocks other activity until it is closed. An example of this dialog is shown in the figure. Experiment names are listed in the window on the right. This list may be sorted by isotope or main B0 field strength from the drop-list widgets above the list. Users may View, Delete, Import or Export Experiments. These functions are summarized below. View: Creates a brief textual description of the Experiment that is displayed in a native text editor for the platform being used. Use View→Output→Text Results menu item on the main menu bar with the Experiment loaded into a tab in the Notebook for a more detailed textual description of the Experiment and it’s results. Delete: Removes the Experiment from the database. Import: Allows the user to select an XML file that contains an Experiment. If the UUID in the file is unique, it is added to the Simulation database. Export: The user selects an Experiment from the list. The program asks if both parameters and results should be included in the export, or just parameters. A second dialog allows the user to browse for the output filename, select if output should be compressed and allows an additional export comment to be typed in. Note that the action of exporting an Experiment (or other objects) caused it to be marked as “frozen” in the database. This means that no changes can be made. This is for the sake of consistency as results are shared. However, a frozen Experiment can still be deleted from the database if needed. This file can be imported into another VespaSimulation installation using the Import function. If additional changes are desired a new Experiment, using the same Pulse Sequence object, can be created and edited. 5.2 Manage Metabolites dialog Access this dialog by clicking on the Management→Manage Metabolites menu item. Actions that can be taken on the Metabolite dialog include, New, Edit, View, Clone, (De)activate, Delete, Import and Export. An example of the Manage Metabolites window is shown below. The "Public" column indicates if a metabolite has ever been exported (or imported from someone else). If the public flag is set then it can not be edited. The "Use Count" column indicates how 18 many local Experiments use this metabolite. While in use by any Experiments, the metabolite can not be deleted. New: A dialog will pop up that gives the user a blank metabolite form to fill out. Select the number of spins in the metabolite and the form will enable the appropriate chemical shift and jcoupling fields. Edit the fields appropriately and hit ACCEPT or Cancel. See the sample in the figure below. Edit: The highlighted metabolite is opened in a metabolite form. Only the metabolite Name, and Comment are editable. The name is editable because Experiments save Metabolite references by UUID which are not editable. Use the "Clone" option to create a copy of a Metabolite that is fully editable. View: Similar to Edit but no fields are editable. 19 Clone: Select a metabolite in the list, hit clone and a copy of that metabolite is made that is now fully editable. The new metabolite has the name of the original metabolite followed by the date and the word "_clone". Delete: Only metabolites that have not been used by an experiment may be deleted. This is because to reconstruct any given Experiment, that object must refer to the original list of metabolites used to create it. The "Use Count" column indicates if a metabolite is in use by an Experiment. If not in use by an Experiment, the highlighted metabolite in the list can be deleted from the database. (De-)activate : When a metabolite is no longer being used, it can be set to a "deactivated" state where it no longer shows up in the Experiment Tab - Simulate metabolite list for use in new Experiments. This state is indicated in the Metabolite dialog by the word "(not active)" appended to the metabolite name in the list. Import: Allows the user to select an XML file that contains a Metabolite. If the UUID in the file is unique, it is added to the Simulation database. Export: The user selects a Metabolite from the list. A second dialog allows the user to browse for the output filename, select if the output should be compressed and allows an additional export comment to be typed in. Note that the action of exporting an object causes it to be marked as “frozen” in the database. This means that no further changes can be made. This is for the sake of consistency when results are shared. However, a frozen Metabolite can still be deleted from the database if needed. The exported file can be imported into another VespaSimulation installation using the Import function. Note. An interesting case for which one might want to create a new metabolite would be if one discovered during for example a long TE experiment that literature values for a particular metabolite were not adequately precise in terms of modeling the result of the experiment. One could obtain improved values via some combination of experimental and optimization methods, then clone the existing metabolite and enter the improved values. These improved values could later be submitted to the public VeSPA database, perhaps after publication of the results. 5.3 Manage Pulse Sequences dialog Access this dialog by clicking on the Management→Manage Pulse Sequences menu item. Actions that can be taken on the Pulse Sequences dialog include, New, Edit, View, Clone, Delete, Import and Export. An example of the window used to display and edit pulse sequence information is shown. The New, Edit, View, Import and Export buttons all launch secondary dialogs as part of their functionality. Clone and Delete only affect the list in the main pulse sequence management dialog. The "Public" column indicates if a sequence has ever been exported (or imported from someone else). Pulse Sequences with the Public column marked ‘x’ can not be edited except in the Name and Comment fields. The "Use Count" column indicates how many local 20 Experiments use this sequence. While in use by any Experiments, the sequence can not be deleted. View: Select a sequence from the main list. If more than one is selected the first on in the list is viewed. This button pops up a secondary dialog with three tabs that contain the sequence creation information, widget descriptors and pulse sequence and binning code. These tabs are not editable. See figure below for example of View. Clone: This option allows a user to make a copy of an existing pulse sequence. This is most useful when an existing sequence is “public” or otherwise not editable because it is referenced by an existing Experiment. Select a sequence in the list, hit clone and a copy of that sequence is made that is now fully editable. The new sequence has the name of the original sequence followed by the date and the word "_clone". Delete: Only sequences that are not referenced by an experiment may be deleted. To reconstruct any given Experiment, that object must refer to the original sequence used to create it. The "Use Count" column indicates if a sequence is in use by an Experiment. If not in use by an Experiment, the highlighted sequence(s) in the list can be deleted from the database. Import: Pops up a secondary dialog that allows the user to select an XML file that contains one or more Vespa Simulation pulse sequences. Any pulse sequences in the file are added to the database, provided that they aren't in the database already. Pulse sequences with UUIDs that match those already in the database are simply ignored. Please be sure to import/export pulse sequences with the “Manage Pulse Sequence” utility to ensure proper operation. Export: Select a Pulse Sequence from the list. A second dialog pops up that allows the user to browse for the output filename, select if output should be compressed and allows an additional export comment to be typed in. Note that the action of exporting an object causes it to be marked as “frozen” in the database and “public” in the pulse sequence management dialog. This means that it can not be changed. This is for the sake of consistency as results are shared. However, a frozen pulse sequence can still be deleted from the database if needed. This file can be imported into another Vespa-Simulation installation using the Import function. Please be sure to import/export pulse sequences with the “Manage Pulse Sequence” utility to ensure proper operation. 21 New: A “Pulse Sequence Editor” dialog pops up that allows the user to design and test a pulse sequence using PyGAMMA code. The user must provide general descriptive information about the sequence. They must describe how to lay out the pulse sequence in the Experiment tab Simulate sub-tab, both for the standard loop variables as well as any user-defined parameters. The user must also provide PyGAMMA code (i.e. a Python script that uses calls to the PyGAMMA library) for the main pulse sequence. Default code for binning results is provided. You can keep this code, alter it, replace it or delete it entirely. (See Appendix A for details.). The New Pulse Sequence Editor widget is shown below. Please note that there are 2 main windows: 1) the Design/Test notebook (left) and 2) the Code/Display notebook (right). To create a pulse sequence, fill in the “Design” tab, the Sequence Code tab and Binning Code tab. At this point, if you have filled them in correctly, you have created a pulse sequence and if desired, could quit the dialog. Alternatively, you can hit the Update Testing Control button and proceed to test and modify your pulse sequence as desired. The “Test” tab and “Visualize” tab allow you to test your pulse sequence before running it in an Experiment. Effectively, it allows you to run a mini-Experiment where only one metabolite and one value, for any loops you defined, are allowed. More information on these is provided below. When you hit the OK button (lower right), the pulse sequence is saved to the database, the New Pulse Sequence dialog goes away, and you should see your new sequence listed in the main Manage Pulse Sequence dialog list. If you do not wish to save your pulse sequence, hit Cancel. Design Tab – Data input fields Name: This is how the pulse-sequence is displayed in the dropdown list in the Experiment tab Simulate sub-tab . Creator: The name of the person creating the pulse sequence 22 Loop Labels: When the pulse sequence is called, it can make use of up to three looping variables to create a variety of conditions for investigating metabolite behavior. In the Loop1, Loop2 and Loop3 rows the user gives information that allows Simulation to parse these loop variables. The Label field is a string used in creating the Experiment tab Simulate sub-tab that describe these loops. An example would be “TE [ms]” for a spin echo experiment. N.B. If you indicate that a user should provide a timing in [ms], don’t forget to divide by 1000 in your program to get a timing value in [sec] that PyGAMMA requires. The examples demonstrate how to define and use these parameters in PyGAMMA code. Your Static Parameter Definitions: Each pulse sequence GUI has a section where users can set values for additional static parameters that are passed into the simulation. The GUI for these parameters needs to be described in the Pulse Sequence Editor so that the main program can display them properly. By hitting the Add button, a row of widgets will appear that contain three fields used to describe the GUI for one static parameter: A data type (selected from a drop-list), a "Name" string, and a "Default Value" string. The Name string will be used by the Experiment Tab Simulate sub-tab as a label to describe this field when the pulse sequence is selected for an Experiment. The data type shows up as a label in the far right hand side as a reminder. The default value is inserted as the initial value that is displayed in that field. The Remove Selected button can be used to remove unwanted static parameters while designing a pulse sequence. Select the check box on the left side of each row of parameters you want to remove, and then hit the Remove Selected button. Note: By selecting a data type for a user-specified parameter in the drop down menu, the user will be reminded to enter a variable of that type, but the actual field value will be passed as a string that must be appropriately converted before being used in PyGAMMA simulation code. Please select your default types and values accordingly. Your RF Pulses Definitions: Each pulse sequence GUI has a section where users can set up “real” RF pulse waveforms that are passed into the simulation. Pulses are browsed for from the Vespa RFPulse database using the Add button. The pulse must already exist in the Vespa RFPulse database for it to be added to a Simulation Pulse Sequence definition. The Remove Selected button can be used to remove unwanted RF pulses while designing a pulse sequence. Select the check box on the left side of each pulse you want to remove, and then hit the Remove Selected button. Note: Immediately upon browsing for an RF pulse and hitting OK, the sequence designer dialog will take a “snapshot” of the selected pulse as it exists in the database at that moment. If you are editing an RFPulse PulseProject to create the pulse to be used in Simulation, you should hit Save before adding it to the Simulation pulse sequence. Also, when it is added, this will freeze that version of the RFPulse PulseProject. If you go to save that PulseProject again, you will be prompted to save that version under a new name to preserve the original waveform for use in Simulation. If you remove a pulse from a Simulation (and it’s not being used anywhere else in Vespa), then the RFPulse PulseProject will be unfrozen, and able to be edited and saved again. Note2: The RF pulses included using this mechanism are static, in that they cannot be altered at pulse sequence run time. There is no GUI element to represent these pulses in the main program. The RF pulses selected in the designer are always and only the ones available for use within your PyGAMMA code. That said, a user could designate a for-loop or static variable that could be used to select one or more pulses from the static RF pulse list if this flexibility was needed. However, at this time Simulation does not provide the functionality to select RFPulse waveforms from the Simulate tab at Experiment run time. 23 As described in more detail Appendix A, the values of user-specified parameters and pulses are passed to each Simulation that is run as part of an Experiment. The results of setting up your pulse sequence loops and additional parameters can be viewed in the “Test” tab. The examples demonstrate how to define and use these parameters in PyGAMMA code. Comments: A field where you can enter a lot of text to remind yourself why you make this pulse sequence when you check back on it 3 months from now. This is also a good place to put information for users on how to use this sequence. Sequence Code Notebook Tab Note: This tab can be moved and positioned in a variety of ways. Left click and drag the tab of the pane that you want to re-locate to the position that you want it. The Sequence Code tab is a text window in which PyGamma code can be pasted and/or edited. See Appendix A for details of how Simulation interacts with your PyGAMMA code. There's an example in the figure below. Binning Code Tab Note: This tab can be moved and positioned in a variety of ways. Left click and drag the tab of the pane that you want to re-locate to the position that you want it. This is a text window (like the Sequence Code tab) in which PyGamma code can be pasted and/or edited. Simulation adds default binning code when the New Pulse Sequence dialog opens, but you can edit or delete it as you like. Again, details are in Appendix A. Test Tab When the user clicks on the Test tab, the settings in the Design tab are validated, and if passed, then the Test tab widgets are updated to reflect the pulse sequence design. If there are any missing fields or other errors in the Design tab, the user is prompted to fix these prior to switching to the Test tab. Note: A similar validation takes place when the user hits the OK button. Only a validated pulse sequence can be saved into the database. However, the validation only checks to see if all necessary data is available in a reasonable format, NOT if it is functional PyGAMMA code. An example is shown below of how settings in the Design tab are represented on the Test tab. Note that the test values for each loop have been entered and that the default value for the “my string” user parameter has been altered as well. 24 Loop Values: These loops were defined in the Design tab. Any loops without a label are not included in the pulse sequence. The user must fill in a value for use in the test run for each loop. User Static Parameters: User parameters were defined in the Design tab. They are initially populated with their default values, but may be altered for the test run as necessary. Experiment Parameters: When the Run Test button is hit, a mini-Experiment will be run to test the user’s pulse sequence. In order to properly run and display results the experiment needs values for Main Field [MHz], the isotope, one metabolite to be run (select from the list as sorted by isotope), and the binning parameters for Peak Search Range and Blend Tolerance (see Appendix A for more information on the standard blending algorithm) 25 Results Plot Options: These values only affect how the metabolite result is plotted to the Display Canvas tab in the notebook. Spectral Points are the number of points in the metabolite FID, Sweep Width defines the FID dwell time, Line Width [Hz] defines the broadening applied to the FID. Checking the Gaussian box applies a Gaussian lineshape, when it is not checked a Lorentzian lineshape is applied. Checking Magnitude plots magnitude data on the canvas, otherwise real data is plotted. Checking x,y Values will show in the lower left corner of the plot the x and y axis values of the location of the mouse as it moves across the canvas. Text Results Button: Creates a text representation of the metabolite test results and displays them in a native text editor on your computer Plot→PNG Button: Creates a PNG format image of the plot display and shows it in a native image viewer on your computer. Run Test Button: Runs a test Experiment on the pulse sequence. The Start and End times should be reported in the Console window. Any additional exceptions that are raised should be reported between these messages. Console: The place where text messages about each Test Run are printed. Visualize Notebook Tab Note: This tab can be moved and positioned in a variety of ways. Left click and drag the tab of the pane that you want to re-locate to the position that you want it. The test metabolite results are reconstituted as a frequency domain spectrum as described in the Results Plot Options and plotted to this display tab. The Left mouse button can be used to draw a zoom box in both x and y directions. Multiple zooms can be performed. Left clicking once in place will zoom you all the way out to the maximum x-axis extent and fit the y-axis to approximately the min/max data range. Clicking and dragging on the Right mouse will draw a Span Cursor, two vertical cursors on the screen, filled in with light gray. These will stay in place between test runs as you vary loop and parameter values. Right clicking in place will turn off the Span Zoom region. Edit: The first highlighted sequence is opened in a form similar to the New Sequence dialog. Note: Only the metabolite Name, and Comment are editable if the pulse sequence is “public” or referred to by one or more Experiments. The name is editable because Experiments save Pulse Sequence references by UUID which are not editable. Use the "Clone" option to create a copy of a Pulse Sequence that is editable. If the sequence is editable, the existing values of the pulse sequence object are populated into the Design and Test tabs on startup. The name of the pulse sequence from the main dialog is shown in the dialog title. The pulse sequence setting can be edited and tested just like a New pulse sequence would be. Hitting OK saves any changes into the database. Cancel quits the dialog without saving changes. 6. Results Output 6.1 Results output into standard text editor The Vespa-Simulation View menu lists commands that only apply to the active Experiment Tab. Select the View→Output→Text Results option and a tab-delineated text description of the 26 Experiment is created and loaded into the local computer’s standard text editor. On Windows, this is typically Notepad. From here the user can save it wherever they please. N.B. This command can also be launched from the Experiment TabVisualize sub-tab using the ASCII Results button. The first section of the text file describes the settings of the Experiment. Metabolite simulations are saved as a collection of lines with amplitude, PPM and phase that can be used to recreate a time domain spectrum. Each line contains: metabolite name, loop1_value, loop2_value, loop3_value, line_number, PPM, area and phase (deg). The index_loop variables may be set to other than 0 if the Experiment contains multiple steps in pulse sequence timings. E.g. an Experiment could run NAA, Cr and Cho for 10 TE values, with TE1 being held fixed and TE2 having 10 values. In the output file, loop1_index would be fixed and loop2_index would increment 10 times. The metabolite name(s) would repeat 10 times as well, as loop2_value is incremented. In this way, a 2D Experiment is flattened into a 1D output file. --- Experiment 9a146ac7-c47d-4ae2-b7b2-961e942d7d18 --Name: Example OnePulse Data Public: True Created: 2010-03-24T16:20:18 Comment (abbr.): Simulation for baseline GAVA database PI: bsoher Parameters: b0: 64.000000 Peak Search PPM low/high: 0.000000 / 10.000000 Blend tol. PPM/phase: 0.001500 / 50.000000 Pulse seq.: bf0b302c-ce1f-46c9-b852-0e7c6b77f95c (One-Pulse) 3 Metabolites: aspartate, choline-truncated, creatine 1 Simulations: (not shown) Simulation Results --------------------------------------------------------------------------aspartate 0.0 aspartate 0.0 aspartate 0.0 aspartate 0.0 aspartate 0.0 aspartate 0.0 aspartate 0.0 aspartate 0.0 aspartate 0.0 aspartate 0.0 aspartate 0.0 aspartate 0.0 aspartate 0.0 aspartate 0.0 choline-truncated creatine 0.0 creatine 0.0 creatine 0.0 6.2 0.0 0.0 0.0 0.0 0.0 0.0 0.0 0.0 0.0 0.0 0.0 0.0 0.0 0.0 0.0 0.0 0.0 0.0 0.0 0.0 0.0 0.0 0.0 0.0 0.0 0.0 0.0 0.0 0.0 0.0 0.0 0.0 0.0 0.0 0.0 0.0 0 1 2 3 4 5 6 7 8 9 10 11 12 13 0.0 0 1 2 2.3706 2.49372 2.64232 2.70787 2.76544 2.78347 2.97959 3.05519 3.58274 3.79689 3.87249 3.92001 3.99561 4.20976 0 3.027 3.913 6.649 0.03836 0.0 0.02196 0.0 0.409 0.0 0.42219 0.0 0.52731 0.0 0.5175 0.0 0.04772 0.0 0.01597 0.0 0.00563 0.0 0.29328 0.0 0.25374 0.0 0.23456 0.0 0.21054 0.0 0.00225 0.0 3.185 3.0 3.0 0.0 2.0 0.0 1.0 0.0 0.0 Plot results to image file formats Results in the 1D/StackPlot, Integral Plot and Contour Plot windows can all be saved to file in PNG (portable network graphic), PDF (portable document file) or EPS (encapsulated postscript) formats to save the results as an image. The Vespa-Simulation View menu lists commands that only apply to the active Experiment Tab. Select the View→Output→ option and further select either the 1D/StackPlot, IntegralPlot or ContourPlot menu item. Finally, select either Plot to PNG, Plot to PDF or Plot to EPS item. The user will be prompted to pick an output filename to which will be appended the appropriate suffix. 27 6.3 Plot results to vector graphics formats Results in the 1D/StackPlot, Integral Plot and Contour Plot windows can all be saved to file in SVG (scalable vector graphics) or EPS (encapsulated postscript) formats to save the results as a vector graphics file that can be decomposed into various parts. This is particularly desirable when creating graphics in PowerPoint or other drawing programs. At the time of writing this, only the EPS files were readable into PowerPoint. The Vespa-Simulation View menu lists commands that only apply to the active Experiment Tab. Select the View→Output→ option and further select either the 1D/StackPlot, IntegralPlot or ContourPlot menu item. Finally, select either Plot to SVG, or Plot to EPS item. The user will be prompted to pick an output filename to which will be appended the appropriate suffix. 28 Appendix A. Pulse Sequence Design A.1 What is under the hood? A.1.1 Vespa-Simulation Basic Concepts This is a combination of logical concepts and constraints that determine how Simulation works. These rules are enforced through the application and, to some extent, the database. The main objects in the system are experiments, simulations, spectra, pulse sequences and metabolites. Experiments are the primary objects; everything else is secondary. Here's how they're related - Each experiment has zero to many simulations. Simulations are the whole point of an experiment, and there's not much to an experiment besides the metatdata that defines the simulations. Since entering the experiment metadata is pretty trivial, we don't let users save experiments that define zero simulations. Experiments with zero simulations can exist, but only in memory. They are never saved to the database or an export file. Each experiment makes use of and refers to exactly one pulse sequence, but the experiment may define one or more timing sets for the pulse sequence. Each simulation creates one spectrum. Each spectrum has zero or more lines. Zero is an unusual case, but possible. Each spectral line has one PPM, area and phase value in it. We expect users to share data via Simulation's export and import functions. For this reason, several of Simulation's objects (experiments, pulse sequences and metabolites) have universally unique ids (UUIDs) rather than just ordinary integer ids. A.1.2 Experiments Experiments are the main focus of the Simulation application. An Experiment's raison d'etre is to run a set of simulations. This set of simulations is the experiment's results space. Currently, that space is defined by one to four nested loops. The first loop covers the list of metabolites the user has involved in the experiment. The other one, two or three loops are userdefined lists of numbers. The figure below is a visual representation of a 3D results space (one set of metabolites and two lists of user-defined numbers). For clarity we do not show the 4th dimension (a.k.a. the last user defined loop) as stacks of cubes are hard to visualize. 29 Simulations themselves know nothing about one another and are agnostic to the order in which they're run. The existing Vespa-Simulation code is geared towards generating a regular results space that we iterate over in a very straightforward order. (More complex result spaces and iteration orders could be created provided you can dream up a GUI that allows users to describe that results space.) A few other “rules” of note: Once an experiment has been saved, the following attributes become read-only: pulse sequence, investigator, user parameters, b0, isotope, peak_search_ppm_low, peak_search_ppm_high, blend_tolerance_ppm, blend_tolerance_phase. One can associate additional metabolites with an experiment, but once it is associated and the experiment is saved, the metabolite remains with the experiment forever. In other words, a metabolite can't be removed from a saved experiment. An experiment's b0 value is always stored in megahertz. The take-home lesson from this section is that the Vespa-Simulation application provides 4 dynamic (looping) variables and 12 standard static variables to each spectral simulation that is run. In the example below, we will specify what these are and how they can typically be used. In 30 the second example below, we will discuss how user defined static variables (ie. they do not change as the loop variables are incremented) can also be passed into spectral simulations. A.2 First Steps for Creating Your Own Pulse Sequences A.2.1 Overview This section contains a lot of information about how the PyGAMMA pulse sequences that you design in the Pulse Sequence Designer dialog work within the Vespa-Simulation application. There is a lot of information here, but the thing to keep in mind is that there are 5 very well documented examples following this section. Please take the time to read the “rules of the road” here. It should keep you from any rookie mistakes like not using the right name for the function that your PyGAMMA code goes inside. And then dig into some “learn by doing” afterwards. The interface between Simulation and pulse sequence code changed in version 0.1.2 of Vespa. The new interface is not compatible with the old one. Pulse sequence code in prior versions won't run under the new interface without some changes. We're written a practical guide to upgrading to 0.1.2. This document explains the details behind the change, such as -• How Simulation Runs a Pulse Sequence • Why We Changed the Interface • What the New Interface Looks Like A.2.2 How Simulation Runs Your Pulse Sequence (A Brief Review) Each pulse sequence consists of two pieces of code -- the sequence code and the binning code. The sequence code is generally where we put PyGAMMA code that describes the simulation and generates the results. The binning code can subsequently be used to simplify these results (e.g. the combination of degenerate lines - hence, the name 'binning'). The binning step is optional. A.2.3 The Interface Between Simulation and Your Pulse Sequences Simulation imports your code as modules. Importing a module should be familiar to anyone who has used Python, and that's how Simulation uses your pulse sequence code. The sequence and binning code segments you provide are saved to temp files and then Simulation imports those files as two individual modules: one module for the sequence code and another module for the binning code. This means that your sequence code is in its own namespace and your binning code is in its own separate namespace. It's as if they were in modules named my_sequence_code.py and my_binning_code.py. Simulation calls the run() function in your code. Calling a function in an imported module should also be familiar to anyone who has used Python. In this case, you provide a function called run() in both your sequence and binning code. Those functions each accept a single parameter as described below. Simulation passes a class instance to your code instead of a dictionary. Simulation passes an instance of a class that describes the simulation with a well-defined set of attributes. 31 The class contains attributes like field, peak_search_ppm_low, dims, etc. It also contains an attribute called spin_system that returns a spin system for the current simulation. For a full list of the class attributes, examine the class definition (in vespa/simulation/src/simulation_description.py) or see section A.3.1 below. The same object is passed to both the sequence and binning code, so it's easy to "pass" a variable created in the sequence code to the binning code. Just assign it to an attribute on the object. For instance, to make the transition table matrix available to the binning code, add this to your sequence code: sim_desc.mx = PyGAMMA.TTable1D(ACQ.table(sigma0)) This demonstrates a larger point: once the simulation description object is passed to your code, Simulation doesn't use it. Your code is free to manipulate it as you see fit. Not only can you add attributes and methods, you can delete and overwrite them too. Simulation passes 8 bit strings. All strings passed to your code in the simulation description are UTF-8 encoded 8 bit strings. If you don't know what this means, you can probably just ignore it. Specifically, it means that the strings are safe for PyGAMMA. (see http://scion.duhs.duke.edu/vespa/gamma/wiki/PyGammaAndPythonStrings ) Your code returns results via a return statement. Your code (sequence or binning, as explained below) should return a 3-tuple of lists (or other iterables) of floats that represent the ppm, area, and phase values. The phrase "...(or other iterables)..." means that the elements of the 3-tuple can be lists, tuples, PyGAMMA.DoubleVector objects, numpy arrays, etc. They don't even have to be of the same type. For instance, this is a valid set of results: return ( [0, 0, 0], numpy.zeros(3), PyGAMMA.DoubleVector(3) ) The tuple elements must be the same length. If they're not, Simulation discards your results and raises a ValueError. You can return results from the sequence or binning code. Since not everyone will want to run a binning step, we've made it easy to skip. If your sequence code returns a 3-tuple of results as described above, Simulation won't call your binning code. If your sequence code returns None(or doesn't have a return statement at all), then Simulation will call your binning code which must return the 3-tuple of results. Results must contain only Python float, int or long objects. The type of every element in the ppm, area and phase lists must be float,int or long. One can't return, for example, Python complex numbers, PyGAMMA complex numbers, or ctypes.c_float objects. If this rule is violated, Simulation discards your results and raises a ValueError. A.3 Creating a Pulse Sequence without Extra Parameters A.3.1 How to create a “One-Pulse” pulse sequence An important thing to remember in pulse sequence design is that regardless of how many looping variables are defined, each spectral simulation (calculation) receives a standard set of pulse sequence parameters as described below. To achieve this, an object called “sim_desc” (the simulation description) is created to store these common (and any other) parameters. A new sim_desc object is created for each Simulation within an Experiment object (ie. You can not use this object to “pass messages” between simulations). Each sim_desc object is sent to a function that executes the PyGAMMA 32 spectral simulation that it describes. On completion of each simulation, your code returns lists of results (area, ppm, and phase values). Simulation adds start/finish time stamps and stores the results in the database. The 15 standard parameters and one user defined parameter are stored as attributes of the sim_desc object, and are: ‘vespa_version’ – (string) version number of the Vespa-Simulation program in string format ‘field’ – (float) main B0 field strength in MHz ‘observe_isotope – (string) the nuclei used to sort/select the metabolites of interest in the Experiment, and thus assumed to be the one used to observe results. Can be used to keep your code nuclei agnostic ‘peak_search_ppm_low’ – (float) lower end of range in ppm to be searched in binning code (see below) ‘peak_search_ppm_high’ – (float) upper end of range in ppm to be searched in binning code (see below) ‘blend_tolerance_ppm’ – (float) width of bins in ppm into which similar lines can be combined (see below) ‘blend_tolerance_phase’ – (float) width of bins in phase (specified in degrees) into which similar lines can be combined (see below) ‘dims – (list) this list contains the values of the 4 loops as set for this particular simulation. Specifically, dims[0] is a string containing the metabolite name, dims[1] dims[2] and dims[3] contain the float values of the three counting loops. ‘met_iso – (list) string value for the isotope of each spin in the current metabolite ‘met_cs – (list) float ppm value for chemical shift of each spin in the current metabolite ‘met_js – (list) float ppm value for J-couplings of each spin pair in the current metabolite ‘nspins – (int) number of spins in the metabolite (for convenience) ‘user_static_parameters’ – (list) static parameters defined by the user in the GUI that are stored in this list as strings in the order that they are presented in the GUI (see below). Note: In this One-Pulse experiment there are no user defined parameters so the list would be empty. ‘pulses’ – (list) contains zero or more MinimalistPulse objects. These objects pass the minimum amount of data needed to use the results from an RFPulse PulseProject as a ‘real’ pulse in a PyGAMMA simulation. A MinimalistPulse contains a string ‘name’ attribute, a float ‘dwell_time’ attribute and a ‘waveform’ attribute that is a list of complex floats in microTesla. The minimalist pulse objects are in the same order as they were listed in the Pulse Sequence Designer dialog. The formal definition of the MinimalistPulse class is in vespa/public/minimalist_pulse.py which you can view online here: http://scion.duhs.duke.edu/vespa/project/browser/trunk/public/minimalist_pulse.py ‘spin_system’ – (object) Via the attribute "spin_system", the sim_desc object provides a PyGamma spin_system object constructed from the field, isotopes, chemical shifts and jcoupling values. This is only for your convenience and you're welcome to use the original values any way you please. 33 The One-Pulse Example Here is the PyGAMMA code that is in the sequence_code string for the One-Pulse sequence: import pygamma as pg def run(sim_desc): #----------------------------------------------------------------# Example PyGAMMA pulse sequence for use in Vespa-Simulation # # A timing diagram for this pulse sequence can be found in the # Appendix of the Simulation User Manual. #----------------------------------------------------------------spin_system = sim_desc.spin_system # # # # the isotope string used to sort/select the metabolites of interest is passed in the sim_desc object so the user can tailor other object within their code to be nuclei specific, such as the observe operator or pulses obs_iso = sim_desc.observe_isotope # set H = D = ac = ACQ = up steady state and observation variables pg.Hcs(spin_system) + pg.HJ(spin_system) pg.Fm(spin_system, obs_iso) pg.acquire1D(pg.gen_op(D), H, 0.000001) ac # excite and acquire the data sigma = pg.sigma_eq(spin_system) sigma0 = pg.Iypuls(spin_system, sigma, obs_iso, 90.0) # instantiate and save transition table of simulation results # note. this step copies the TTable1D result from the ACQ into # a TTable1D object in the sim_desc object. Thus, when # we return from this function and the ACQ variable gets # garbage collected, our copy of the results in not affected sim_desc.mx = pg.TTable1D(ACQ.table(sigma0)) The first thing to note is that other than the “spin_system” attribute, this pulse sequence does not make use of any of the parameters in the sim_desc object. There are no loops in this simulation and no user-defined static parameters. (For examples of how to use these variables see the following examples). In this example the first line of code (ignoring comments) defines the Hamiltonian, in this case consisting simply of chemical shift and J coupling terms. The second through fourth lines define the detection and acquisition operators. Note that the observation nuclei is specified dynamically using the string passed in within the sim_desc.observe_isotope attribute. The fifth line defines an equilibrium density matrix. The sixth line applies an ideal 90 degree pulse to the density matrix and returns the resulting density matrix. The final line applies the acquisition operator to the final density matrix and returns a transition table. For more details on PyGAMMA and GAMMA objects consult the PyGAMMA documentation. 34 Note. The final line of code demonstrates the one “output” code requirement if the user plans on using the standard ‘binning_code’ provided by Simulation as the default. In that case, the user must create and fill a transition table attribute called “mx” in the sim_desc object. Note. In the final line, we have to explicitly create a new TTable1D object and copy the simulation results from the TTable1D in the ACQ variable. This is done by default if the TTable1D to be copied is passed into the initialization of the object. We copy this information because otherwise we would only have a reference to the ACQ object’s results. When we return from the function, the ACQ object is ‘garbage collected’ and then our reference is broken. Here is the PyGAMMA code that is the default binning_code string which is automatically inserted into the Binning Code tab for each new pulse sequence definition, and subsequently is used in the One-Pulse sequence: import pygamma def run(sim_desc): area = PyGAMMA.DoubleVector(0) ppm = PyGAMMA.DoubleVector(0) phase = PyGAMMA.DoubleVector(0) field = sim_desc.field nspins = sim_desc.nspins tolppm = sim_desc.blend_tolerance_ppm tolpha = sim_desc.blend_tolerance_phase ppmlow = sim_desc.peak_search_ppm_low ppmhi = sim_desc.peak_search_ppm_high bins = sim_desc.mx.calc_spectra(ppm, area, phase, \ field, nspins, tolppm, \ tolpha, ppmlow, ppmhi) return (ppm, area, phase) This code expects that an attribute named “mx”, that is a PyGAMMA transition table, already exists in the sim_desc object. The actual binning code is written in C++ and accessed through a SWIG mapping. This code creates three equal length lists called area, ppm and phase that are subsequently returned from the execution of the binning function to the main Simulation application for storage in the database. If the user wants to write their own ‘binning’ code then they must follow these requirements. If the user is careful about what is provided/executed in the ‘sequence_code’ and subsequently used in the ‘binning_code’, there may be no need for the “mx” variable. But, your code must always return the three equal length lists representing ppm, area and phase. A.3.2 A “One-Pulse” pulse sequence that does NOT use binning code Here is the PyGAMMA code that is in the sequence_code string for the One-Pulse No Binning sequence import math import pygamma as pg def run(sim_desc): 35 #-----------------------------------------------------------------------# This is an example PyGAMMA pulse sequence for use in Vespa-Simulation. # It demonstrates how results can be returned directly by the sequence # code as opposed to being returned by the binning code. When the # sequence code returns results, the binning code is never invoked. # # A timing diagram for this pulse sequence can be found in the Appendix # of the Simulation User Manual. #-----------------------------------------------------------------------spin_system = sim_desc.spin_system # # # # the isotope string used to sort/select the metabolites of interest is passed in the sim_desc object so the user can tailor other object within their code to be nuclei specific, such as the observe operator or pulses obs_iso = sim_desc.observe_isotope # set H = D = ac = ACQ = up steady state and observation variables pg.Hcs(spin_system) + pg.HJ(spin_system) pg.Fm(spin_system, obs_iso) pg.acquire1D(pg.gen_op(D), H, 0.000001) ac # excite and acquire the data sigma = pg.sigma_eq(spin_system) sigma0 = pg.Iypuls(spin_system, sigma, obs_iso, 90.0) # instantiate transition table of simulation results mx = pg.TTable1D(ACQ.table(sigma0)) # Calculate results mx_indices = mx.Sort(0, -1, 0) normal = 0.5 * 2**(sim_desc.nspins - 1) ppms = [] areas = [] phases = [] for index in mx_indices: # ctmp is a complex number ctmp = mx.I(index) ppms.append(-mx.Fr(index) / (2.0 * math.pi * sim_desc.field)) areas.append(math.hypot(ctmp.Rec(), ctmp.Imc()) / normal) if ctmp.Imc() or ctmp.Rec(): phase = (-180.0 / math.pi) * math.atan2(ctmp.Imc(), ctmp.Rec()) else: phase = 0 phases.append(phase) phases = [(phase * -1.0) for phase in phases] return (ppms, ares, phases) Note that the lines in yellow further process the original One-Pulse sequence in order to extract the transition lines from the PyGAMMA simulation and then process them so that they are appropriately passed back to the Simulation program. Note also that some of this code is PyGAMMA (mx.Sort, etc.), some is straight Python (math.pi, math.atan2, etc.). 36 The final line of code creates a tuple with three iterable objects (lists in this case, but it could also be tuples or other iterable objects) that contain the ppm values, areas and phase values for all lines. These lists MUST have the same length. These are the results values that are saved to the database. The fact that your sequence code returns something other than None tells Simulation not to call the binning code. A.3.3 The “Ideal-PRESS” pulse sequence – typical use of standard parameters Here is the PyGAMMA code that is in the sequence_code string for the PRESS_Ideal sequence: import pygamma as pg def run(sim_desc): #---------------------------------------------------------------# This is an example PyGAMMA pulse sequence # for use in Vespa-Simulation # # A timing diagram for this pulse sequence can be # found in the Appendix of the Simulation User Manual. #---------------------------------------------------------------spin_system = sim_desc.spin_system # # # # the isotope string used to sort/select the metabolites of interest is passed in the sim_desc object so the user can tailor other object within their code to be nuclei specific, such as the observe operator or pulses obs_iso = sim_desc.observe_isotope # # # # extract the dynamically changing variable from loop 1 and 2 for 'te1' and 'te2', divide by 1000.0 because the GUI states that values are entered in [ms], but PyGAMMA wants [sec] te1 = sim_desc.dims[1] / 1000.0 te2 = sim_desc.dims[2] / 1000.0 # set up steady state and observation variables H = pg.Hcs(spin_system) + pg.HJ(spin_system) D = pg.Fm(spin_system, obs_iso) ac = pg.acquire1D(pg.gen_op(D), H, 0.000001) ACQ = ac sigma0 = pg.sigma_eq(spin_system) # excite, propagate, refocus and acquire the data sigma1 = pg.Iypuls(spin_system, sigma0, obs_iso, 90.0) Udelay = pg.prop(H, te1*0.5) sigma0 = pg.evolve(sigma1, Udelay) sigma1 = pg.Iypuls(spin_system, sigma0, obs_iso, 180.0) Udelay = pg.prop(H, (te1+te2)*0.5) sigma0 = pg.evolve(sigma1, Udelay) sigma1 = pg.Iypuls(spin_system, sigma0, obs_iso, 180.0) 37 Udelay = pg.prop(H, te2*0.5) sigma0 = pg.evolve(sigma1, Udelay) # instantiate and save transition table of simulation results # note. this step copies the TTable1D result from the ACQ into # a TTable1D object in the sim_desc object. Thus, when # we return from this function and the ACQ variable gets # garbage collected, our copy of the results in not affected sim_desc.mx = pg.TTable1D(ACQ.table(sigma0)) The first thing to note is that this pulse sequence utilizes the “spin_system” variable and also the sim_desc object for the Loop1 and Loop2 values in the “te1 = sim_desc.dims[1]” and “te2 = sim_desc.dims[2]” lines. There are no user-defined static parameters. Similarly to the example above a transition table attribute called “mx” is set up in the last line of code. (Not shown) The default binning_code string is used to return the values from the transition table to the main Simulation program. A.4 Creating a Pulse Sequence with Extra Parameters A.4.1 The “PRESS-CP with Variable R-groups” Pulse Sequence Here is the PyGAMMA code that is in the sequence_code string for the PRESS-CP with Variable R-groups” sequence: import pygamma as pg def run(sim_desc): spin_system = sim_desc.spin_system # # # # the isotope string used to sort/select the metabolites of interest is passed in the sim_desc object so the user can tailor other object within their code to be nuclei specific, such as the observe operator or pulses obs_iso = sim_desc.observe_isotope # extract the dynamically changing variable from loops 1, 2 and 3, divide # 'te1' and 'te2' by 1000.0 because the GUI states that values are entered # in [ms], but PyGAMMA wants [sec] te1 = sim_desc.dims[1] / 1000.0 te2 = sim_desc.dims[2] / 1000.0 rgroups = int(sim_desc.dims[3]) # extract user static parameter values from the control dictionary. They # are inserted into a list in the order that they are shown in the GUI. pulse_type ang90 pd90 tauR pd180 ang180 offhz # set H = D = ac = = = = = int( sim_desc.user_static_parameters[0]) float(sim_desc.user_static_parameters[1]) float(sim_desc.user_static_parameters[2]) float(sim_desc.user_static_parameters[3]) = pd90 * 2.0 = ang90 * 2.0 = 0.0 up steady state and observation variables pg.Hcs(spin_system) + pg.HJ(spin_system) pg.Fm(spin_system, obs_iso) pg.acquire1D(pg.gen_op(D), H, 0.000001) 38 ACQ = ac # apply excitation pulse and propagate to first 180 pulse sigma0 = pg.sigma_eq(spin_system) sigma1 = pg.Iypuls(spin_system, sigma0, obs_iso, 90.0) Udelay = pg.prop(H, te1*0.5) sigma0 = pg.evolve(sigma1, Udelay) # apply first 180 pulse and propagate to CP train start sigma1 = pg.Iypuls(spin_system, sigma0, obs_iso, 180.0) Udelay = pg.prop(H, te1*0.5) sigma0 = pg.evolve(sigma1, Udelay) sigma1 = sigma0 # apply the Carr-Purcell refocussing pulse train if pulse_type == 0: # using Ideal 180 pulses for k in range(rgroups): Udelay = pg.prop(H, tauR/2.0) sigma0 = pg.evolve(sigma1,Udelay) sigma1 = pg.Iypuls(spin_system,sigma0,180) Udelay = pg.prop(H, tauR/2.0) sigma0 = pg.evolve(sigma1,Udelay) sigma1 = sigma0 else: for k in range(rgroups): # using 90-180-90 square 'Sandwich' pulses with MLEV16 phase # cycling if (k % 4) == 0: Udelay = pg.prop(H, tauR/2.0) sigma0 = pg.evolve(sigma1,Udelay) sigma1 = pg.Sxpuls(spin_system, sigma0, H, obs_iso, offhz, pd90, ang90) sigma0 = pg.Sypuls(spin_system, sigma1, H, obs_iso, offhz, pd180, ang180) sigma1 = pg.Sxpuls(spin_system, sigma0, H, obs_iso, offhz, pd90, ang90) Udelay = pg.prop(H, tauR) sigma0 = pg.evolve(sigma1,Udelay) sigma1 = pg.Sxpuls(spin_system, sigma0, H, obs_iso, offhz, pd90, ang90) sigma0 = pg.Sypuls(spin_system, sigma1, H, obs_iso, offhz, pd180, ang180) sigma1 = pg.Sxpuls(spin_system, sigma0, H, obs_iso, offhz, pd90, ang90) Udelay = pg.prop(H, tauR) sigma0 = pg.evolve(sigma1,Udelay) sigma1 = pg.Sxpuls(spin_system, sigma0, H, obs_iso, offhz, pd90, -ang90) sigma0 = pg.Sypuls(spin_system, sigma1, H, obs_iso, offhz, pd180, -ang180) sigma1 = pg.Sxpuls(spin_system, sigma0, H, obs_iso, offhz, pd90, -ang90) Udelay = pg.prop(H, tauR) sigma0 = pg.evolve(sigma1,Udelay) sigma1 = pg.Sxpuls(spin_system, sigma0, H, obs_iso, offhz, pd90, -ang90) sigma0 = pg.Sypuls(spin_system, sigma1, H, obs_iso, offhz, pd180, -ang180) sigma1 = pg.Sxpuls(spin_system, sigma0, H, obs_iso, offhz, pd90, -ang90) Udelay = pg.prop(H, tauR/2.0) sigma0 = pg.evolve(sigma1,Udelay) sigma1 = sigma0 39 if (k % 4) == 1: Udelay = pg.prop(H, tauR/2.0) sigma0 = pg.evolve(sigma1,Udelay) sigma1 = pg.Sxpuls(spin_system, sigma0, H, obs_iso, offhz, pd90, -ang90) sigma0 = pg.Sypuls(spin_system, sigma1, H, obs_iso, offhz, pd180, -ang180) sigma1 = pg.Sxpuls(spin_system, sigma0, H, obs_iso, offhz, pd90, -ang90) Udelay = pg.prop(H, tauR) sigma0 = pg.evolve(sigma1,Udelay) sigma1 = pg.Sxpuls(spin_system, sigma0, H, obs_iso, offhz, pd90, ang90) sigma0 = pg.Sypuls(spin_system, sigma1, H, obs_iso, offhz, pd180, ang180) sigma1 = pg.Sxpuls(spin_system, sigma0, H, obs_iso, offhz, pd90, ang90) Udelay = pg.prop(H, tauR) sigma0 = pg.evolve(sigma1,Udelay) sigma1 = pg.Sxpuls(spin_system, sigma0, H, obs_iso, offhz, pd90, ang90) sigma0 = pg.Sypuls(spin_system, sigma1, H, obs_iso, offhz, pd180, ang180) sigma1 = pg.Sxpuls(spin_system, sigma0, H, obs_iso, offhz, pd90, ang90) Udelay = pg.prop(H, tauR) sigma0 = pg.evolve(sigma1,Udelay) sigma1 = pg.Sxpuls(spin_system, sigma0, H, obs_iso, offhz, pd90, -ang90) sigma0 = pg.Sypuls(spin_system, sigma1, H, obs_iso, offhz, pd180, -ang180) sigma1 = pg.Sxpuls(spin_system, sigma0, H, obs_iso, offhz, pd90, -ang90) Udelay = pg.prop(H, tauR/2.0) sigma0 = pg.evolve(sigma1,Udelay) sigma1 = sigma0 if (k % 4) == 2: Udelay = pg.prop(H, tauR/2.0) sigma0 = pg.evolve(sigma1,Udelay) sigma1 = pg.Sxpuls(spin_system, sigma0, H, obs_iso, offhz, pd90, -ang90) sigma0 = pg.Sypuls(spin_system, sigma1, H, obs_iso, offhz, pd180, -ang180) sigma1 = pg.Sxpuls(spin_system, sigma0, H, obs_iso, offhz, pd90, -ang90) Udelay = pg.prop(H, tauR) sigma0 = pg.evolve(sigma1,Udelay) sigma1 = pg.Sxpuls(spin_system, sigma0, H, obs_iso, offhz, pd90, -ang90) sigma0 = pg.Sypuls(spin_system, sigma1, H, obs_iso, offhz, pd180, -ang180) sigma1 = pg.Sxpuls(spin_system, sigma0, H, obs_iso, offhz, pd90, -ang90) Udelay = pg.prop(H, tauR) sigma0 = pg.evolve(sigma1,Udelay) sigma1 = pg.Sxpuls(spin_system, sigma0, H, obs_iso, offhz, pd90, ang90) sigma0 = pg.Sypuls(spin_system, sigma1, H, obs_iso, offhz, pd180, ang180) sigma1 = pg.Sxpuls(spin_system, sigma0, H, obs_iso, offhz, pd90, ang90) Udelay = pg.prop(H, tauR) sigma0 = pg.evolve(sigma1,Udelay) sigma1 = pg.Sxpuls(spin_system, sigma0, H, obs_iso, offhz, pd90, ang90) sigma0 = pg.Sypuls(spin_system, sigma1, H, obs_iso, offhz, pd180, ang180) sigma1 = pg.Sxpuls(spin_system, sigma0, H, obs_iso, offhz, pd90, ang90) Udelay = pg.prop(H, tauR/2.0) sigma0 = pg.evolve(sigma1,Udelay) sigma1 = sigma0 40 if (k % 4) == 3: Udelay = pg.prop(H, tauR/2.0) sigma0 = pg.evolve(sigma1,Udelay) sigma1 = pg.Sxpuls(spin_system, sigma0, H, obs_iso, offhz, pd90, ang90) sigma0 = pg.Sypuls(spin_system, sigma1, H, obs_iso, offhz, pd180, ang180) sigma1 = pg.Sxpuls(spin_system, sigma0, H, obs_iso, offhz, pd90, ang90) Udelay = pg.prop(H, tauR) sigma0 = pg.evolve(sigma1,Udelay) sigma1 = pg.Sxpuls(spin_system, sigma0, H, obs_iso, offhz, pd90, -ang90) sigma0 = pg.Sypuls(spin_system, sigma1, H, obs_iso, offhz, pd180, -ang180) sigma1 = pg.Sxpuls(spin_system, sigma0, H, obs_iso, offhz, pd90, -ang90) Udelay = pg.prop(H, tauR) sigma0 = pg.evolve(sigma1,Udelay) sigma1 = pg.Sxpuls(spin_system, sigma0, H, obs_iso, offhz, pd90, -ang90) sigma0 = pg.Sypuls(spin_system, sigma1, H, obs_iso, offhz, pd180, -ang180) sigma1 = pg.Sxpuls(spin_system, sigma0, H, obs_iso, offhz, pd90, -ang90) Udelay = pg.prop(H, tauR) sigma0 = pg.evolve(sigma1,Udelay) sigma1 = pg.Sxpuls(spin_system, sigma0, H, obs_iso, offhz, pd90, ang90) sigma0 = pg.Sypuls(spin_system, sigma1, H, obs_iso, offhz, pd180, ang180) sigma1 = pg.Sxpuls(spin_system, sigma0, H, obs_iso, offhz, pd90, ang90) Udelay = pg.prop(H, tauR/2.0) sigma0 = pg.evolve(sigma1,Udelay) sigma1 = sigma0 # propagate to second 180 pulse Udelay = pg.prop(H, te2*0.5) sigma0 = pg.evolve(sigma1, Udelay) # apply second 180 pulse and propagate to data acquisition sigma1 = pg.Iypuls(spin_system, sigma0, obs_iso, 180.0) Udelay = pg.prop(H, te2*0.5) sigma0 = pg.evolve(sigma1, Udelay) # instantiate and save the transition table of simulation results # note. this step copies the TTable1D result from the ACQ into # a TTable1D object in the sim_desc object. Thus, when # we return from this function and the ACQ variable gets # garbage collected, our copy of the results in not affected sim_desc.mx = pg.TTable1D(ACQ.table(sigma0)) The pulse sequence makes use of the “spin_system” attribute. The first seven lines of code (ignoring comments) are good examples of how to access the sim_desc object attributes for all three loop parameters and some user-defined static parameters. Note that the object attribute name for user-defined parameters is ‘user_static_parameters’ and that they are ordered into a list in the order they are arranged in the GUI. Thus, the alpha/2 pulse duration is set by the line: ‘pd90 = float(sim_desc.user_static_parameters[2])’ since this variable was the third one listed in the GUI. Similarly to the examples above a transition table variable called “mx” is set up in the last line of code. Also of note in this example is the fact that typical Python control structures can be used in these sequence_code strings, for loops, if statements, etc. However, extreme care should be taken to have consistent spacing and (lack of) tabs in the code that is pasted into the new pulse sequence dialog tab. 41 A.5 Creating a Pulse Sequence with an RF Pulse Waveform A.5.1 A “PRESS” sequence that uses a ‘real’ RF pulse read in from a file A typical application might be to use one or more user defined pulses in a pulse sequence. Though various ways of accessing pulses in the VeSPA database for use in pulse sequences is described elsewhere a simple method that PyGAMMA provides is to read the complex values for a given pulse from file. The following code, closely resembling the above PRESS sequence code but using real pulses for the 180 pulses, illustrates how to accomplish this. In particular a user_static_parameter is used to specify the name and path of the file containing the pulse values. Note. That while this example is still valid, we strongly recommend that users include RF waveforms into their sequences using the RFPulse application and Simulation-Pulse Sequence Designer mechanism. This provides significantly more provenance about the creation and content of any included waveforms. See section A.5.2 for an example. import pygamma as pg def run(sim_desc): #---------------------------------------------------------------# This is an example PyGAMMA pulse sequence # for use in Vespa-Simulation # # A timing diagram for this pulse sequence can be # found in the Appendix of the Simulation User Manual. #---------------------------------------------------------------spin_system = sim_desc.spin_system # # # # the isotope string used to sort/select the metabolites of interest is passed in the sim_desc object so the user can tailor other object within their code to be nuclei specific, such as the observe operator or pulses obs_iso = sim_desc.observe_isotope # # # # extract the dynamically changing variable from loop 1 and 2 for 'te1' and 'te2', divide by 1000.0 because the GUI states that values are entered in [ms], but PyGAMMA wants [sec] # # evolution after 90 before first 180 in msec and # divide by 1000 so PyGAMMA TE is in msec te1 = float(sim_desc.dims[1]) /1000.0 te2 = float(sim_desc.dims[2]) /1000.0 # extract user static parameter values from the control dictionary. They # are inserted into a list in the order that they are shown in the GUI. pulsestep pulse180file # # # # = float(sim_desc.user_static_parameters[0]) = str( sim_desc.user_static_parameters[1]) set up a container and read pulse values into it. You could also read a file using Python code and subsequently inset values into the PyGAMMA row_vector container. Then create a “time axis” array with a time value for each point in the pulse vector pulse = pg.row_vector.read_pulse(pulse180file, 42 pg.row_vector.ASCII_MT_DEG) ptime = pg.row_vector(pulse.size()) total = pulse.size() * pulsestep for j in range(pulse.size()): ptime.put(pg.complex(pulsestep, 0), j) # create the pulse waveform and composite pulse objects from the # file and pulse sequence information pwf = pg.PulWaveform(pulse, ptime, "TestPulse") pulc = pg.PulComposite(pwf, spin_system, obs_iso) # note that below we have to now account for the time of # the pulse in our propagation intervals in order to have # our TE calculate correctly. H = pg.Hcs(spin_system) + pg.HJ(spin_system) D = pg.Fm(spin_system) Udelay1 = pg.prop(H, 0.5*(te1-total)) Udelay2 = pg.prop(H, 0.5*(te1-total + te2-total)) Udelay3 = pg.prop(H, 0.5*(te2–total)) ac = pg.acquire1D(pg.gen_op(D), H, 0.001) ACQ = ac sigma0 = pg.sigma_eq(sys) sigma1 = sigma0 = Ureal180 sigma1 = sigma0 = sigma1 = sigma0 = pg.Iypuls(sys, sigma0, 90.0) pg.evolve(sigma1, Udelay1) = pulc.GetUsum(-1) Ureal180.evolve(sigma0) pg.evolve(sigma1, Udelay2) Ureal180.evolve(sigma0) pg.evolve(sigma1, Udelay3) # instantiate and save the transition table of simulation results # note. this step copies the TTable1D result from the ACQ into # a TTable1D object in the sim_desc object. Thus, when # we return from this function and the ACQ variable gets # garbage collected, our copy of the results in not affected sim_desc.mx = pg.TTable1D(ACQ.table(sigma0)) A.5.2 A “PRESS” sequence that uses a ‘real’ RF pulse from RFPulse As of Vespa release 0.3.0, users can include a list of RFPulse waveforms to be sent to each simulation. These pulses are selected during the design of the pulse sequences (see section 5.3) and remain fixed throughout the entire Experiment calculation. The following code, closely resembling the above PRESS sequence code but using real pulses for the 180 pulses, which are sent into the simulation as part of the sim_desc parameter: import pygamma as pg import numpy as np import math def run(sim_desc): #---------------------------------------------------------------# This is an example PyGAMMA pulse sequence # for use in Vespa-Simulation 43 # # A timing diagram for this pulse sequence can be # found in the Appendix of the Simulation User Manual. #---------------------------------------------------------------spin_system = sim_desc.spin_system # # # # # # # extract the dynamically changing variable from loop 1 and 2 for 'te1' and 'te2', divide by 1000.0 because the GUI states that values are entered in [ms], but PyGAMMA wants [sec] evolution after 90 before first 180 in msec and divide by 1000 so PyGAMMA TE is in msec te1 = float(sim_desc.dims[1])/1000.0 te2 = float(sim_desc.dims[2])/1000.0 # # # # # # # # # extract static RF pulses from the control dictionary. They are inserted into a list in the order that they are shown in GUI. The pulse name, dwell_time and waveform are all part of each MinimalPulse object in the list. Dwell_time is in micro-seconds, so it needs to be converted to sec. Waveforms are the complex time array that would be played out on MR scanner. These values are complex numbers in mT, so taking the magnitude/phase of each waveform, we can convert these values into the Hz and phase in degrees that a PulWaveform in PyGAMMA requires. pulsestep = float(sim_desc.pulses[0].dwell_time) * 1e-6 waveform = sim_desc.pulses[0].waveform waveform = np.array(waveform) # PulWaveform expects Hz amplitude and angle in degrees, while # Simulation gives us mT amplitude and angle in radians. # We need to use the appropriate gyromagnetic ratio to do the # conversion. This depends on our observe_isotope, since the pulse # is not isotope specific, but the spins we expect it to affect, # is. # (e.g. we use 42576.0 for 1H to covert mT and RAD2DEG for phase) obs_iso = sim_desc.observe_isotope if obs_iso == '1H': gyratio = 42576.0 elif obs_iso == '13C': gyratio = 67262.0 elif obs_iso == '19F': gyratio = 251662.0 elif obs_iso == '23Na': gyratio = 70761.0 elif obs_iso == '31P': gyratio = 108291.0 ampl_arr phas_arr # # # # = np.abs(waveform) * gyratio = np.angle(waveform) * 180.0 / math.pi set up a container and read pulse values into it. You could also read a file using Python code and subsequently inset values into the PyGAMMA row_vector container. Then create a time axis array with a time value for each point in the pulse vector 44 pulse = pg.row_vector(len(waveform)) ptime = pg.row_vector(len(waveform)) for j,val in enumerate(zip(ampl_arr,phas_arr)): pulse.put(pg.complex(val[0],val[1]), j) ptime.put(pg.complex(pulsestep,0), j) total = pulse.size() * pulsestep # create the pulse waveform and composite pulse objects from the # file and pulse sequence information pwf = pg.PulWaveform(pulse, ptime, "adiabatic180") pulc = pg.PulComposite(pwf, spin_system, obs_iso) # note that below we have to now account for the time of # the pulse in our propagation intervals in order to have # our TE calculate correctly. H = pg.Hcs(spin_system) + pg.HJ(spin_system) D = pg.Fm(spin_system, obs_iso) Udelay1 = pg.prop(H, 0.5*(te1-total)) Udelay2 = pg.prop(H, 0.5*(te1-total + te2-total)) Udelay3 = pg.prop(H, 0.5*(te2-total)) ac = pg.acquire1D(pg.gen_op(D), H, 0.001) ACQ = ac sigma0 = sigma1 = sigma0 = Ureal180 sigma1 = sigma0 = sigma1 = sigma0 = # # # # # pg.sigma_eq(spin_system) pg.Iypuls(spin_system, sigma0, 90.0) pg.evolve(sigma1, Udelay1) = pulc.GetUsum(-1) Ureal180.evolve(sigma0) pg.evolve(sigma1, Udelay2) Ureal180.evolve(sigma0) pg.evolve(sigma1, Udelay3) instantiate and save the transition table of simulation results note. this step copies the TTable1D result from the ACQ into a TTable1D object in the sim_desc object. Thus, when we return from this function and the ACQ variable gets garbage collected, our copy of the results in not affected sim_desc.mx = pg.TTable1D(ACQ.table(sigma0)) 45 Appendix B. Pulse Sequence Diagrams This section provides some basic information about the standard simulated pulse sequences that are provided as part of the Vespa distribution. The full PyGAMMA code for each pulse sequence can be accessed through the Pulse Sequence Management Dialog widget using the View or Edit functions. B.1 One-Pulse B.1.1 Sequence Diagram B.1.2 Loop Variable 1,2,3 Descriptions Loop1 – not used Loop2 – not used Loop3 – not used B.1.3 User Defined Parameters Static Parameters None Static Pulses from RFPulse Database None B.1.4 General Description This is a simulation of a pulse and observe, or one-pulse, pulse sequence. The typical 90y degree hard pulse is modeled by an ideal GAMMA pulse. Despite the slight spacing in the sequence diagram, there is no evolution period after the excitation pulse prior to transition table acquisition. 46 B.2 Spin-Echo B.2.1 Sequence Diagram B.2.2 Loop Variable 1,2,3 Descriptions Loop1 – Describes the number of TE values to loop over in [ms]. Loop2 – not used Loop3 – not used B.2.3 User Defined Parameters Static Parameters None Static Pulses from RFPulse Database None B.2.4 General Description This is a simulation of a spin-echo sequence using ideal GAMMA pulses for the 90y and 180y localization pulses. 47 B.3 PRESS Ideal B.3.1 Sequence Diagram B.3.2 Loop Variable 1,2,3 Descriptions Loop1 – Describes the number of TE1 values to loop over in [ms]. Loop2 – Describes the number of TE2 values to loop over in [ms]. Loop3 – not used Notes – Pulse sequence TE = TE1+TE2. B.3.3 User Defined Parameters Static Parameters None Static Pulses from RFPulse Database None B.3.4 General Description This is a simulation of a Point Resolved Spectroscopy (PRESS). The typical 90-180-180 localization pulses of the PRESS sequence are modeled by ideal GAMMA pulses. The TE1 period is controlled by the settings of loop variable 1, the TE2 period is controlled by the settings of loop variable 2; thus either a symmetric or asymmetric PRESS experiment can be simulated. 48 B.4 STEAM Ideal B.4.1 Sequence Diagram B.4.2 Loop Variable 1,2,3 Descriptions Loop1 – Describes the number of TE values to loop over in [ms]. Loop2 – Describes the number of TM values to loop over in [ms]. Loop3 – not used B.4.3 User Defined Parameters Static Parameters None Static Pulses from RFPulse Database None B.4.4 General Description This is a simulation of a STimulated Excitation Acquisition Mode (STEAM) pulse sequence. The typical 90-90-90 pulses of the STEAM sequence are modeled by ideal GAMMA pulses. The total TE period is controlled by the settings of loop variable 1, the TM (mixing time) period is controlled by the settings of loop variable 2. 49 B.5 JPRESS Ideal B.5.1 Sequence Diagram B.5.2 Loop Variable 1,2,3 Descriptions Loop1 – Describes the number of TE1 values to loop over in [ms]. Loop2 – not used Loop3 – not used B.5.3 User Defined Parameters Static Parameters None Static Pulses from RFPulse Database None B.5.4 General Description This is a simulation of a J-PRESS pulse sequence. The typical 90-180-90-180 pulses of the JPRESS sequence are modeled by ideal GAMMA pulses. The total TE period is controlled by the settings of loop variable 1. 50 B.6 PRESS with RFPulse Pulses B.6.1 Sequence Diagram B.6.2 Loop Variable 1,2,3 Descriptions Loop1 – Describes the number of TE1 values to loop over in [ms]. Loop2 – Describes the number of TE2 values to loop over in [ms]. Loop3 – not used Notes – Pulse sequence TE = TE1+TE2. B.6.3 User Defined Parameters Static Parameters None Static Pulses from RFPulse Database 1. Adiabatic 180 for Simulation real pulse test B.6.4 General Description This is a simulation of a Point Resolved Spectroscopy (PRESS). The typical 90-180-180 localization pulses of the PRESS sequence are modeled by ideal GAMMA pulses and real RF waveforms using GAMMA PulWaveform and PulComposite objects. The 90 excite pulse is ideal, the subsequent 180 refocus pulses are the same “real” pulse waveforms. Note that in this PRESS sequence, the TE1 and TE2 periods must be long enough to contain the duration of the “real” pulse waveforms or the periods between the pulses could result in negative timings. The TE1 period is controlled by the settings of loop variable 1, the TE2 period is controlled by the settings of loop variable 2; thus either a symmetric or asymmetric PRESS experiment can be simulated. 51 There are important changes in this version of Simulation and the example code provided. The sim_desc object passed into the sequence code contains two new attributes, one called 'observe_isotope' and the other called 'pulses'. The 'observe_isotope' is a string indicating the nuclei used to populate the metabolite list widget. For example, if the user selected '1H' metabolites, then the string '1H' is passed into the sequence code. This value can be used to tailor the other PyGAMMA objects in the code to the metabolites of interest. For example, the observation operator "D" in line 78 of this code can be set to whatever nuclei we want because it uses the sim_desc.observe_isotope value to set itself up. The "pulses" attribute is a list of "real" RF pulses that were copied from RFPulse projects in the Vespa databse. Each item in the list is an instance of the MinimalistPulse class. That class contains attributes: ‘name’ the pulse name (just for your information), ‘dwell_time’ the dwell time as a single float in microseconds (all waveforms are assumed to have evenly spaced time axis points) ‘waveform’ the waveform as a list of complex floats in micro-Tesla. As shown in the sequence code, this waveform can be converted for the field strength and gyromagnetic ratio required and turned into a PyGAMMA PulWaveform and from there inserted into a PulComposite that can be used in the pulse sequence. The formal definition of the MinimalistPulse class is in vespa/public/minimalist_pulse.py which you can view online here: http://scion.duhs.duke.edu/vespa/project/browser/trunk/public/minimalist_pulse.py 52 Appendix C. Mixed Metabolite Output This section describes the implementation and usage of the Mixed Metabolite Output dialog. This dialog is used to convert Simulation results into various third party readable file formats. At the moment, there are five supported formats: 1) The GAVA format, so-called because it was part of the original GAVA program. It is used extensively in the SITools/FITT program as metabolite prior information files. 2) LCModel RAW import file format. 3) jMRUI Data Text file format. 4) MIDAS Generic XML format 5) Vespa-Analysis Prior format The same dialog is used to output all formats; an example is shown below: Please note the following requirements to access this widget: • You must have loaded at least one Experiment. • The active Experiment tab (if more than one Experiment is loaded) is the one for which the third party files will be output. 53 • If the output format requires that only one set of metabolite results is output (eg. LCModel and jMRUI) then the loop indices currently selected in the Visualize tab are used. • The Experiment→ThirdPartyExport… menu on the main application launches the dialog. C.1 General Functionality The Mixed Metabolite Output dialog acts on the Experiment that is active when the dialog is launched. The GUI reformats itself depending on the Format pull down list. GAVA format saves all Experiment results (ie. every simulation for each set of loop values). LCModel, jMRUI, MIDAS and Analysis Prior formats save all metabolites for only one set of loop values from the selected Experiment. The indices selected in the active Experiment in the Visualize tab when the dialog is launched are the ones used. This is indicated in the “Output Loop Values” comment at the top of the dialog. The Output Location into which results are saved can be selected using the Browse… button. This selection is used slightly differently in each format. The differences will be discussed specifically for each format in the sections below. A comment can be added in the dialog that is included in all text output. The dialog defaults to listing all metabolites in the Experiment, but these can be removed or put back in with the Add Metabolite and Remove Selected buttons. The Add Metabolite Mixture …button will pop up another small dialog in which you can design a “mixture” of two or more metabolite results with different scaling factors. This will be described in detail later. The Cancel button quits the dialog without performing any output. The OK button outputs the described collection of metabolite results and mixtures to the indicated format and Output Location. For all formats, the dialog creates a header comment block that is prepended to all text files being output. This header describes the Experiment and results/mixtures being output, and lists the modifying parameters for metabolites and formulae for any mixtures. The Metabolite and Mixed Metabolite Output List is a dynamic list that changes length as entries are added or deleted. Each row in this list is a result that will be saved upon output. The widgets in each row affect the way the results are output as defined below: • Checkbox – is used to select rows to delete from the output list, but otherwise does not affect whether a given metabolite/mixture is output or not. All rows present when you hit OK are used to create the output. • Metabolite List – drop list, is used to select which metabolite to output. The other widget settings in this row modify the results for the selected metabolite/mixture. It is possible to have two or more of the same metabolite selected for output. The only requirement is that they have unique strings in the Unique Abbreviation field. • Unique Abbreviation – text field, a unique string used to identify this output row. In LCModel and jMRUI Data Text, this is the metabolite output filename. In GAVA Text, this is the first column metabolite name string. • Scale – floatspin field, should contain a float value and should be positive. The area values for all lines in an Experiment Simulation result are multiplied by this scale value before being output. • Shift – floatspin field, should contain a floating point PPM value and can be positive or negative. This shift value is added to all ppm values for all lines in an Experiment Simulation result before being output. 54 • Range Start and Range End – floatspin fields, should contain floating point ppm values. These values default to the min/max ppm values displayed for the active Experiment. They can be set narrower to filter the results that are output. Only the Experiment Simulation lines that lie between the start and end ppm range will be included in the output files. Each row can have a different range. Again, all these settings are saved in the header comment block on output. Add Metabolite Mixture … Button This button allows users to add a “mixture” result to the Output list. Each mixture can consist of two or more metabolites, each with a different mixture scaling factor (as opposed to the Scale field on the main dialog). The Mixed Metabolite Designer widget is shown below. The user has to specify a Unique Name string that is different from all other strings in the Abbreviation column in the main dialog. The user can click on the Add Metabolite and Remove Selected (with a check box selected) buttons to change the number of metabolites in the mix. The drop list widget in each row of the dynamic list is used to select a metabolite from existing metabolite results. A mixture can contain metabolites that are not being saved in the main dialog. For example, as shown below, an Experiment might have GABA and lactate in its results list drop down widget. But the user could remove both GABA and lactate from the list in the main widget, and create a mixture called “gaba+lac” with a 1:5 ratio. This would show up in the main dialog as shown in the second figure below. Note. A more realistic mixture might be to mix NAA to NAAG in a 1:0.05 mixture. Mixture Creation Caveats: The Metabolite drop list is populated only with the concatenation of all full metabolite names (in this case “gaba+lactate”) as a reminder of what the mixture contains. When metabolite names get long, sometimes these can not be fully seen in this widget. Widening the dialog can make these more visible. The scales set in the mixture design dialog and main mixed output dialog are cumulative. E.g. if you create a mixture of NAA+NAAG at 1:0.05 in the designer, and then set the Scale value in the main dialog to 3.0, then the actual multiplier for NAA line areas will be 3.0 and NAAG line areas will be 0.15. 55 C.2 GAVA Text Format Specific Information The first figure in this section shows the Mixed Metabolite Output dialog configured for the GAVA Text format output. The main difference in this configuration is that there are no Format Specific Parameters in the middle the dialog (as for LCModel and jMRUI). Otherwise, the top and bottom widgets perform similarly to the general descriptions in section C.1. C.2.1 Using the Dialog Since GAVA Text format is a simple “flattened” text output of the Experiment results, there is no user-set header data that is required to be filled into widgets. The results are output into a single file. The Output Location can be set using the Browse… button. The user is prompted to select a directory and a filename. As stated in the section at the top, results for selected metabolites in for all loop values in the currently selected tab will be saved. C.2.2 Example GAVA Text Output File Following in the steps of the example shown above with two metabolites and one mixture, here is a short example of the data output to the simulation_mixed_output.txt file ;Vespa-Simulation Mixed Metabolite Output ; ;Output Path/Filename = C:\bsoher\temp\simulation_mixed_output.txt ;Output Loop Values = All loops will be saved for this format ;Output Comment ;--------------------------------------------------------------------------; ; ;Experiment Information 56 ;--------------------------------------------------------------------------;--- Experiment 91291fb0-95d0-4e62-b95e-028d96d5e853 --;Name: Example SpinEcho multi-TE ;Public: True ;Created: 2010-10-11T11:22:17 ;Comment (abbr.): example of a spin-echo experiment at 3T ;PI: bjs ;b0: 128.000000 ;Peak Search PPM low/high: 0.000000 / 10.000000 ;Blend tol. PPM/phase: 0.001500 / 50.000000 ;Pulse seq.: 2e9c8f33-06d4-4934-ae2b-199b605fe98a (Spin-Echo) ;0 User static parameters: ;7 Metabolites: choline-truncated, creatine, gaba, glutamate, lactate, myo-inositol, n-acetylaspartate ;98 Simulations: (not shown) ; ;Metabolite Formatting Information ;--------------------------------------------------------------------------- ;Name=choline-truncated Abbr=choline-truncated Scale=1.0 Shift=0.0 PPM Start=-3.10487060547 PPM End=12.5125 ;Name=creatine Abbr=creatine Scale=1.0 Shift=0.0 PPM Start=-3.10487060547 PPM End=12.5125 ;Name=gaba+lactate Abbr=gaba+lac Scale=1.0 Shift=0.0 PPM Start=-3.10487060547 PPM End=12.5125 ; Mixture of [metab*scale] = gaba*1.0 + lactate*5.0 ; ;Simulation Spectral Results ;--------------------------------------------------------------------------choline-truncated 10.0 0.0 0.0 0 3.185 3.0 -9.93923337957e-16 creatine 10.0 0.0 0.0 0 3.027 3.0 -7.95138670366e-16 creatine 10.0 0.0 0.0 1 3.913 2.0 -4.96961668979e-17 creatine 10.0 0.0 0.0 2 6.649 1.0 9.93923337957e-17 gaba+lac 10.0 0.0 0.0 0 1.64314237348 6.82464923377e-05 46.1587697321 gaba+lac 10.0 0.0 0.0 1 1.76022959161 0.0599190291344 47.6446766073 … In the GAVA Text format, lines starting with a semicolon are ignored as comments. Thus the prepended header comment block starts all lines with “;”. The actual data starts on the final 6 lines shown, with a tab-delineated layout. Each row of data in the file contains the name of the metabolite, the loop1 value, the loop2 value, the loop3 value, the transition table line number for the metabolite, the ppm value, area value and phase value for each spectral line in the metabolite Simulation result. For choline and creatine, these are only 1 and 3 lines respectively. But, for other multiplet resonance metabolite results, such as the gaba+lac mixture, this can run to 10s to 100s of lines of data. And if the Experiment had more that one loop in it, the first set of results is written out for all metabolites, then the next loop value for all metabolites, and so on. In the example above with two metabolites and one mixture output for a spin-echo pulse sequence Experiment with 10 TE settings, there were 2838 lines of results in the final file. 57 C.3 LCModel Format Specific Information The following figure shows the Mixed Metabolite Output dialog configured for LCModel format output. The main difference in this configuration is the Format Specific Parameters panel half way down the dialog. Otherwise, the top and bottom widgets perform similarly to the general descriptions above. C.3.1 Using the Dialog LCModel results are saved in a format compatible for import into the LCModel software package. This format creates a single text file for each metabolite that contains a comment section followed by a LCModel specific header section, which is followed by a textual representation of a complex array containing a FID of the metabolite of interest created for specific sweep width, points and lineshape parameters. The Output Location can be set using the Browse… button. The user is prompted to select a directory. LCModel RAW files are output to the directory selected. The Output Location is set to show that directory plus a filename (e.g. C:\data\temp\lcmodel_output_summary.txt). After the LCModel RAW files are created, a final text file called ‘lcmodel _output_summary.txt’ is created in the directory that lists the details about what data was exported from Vespa-Simulation, the details about how any mixtures were created, and any other parameters used to modify the simulation results. 58 The Header Parameter section is used to control LCModel specific header parameters that the program uses on import. These parameters are: FMTDAT, TRAMP and VOLUME fields. For more information on these settings, see the LCModel user manual. The FID Creation section contains parameters that are used to create the FID representation of the metabolite result. These include Sweep Width in Hz, number of Data Points, the Apodize value in Hz and the Lineshape type (either Gaussian or Lorentzian). A reference line singlet at 0.0 PPM can be added to the spectrum, as required by LCModel for import, by checking the box. Upon hitting the OK button the dialog will create individual output files for each metabolite. These files are names according to the Abbreviation field in each row in the dynamic list (e.g. <abbreviation>.RAW). The files are saved in the same directory chosen by the user at the top of the dialog. A copy of the Mixed Metabolite Output header comment block is stored in the filename specified at the top of the dialog. A separate copy of the header comment is saved in each RAW file prior to the LCModel specific header parameters. C.3.2 Example – Creating an LCModel Basis Set (by Hongji Chen) Open the Vespa-Simulation program and, if an Experiment is not already loaded, load an Experiment. Click on the Experiment tab that you want to output. Select the loop values in the Visualize Tab for the specific metabolite results that you want to output. Select Simulation→ThirdPartyExport menu item. The Mixed Metabolite Output widget pops up. Make sure that the Format widget is set to LCmodel. Select a directory and output filename for files. Add a comment if you want. Change the DataPoints value to 2048 and make sure the Add Singlet at 0 ppm is selected. Add/Remove the metabolites or mixes you want to output and click OK. Your results are written to the designated folder. There are two sets of files in the folder - One is the data in frequency domain (with ‘_freq’) and the other one in time domain. To make basis sets by LCModel, only the time domain files are needed. How to make basis set by LCModel is described in section 8.6 in the following manual. http://s-provencher.com/pub/LCModel/manual/manual.pdf The only thing you need to do is to create your own ‘makebasis.in’. An example is listed below. All the control parameters in this example are specified in the LCModel manual. The one critical pitfall: the first column of each line is always ignored; so each line must start with one space. $seqpar seq='PRESS' echot=40. fwhmba=.013 $end $nmall hzpppm=123.25 deltat=.0005 nunfil=2048 filbas='/na/homes/username/.lcmodel/test_gava/output/test_gava.basis' filps='/na/homes/username/.lcmodel/test_gava/output/basis.ps' autosc=.false. autoph=.false. consistent_scaling=.false. idbasi='test basis set (gava)' 59 $end $nmeach filraw='/na/homes/username/.lcmodel/test_gava/raw/naa.RAW' metabo='NAA' degzer=0. degppm=0. conc=1. ppmapp=0.2, -.2 ppmpk=0. ppmoff=-1.2, -1.4 fwhmsm=0.015 $end $nmeach filraw='/na/homes/username/.lcmodel/test_gava/raw/cr.RAW' metabo='Cr' degzer=0. degppm=0. conc=1. ppmapp=0.2, -.2 ppmpk=0. ppmoff=-1.2, -1.4 fwhmsm=0.015 $end $nmeach ... $end When your own ‘makebasis.in’ is ready, you run MakeBasis with a command like $HOME/.lcmodel/bin/makebasis < makebasis.in The basis set generated will be saved in the ‘filbas’ folder specified in the ‘makebasis.in’ file. 60 C.4 jMRUI Data Text Format Specific Information The following figure shows the Mixed Metabolite Output dialog configured for jMRU Data Text format output. The main differences in this configuration are the Format Specific Parameters panel half way down the dialog. Otherwise, the top and bottom widgets perform similarly to the general descriptions in section C.1. C.4.1 Using the Dialog jMRUI results are saved in a text format compatible for import into the jMRUI software package. This format creates a single text file for each metabolite that contains a jMRUI specific header section followed by a textual representation of a complex array containing a FID of the metabolite of interest created for specific sweep width, points and lineshape parameters. The Output Location can be set using the Browse… button. The user is prompted to select a directory. jMRUI Data Text files are output to the directory selected. The Output Location is set to show that directory plus a filename (e.g. C:\data\temp\jmrui-text_output_summary.txt). After the jMRUI Data Text files are created, a final text file called ‘jmrui-text_output_summary.txt’ is created in the directory that lists the details about what data was exported from Vespa- 61 Simulation, the details about how any mixtures were created, and any other parameters used to modify the simulation results. There are a number of text parameters that are set in each file to describe the data. These values are extracted automatically from the Experiment data or from the FID Creation section values in the Mixed Metabolite Output dialog. For more information on jMURI settings, see the jMRUI user manual. The FID Creation section contains parameters that are used to create the FID representation of the metabolite result. These include Sweep Width in Hz, number of Data Points, the Apodize value in Hz and the Lineshape type (either Gaussian or Lorentzian). Upon hitting the OK button the dialog will create individual output files for each metabolite. These files are names according to the Abbreviation field in each row in the dynamic list (e.g. <abbreviation>.RAW). The files are saved in the same directory chosen by the user at the top of the dialog. A copy of the Mixed Metabolite Output header comment block is stored in the filename specified at the top of the dialog. 62 C.5 MIDAS Generic XML Format Specific Information The following figure shows the Mixed Metabolite Output dialog configured MIDAS Generic XML format output. The main difference in this configuration is that there are no Format Specific Parameters in the middle the dialog (as for LCModel and jMRUI). Otherwise, the top and bottom widgets perform similarly to the general descriptions in section C.1. C.5.1 Using the Dialog MIDAS Generic XML format is a simple “flattened” text output of the Experiment results using a variant on an XML format that is specific to the MIDAS program. There is no user-set header data that is required to be filled into widgets. Results are output into a single file. The Output Location can be set using the Browse… button. The user is prompted to select a directory and a filename. As stated in the section at the top, results for selected metabolites in a single set of loop values in the currently selected tab will be saved. This XML file contains two nodes, 1) VESPA_SIMULATION_MIDAS_EXPORT - has the description of how the metabolites and metabolite mixtures were organized for output from the Experiment. 2) FITT_Generic_XML - contains the Experiment results in a line-by-line output style. In both nodes, there are multiple "comment" or "param" tags, respectively, which contain "name" and "value" attributes in which data is stored. There is no data stored in the actual tag, just attributes. This type of file is typically read into the MIDAS program to provide prior metabolite information for the FITT2 application. Experiment data is stored in the FITT_Generic_XML node. Metabolite data starts in the <param> tag with “name” attribute equal to “fitt_PriorLine00001”. Each <param> tag of data in 63 the file contains a “value” attribute that contains the name of the metabolite, the loop1 value, the loop2 value, the loop3 value, the transition table line number for the metabolite, the ppm value, area value and phase value for each spectral line in the metabolite Simulation result. These are all stored in one text string separated by “++” symbols. For choline and creatine, these are only 1 and 3 lines respectively. But, for other multiplet resonance metabolite results, such as the gaba+lac mixture, this can run to 10s to 100s of lines of data. C.5.2 Example MIDAS Generic XML Output File Following in the steps of previous examples (with two metabolites and one mixture), here is a short example of the data output to the midas_output.xml file <FITT_Generic_XML Creation_date="2011-03-08" Creation_time="11:55:32"> <VESPA_SIMULATION_MIDAS_EXPORT> <comment line="line0000" value="Vespa-Simulation Mixed Metabolite Output" /> <comment line="line0001" value="" /> <comment line="line0002" value="Output Path/Filename = C:\bsoher\code\repository_svn\vespa\simulation\midas_output.xml" /> <comment line="line0003" value="Output Loop Values = All loops will be saved for this format" /> <comment line="line0004" value="Output Comment" /> <comment line="line0005" value="---------------------------------------------------------------------------" /> <comment line="line0006" value="" /> <comment line="line0007" value="" /> <comment line="line0008" value="Experiment Information" /> <comment line="line0009" value="---------------------------------------------------------------------------" /> <comment line="line0010" value="--- Experiment 92adae26-137e-48ce-8c35-02905bb5cfd5 ---" /> <comment line="line0011" value="Name: Example PRESS_Ideal multi-TE" /> <comment line="line0012" value="Public: True" /> <comment line="line0013" value="Created: 2011-01-24T11:01:16" /> <comment line="line0014" value="Comment (abbr.): Example of a PRESS experiment at 3T usin" /> <comment line="line0015" value="PI: bjs" /> <comment line="line0016" value="b0: 128.000000" /> <comment line="line0017" value="Peak Search PPM low/high: 0.000000 / 10.000000" /> <comment line="line0018" value="Blend tol. PPM/phase: 0.001500 / 50.000000" /> <comment line="line0019" value="Pulse seq.: 0b3db82e-d04b-4719-b8f9-95f1153f0d50 (PRESS Ideal)" /> <comment line="line0020" value="0 User static parameters: " /> <comment line="line0021" value="7 Metabolites: choline,creatine,gaba,glutamate,lactate,myo-inositol,n-acetylaspartate" /> <comment line="line0022" value="98 Simulations: (not shown)" /> <comment line="line0023" value="" /> <comment line="line0024" value="Metabolite Formatting Information" /> <comment line="line0025" value="---------------------------------------------------------------------------" /> <comment line="line0026" value="Name=choline Abbr=choline Scale=1.0 Shift=0.0 PPM Start=-3.10487 PPM End=12.5125" /> <comment line="line0027" value="Name=creatine Abbr=creatine Scale=1.0 Shift=0.0 PPM Start=-3.10487060547 PPM End=12.5125" /> <comment line="line0028" value="Name=gaba+lactate Abbr=gaba+lac Scale=1.0 Shift=0.0 PPM Start=-3.10487 PPM End=12.5125" /> <comment line="line0029" value=" Mixture of [metab*scale] = gaba*1.0 + lactate*1.0" /> </VESPA_SIMULATION_MIDAS_EXPORT> <PRIOR_METABOLITE_INFORMATION> <param name="fitt_PriorLine00001" value="choline-truncated++10.0++30.0++0.0++0++3.185++3.0++3.2680199352e-13" /> <param name="fitt_PriorLine00002" value="creatine++10.0++30.0++0.0++0++3.027++3.0++2.85844069302e-13" /> <param name="fitt_PriorLine00003" value="creatine++10.0++30.0++0.0++1++3.913++2.0++1.90976157368e-13" /> <param name="fitt_PriorLine00004" value="creatine++10.0++30.0++0.0++2++6.649++1.0++4.77915613015e-13" /> <param name="fitt_PriorLine00005" value="gaba+lac++10.0++30.0++0.0++0++1.30216386911++6.56750777889e-05++-138.531997369" /> <param name="fitt_PriorLine00006" value="gaba+lac++10.0++30.0++0.0++1++1.39807431416++8.34965132792e-05++94.719201079" /> ... ... <param name="fitt_PriorLine00182" value="gaba+lac++10.0++30.0++0.0++177++4.17942135846++0.117527687393++-149.811478877" /> </PRIOR_METABOLITE_INFORMATION> </FITT_Generic_XML> 64 C.6 Analysis Prior XML Format Specific Information The following figure shows the Mixed Metabolite Output dialog configured for Analysis Prior XML format output. This format allows users to output to a file the information from an Experiment that could be used in the Analysis application to create a set of bases functions to model real MRS data. This information can also be accessed using direct query of the Vespa database from the Analysis application GUI, however, we also include it here for convenience. The main difference in this configuration is that there are no Format Specific Parameters in the middle the dialog (as for LCModel and jMRUI). Otherwise, the top and bottom widgets perform similarly to the general descriptions in section C.1. C.6.1 Using the Dialog Analysis Prior XML format is a simple “flattened” text output of the Experiment results using the XML format with nodes specific to the Vespa-Analysis program. There is no user-set header data that is required to be filled into widgets. Results are output into a single file. The Output Location can be set using the Browse… button. The user is prompted to select a directory and a filename. As stated in the section at the top, results for selected metabolites in a single set of loop values in the currently selected tab will be saved. This XML file contains layout and organization typical to other “export” options in the Vespa package, because it uses common coding and naming conventions. There is a comment node at the top that contains information about the Experiment used to generate this file. Following that, there are “metabolite” nodes that list each resonance line for the result being reported for a given metabolite. 65 C.6.2 Example Analysis Prior XML Output File Due to length, this is not shown. 66 Appendix D. Object State in Applications This section describes important concepts in Vespa that have significant practical issues in how you make use of all the applications in the package. We have defined a number of terms that describe certain conditions of the prior information and results that are stored within the Vespa database. These terms include: ‘private’, ‘public’, ‘in use’ and ‘frozen’. Our definition of these terms, and their practical implementation within Vespa applications, go a long way towards providing accurate workflow provenance of how experiments or pulse projects were created. They also help to keep users from deleting or changing important information. This section will help you understand what these terms mean and how to use them effectively within Vespa. D.1 Background and Design Philosophy Our overall goal when designing Vespa has been to try to help you organize your data and workflow. Each application has a number of modules that can be combined in different ways as part of your investigations. For example, in Simulation an experiment contains one pulse sequence and one or more metabolites. There are a variety of pulse sequences and metabolites and these can be combined in many ways to create experiments. The design philosophy behind Vespa has been to enable great flexibility in each application while still providing a complete description of how each usage ended up with the results it did. This historical record your actions is called the ‘provenance’. In the database, each pulse sequence, metabolite and pulse project is stored just once, but may be referred to by many other objects. For instance, the three sample experiments installed with Vespa Simulation all refer to the metabolite creatine. A change to the definition of creatine would be a change in all of the experiments that refer to it. This would damage the provenance that Vespa wants to protect. D.2 State Definitions and Usage To avoid damaging provenance Vespa classifies items into states called ‘private’, ‘public’, ‘in use’ and ‘frozen’. These states determine which database items can be changed/deleted and which cannot. There are also very simple steps for creating editable copies of uneditable items. Definitions and advice for each state is given below. D.2.1 Private and Public Objects Affected: experiments, metabolites, pulse sequences, pulse projects All of these objects start life private. That means they're only in your database; no one else has seen them. Once exported, objects become public. That means that their definition has been shared with the world. Public objects are frozen (see below). Furthermore, the objects to which they refer (directly and indirectly) also become public (and frozen). For instance, if an experiment refers to a pulse sequence that refers to a pulse project, all three of those objects become public when the experiment is exported. Once a private object has become public, it can never become private again. Cloning, however, will create a new, private object with exactly the same properties (but a different UUID). 67 D.2.2 In Use Objects Affected: metabolites, pulse sequences, pulse projects When you select a metabolite or pulse sequence for use in an experiment, that experiment refers to the object for as long as the experiment exists in your database. Metabolites and pulse sequences that are referred to by an experiment are in use by that experiment. Objects that are in use may not be deleted and are frozen (see below). There's no limit to the number of references an object may have. Once all of the experiments referring to an object are deleted, the object is no longer in use. D.2.3 Frozen Objects Affected: experiments, metabolites, pulse sequences, pulse projects Frozen objects are mostly un-editable -- only the name and comments can be changed. Objects are frozen for one of two reasons. In use objects (metabolites, pulse sequences and pulse projects) are frozen because they're referred to by an experiment, and changing the underlying objects that the experiment uses would corrupt the experiment. Public objects are frozen because once you've shared an object with others (or you've imported an object that they've shared with you), you need to be able to trust that you're talking about exactly the same object. Here's a table summarizing when an object is frozen. Private? Yes Yes No (public) No (public) In Use? No Yes No Yes Frozen? No Yes Yes Yes Note that no objects can refer to experiments, so experiments can never be 'in use'. Note that frozen only refers to whether or not the fundamental attributes of the object can be edited. It doesn't affect whether or not it can be deleted. 68