1
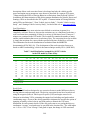
International Vehicle
Emissions Model
Attachment B
Development of the Correction Factors for
Use in the IVE Model
Notice
This section of the User’s Guide describes the assumptions, options, and limitations of
the correction factors in the IVE model. It is recommended that the user read and
understand this section of the manual before using results of the model for any purpose.
Any questions about the users guide or model may be directed to:
[email protected]. This user’s guide and model may be found online at
www.gssr.net/ive.
B-2
Table of Contents
1. Introduction..........................................................................................................1
2. Correction Factors for Local Variables.............................................................1
3. Correction Factors for Fuel Quality Variables .................................................3
4. Correction Factors for Power Variables and Driving Behavior .....................5
5. Country Adjustment Correction Factors ..........................................................8
Appendix A. Sample Input File for Correction Factor Development
Excel Worksheet: Correction Factor Data
B-3
1. Introduction
The basis of the emission prediction process of the IVE model is to apply a base emission
rate (B) with a series of correction factors (K) to estimate the amount of pollution (Q)
from a variety of vehicle types (Eq. 1). Q is the vehicle emissions in mass per unit time
or distance.
Q[t] = B[t]* K(1)[t] *K(2)[t]*…..K(x)[t]
(Eq. 1)
The correction factors can be categorized into several categories (Table 1). The
development of the local and fuel quality, and power and driving correction factors are
described in detail in the next sections. The changes in vehicle specific power associated
with velocity profile of the vehicle is described in a separate document*.
Table 1. Correction Factors Used in the IVE Model
Local Variables
Fuel Quality Variables Power & Driving
Variables
Ambient Temperature
Gasoline Overall
Vehicle Specific Power*
Ambient Humidity
Gasoline Sulfur
Road Grade
Altitude
Gasoline Lead
Air Conditioning Usage
Inspection/Maintenance Programs Gasoline Benzene
Start Distribution
Gasoline Oxygenate
Diesel Overall
Diesel Sulfur
*Described in a separate IVE Document, “Characterizing the Effect of Driving Behavior on Emissions from On-Road Vehicles”
Most correction factors are developed using data from existing models. In this process,
correction factors are developed by ratioing the emissions with the indicated parameter
modeled to the base emissions for each technology. This ratio then stored in the IVE
source code and used in Equation 1 as the user selects each option.
2. Correction Factors for Local Variables
A list of the correction factors options for each correction factor associated with Local
variables is listed in Table 2. Italicized values indicate the default setting in the model.
Table 2. Correction Factor Options for Local Variables
Inspection/Maintenance (I/M)
none
idle decentralized (passenger veh.)
idle centralized (passenger veh.)
loaded centralized (passenger veh.)
idle decentralized (passenger veh. & 2/3 wheelers)
idle centralized (passenger veh. & 2/3 wheelers)
loaded centralized (passenger veh. & 2/3 wheelers)
idle decentralized (all vehicles)
idle centralized (all vehicles)
Ambient
Temperature
(25C)
Any Integer
B-4
Relative Humidity
Altitude
(50%)
Any value between 0-100%
Low
High
loaded centralized (all vehicles)
Inspection/Maintenance(I/M)
Data from the United States programs were also used to develop approximate
adjustments to each of the inspection maintenance categories. These corrections are
approximate and could change depending upon the effectiveness and stringency of the
program among other variables. The corrections for these variables for each vehicle
technology and pollutant are listed in Appendices C-F. Where there is a correction,
pollutant, or vehicle type omitted, there is no correction applied in the IVE model for this
variable.
There are further adjustments that are made to the I/M correction factor in the I/M
subroutine. These adjustments respond to fuel adjustments. The corrections that are
impacted are those for CO, VOC, PM, 1,3 Butadiene, Acetaldehyde, Formaldehyde,
Benzene, and CH4. Once an I/M correction factor is selected, this adjustment is made to
the I/M correction factor before the value is returned from the routine. The formula for
adjusting the credits is shown in Equation 2 and Table 3.
New I/M Correction Factor = 1 - F + F*Original I/M Correction Factor
(Eq. 2)
Table 3. Calculating the Variable F in the I/M Correction Factor Equation
For oxygenates
For overall fuel
For combined oxygenates and overall fuel
quality
quality
0% - F=1.00
Moderate - F=1.00
F = Foxygenates*Foverall fuel quality
1% - F=0.90
Clean F=0.95
2% - F=0.80
For example, for 2% oxygenates and clean
2.5% - F=0.70
fuel, F = 0.76.
Ambient Temperature, Relative Humidity, and Altitude
The methodology for using MOBILE6 for use in developing correction factors for the
ambient temperature, relative humidity, and altitude is as follows: A MOBILE6.2 input
file is created for the default scenario and each selection for humidity, etc. (Appendix A).
The default for input file uses the database (.TB1) output formats with additional options
for the database output of: Aggregated Output, Daily Output, and With Fieldnames.
Other default settings required are listed in Table 4. Emissions predicted in g/mi or
grams/start are then ratioed for each of the 28 vehicle classes to produce correction
factors. The correction factors for the 28 vehicle classes are then mapped to the
appropriate IVE technology category and hard coded into the model (IVE 2003). In the
IVE model, evaporative VOC is treated as a separate pollutant and is categorized into
either running or start emission rates.
B-5
Table 4. Some Input Options Selected in modeling Correction Factors using
MOBILE6 model.
Database Emissionsby emission type classifications
Running-Exhaust Running Emissions
Start-Exhaust Engine Start Emissions (trip start)
Hot Soak-Evaporative Hot Soak Emissions (trip
end)
Diurnal-Evaporative Diurnal Emissions (heat rise)
Resting-Evaporative Resting Loss Emissions (heat
rise)
Run Loss-Evaporative Running Loss Emissions
Crankcase-Evaporative Crankcase Emissions (blowby)
Refueling-Evaporative Refueling Emissions (fuel
displacement and spillage)
Database Facilitiesby facility type
Arterial-Arterial and Collector Roadways
None- For start and some evaporative emissions
3. Correction Factors for Fuel Quality Variables
A list of the options for each correction factor associated with Local variables is listed in
Table 5. Italicized values indicate the default setting in the model. The corrections for
each of these Fuel Quality variables for each vehicle technology are presented in
Appendices G –M.
Table 5. Correction Factor Options for Fuel Quality Variables
Gasoline
Gasoline Gasoline
Overall
Lead
Sulfur
moderate/premixed 2None
Moderate
stroke
(300 ppm)
clean/premixed 2-stroke
Low
Low (50
ppm)
High
super low
moderate/non-premixed
2-stroke
(15 ppm)
Clean/non-premixed 2- MMT
High
stroke
(600 ppm)
Gasoline
Benzene
Moderate
(1.5%)
Low
(0.5%)
super low
(0.2%)
High
(3.0%)
Gasoline
Oxygenate
0%
Diesel
Overall
moderate
1%
Clean
2%
biodiesel
3%
water
emulsification
Diesel
Sulfur
Moderate
(500 ppm)
Low
(50 ppm)
super low
(15 ppm)
High
(5000 ppm)
Gasoline Overall
As seen in Table 5, there are four options for Gasoline Overall Fuel Quality. They are a
combination of moderate and clean gasoline, and premixed and non-premixed gasoline.
The latter option refers only to 2-stroke small engines where oil mixed with gasoline is
required for the vehicle to operate. Premixed gasoline refers to the situation where the oil
is mixed prior to purchase at the fuel pump. Non-premixed gasoline refers to when the
vehicle operator must mix his own gasoline and oil. Premixed gasoline is usually of
better quality because the amount and quality of the mix is closely regulated. The clean
gasoline correction factors will affect all gasoline vehicles except for 2-stroke small
engine vehicles. The pollutants affected by the overall gasoline variables include CO,
VOC, VOC evaporative, PM, 1-3 butadiene, benzene, acetaldehyde, formaldehyde, and
methane. It was assumed that clean fuel will reduce these emissions by 3% and premixed
fuel will reduce these emissions also by 3%. Supporting documentation for these
assumptions include the MOBILE6 model for various fuel quality mixtures and
B-6
documentation from India and Asia on the effects of premixing fuels (GIA 2002, Kojima,
2002, Kojima 2000).
Gasoline Lead
The gasoline lead content will affect lead emissions. The lead correction factor is simply
the ratio of the lead in the fuel to the default fuel. The default is 0.7 g lead per liter fuel.
The high lead is 2 g/L, therefore the correction factor for high lead is 2.86. The default
lead content is zero, and the correction factor is zero for all vehicles for the default
option. Additionally, lead in any amount in the gasoline will render catalysts ineffective.
Therefore, lead content will affect CO, VOC, 1,3 butadiene, benzene, formaldehyde,
acetaldehyde, and benzene emissions for 2-way catalytic vehicles. For 3-way catalytic
vehicles, the lead content will affect these pollutants and NOx emissions also. The
correction factor applied will render emissions equivalent to a non-catalyst vehicle in the
presence of lead. PM emissions were assumed to not be affected by lead content.
Gasoline Sulfur
The gasoline sulfur content directly impacts the amount of SOx emissions, and also
affects the formation of NH3 and N20 emisisons. The default sulfur content is 300 ppm.
The high sulfur content is 600 ppm, low is 50 ppm, and super low is 15 ppm. Therefore,
the correction factors for start and running SOx emissions are 2, 0.17, and 0.05
respectively for all gasoline fueled vehicles. Additionally, the sulfur content will affect
the performance of catalysts, therefore affecting CO, VOC, NOx, 1,3 butadiene, benzene,
formaldehyde, acetaldehyde, and benzene. Low and superlow levels of sulfur in the
gasoline reduce these emissions and high sulfur increases these emissions. The quantity
of the change was calculated by varying the sulfur content in the MOBILE6 model and
varies by technology.
Gasoline Benzene
The gasoline benzene content directly impacts the amount of benzene emissions. The
default benzene content is 1.5%. The high benzene content is 3% ppm, low is 0.5% ppm,
and super low is 0.2% ppm. Therefore, the correction factors for start and running
benzene emissions are 2, 0.33, and 0.13 respectively for all gasoline-fueled vehicles.
Gasoline Oxygenate
The gasoline oxygenate content directly impacts the amount of CO and VOC emissions.
This effect will be the greatest for carbureted engines and the least for multi-fueled
injected engines. The default oxygenate content is 0%. The other options are 1%, 2%,
and 3% oxygenate content in the fuel. Gasoline oxygenate content will also affect the
benefits associated with I/M programs (see I/M section). 1,3 Butadiene will be affected
the same as VOC emissions. All other pollutants will not be affected by changes in
oxygenate content. The CO and VOC changes associated with varying oxygenate were
developed from the MOBILE6 model as described in section 2. These corrections can be
viewed in the excel attachment.
B-7
Diesel Overall
Diesel overall fuel quality includes a clean general fuel quality options and biodiesel and
water emulsification options. The general Overall diesel fuel quality will impact
PM, VOC, CO, 1,3Butadiene, Acetaldehyde, Formaldehyde, Benzene emissions. The
diesel clean option decreases NOx emissions by 1% and all other pollutants listed by 3%.
The improvements for biodiesel option were taken from the latest EPA documentation
(EPA 2002). These assume a 50% benefit for CO, 40% improvement for VOC and
toxics, and 60% benefit for PM emissions. However, there is a 9% increase for NOx
emissions from biodiesel fuel. The effects from water emulsification have been
documented in several Asian documents (GIA 2002, Kojima, 2002, Kojima 2000). These
corrections are assumed to be a 15% reduction in NOx, 3% for CO, VOC, and toxics, and
50% for PM emissions.
Diesel Sulfur
The diesel sulfur content directly impacts the amount of SOx emissions, and will also
affect NOx emissions for diesel vehicles equipped with a NOx catalyst. The default sulfur
content (moderate) is 500 ppm. The high sulfur content is 5000 ppm, low is 50 ppm, and
super low is 15 ppm. Therefore, the correction factors for start and running SOx
emissions are 10, 0.1, and 0.03 respectively for all diesel fueled vehicles. For catalyst
equipped vehicles, the NOx correction for high sulfur fuel is 1.1, for low sulfur 0.8, and
super low sulfur is 0.7. The quantity of the NOx change was calculated by varying the
sulfur content in the MOBILE6 model and varies by technology.
4. Correction Factors for Power Variables and Driving Behavior
In addition to fuel and local variables, certain conditions affect the load on the engine and
therefore effect emissions. These include driving patterns, use of air conditioning, and
road grade. Shown in Table 6 are the power options incorporated into the model. Also
described in this section is the effect of starts on emissions, listed as soak categories. As
an engine cools, the emissions from start up will change. Both the power and start
corrections for each technology type are listed in Appendices N, O, and P.
Table 6. Correction Factor Categories for Power Variables & Driving Behavior
Vehicle Specific Power (VSP)
Soak Distribution
Driving Distribution
60 bins: 20 VSP bins from -40 to +50 10 bins: soak times
kW/ton and 3 Engine Stress Bins
from 12 hours to 5
minutes
Road Grade
-10% to
+10%
Air
Conditioning
On or Off
Vehicle Specific Power (VSP) Driving Distribution
Modeling the effect of driving behavior on emissions is treated differently than the other
correction factors. There are sixty bins allocated to different driving conditions. The
driving condition is defined by vehicle specific power and engine stress, parameters
which are developed from second by second velocity profiles of the vehicle. The fraction
of driving in each bin is either measured or assumed and is required input to the model.
Each bin has a different correction factor for each pollutant and vehicle type. The
B-8
description of how each correction factor is developed and why the vehicle specific
power and engine stress parameters were chosen is described in a separate IVE report:
“Characterizing the Effect of Driving Behavior on Emissions from On-Road Vehicles”.
In addition, the characterization of the driving pattern distribution for Nairobi, Kenya and
Santiago, Chile are described in the IVE reports “Characterization of Driving Behavior
and its Effect on Emissions”, “Pune Vehicle Activity Study”, “Nairobi Vehicle Activity
Study”, and “Santiago Vehicle Activity Study”, located on the web at www.gssr.net\ive.
Soak Distribution
The IVE model has base start emission rates defined as emissions in grams for a
completely cold start. However, because the emissions vary as a function of soak time, a
soak correction factor containing 10 bins for a variety of soak times from 12 hours to 5
minutes are contained in the IVE model. The location file contains the number of starts
and the soak distribution that occur at each time of day. The correction factor for each bin
is simply the emissions for a start with the specified soak time divided by a cold start.
The information for the soak distributions was obtained from the MOBILE6
documentation (EPA 2001 (6)). The development of the soak correction factors was
based on ARB’s methodology, which is the same technique used by EPA (ARB 2002).
Table 7. Soak Distribution Assumed for All US Vehicles
in the IVE model by Time of Day
Soak Period (minutes)
Start
End
0
4.8
Percent of Starts in Soak Bin by Tim e of Day
6:00
AM
0.12
7:00
AM
0.18
8:00
AM
0.17
9:00
AM
0.18
10:00 11:00 12:00
AM
AM
PM
0.22
0.18
0.22
1:00
PM
0.19
2:00
PM
0.18
3:00
PM
0.19
4:00
PM
0.19
5:00
PM
0.22
6:00 7:00 PM PM 5:00 AM
0.15
0.14
4.8
15
0.05
0.06
0.18
0.15
0.15
0.22
0.19
0.22
0.23
0.22
0.19
0.15
0.20
0.10
15
30
0.01
0.04
0.10
0.12
0.12
0.12
0.13
0.16
0.11
0.11
0.13
0.12
0.12
0.10
30
60
0.01
0.03
0.06
0.10
0.13
0.12
0.15
0.12
0.14
0.11
0.13
0.11
0.11
0.11
60
120
0.00
0.00
0.02
0.06
0.08
0.05
0.06
0.06
0.08
0.06
0.07
0.06
0.11
0.09
120
240
0.01
0.00
0.01
0.06
0.07
0.13
0.08
0.09
0.13
0.11
0.11
0.12
0.17
0.20
240
360
0.00
0.01
0.01
0.01
0.02
0.06
0.09
0.05
0.04
0.03
0.06
0.05
0.04
0.08
360
540
0.10
0.04
0.01
0.01
0.01
0.01
0.02
0.03
0.04
0.08
0.04
0.05
0.01
0.07
540
720
0.20
0.19
0.09
0.06
0.04
0.01
0.01
0.01
0.01
0.06
0.07
0.09
0.06
0.06
720
n/a
0.50
0.46
0.38
0.24
0.15
0.09
0.06
0.07
0.04
0.02
0.02
0.01
0.02
0.05
Total
1.00
1.00
1.00
1.00
1.00
1.00
1.00
1.00
1.00
1.00
1.00
1.00
1.00
1.00
Percent of Starts in
Each Time Period
2.04
5.54
6.02
4.73
5.16
6.72
8.07
7.3
8.04
8.98
8.41
7.73
6.02
15.24
Road Grade
The IVE model has been designed to use correction factors to model differences due to
driving behavior and operating mode. The driving correction factors have been derived
using 60 categories (bins) of vehicle specific power (VSP) and engine stress levels.
Inherent in calculating VSP is estimating the engine load, including road grade and air
conditioning usage. As part of the driving pattern development, the user has the option of
inputting second by second velocity and road grades to estimate the VSP/stress
distribution for each scenario desired. If the user prefers not to use road grade this way,
an alternate “average” road grade may be specified in the location files. The valid inputs
are –14% to +14%. If an “average” road grade is input, the change in VSP associated
B-9
with that road grade will be estimated and applied to the entire analysis. The VSP
increase associated with road grade is calculated using Equation 3.
VSPrg = v9.81 (atan(sin(grade)))
(Eq. 3)
VSPrg = Increased load associated with road grade
grade = (ht=0 – ht=-1)/( v (t=-1to0) )* t(t=-1to0))
v = velocity (m/s)
h = Altitude (m)
t = time (s) (typically 1 second)
Air Conditioning
The use of air conditioning is treated similarly to grade effects in the IVE model. A
VSP/stress bin distribution is calculated with an increased load associated with using the
AC unit. An “ACon” emission factor is then estimated for each technology vehicle based
on this new power distribution. The fleet file contains information on the number of
vehicles that are equipped with air conditioning, and the location file contains
information on the ambient temperature and describes how much the fleet will use the air
conditioning. The appropriate percentage of the vehicles in each technology category is
applied to the ACon Emission Factor, while the remaining portion of the fleet uses the
ACoff emission factor.
The increased load associated with Air Conditioning use is estimated in the following
manner:
VSPac = COF * VSPcomp
(Eq. 4)
where
VSPac = Averaged Increased Load due to operation of an AC unit
COF = Compressor On Fraction
VSPcomp = Increased load of AC compressor
Velocity is assumed to impact the efficiency of the AC compressor, therefore decreasing
the load (VSPcomp) placed on the engine from the AC unit at high speeds. The load on
the engine due to operating the AC compressor is assumed to be 3 kW/ton at a speed of 9
m/s, and 2.5 kW/ton at a velocity of 14 m/s, with a linear effect of speed on AC load (Eq.
5). There is a minimum of 2 kW/ton at high velocities. These are only assumptions and as
more data becomes available, these values may be changed in subsequent model versions.
VSPcomp = 4-.1*v
(Eq. 5)
where
v = average velocity (m/s) and v < 20 m/s
Equation 5 estimates the increases in engine load from operating an AC compressor. The
AC compressor is not on all the time. Instead, the compressor cycles on and off
depending upon many variables, including the vehicle and compressor type and ambient
B-10
conditions. A simplified approach for estimating compressor on fraction is to assume that
it only varies linearly with temperature (Eq. 6). This is similar to EPA’s observation of
compressor on fraction versus ambient temperature (EPA 2001 (9)).
COF = .05*T-1
(Eq. 6)
where
T = ambient air temperature (degrees Celsius) and 20<T<40
Application of Load due to “Average” Road Grade and AC use
The loads described above (VSPrg and VSPac) are applied to the existing VSP/stress
bins. The percentage of increased VSP is applied to the original bins to create a new VSP
binning distribution by linearly apportioning it to each bin (Eqs 7 & 8). While this
approach is a simplification of a non-linear system, the effect on emissions and bin
results are very small and therefore this approach is assumed to be a reasonable
approximation.
NewBFi = (1-LF)*BFi+ LF*BFi-1
(Eq. 7)
LF = (VSPac + VSPrg)/binsize
(Eq. 8)
where
BFi= Fraction of Travel in Current (ith) Bin
BFi-1= Fraction of Travel in Previous Bin
Binsize = Bin Size in kW/ton
LF = Load Fraction
For example, if a user inputs an average road grade of 2% and an average velocity of 15
m/s, and no air conditioning, the VSP increase associated with this scenario would be 2.9
kW/ton (Eq. 3). Since each bin size spans 4.1 kW/ton each, the IVE model would move
71% of the fleet up one power bin from their current position (Eq 8). So, if the original
driving pattern distribution contained 5% and 11% of the driving in Bin 7 and Bin 8,
respectively, the new driving pattern distribution for Bin 8, calculated from equation 7,
would be 7% ((1-.71)*.11+.71*.05). An input of 0% for road grade will not consider any
road grade effects in the calculation.
5. Country Adjustment Correction Factors
Applying Technology Specific Non-FTP Bag Emission Rates in the IVE model
The IVE model’s base emission rates are based on the United States’ Federal Test
Procedure (FTP) driving cycle. A database of second by second emissions using the FTP
and other cycles were used to create a separate database of the effects of different driving
conditions on different technology groups. Because of the lack of sufficient second by
second information, it was decided that the emissions from these driving conditions
would be used relative (or normalized) to emissions seen in the LA4 cycle. It is
anticipated that some users will have local data for various technologies based on a cycle
other than the LA4, and that these data will not be second by second, but aggregate
B-11
emissions over the cycle. When such data exists, users are encouraged to apply their own
base emission rates instead of the default US based emission rates in the IVE model. The
following procedure outlines the step-by-step process of applying bag rates on a non-LA4
cycle as the base emission rates for a specific set of technologies.
1. The user should edit the Location file to contain the average velocity and percent
of driving in each driving pattern category.
2. The user should run the IVE model with the edited Location file and export the
output. The modeler should choose options that are consistent with the
dynamometer testing procedure used (i.e same temperature, humidity, fuel grade,
etc.)
3. The output will contain emission rates predicted for the new cycle based on US
LA4 base emission rate data.
4. Divide the measured cycle emissions by the IVE predicted emissions for each
technology.
5. Insert these ratios in the Base Adjustments Tab in the IVE model. Click on the
Base Adjustments Tab, go to File, New, and then add the technologies you are
interested in (Figure 1 below). Save when done. Now, when you go to the
Location tab and select your fleet, you can also select the Base Adjustments File
to use. For every type of driving analyzed using this Fleet Profile, the results will
reflect the new user-input emission rates.
B-12
References
1) ARB (2002) “Methodology for Calculating and Redefining
Cold and Hot Start Emissions”, June http://www.arb.ca.gov/msei/PUBS/starts.pdf
2) European Environmental Agency, European Topic Centre on Air and Climate Change
(2002) “National and central estimates for air emissions from road transport”
3) European Environmental Agency, ETC/AEM (2000) “COPERT III Computer
programme to calculate emissions from road transport, User’s manual 2.1” Technical
report No 50
4) EPA (2001) “MOBILE6 Estimates of Exhaust Emissions for 1994-and-later Light
Duty Diesel Cars and Trucks”, M6.EXH.011, EPA420-R-01-041 July
5) EPA (2001) “Determination of Start Emissions as a function of Mileage and Soak
Time for 1981-1993 Model Year Light Duty Vehicles”. M6.STE.003, EPA420-R-01-058,
November.
6) EPA (2001) “Soak Length Activity Factors for Start Emissions” M6.FLT.003, April
EPA420-R-01-011
7) EPA (2001) “Final Determination of Hot Running Emissions from FTP Bag
Emissions” M6.STE.002 EPA420-R-01-059 November
8) EPA (2001), “Basic Exhaust Emission Rates of Open Loop Vehicles for MOBILE6:
Exhaust Emissions at High and Low Altitudes for Engine Starts and Running Emissions
for Motorcycles, Light-Duty Diesel Vehicles and Trucks and Pre-1981 Model Year
Light-Duty Gasoline Vehicles and Trucks”, M6. EXH.005 EPA420-R-01-027 April
9) EPA (2001) “Air Conditioning Activity Effects in MOBILE6” M6.ACE.001, EPA420R-01-054 November.
10) EPA (2001) “Determination of CO Basic Emission Rates, OBD and I/M Effects for
Tier1 and Later LDVs and LDTs”, M6.EXH.009, EPA-420-R-01-032 April
11) EPA (2002) “MOBILE6 Technical Documentation”
http://www.epa.gov/otaq/models/mobile6/m6tech.htm
12) EPA (2002) “Clean Alternative Fuels: Biodiesel”, EPA420-F-00-032, March
www.afdc.nrel.gov
13) EPA (2002) “Determination of Running Emission as a Function of Mileage for 19811993 Model Year Light Duty Cars and Trucks”, M6.EXH.001, EPA420-R-02-002
January.
B-13
14) EPA (2002) “Determination of NOx and HC Basic Emission Rates, OBD and I/M
Effects for Tier1 and later LDVs and LDTs” M6.EXH.007, EPA420-R-01-056
November
15) EPA (2002) “Update of Heavy-Duty Engine Emission Conversion Factors for
MOBILE6: Analysis of BSFCs and Calculation of Heavy-Duty Engine Emission
Conversion Factors” M6.HDE.004, EPA420-R-02-005 January
16) Government of India (GIA) (2002) “Report of the Expert Committee on Auto Fuel
Policy” August.
17) IVE (2003) “Creating US Fleet Files for the IVE Model”, University of California,
Riverside, CE-CERT.
18) Kojima, M. C. Brandon, J. Shah (2000) “Improving Urban Air Quality in South Asia
by Reducing emissions from Two-Stroke Engine Vehicles” The World Bank, December.
19) Kojima, M., et.al. (2002) “Measurement of Mass Emissions from In-use Two-Stroke
Engine Three-Wheelers in South Asia” The World Bank. Society of Automotive
Engineers, 02SFL-25.
B-14
Appendix A. Sample Input File for Correction Factor Development
B-15
MOBILE6 INPUT FILE
PARTICULATES
:
AIR TOXICS
:
POLLUTANTS
:
SPREADSHEET
:
DATABASE OUTPUT
:
AGGREGATED OUTPUT :
DAILY OUTPUT
:
WITH FIELDNAMES
:
DATABASE EMISSIONS :
DATABASE FACILITIES:
DATABASE VEHICLES :
RUN DATA
SO4 OCARBON ECARBON GASPM LEAD SO2 NH3
BUTA FORM ACET
HC CO NOX
2222 2222 11
None Arterial
22222 22222222 2 222 22222222 222
SCENARIO REC
: Example Input File
CALENDAR YEAR
*
MIN/MAX TEMP
FUEL RVP
: 2002
PARTICLE SIZE
PARTICULATE EF
PMDDR1.CSV
PMDDR2.CSV
DIESEL SULFUR
: 10.0
: PMGZML.CSV PMGDR1.CSV PMGDR2.CSV PMDZML.CSV
GAS AROMATIC%
GAS OLEFIN%
GAS BENZENE%
E200
E300
OXYGENATE
:
:
:
:
:
:
:
:
:
END OF RUN
:
: 68.0
: 7.0
84.0
: 500.0
25.0
15.0
1.5
50.0
85.0
MTBE
ETBE
ETOH
TAME
15.1
17.6
10.0
6.0
0.50
0.05
0.45
0.00
B-16


![Rii Mini [Bluetooth]](http://vs1.manualzilla.com/store/data/005730343_1-53cd9486bcc3b780c33a2a4f5175af21-150x150.png)