1
College of Engineering & Computer Science
Senior Design 2
Dynamic Liquid Light Fountain (DLLF)
Developed by:
Group #3:
Peter Bunora
Sarah Weston
Brandy Smith
May 3, 2010
Contents
1
Introduction .................................................................................................... 1
1.1
Executive Summary ................................................................................. 1
1.2
Motivation ................................................................................................ 1
1.3
Design Summary ..................................................................................... 2
1.3.1
Nozzle ............................................................................................... 2
1.3.2
Cutter Mechanism ............................................................................. 2
1.3.3
Power Supply .................................................................................... 2
1.3.4
LED Drivers ....................................................................................... 3
1.3.5
LEDs ................................................................................................. 3
1.3.6
Fiber Optics ....................................................................................... 3
1.3.7
System Control.................................................................................. 3
1.3.8
Pump and Pump Controls ................................................................. 4
1.3.9
Environmental Controls ..................................................................... 4
1.3.10
1.4
2
User Controls/Interface .................................................................. 5
Component Requirements ....................................................................... 5
1.4.1
Nozzle ............................................................................................... 5
1.4.2
Cutter ................................................................................................ 6
1.4.3
Power Supply .................................................................................... 6
1.4.4
LED Drivers ....................................................................................... 6
1.4.5
LEDs ................................................................................................. 6
1.4.6
System Control.................................................................................. 7
1.4.7
Pump ................................................................................................. 7
1.4.8
Pump Controls .................................................................................. 7
1.4.9
Ambient Light Sensing Circuitry ........................................................ 8
1.4.10
Passive Infrared Circuitry ............................................................... 8
1.4.11
Infrared Remote Control ................................................................ 8
1.4.12
User Interface ................................................................................ 8
1.4.13
Printed Circuit Board ...................................................................... 9
1.4.14
Weatherproof Enclosure ................................................................ 9
1.4.15
Fiber Optic Transmission Lines...................................................... 9
Component Research .................................................................................. 10
2.1
Research Methods................................................................................. 10
2.2
Hardware ............................................................................................... 10
ii
2.2.1
Power Supply .................................................................................. 10
2.2.2
System Control................................................................................ 18
2.2.3
LEDs ............................................................................................... 20
2.2.4
LED Drivers ..................................................................................... 22
2.2.5
Color Organ..................................................................................... 27
2.2.6
IR Remote Control .......................................................................... 31
2.2.7
Motion Sensor ................................................................................. 32
2.2.8
Ambient Light Sensor ...................................................................... 36
2.2.9
Nozzle Flow Cutter Mechanism....................................................... 37
2.2.10
User interface .............................................................................. 41
2.2.11
Pump Controls ............................................................................. 44
2.2.12
Printed Circuit Board .................................................................... 46
2.2.13
Enclosure ..................................................................................... 48
2.2.14
Fiber Optic Transmission Lines.................................................... 48
2.2.15
Laminar Flow Nozzle ................................................................... 48
2.2.16
Pump ........................................................................................... 50
2.3
3
Software ................................................................................................ 50
Design ......................................................................................................... 52
3.1
Design Methods ..................................................................................... 52
3.2
Hardware ............................................................................................... 52
3.2.1
Power Supply .................................................................................. 52
3.2.2
Microcontroller Interface .................................................................. 53
3.2.3
LED Drivers ..................................................................................... 54
3.2.4
IR Remote Control Circuitry ............................................................ 55
3.2.5
Passive IR Sensor Circuitry............................................................. 56
3.2.6
Ambient Light Sensor Circuitry ........................................................ 59
3.2.7
Servo Driver Circuitry ...................................................................... 60
3.2.8
Laminar Flow Nozzle and Cutter Mechanism .................................. 61
3.2.9
Fiber Optic to LED Interface ............................................................ 68
3.2.10
User Interface .............................................................................. 68
3.2.11
Pump Control Circuitry ................................................................. 69
3.2.12
Printed Circuit Board .................................................................... 70
3.2.13
Enclosure ..................................................................................... 71
3.2.14
Software ....................................................................................... 71
iii
Testing ......................................................................................................... 73
4
4.1
Safety Procedures ................................................................................. 73
4.2
PCB Testing........................................................................................... 73
4.3
Power Supply......................................................................................... 74
4.3.1
Testing Conditions .......................................................................... 75
4.3.2
Measuring Approach ....................................................................... 76
4.4
LED Driver ............................................................................................. 81
4.5
Pump Controls ....................................................................................... 81
4.6
Nozzle and Cutter Mechanism ............................................................... 82
4.7
Motion Detector ..................................................................................... 82
4.8
Ambient Light Sensor ............................................................................ 83
4.9
Servo Driver ........................................................................................... 85
4.10
Microcontroller Software Simulations ................................................. 86
4.11
Microcontroller and External Circuit Interface ..................................... 86
4.12
Final Testing Phase ............................................................................ 87
5
User Manual ................................................................................................ 88
6
Administration and Conclusion .................................................................... 91
6.1
Project Administration ............................................................................ 91
6.2
Budgetary/Financial Data ...................................................................... 92
6.3
Project Timeline ..................................................................................... 93
7
Conclusion ................................................................................................... 95
8
Table of Figures ........................................................................................... 96
9
Appendix...................................................................................................... 98
9.1
10
Sources ................................................................................................. 98
Permissions ............................................................................................ 101
10.1.1
Hitec HS-56HB........................................................................... 101
10.1.2
Panasonic .................................................................................. 101
10.1.3
Cypress ...................................................................................... 101
10.1.4
RC-5 Protocol ............................................................................ 102
10.1.5
Parabolic Velocity Profile ........................................................... 102
10.1.6
National Semiconductor ............................................................. 102
10.1.7
Micrel, Inc. ................................................................................. 104
10.1.8
Luxdrive ..................................................................................... 104
iv
1
Introduction
1.1 Executive Summary
The dynamic liquid light fountain (DLLF) is a small home garden accessory that
allows the user to enhance the aesthetic value of their yard. This fountain
combines optical technology with water jets to display a lighted show. The
dynamic liquid light fountain’s electronic assembly is housed in a weather proof
enclosure containing a printed circuit board with microcontroller; LED drivers;
red, blue, and green LEDs; and a DC power supply to power the LED drivers.
Mounted outside the electronics enclosure are an ambient light sensor and an IR
remote control sensor which allow the user to choose the program from one of
the preprogrammed light shows via remote. In the event of a lost remote, the light
show can be controlled using the 4 toggle switches located on the electronics
enclosure. During the day, in order to save energy and resources, the ambient
light sensor determines when the optics will be active, thus only activating the
LED drivers when the fiber optics can be seen by the viewers. Also mounted on
the electronics housing is a passive IR sensor; this sensor activates the fountain
when motion is detected, thus activating a timer that turns off the fountain when
motion has not been detected for a prescribed amount of time.
The LED’s optical output is driven to the laminar flow nozzle via fiber optic
cabling. The laminar flow nozzle and the flow cutting mechanism are driven by a
servo motor which is controlled by the electronics assembly. The water level in
the fountain is monitored by the pump control circuitry. This circuitry consists of a
low level switch which disengages the fluid pump when low water levels are
detected and then feeds information back to the microcontroller to facilitate the
shut-down of the LED’s and LED drivers.
This project was diverse enough to allow for the development of individualized
tasking for team members. One member was tasked with microcontroller
program development, while another developed the LED driver and power supply
assembly. The third team member tackled the electromechanical aspects (pump
and laminar flow) as well as the peripheral interface.
1.2 Motivation
Our group was motivated by a desire to enhance the appearance of the everyday
home garden. Today people strive to have the outside of their homes reflect their
personal tastes, and express their individuality. By bringing this project to fruition,
we have increased the aesthetic appeal of the average home garden.
This project also allows us to incorporate various aspects of electrical
engineering while still preserving an individual and unique senior design project.
Furthermore, this project encompasses the specialties of analog power design,
digital design, embedded systems, and fiber optic transmission. Because of our
1
use of pumps, motors and laminar flow nozzles, we are also delving into the
electromechanical field. The broad spectrum of topics covered by this project not
only allows us to produce an aesthetic pleasing end result, but it allows further
development of our core skill set. Lastly, it allows us to broaden our engineering
knowledge in areas we may not have previously encountered.
1.3 Design Summary
The Dynamic Liquid Light Fountain contains mechanical as well as electrical
components. The design summary explains the expected function of each of
these individual pieces of the Dynamic Liquid Light Fountain. These descriptions
were integral in development of the component requirements.
1.3.1 Nozzle
The main function of the each nozzle is to generate a laminar stream of water.
Laminar flow is achieved when the fluid flows in parallel layers with little or no
disturbance between the layers. Other characteristics of laminar flow are that
velocity and pressure are independent of time, the momentum of diffusion is high
and the momentum of convection is low. Essentially laminar flow is the opposite
of turbulent flow. When laminar flow is achieved, the water has a smooth, almost
glass like appearance. Furthermore, this laminar flow of water allows for the
transmission of light, similar to fiber optic cable. Light from the LEDs is
transmitted through the water and into the collection pool. The goal is to create a
laminar stream that has a diameter of at least ¼” but no more than ½”.
1.3.2 Cutter Mechanism
The cutter mechanism is mounted onto each nozzle and is controlled via the
microprocessor. The function of the cutter is to temporarily block or redirect the
laminar stream of water. By blocking or redirecting the stream of water, it
provides the illusion that the water is “jumping” from one location to the other. In
order to provide the most intact stream of water when the stream is blocked or
unblocked the cutter must move rapid into and out of the stream. A slow moving
cutter can cause major disruptions in either the leading edge of the stream, when
it is unblocked, or in the trailing edge of the stream when it is blocked. The goal
of the cutter is to completely block the stream of water will providing minimal
disturbance to the stream’s leading or trailing edges during its operation.
1.3.3 Power Supply
The backbone for any electronics project is the power supply. Without a means
of supplying power, nothing can be powered up and utilized. Our project requires
both alternating current (AC) and direct current (DC) voltage. The pump requires
115 volts AC at 60 Hertz, and the LED driver, microcontroller, and other various
circuits require 5 volt DC power. Our proposed power supply consists of an iron
core transformer, a bridge rectifier, a filter capacitor and a voltage regulator. The
2
power supply provides a constant voltage and delivers a current of 1.5 amps. It is
mounted inside the main enclosure.
1.3.4 LED Drivers
We are using high powered LEDs to create the various color combinations
desired for the DLLF. One of the simplest and most inexpensive ways to provide
power to a LED circuit, and the way that is recommended by most, is a constant
current source. Typically, it consists of a small integrated circuit and several other
outside components. The result is a constant current supplied to the LEDs no
matter what type of input voltage exists or what type of forward voltage drop the
LED has, which is especially important to consider when using high-power LEDs
such as the ones we are utilizing for the DLLF.
1.3.5 LEDs
The Dynamic Liquid Light Fountain includes design for LED (or Light Emitting
Diode) lighting when the fountain is operating in the dark or when operating after
turned on by the motion sensor. LEDs have many benefits over other traditional
lighting sources such as their compact size, lower energy consumption, faster
switching ability, and lower power consumption. We are using three different
colors with which we can use pulse width modulation to combine and form any
color of the rainbow on the stream of water provided by the pump and cutting
mechanism. Our main focus is on LED performance including maximum current
through the LED, forward voltage, power consumed, and cost.
1.3.6 Fiber Optics
In order to transfer the light from the LED’s to the laminar flow nozzle, we are
using a LED/Fiber coupler. The coupler sits over the LED and creates an
interface between the LED and Fiber cabling. Through this coupler, the light from
the LED travels down the fiber cabling to the laminar flow cutter. At that point, the
light is transferred to the water. The fiber optic cabling is housed within the cutter
mechanism. The intensity of the light is determined by the distance of the fiber
from the nozzle opening.
1.3.7 System Control
This project uses a central control unit which must be robust enough to complete
the following actions. The unit contains four user-selectable programs which,
when selected, run in a loop until the user selects a new program for display. A
fifth program is also available; this program causes the LED’s to “dance” to the
music given an audio input to the RC jack. These programs may be chosen by
the user via the IR remote control or the user interface switches. The control unit
also monitors the signals from the remaining peripherals to determine if the
selected program should be executed. If the light sensing circuitry determines
that the ambient light situation is such that the LEDs cannot be viewed, the
control unit continues to execute the program without driving the LED’s. The
3
passive infrared circuitry monitors the motion surrounding the fountain; if it is
determined that there is no one in the surround area the control unit turns off the
fountain in an effort to keep electricity consumption to a minimum. In addition to
driving the LED’s, the control unit programs also control the cutter motors
through pulse width modulation to vary the laminar flow. The cutters open and
close in four different patterns according to the four programs, this gives the
appearance of dancing liquid light. If the water level becomes too low, the control
unit turns off the LED drivers and turns off the pump to prevent dry running the
pump.
1.3.8 Pump and Pump Controls
This circuit is responsible for protecting the pump when low water levels exist.
When low levels have been reached, the sensor sends a signal to a relay which,
as a result, shuts down the pump; a signal is also sent to the microcontroller. The
microcontroller then begins powering down the Dynamic Liquid Light Fountain.
When a safe water level has been reestablished, the relay closes and the circuit
resets. At this point, the Dynamic Liquid Light Fountain resumes normal
operations. The pump provides enough flow and sufficient lift to the two flow
nozzles to generate the desired laminar stream of the specified diameter, arc
height and length. The discharge from the pump has minimal amount of surging
which allows for a more consistent arc height and length out of the nozzles.
Excessive surging makes the stream appear unstable.
1.3.9 Environmental Controls
1.3.9.1 Ambient Light Sensor
In order to conserve energy and to extend the life of the LEDs, a day/night
sensor provides an input to the microprocessor. During full daylight, the visibility
of the light from the LEDs is extremely low; therefore there is no need to have the
LEDs in service. However, the cutting mechanism is still operational to allow
enjoyment of the fountain during the daytime hours. Once the daylight is below a
predetermined level, the LEDs are placed back in service to maximize the user’s
enjoyment of the fountain.
1.3.9.2 Passive Infrared Motion Sensor
In order to conserve energy as well as to extend the lifetimes of the pump and
LEDs, a passive infrared motion sensor provides an input to the microprocessor.
The motion sensor detects movement within 10 feet of the fountain and initiates
the fountain sequence. If after a predetermined time no motion is sensed then
the microprocessor places the LEDs and the water pump in standby mode. Once
motion is sensed, the microprocessor brings the fountain out of its standby
condition and restores the fountain to its proper operating condition based on the
environmental conditions.
4
1.3.10
User Controls/Interface
1.3.10.1
IR Remote Control
The infrared remote control utilizes an ordinary infrared remote control to
interface with the fountain. The remote control inputs are used by the
microprocessor to initiate preprogrammed light and cutter sequences. Each
preprogrammed sequence corresponds to a number on the remote control. It
also allows the user some basic controls over the primary LED colors, i.e. just
red or just blue, just green, or any combination of the three. Moreover, it allows
the user to turn on and off the individual cutters as desired.
1.3.10.2
User Interface
The user interface provides some basic controls for manual operation of the
fountain. Next, the user interface provides a means to turn the system and or the
pump on or off. It also allows the user to turn any or all of the LED primary colors
on to full intensity. Finally, the interface allows for control of the individual cutting
mechanisms, and it provides a port to allow the user to modify the
microprocessor coding as he or she sees fit.
1.4 Component Requirements
The sections below outlines the requirements set forth by our group to build the
Dynamic Liquid Light Fountain. These requirements lay out the goals we are
working towards achieving for the individual aspects of the DLLF. By meeting the
following individual requirements we have successfully created a fountain that
combines optical technology with water jets to display a lighted show.
1.4.1 Nozzle
Due to the group being the sole sponsor of the project, certain restrictions were
needed to limit the cost of the project. In order to hold down costs, the size of the
pump was scaled down from our original concept. In scaling down the size of the
pump the flow rate and lift of the pump was ultimately reduced. This reduction in
flow rate and lift limited the capabilities of the laminar nozzle. With these limits in
mind, we needed to reduce the diameter and arc length of the water stream to
within the pumps physical capabilities and still maintain a certain amount of
aesthetic value. As a result, the nozzle generates a laminar stream of water with
the following characteristics:
•
•
•
•
A diameter of at least ¼” and no more than ½”.
The stream maintains its integrity throughout its entire length.
The stream travels at least four feet from the exit point of the nozzle.
An arc height of at least two feet above the exit point of the nozzle.
5
1.4.2 Cutter
For the cutter to allow the stream of water to remain as laminar as possible, it
moves into and out of the stream as fast as possible. A fast acting cutter gives
the stream a more defined appearance at the leading or trailing end depending
on if the stream is being cut or uncut. In order to achieve the desired results, the
cutter mechanism meets the following requirements:
•
•
•
•
The cutter completely blocks the laminar stream of water from the
nozzle.
The cutter causes minimal disturbances in the stream during its
operation.
The actuating mechanism operates utilizing a 5 VDC power source.
The cutter can complete its full travel in less than 0.15 seconds in
either direction.
1.4.3 Power Supply
We have included a power supply that provides 115 volts AC and 5 volts DC
power. We will use a standard wall outlet and plug to get the AC voltage. To
reach the desired DC voltage, we designed a circuit that coverts 115 volts AC to
5 volts DC using typical circuitry including a transformer, bridge rectifier, filtering
capacitance, and voltage regulation. A maximum current of 3.0 amps can be
drawn from this power supply. Should we require more current after building and
testing all components, we must modify the power supply accordingly by either
adjusting the voltage regulator or adding additional circuitry.
1.4.4 LED Drivers
The requirements of the LED driver include, but are not limited to the following:
•
•
•
Provides continuous current to each LED
Receives PWM signal from microcontroller
Operates off 5 volts.
1.4.5 LEDs
We have incorporated 2 sets of three color LEDs in our project including red,
blue, and green. These lights are high powered and combine to produce an array
of colors that light up the water as it flows from the fountain. The majority of
indicator LEDs specify their characteristics at a current of 20mA with a typical
forward voltage of 2-4 volts DC. However, illumination LEDs, such as the ones
we are using in our project, usually have larger junctions and can draw more
current, using more power and providing a brighter output. A standard drive
current for a high power LED is 350mA and dissipates around 1watt of power.
We will use 3 watt LEDs which require more power but also provide more
brightness.
6
1.4.6 System Control
The system control runs off of 5 volts DC has a minimum of 32I/O pins, including
at least 2 pulse width modulated I/O pins. The microchip is also capable of using
an external clock reference, which is needed for the Infrared remote control. The
chip also has 10KB of program memory to store the 4 user programs.
The system control is capable of handling the following inputs:
•
•
•
•
•
•
•
•
•
•
6 for the automated program selection
1 manual cutter control
1 water level
1 IR remote control
1 day/night sensor
1 motion sensor
1 initiating manual control of LEDs
6 LED manual on/off
1 external oscillator (for IR remote control)
1 color organ
The microcontroller is also able to drive the 6 LED driver outputs as well as 2
pulse width modulated outputs to drive the cutter arm. There is also 1 output for
the pump controls.
1.4.7 Pump
The pump can provide enough flow and sufficient lift to the two flow nozzles to
generate the desired laminar stream of the specified diameter, arc height and
length. To ensure that these requirements for the system were met, the pump
satisfied the following requirements:
•
•
•
The pump has a discharge flow rate of at least 500 gph.
A minimum of 25 feet of lift.
Utilizes 120 VAC single phase power source.
1.4.8 Pump Controls
The pump control circuitry is responsible for protecting the pump from running
dry, a condition that would significantly reduce the life of the pump. The circuit
contains a relay that operates in the normally closed position. The normally
closed relay allows the pump to remain active while water levels are considered
at a safe level. When the water level drops, a float switch deactivates the
normally closed circuit and turns off the pump. This circuit is also responsible for
ensuring that the microcontroller does not run when there is no water output. The
circuit runs off the 5 volt DC power supply. Lastly, it turns off the pump when
water levels fall below 6 inches, preventing the pump from running dry.
7
1.4.9 Ambient Light Sensing Circuitry
Since during daylight hours the light from the LEDs is not visible, we will turn the
LEDs off during periods when they are not easily visible. This allows our project
to be more energy efficient. The circuitry is adjustable so that the user can set
the level of daylight necessary to power down the LEDs. It also conforms to our
design of a single voltage power supply rather than a dual voltage power supply.
In order to operate the fountain in this manner, the following properties of an
ambient light sensing circuit were required:
•
•
The sensor is adjustable to allow the user to fine tune the point at which
the LEDs are enabled or disabled by the sensing circuit.
The sensor circuitry can be operated utilizing a 5 VDC power source.
1.4.10
Passive Infrared Circuitry
Continuing with our desire to be more energy efficient, the fountain is not
operational when there is no one around to appreciate it. Therefore, the system
incorporates a motion sensing circuit to provide an input to the microcontroller.
When no motion has been sensed in a predetermined amount of time, the
microcontroller shuts down the pump and LED drivers (if they are in operation).
In order to accomplish this, the following sensor requirements were met:
•
•
•
•
Can detect motion within 10 ft. of the fountain
Has a vertical detection field of ±22.5 º
Has a horizontal detection field of ±45 º
Operates utilizing a 5 VDC power source.
1.4.11
Infrared Remote Control
To aid the user in the operation of the fountain, the use of an infrared remote
control is incorporated into the design. This allows the user to control which
sequence of lights and cutter actuation occur and also enables the user to power
the system up or down. To accomplish this, the infrared remote control provides
the control for the following:
•
•
•
•
•
6 preprogrammed LED sequences
Each of the primary LED colors
Individual cutter mechanisms
Pump power.
System power.
1.4.12
User Interface
The user interface allows the user to manually operate the fountain, and it is also
used for troubleshooting purposes. The interface has a means for the user to
access the programming of the microcontroller to make alterations to the code.
Since we wanted to make the interface meaningful, it reproduces most of the
8
functions of the infrared remote control. With this in mind, the interface provides
controls for the following functions:
•
•
•
•
•
Rocker switch to control system power.
Rocker switch to control pump power.
DIP switches allowing individual control of each LED color.
DIP switches for selecting the preprogrammed fountain sequences.
Momentary pushbuttons to actuate each of the nozzle cutters.
1.4.13
Printed Circuit Board
The PCB is a 2-layer, single-sided FR-4 board approximately 0.062” thick. This
board is 60 square inches, which adheres to the student pricing restrictions
imposed by 4PCB, the fabrication company with which we chose to fabricate our
PCB. The PCB contains the following circuitry:
•
•
•
•
•
•
•
LED drivers
Microcontroller circuitry
Peripheral interface
Pump controls
DSP circuitry
5V Power Supply
Color Organ
1.4.14
Weatherproof Enclosure
The weather proof container houses all circuitry and also has the peripheral
sensors mounted outside on the top. Pass through openings are located on the
sides of the box to allow power into the enclosure and to allow the fiber optics
and pump control lines out. The enclosure is non-rusting and has a removable lid
for testing and troubleshooting purposes. The max dimensions for this enclosure
do not exceed 20”x21”x7”.
1.4.15
Fiber Optic Transmission Lines
The fiber optic transmission line are responsible for ensuring the optical output
from the LED drivers is efficiently transferred from the LED to the laminar flow
nozzle. The lines are of sufficient length to comfortably extend to the pump and
basin portion of the project. There is one fiber optic cable per LED, for a total of 2
transmission lines (since we are using 2 RGB LEDs). The LED drivers are
grouped together in 2 groups, each group containing a red, blue and a green
LED color. The transmissions lines run together from one LED to one laminar
flow nozzle. The fiber optic transmission lines are housed within the laminar flow
nozzle allowing the transfer of light to the water. The transmissions lines are
adjustable within the nozzle allowing the user to increase or decrease the
distance between the fiber optic termination and the nozzle opening. This allows
the user the ability to adjust the nozzle for optimal transfer of light to the water.
9
2
Component Research
2.1 Research Methods
In order to most effectively research the components and design ideas for this
project, we began by brainstorming ideas that would incorporate well into our
project. Because the project was our own creation there were no restrictions to
the items that we may include in the Dynamic Liquid Light Fountain. The first
decision we made before research began was which voltages we would like to
use. For diversity of component availability we chose to use a 5 volt DC supply.
By choosing this value, we had a large amount of parts to choose from. After
determining the voltages, we divided the research responsibilities among the
group members so that we were not researching the same parts. We then spent
the next few weeks researching any options that we thought would benefit the
overall outcome of the liquid light fountain. The following section contains the
research we conducted as well as reasoning why we did or did not incorporate
these items into our Dynamic Liquid Light Fountain.
2.2 Hardware
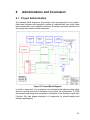
2.2.1 Power Supply
The backbone for any electronics project is the power supply. Without a means
of supplying power, nothing can be powered up and utilized. Because of the
diverse technology that exists today, many power supply circuits have been
designed, built, tested, and used. After doing research on the various circuits
available to us and after applying the knowledge we have gained throughout our
coursework, we know that there are a few basic components of a power supply.
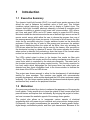
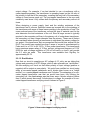
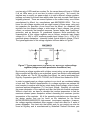
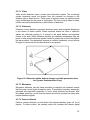
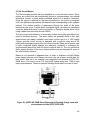
The DLLF requires both alternating current (AC) and direct current (DC) voltage
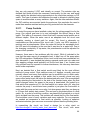
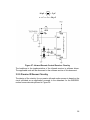
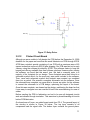
and so we considered the general structure of a linear power supply shown
below in Figure 1 in our design.
Figure 1: General structure of a linear AC to DC power supply
More specifically, our power supply consists of an iron core transformer, a bridge
rectifier, a filter capacitor and a voltage regulator. The component in our project
that will consume the largest amount of power is the water pump, and it requires
115 volts AC. Since the majority of electrical outlets in the United States provide
120 volts alternating at 60 cycles per second (or 60 Hertz), we are utilizing a wall
outlet to power up the pump. The majority of pumps used are already fused so,
10
after we verified that a fuse exists, we decided we do not need to add an
additional fuse for protection. We are definitely adding a fused
d switch between
the AC power supply and the transformer, however, in order to protect the circuit
from any power surges
surges.
2.2.1.1 Step-Down
Down Transformer
Since the remaining items in our project, the microcontroller and the LED driver
circuitry, require 5 volts
lts DC, we needed a step-down
down transformer immediately
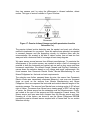
following the AC input and the fuse. Simply put, a transformer is a device that
changes electrical energy in AC circuits. In order to change this energy, a
transformer uses magnetic coupling between set
setss of coiled wires, transferring
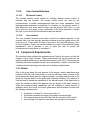
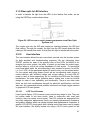
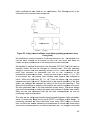
energy from one circuit to another. The basic concept of a transformer is shown
below in Figure 2.
Figure 2: Typical transformer ((Image used with the permission of Wikipedia
GNU Free Documentation.)
In our case, we are changing our primary voltage from 120 volts AC to a
secondary voltage of 6.3 volts AC. Thus, we needed an iron core transformer
with a turns ratio
tio resulting in an output of 6.3volts AC. This ratio is determined
using the formula Vs/Vp = Ns/Np, where Vs is the secondary voltage, Vp is the
primary voltage, Ns is the number of turns in the secondary coil, and Np is the
number of turns in the primary coil. Even though this equation is specifically for
an ideal transformer where there are no energy losses, it is also used to
approximate almost any transformer since they are considered efficient devices.
Since our primary voltage, Vp is 120 volts and ourr secondary voltage, Vs, is 6.3
volts, our secondary to primary turns ratio is 0.0525. Rearranging the equation
gives us 0.0525Np = Ns. So, for every 20 turns of primary, there should be 1.05
turns of secondary. We could have used a transformer with one of
o the following
winding configurations: non
non-tapped, center-tapped, or multi-tapped.
tapped. These “taps”
refer to the primary windings, the secondary windings, or both in some cases.
This enables the user to utilize only some of the windings in order to regulate tthe
11
output voltage. For example, if we had decided to use a transformer with a
center-tapped secondary, the transformer is operating based on the full ratio of
the primary to half that of the secondary, meaning that only half of the secondary
voltage is found across each coil. The non-tapped transformer is the one most
commonly used since it fully utilizes both the primary and secondary coils at all
times.
When designing a power supply, heat and the winding resistance of the
transformer are of concern. Resistive losses are incurred due to the windings of
the transformer with some of these losses resulting in the production of heat. The
cross sectional area of the transformer coil and the type of material used for the
wire determine the total resistance of the coil. Since a larger current is typically
required in the secondary coil than in the primary coil of a step-down transformer,
the secondary coil has a larger diameter than the primary. These are all factors
we considered when choosing a transformer to step-down the primary voltage for
our project. One transformer that we researched that would have worked for the
DLLF if we would have needed less than 3 amps of current is manufactured by
Pulse and it is a 115V to 6V 2.67A, 12.0va, power transformer. This transformer
has a maximum power rating of 12.0va, an input voltage and frequency of 115V
50/60 Hz. and a voltage regulation of 19% at full load to no load; it can provide
the 6.3 volts we need. This transformer was available from Digi-Key for
approximately $6.78.
2.2.1.2 Rectification
Now that our circuit is supplying an AC voltage of 6.3 volts, we are taking that
voltage and converting it to DC voltage, which is also referred to as “rectification.”
We are rectifying our circuit so that either polarity of input voltage (positive or
negative) will be output as one polarity. We could have rectified our circuit using
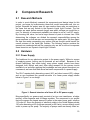
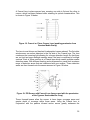
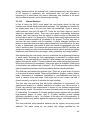
either a non-center-tapped transformer and 4 diodes (also known as a “bridge
rectifier”) or a center-tapped transformer and 2 diodes. The advantage of a noncenter tapped transformer was that we would have been fully utilizing the
secondary coil; the disadvantage was that there were 4 diodes required (rather
than 2) which meant there were 2 diode drops in voltage. An example of a noncenter-tapped transformer rectifying circuit is shown in Figure 3.
Figure 3: Non-center-tapped rectifying circuit
12
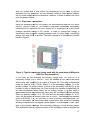
For the center-tapped transformer, the advantage is that we are only using 2
diodes which means there is only 1 diode drop in voltage; the disadvantage of
this transformer is that twice the number of secondary windings are required for
the same amount of voltage which then increases its size and, ultimately, it
increases the cost of the transformer.
An example of a center-tapped
transformer rectifying circuit is shown in Figure 4. We are using a non-centertapped transformer with a bridge rectifier for our power supply.
Figure 4: Center-tapped rectifying circuit
2.2.1.3 Diodes
In order to ensure good regulation, we considered substituting the conventional
bridge rectifier with four power schottky diodes (Johnson, 2009). Compared to a
typical P-N junction diode with a forward-voltage drop of 0.7-1.7 volts, the
schottky diode has a very low forward-voltage drop of 0.15 to 0.45 volts
(Wikipedia). During implementation of the bridge rectifier, if we used standard
silicon diodes, we would have an approximate voltage drop of 2 volts, whereas,
using the schottky diodes, our voltage drop is only about 1 volt. When designing
any type of electrical circuit, efficiency should always be considered. So, if there
is less voltage drop, there is less power lost, and therefore, the circuit is more
efficient. Another advantage is that schottky diodes can achieve greater
switching speeds than p-n junction diodes because of their low depletion width,
again making them appropriate to rectify high frequency signals.
2.2.1.4 Filtering Capacitance
At this point in our power supply circuit, we have taken a large AC voltage,
transformed it in to a smaller AC voltage using a transformer, and rectified this
voltage so that it is of one polarity regardless of the input voltage. Next, we
added a capacitive filter to smooth out the ripple in the voltage which improves
the output voltage waveform. A circuit of the power supply components we have
added thus far is shown below in Figure 5.
13
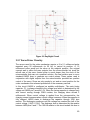
Figure 5: Power Supply circuit with filter capacitance shown.
In order to decrease the ripple voltage across it, the size of the capacitor was
chosen to be large (in the order of several microfarads). In order to calculate the
ripple voltage across a capacitor, we can use a simple equation: dv/dt = I / C with
dv/dt = change in voltage with respect to time, I = DC load current, and C =
capacitance. For 60 Hz power lines, dt = 0.008 seconds. Let’s say we chose to
use a capacitor with a value of 20,000 microfarads with a current of 1 amp; then
our ripple voltage is calculated as follows:
= ∗ 1
∗ 0.008
=
0.02
= 0.4 Using the typical voltage of 115V from the primary, our secondary voltage is
calculated at 5.5V AC. Thus, the peak voltage is 1.41 * 5.5V or 7.7V. If we
subtract 1 volt for the bridge rectifier (schottky), and 0.40 volts for the ripple
voltage we just calculated, we are left with 6.3 volts DC going into the voltage
regulator. Since this is about 1.3 volts above the desired 5 volt output, we are
okay.
2.2.1.5 Voltage Regulation
For our project, we must be sure we maintain a constant voltage level of 5 volts.
To do this, we added a voltage regulator to our power supply. Just like the
majority of the items in our project, we were careful in choosing a voltage
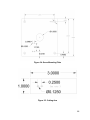
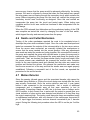
regulator. We needed one with a low input to output voltage drop. One of the
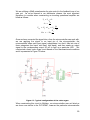
voltage regulators we looked into was the LP3872ES-5.0. The typical application
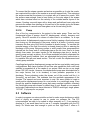
of this type of voltage regulator is shown in Figure 6 below.
14
9
Figure 6: Typical application of a LP3872ES-5.0 voltage regulator (Image
used with permission from National Semiconductor.)
This part is ideal for low-voltage microprocessor applications such as the DLLF
since it has an ultra low dropout voltage, responding quickly to step changes in
load. However, just like any low drop-out voltage regulator, the LP3872ES-5.0
requires external capacitors for stability. Proper performance is directly
proportional to the correct selection of these capacitor values. When choosing
capacitors, we always pay careful attention to the breakdown voltage rating,
choosing capacitors with a voltage rating higher than the highest voltage the
capacitor will ever experience during circuit operation. For instance, according
the voltage regulator specifications, the chosen input capacitor is at least 10
microfarads. The output capacitance equals at least 10 microfarads as well but it
is also placed no more than 1 cm. from the device and connected directly to the
ground and output pins, both with zero current flow. We also considered the
material with which the capacitor is made. We made sure the required
capacitance is provided over the entire temperature range during operation. The
capacitance of a Tantalum capacitor varies little with temperature while ceramic
can vary quite a bit. So, it is recommended that, for this type of voltage regulator,
we use a solid Tantalum capacitor for the output.
A continuous current of 1.5 amps is delivered from this voltage regulator.
However, as we found in the data sheet provided by National Semiconductors, it
may require the use of a heat sink depending on the maximum ambient
temperature and maximum power dissipation of the application. We must keep
the junction temperature within the range specified under operating conditions.
The total power dissipation of the regulator is equal to: PD = (VIN−VOUT) IOUT+
(VIN)IGND where IGND is the operating ground current of the device (14-15mA
for a 1.5A load current and 9-10mA for a 150mA load current). A heat sink rated
for approximately 5 watts of dissipation would be sufficient. This voltage regulator
can be purchased from Digi-Key for approximately $3.25.
Now, the size of our voltage regulator depends on how many components we
need to provide power to in our project. We originally planned on using only three
LEDs and one nozzle for our fountain. If this were the case, we would only need
1050mA if all three of the LEDs were turned on at one time plus the current draw
from the microcontroller. However, to make the fountain more aesthetically
pleasing and similar to other fountains of this type on the market today, we will
15
use two sets of LEDs and two nozzles. So, the current draw will jump to 2100mA
if all six LEDs were on at one time (to make a white color). As a result, the
simplest way to modify our power supply is to add a different voltage regulator,
perhaps one rated for at least three amps rather than only one and a half amp as
originally planned. There are several options on the market today; one of them
manufactured by Micrel, Inc, manufacturer part #MIC29300-5.0WU. This is a
linear five volt voltage regulator with an output current of three amps, using only
two capacitors for operation. As we found from the Micrel, Inc. datasheet, this
regulator has low dropout voltage, a wide range of input voltages, low ground
current, an extremely fast transient response, reverse battery and “load-dump”
protection, and an accurate 1% guaranteed tolerance. More specifically, the
characteristics of this voltage regulator are as follows: maximum input supply
voltage (Vin) = -20V to +60V; maximum enable Input Voltage (Ven) = -0.3V to Vin;
maximum power dissipation – internally limited; typical dropout voltage: 370mV.
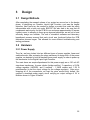
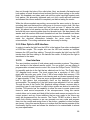
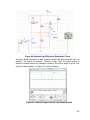
The typical application of this voltage regulator is shown below in Figure 7.
Figure 7: Typical application of a Micrel, Inc. MIC29300 series voltage
regulator (Image used with permission from Micrel, Inc.)
By choosing a voltage regulator with a higher current rating, we are guaranteeing
that our project will be able to run as planned, even if we decide to add additional
LEDs, nozzles, etc. The 5V, 3A regulator from Micrel, Inc. can be purchased from
Digi-Key Corporation (part # 576-1122-ND) for $5.45 and from Newark for $5.68.
In order to properly apply a voltage regulator to our circuit, we considered adding
a heat sink. The thermal characteristics of a voltage regulator are perhaps the
most complex to analyze with the key points being output voltage, output current,
maximum ambient temperature (TA), and input voltage. Basically, we calculate
the power dissipation of the regulator and then the heat sink thermal resistance.
Without a heat sink, we have to calculate the junction temperature to find the
maximum allowed power dissipation without exceeding the maximum junction
temperature of the regulator. All of the preceding calculations are discussed in
the design section and can be found on the datasheet for the Micrel
MIC29150/29300/29500/29750 high-current, low-dropout regulators. However,
the voltage regulator datasheet does suggest a heat sink rated for 5 watts of
power dissipation. One heat sink that would work for our project can also be
found at Digi-Key and is manufactured by Wakefield Thermal Solutions, part
16
number 527-24AB-MS4-ND, with a price of $6.44. This heat sink is ideal for DC
to DC converters such as the one we require for our project. When ordering the
part number, it comes as a package including a hardware kit with everything
needed in order to mount it to our voltage regulator to keep the regulator cool.
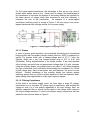
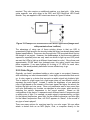
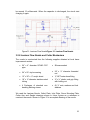
2.2.1.6 Switched-Mode Power Supply Option
At this point, we decided to look into another type of power supply option, the
switched-mode power supply or SMPS. Unlike the linear power supply, the
switched-mode power supply utilizes a switching regulator in order to provide the
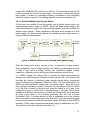
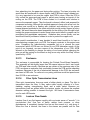
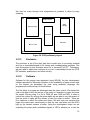
desired output voltage. When compared to the earlier block diagram of a liner
power supply, the general block-diagram of a switching power supply shown in
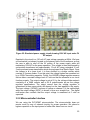
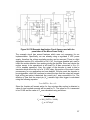
Figure 8 below is more complex.
Figure 8: General structure of a switched-mode power supply
While the linear power supply consists of only a transformer, bridge rectifier,
filtering capacitors, and a voltage regulator, the switching power supply consists
of both a high and low-voltage rectifier, two transformer stages, filtering
capacitors, a switching circuit, and a pulse width modulation control circuit.
In a SMPS design, the energy flow is directed by power semiconductors
operating at a high frequency constantly switching on and off. The switches are
providing the transfer of electrical power through energy-storing components
such as inductors and capacitors (Rozenblat, 2003). The main advantages of a
SMPS are higher efficiency, smaller size, and lighter weight. Since the energy
flow is being controlled by a switch, there are very little losses. When the switch
is off, the flow of current is blocked, and, when the switch is on, it sees a low
voltage drop and any current that is flowing through it will pass. Since power
dissipation is defined as the product of current and voltage, both the on state and
off state of the switch is very efficient, producing very little loss in power
(Rozenblat, 2003). A smaller amount of heat is generated due to the reduced
size of the passive components and so the total size of this type of power supply
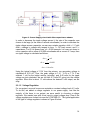
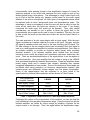
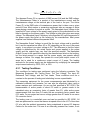
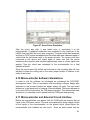
is much smaller than the traditional liner power supply. Efficiency for the SMPS is
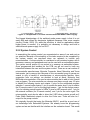
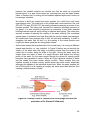
generally 70-90% while a regulated linear power supply is traditionally only 50%.
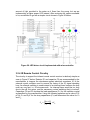
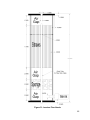
A comparison of the two is shown below Figure 9.
17
Figure 9: Comparison of a Linear versus Switched Mode Power Supply
The biggest disadvantage of the switched mode power supply is that it is not
easily built and utilized by electronics hobbyists because it has more complex
circuitry (Purdie, 2003). So, while the efficiency is ideal for applications where
higher power is needed, it is probably not necessary to design and build a
switched mode power supply for our DLLF.
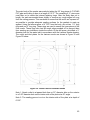
2.2.2 System Control
In researching the system control, we concentrated on ease of use and cost as
our priorities. Because of the simplicity of the tasks required to be completed by
the system control, we narrowed down our research to include only
microcontrollers. A microcontroller is considered a self-contained system with a
processor, memory and peripherals and can be used with an embedded system.
The system control portion of our project is in essence an embedded system.
Once programmed and installed on our PCB, we will not need to have any
interaction between the user and the system control. There are a vast number of
microcontroller manufacturers, Motorola, Freescale, Atmel, Microchip, and Texas
Instruments, just to name a few. Because of this, we needed a way to narrow our
search to only a handful of manufacturers or microcontroller families. Upon
suggestion from our advisor, we decided to look at Atmel, Motorola, and
Microchip microcontrollers. We need a microcontroller that is able to hold 4 small
user programs. The microcontroller we choose must have enough user I/O pins
to handle the following inputs and outputs: 6 pins for the automated program
selection 1 manual cutter control, 1 pin to monitor the water level,1 pin to monitor
the IR remote control,1 pin for the day/night sensor, 1 pin for the motion sensor,
1 pin for initiating manual control of LEDs, 6 pins for LED manual on/off, 1 pin for
the external oscillator (for IR remote control), and 1 pin for the color organ. The
microcontroller must also be able to drive the 6 LED driver outputs as well as 2
Pulse Width Modulated outputs to drive the Cutter arm. There will also be 1
output for the pump controls.
We originally thought that using the Motorola 68HC11 would be a good use of
our knowledge from Embedded Systems. We already know the programming
syntax and we are familiar with the interface on the evaluation board. This would
18
give us an edge to developing the software and may help to relieve some of the
stress we would encounter while trying to learn a new programming syntax for
developing our fountain. The 68HC11 has a total of 26 I/O pins. So although the
ease of programming this chip is a benefit, we are unable to use it because we
need at least 30 I/O pins.
Next we looked at the Atmel Microcontrollers. Atmel has 9 different
Microcontroller subcategories which can be used for many purposes. The Atmel
ATmega1284P is a 40-pin DIP, which would allow for easy installation versus the
surface mount parts. The ATmega1284P will run off of 3.3 to 5.5V, this fits the
criteria we desire for our PCB assembly. Atmel microcontrollers can be
programmed in either C code or using Assembly language. Atmel offers the
software AVR studio 4 free for download; this program allows you to program any
of the Atmel microcontrollers. These microcontrollers are available through many
distributors, but the cost ranges from about $5.00 to $13.00. While navigating the
Atmel website, we found it difficult to compare the various types of
microcontrollers they manufacturer, this was a bit of an inconvenience. We also
had hard time finding information about the software for programming without
downloading the package. Because of the slightly higher prices and inconvenient
web site, we decided to keep looking for other options for our project.
Next, we looked at Microchip, Microchip offers 8-bit, 16-bit and 32-bit
microcontrollers. For this project we only need an 8-bit microcontroller that
narrowed the search to PIC10, 12, 16, or 18.
As you can see above, the PIC10 family contains no Interrupts. We are using
interrupts for driving the LED’s. We do not have power consumption restrictions
so we aren’t taking battery operated enhancement into consideration. In order to
hold all the programming, we would like to have more than 10Kb of program
memory; therefore we are excluding the PIC10 family from our selection. The
midrange architecture seems to be the most beneficial to our application.
Although the PIC18 is the most robust architecture by putting this family into our
PCB we would be using a part too complex for our application.
Once we decided on a PIC16 series microcontroller we compared the number of
I/O pins and A/D’s. In order to allow for more flexibility we chose the 877; this
increases the number of A/D and I/O pins. This will allow us to keep the option
open to increase the functionality of our fountain. The PIC16F887 microcontroller
has only 35 programming instructions, and has 35 I/O pins. The small number of
instructions will allow for a smaller learning curve compared with some of the
more complex microcontrollers on the market.
In choosing a microcontroller it was important to understand the different
packaging standards and the differences they would make in designing our PCB.
The microcontroller we chose came in 3 different package types, the 40-pin
PDIP, 44-pin QFN and 44-pin TQFP packages. The PDIP is the Plastic Dual InLine, this packaging is meant for through-hole mounting. The QFN is Quad Flat
No Lead packaging; this packaging is advantageous because it allows for lower
19
lead inductance and a smaller sized chip area, but it may be more difficult for us
to use due to the mounting process used for this package. The TQPF is similar to
the QFN, but this package contains surface mount leads distributed along the
outer surface of the chip with 11 pins per side. Although all package types have
their benefits, we will be using the PDIP. In order to control costs, the PCB we
are having fabricated will have only through-hole mountings; this PDIP packaging
is the only package with a through-hole mounting style.
The PIC16 microcontroller requires software to program the chip. Also, in order
to communicate with the chip, we need some type of interface between the
programmer and the chip. We chose to look for a development board that would
allow for easy program upload. The development board we chose to purchase is
from Futurlec. This development board comes with all the necessary equipment
for programming the PIC. Choosing this option allows us to begin program
development and testing before the PCB is complete. PIC microcontrollers can
be programmed using either assembly, or C compilers, discussion of these
programming methods will be discussed in section 2.3 Software.
2.2.3 LEDs
The Dynamic Liquid Light Fountain includes design for LED (or Light Emitting
Diode) lighting when the fountain is operating in the dark or when operating after
turned on by the motion sensor. LEDs have many benefits over other traditional
lighting sources such as their compact size, lower energy consumption, faster
switching ability, and lower power consumption. In fact, they are approximately
three times more efficient than incandescent lamps (Arnold 2006). The
disadvantages of LED lighting over traditional lighting include higher cost,
difficulty in locating the type of LED required, increased sensitivity to heat which
leads to lower life span and less efficiency, and output limited to one direction at
a narrower angle.
The first LED was designed and built in 1920 by a radio technician named Oleg
Vladimirovich Loser that noted diodes used in early radio receivers emitted a light
when current ran through them. The LED wasn’t introduced as a practical
electronic device until 1962. The LEDs can have different color lights placed in
any formation to create designs and images. Almost all early devices emitted a
low-intensity red light, but as modern LEDs have been developed there is a wide
array of almost any color desired including ultraviolet and infrared wavelengths,
with a wide array of brightness.
The general operation of a LED can be described easily as they are based on the
semiconductor diode; when they are switched on, or in forward mode, holes and
electrons are able to recombine which results in a release of energy in the form
of light (Arnold, 2006). The size of the energy gap in the semiconductor
determines the intensity of the light emitted. The material of the junction of the
LED also determines the light it emits. Blue, white, true green, and UV types of
LEDs consist of Indium gallium nitride (InGaN), while yellow, red, and orange
LEDs are made out of Aluminum gallium indium phosphide (AlGaInP or AlInGaP)
20
(Arnold, 2006). Basically, the more LEDs we connect to our circuit, the brighter
and more dynamic our light show can be.
The majority of indicator LEDs specify their characteristics at a current of 20mA
with a typical forward voltage of 2-4 volts DC. However, illumination LEDs, such
as the ones we are using in our project, usually have larger junctions and can
draw more current, using more power and providing a brighter output. A standard
drive current for a high power LED is 350mA and will dissipate around 1watt of
power. Another thing we need to examine is the reverse voltage of the LED; it will
conduct current when a forward voltage is applied but not necessarily when a
reverse voltage is applied. We must also verify that the reverse voltage does not
exceed the rating of the LED, because, if it does, the LED may fail. To be safe,
we can design the circuit to provide a 15mA current through the LED. This way if
there are unaccounted for voltage/current variations, excessive heat build-up in
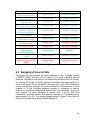
the circuit, or if there is a mounting issue, the LEDs will still work properly. The
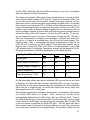
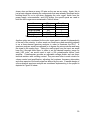
following table, Table 1, summarizes the typical characteristics of each of the
LED’s we will be using in our DLLF project. These particular numbers are for
Digi-Key part number 754-1330-1-ND which is a high-brightness 3 watt RGB
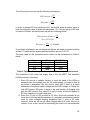
LED manufactured by Kingbright Corporation and can be purchased for $8.16.
All ratings are based on an ambient temperature of 25 degrees Celsius.
Digi-Key Part #754-1330-1-ND Red
Green
Blue
Current (mA)
350
350
350
Peak Forward Current (mA)
500
500
500
Forward Voltage, Average (V)
2.5
3.3
3.2
Power Dissipated (W)
1.05
1.33
1.25
Thermal Resistance (°C/W)
12
9
9
Table 1: Typical characteristics of a high brightness LED
On the other hand, rather than using a combined LED such as the one we found
at Digi-Key, we could have also use three individual LEDs, one red, one green,
and one blue, all with similar characteristics. By purchasing the LEDs individually
rather than as a combined unit, we would have spent more money since they
were anywhere from $5 to $8 a piece.
After meeting several times throughout the semester, we decided to add another
set of three RGB LEDs to our project. Thus, we have six I/O pins on the
microcontroller dedicated to the LED drivers, with one LED per driver. Three of
the LEDs illuminate one of the nozzles while the other three light up the second
nozzle. Each set of LED lights consists of one red, one green, and one blue LED
or we can choose to purchase two RGB LED lights. The only issue with that is
that we weren’t able to find them in a through-hole mount style. They are surface
mount with didn’t coincide with our original design. We are able to either set it up
21
so that the nozzles are both simultaneously lit up with the same color(s) at the
same time or so that they are both illuminated separately. This is done by
choosing the correct program in the microcontroller using the remote control. We
also added manual control switches that allow the user to choose which colors
are illuminating which nozzle. This will all be discussed later in our paper.
However, since we have decided to set the project up this way, we thought we
would purchase individual LEDs. These LEDs will were through-hole mount in
order to make the PCB design easier. After considering all of the requirements of
our project we researched LED prices at Digi-Key as follows: $4.79 each for red,
$6.04 each for blue, and $6.04 each for green. However, after considering the
function of the LEDs and how we would transfer the light to the nozzle via fiber
optic cabling we decided to purchase the RGB combined LEDs. We found them
on ebay for $45 for a set of 5, keeping in mind that we would be testing them.
This way we had extra just in case something unforeseen happened.
In order to power the LEDs, we built six LED driver circuits. Many such circuits
exist and there are many variations to each circuit depending on the type and
size of the LED being used, the lighting requirements of the project, the voltage
provided by the power supply, which microcontroller is being used, etc. Since we
are using a 5 volt DC power supply, we based our circuit off of 5 volts. We also
will be using the PIC 16F887 microcontroller to deliver a signal which will choose
which LED should illuminate and for how long. Each LED is connected to an
output pin of the microcontroller. In a future section, we will also discuss our
addition of a color organ to our DLLF. Once the microcontroller recognizes that
there is a valid audio signal, it will switch to the program that illuminates each
LED based on the frequencies of the audio signal. This type of display is found
on Christmas trees and on other indoor and outdoor lighting displays.
2.2.4 LED Drivers
When driving LEDs most people will suggest that you use a current limiting
resistor in order to protect the LED. However, this is not something that is
required, only recommended. Since an LED is a diode, its current-to-voltage
characteristics are not linear, creating a tricky relationship for any circuit
designer. A certain forward voltage is required in order to turn on an LED and
before that voltage is reached, there isn’t a noticeable change in the current.
However, as soon as that forward voltage is reached, there is a noticeable
change in current which then lights up the LED. From this point forward, small
changes in the voltage result in large changes in the forward current. As with any
other electrical component, when choosing LEDs it is imperative that we choose
an LED with an appropriate forward current for our design. We don’t want to
exceed that current or we may destroy the LED. So, if we place the LED close to
the power supply voltage, the high current would immediately destroy the pngate, which is where the current limiting resistor comes into play. A current
limiting resistor is placed in series with the LED in order to dissipate any current
in excess of that needed for the LED to work correctly.
22
For example, if we choose an LED with a forward voltage of 2.1V, a maximum
current rating of 25mA, and use it with a 5V power supply such as the one we are
using for the DLLF, we would need a resistor to dissipate the remaining 2.9V. In
order to compute the size of the resistor, we must use the standard power
equations below:
=
5 − 2.1
=
= 116Ω
25
Of course, to be safe, we would use a resistor with a value of 120-150 Ohms,
ensuring that we are not driving the LED near its maximum rating. Now, we need
to look at how much current is coming out of the I/O pin on our microcontroller.
According to the data sheet of the microcontroller, the maximum current sourced
by any I/O pin is 25mA. So, if we choose 20mA (slightly less than the maximum),
we need to then take a look at the LED I-V curve and find the voltage, which, for
in this example, is 2.0V. Now, we must recalculate the resistor as follows:
=
5 − 2.0
=
= 150Ω
20
If we choose a 150 Ω resistor, we must now find its power dissipation as follows:
= ∗ = 3V * 20mA = 60
Here, it is desirable to choose a resistor that is rated at ¼ Watt and has a value
of 150 Ohms. We do this for each LED since all have unique current to voltage
characteristics.
Now, in order to save cost and to reduce the number of components on the PCB,
we could have chosen not to use current limiting resistors in our LED driver
circuit. We would do this also to reduce the amount of energy we are wasting
since the resistors will create heat. One way to do this would be to lower the
input voltage and make it closer to the forward voltage of the resistor. Another
way is to use Pulse Width Modulation (PWM). By switching the LED fast
enough, the observer is unable to see it turning on and off, creating an illusion
that the LED is on all of the time. Although we originally thought we would use
PWM for the LEDs, after reviewing the functionality of our LED programs, we are
not going to do so. We were going to use those I/O pins specified for PWM in
order to drive the cutter mechanism but, after further review, we decided to use a
different circuit which will be explained in more detail further on in the paper.
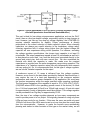
One of the simplest and most inexpensive ways to provide power to a LED
circuit, and the way that is recommended by most, is a constant current source.
Typically, it consists of a small integrated circuit and several other outside
components. The result is a constant current supplied to the LEDs no matter
what type of input voltage exists or what type of forward voltage drop the LED
has, which is especially important to consider when using high-power LEDs such
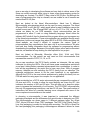
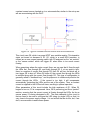
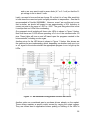
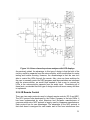
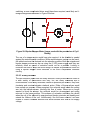
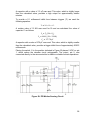
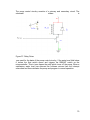
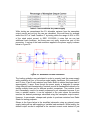
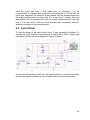
as the ones we are using for the DLLF. Shown below in Figure 10 is a basic
23
constant current source hooked up to a microcontroller, similar to the set-up we
will are encountering with the DLLF.
Figure 10: Typical constant current source with microcontroller
This circuit uses Q2, which is a power NFET as a variable resistor. This transistor
starts out turned on because of R1. Q1, which is a small NPN transistor, is
utilized as an over-current sensing switch with R3 assigned as the “set resistor”
or the “sense resistor” which will trigger Q1 when there is too much current
flowing.
When examining where the main current flows, we can see that it flows through
the LEDs first, then through Q2, and finally through R3. If, at any point in time,
there is a surplus of current flow through R3, then Q1 will turn on which will in
turn trigger Q2 to shut off. When Q2 turns off, the current flow through the LEDs
is reduced along with the current flow through R3. This type of configuration is
generally called a “feedback loop,” and its purpose is to continuously monitor the
current through the LEDs. If the current is too high, it will compensate
automatically, protecting the LEDs and the rest of the system. Thus, a constant
current is supplied to the LEDs at all times, resulting in optimal operation.
Other parameters of this circuit include the high resistance of R1. When Q1
begins to turn on, R1 is overpowered. Here, Q2 is performing just like a “perfect”
resistor, ensuring that the correct current is flowing through the LEDs. As far as
excess power, it is being dissipated in Q2. The main downside to this circuit is
that we need to be sure to configure the LED string (or single LED) so that it is
very close to the power supply voltage. It is not critical that we do this, but, if we
don’t, we are certain to waste some power.
24
To set the current, we can use the following calculations:
!" #$$%& =
3 '(%$ =
0.5
3
0.25
3
In order to prevent R3 from getting too hot, we should select a resistor value at
least two times the value of power we calculated. So, if we are using a LED with
a current of 350mA, we should come up with the following values:
!" #$$%&: 350 =
3 = 0.175 Ω Ω
3 '(%$ =
+.,-
+../-
0.5
3
= 1.43 watts
From these calculations, we can determine that we will need a resistor rated for
at least 1.5 watts and the closest standard resistor value to 0.175 Ω.
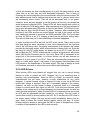
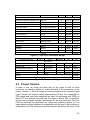
The parts used for this constant current source can be summarized in Table 2
below.
Item
Size
Type/Rating
Q1
Small
NPN
Q2
Large
N-channel
R1
¼ watt
100kΩ
R3
1 watt +
n/a
Table 2: Specifications for parts needed to build constant current source
The limitations of this circuit are largely due to Q2, the NFET. This transistor
limits the circuit in two ways:
1. Since Q2 acts as a variable resistor to meet the need of the LEDs by
stepping down the voltage from the 5V power supply, we need to look at
the power it dissipates. We will need a heat sink if there is a major
difference in the power supply voltage with the LED voltage or if there is a
high LED current. Q2 power is equal to the total number of dropped volts
plus the LED current. Only about 2/3 watt of power should be applied to
Q2 if we choose not to use a heat sink.
2. Since the “G” pin on Q2 is rated for 20 volts, this could normally be an
issue due to the fact that this variation of a constant current source can be
used for input voltages ranging anywhere from 3 volts to 60 volts.
However, since we will not be using voltages above 20 volts, this isn’t a
concern to us. In fact, we will be connecting the circuit to a microcontroller
25
and so we may want to add a zener diode (4.7 or 5.1 volt) so that the Gpin voltage is set to about 5 volts.
Lastly, we need to be sure that we choose Q1 so that it is of very little sensitivity
to heat since the current set point is slightly sensitive to temperature. One that is
recommended is Fairchild 2N5088BU. However, even if we use this part or one
that is similar, we should still expect to see approximately a 30% reduction in
current set point in the range of -20C to +100C. The good thing about this is that
it could protect our LEDs from overheating.
Our proposed circuit including all three color LEDs is shown in Figure 3 below.
Note that there are 6 LED drivers operating off of six of the microcontroller I/O
pins. These lights will turn on and off based upon the programs created in the
microcontroller, including a color organ.
Another set-up for the LED driver is shown in Figure 11 below. Also shown are
the switches we are implementing which, depending on whether each one is on
or off, signal to the microcontroller the appropriate program to run to light up the
LEDs.
Figure 11: An additional configuration to drive our LEDs.
Another option we considered was to purchase drivers already on the market.
These drivers maintain a specific output current by varying the output voltage.
They are utilized best in applications where pulsing or flashing of the LEDs is
26
required. They also require no additional resistors or a heat sink. After doing
some research, one such driver is the 3021 and 3023 BuckPuck LED Power
Module. They are applied to LED circuits as shown in Figure 12 below:
Figure 12: Example of a manufactured LED driver application (Image used
with permission from LuxDrive)
The advantage of using one of these existing drivers is that our LED is
guaranteed to light up since the circuitry inside the driver has already been tested
against specifications. These are also through-hole PCB mounted which fits into
the design of our project. However, the disadvantage is that these are relatively
expensive, especially since we only need one driver to light up one LED (since
we want the LEDs to light up at different times based on color). Since these cost
approximately $13.99 each from ledsupply.com, this option would have been
rather expensive. If we were lighting up a string of 12 LEDs for each color,
however, this would probably have been a more efficient way to go.
2.2.5 Color Organ
Originally, we hadn’t considered adding a color organ to our project. However,
after submitting our initial documentation, it was highly recommended that we do
so. A color organ is a device that converts an audio signal into rhythmic light.
This is similar to a light organ but a light organ does not use different colors to
represent the audio signal. Instead, it varies the brightness of one particular
color of light based on the intensity of the input signal; the higher the sound, the
brighter the light and vice versa. Since our preference was to have more than
one color illuminating our fountain, we designed a color organ, which works by
detecting the various frequencies in the sound medium. Based on the
configuration of the device, it represents each different band of frequencies with
a certain color of light. For example, an audio signal is represented by red light
for the highest frequencies, green light for the middle frequencies, and blue light
for the lowest frequencies. Now, our DLLF appears to “dance” to the sound of
any type of music played!
There are many options for receiving input for our color organ. We can either
attach a device such as an MP3 player, iPod, or computer directly to the
27
microcontroller (after passing through a few amplification stages of course) for
spectrum analysis or we could have designed the color organ to pick up any
desired sound using a microphone. The advantage to using a direct input such
as an iPod is that the device only displays colors based on the audio signal
whereas if we used a microphone, all other types of recognizable sound would
be depicted such as voice, background noise, and miscellaneous noise. The
advantage of using a microphone is that the user will also be able to hear the
noise at the same time the lights are dancing to the noise. If we directly
connected the audio input, this would not be possible. Thus, after careful
consideration, we decided to use a splitter to divert the signal both to the
microcontroller color organ circuitry and to a set of speakers. This way, the user
is able to hear the music at the same time he/she can see the lights “dance” to
the music.
The main operation of a color organ begins with an input signal. After the input
signal, we added an in-series capacitor to couple in the input. This way, only the
AC signal is transferred from one circuit to the next, blocking the DC signal. The
DC bias settings of the two coupled circuits can be isolated. Next, this signal is
sent in to a dual operational amplifier for isolation and amplification. First, there is
an isolation amplifier to provide an electrical safety barrier while providing
electrical isolation. If an isolation amplifier were omitted from the design,
excessive noise would be present and sometimes instrument destruction can
occur. Then, we provided amplification of the signal before it can be applied to
the microcontroller. One such amplifier that we looked at using is the LM1458
dual operational amplifier by National Semiconductor. These two amplifiers share
power supply leads and a common bias network; otherwise they operate
completely independent of one another. Some of the features of these amps are
as follows: short circuit protection, no frequency compensation required, wide
common-mode and differential voltage ranges, and low power consumption.
Some of the characteristics that are important to us were found in the
specifications by National Semiconductor and are shown in Table 3 below.
Dual Operational
Amplifier Features
LM1458
LM1558
Max Supply Voltage
±18V
±22V
Power Dissipation
400mW
500mW
Operating Temp Range
0°C - +70°C
-56°C - +125°C
Typ: 1.0mV,
Typ: 1.0mV,
Input Offset Voltage
Max: 6.0mV
Max: 5.0mV
Table 3: Important characteristics of a dual operational amplifier
Comparing the values of the components of this amplifier, we can see that the
main difference is the operating temperature range. Once the signal has left the
isolation amplifier, we obtain an output voltage by installing a resistor for the
output current to run through. Then, the signal enters the amplification stage.
28
We are utilizing a 50kΩ potentiometer for gain control in the feedback loop of our
gain pot. As we’ve learned in our electronics classes, the most important
equations to consider when constructing an inverting operational amplifier are
listed as follows:
0 ≈ 2 = 0
34
34 =
34
6
56 = 6 × 34 = 34
34
6
89: = −34
34
Once we have converted the signal into a form the microcontroller can work with,
we are applying the signal to an input pin of the microcontroller; the
microcontroller takes each input signal, manipulates it so that it falls into one of
three categories (low band, mid band, high band), and then sends an output
signal to the corresponding output I/O pin to light up a particular LED. We
constructed a basic color organ circuit based on the aforementioned conditions
and it is presented in Figure 13 below:
Figure 13: Typical configuration of the color organ.
When constructing this circuit in Multisim, our microcontroller was not listed so
we chose one similar to the PIC16F887, however the particular microcontroller
29
shown does not have as many I/O pins as the one we are using. Again, this is
just a basic diagram showing the components that were already discussed and a
building block for us to use when designing the color organ. Aside from the
power supply, microcontroller, and LED drivers, the specific parts we used to
build the color organ are summarized in Table 4 below:
Item
Size
Quantity
Resistor
100kΩ
4
Resistor
5 KΩ
1
Dual Op-Amp
n/a
1
Capacitor
10µF
1
Potentiometer
50 KΩ
1
Table 4: Components required to build a color organ
Another option we considered for the color organ was to operate it independently
of the rest of the circuitry. In other words, we could have used something referred
to as a three-channel spectrum analyzer in order to illuminate the DLLF. A
spectrum analyzer would have allowed us to bypass the microcontroller and keep
the signal in the analog form. Taking the audio signal from the input, we would
have run it through three filters. In order to set the desired frequency range for
each LED color, we would need to add a 22k potentiometer before each
amplifier. Potentiometers provide an adjustable voltage divider and are threeterminal resistors with a sliding contact. They are used often in audio circuits for
volume control and amplification, adjusting the loudness, frequency attenuation
and other aspects of the audio signal as desired by the user. A sample design of
a three-channel spectrum analyzer we considered implementing in our project is
depicted in Figure 14 below:
30
Figure 14: A three-channel spectrum analyzer with LED displays
As previously stated, the advantage to this type of design is that the bulk of the
circuitry would be separate from the microcontroller, which would allow for easier
testing and trouble shooting. However, the disadvantage is that the user isn’t
able to control the LEDs through the remote. Also, since we have switches for
the user to manually control the LED programs and these switches are interfaced
with the microcontroller, we would have needed to find a way to connect the
LEDs to the microcontroller separate from the audio input. Considering all of
these facts, we decided that this type of design would cost more money and time
to implement.
2.2.6 IR Remote Control
There are two major protocols used in infrared remote controls, RC-5 and NEC.
The RC-5 protocol was developed by the Philips Company in the late 1980s. It
has been implemented by most American and European manufacturers of
consumer electronics. NEC protocol is largely used by Japanese manufacturers.
Each protocol has its own advantages. The advantage of the NEC protocol is
that each brand is assigned its own header and is free from interference from
31
another brand’s remote. The advantage of the RC-5 protocol is that any remote
used to control a particular type of device, i.e. a television, can control any other
television using the RC-5 protocol.
For ease of programming and availability of resources, we chose to use the RC-5
protocol for our project. The RC-5 protocol uses bi-phasing modulation on a
carrier of 36 KHz. All bits of the infrared pulse have an equal duration, 1.778
milliseconds. Half of the bit time is filled with a burst of the carrier and the other
half is idle. A logical 1 is represented by the first half of the bit time being idle and
the second half filled with the carrier. A logical 0 is represented by the first half
filled with the carrier and the second half is idle. Each command utilizes fourteen
bits as depicted in Figure 15 below. The first bit is the start bit which is allows a
logic 1 to allow the receiving IC to set the gain. The second, or field bit, denotes
whether the command sent is in the lower field (logic 1 = 0 to 63) or the upper
field (logic 0 = 64 to 127). Third bit is the control bit, which toggles with each
button press. This allows the receiver to distinguish between subsequent button
presses. The next five bits are used for the address that selects one of thirty two
possible systems. The final six bits are the command bits, which represents one
of the possible 128 commands.
Figure 15: RC-5 Protocol Pulse Train (Image used with permission from
San Bergmans)
The electrical portion of the infrared remote control is very simple consisting of an
infrared receiver, TSOP4838 from Vishay semiconductors, and a resistor and
capacitor to improve the robustness of the circuit. The majority of the work done
to incorporate an infrared remote control is accomplished in the microcontroller.
2.2.7 Motion Sensor
From the most sophisticated laser beams to the simplest infrared detector, the
sole purpose of motion detection systems is to detect some “body”. The sensing
of motion can be something at a very specific location (local) or in a larger area.
Local motion detection can be accomplished through active infrared (light
beams), contact or tilt switches, proximity sensors or strain/stress sensors, while
area detection is accomplished through passive infrared, proximity sensing,
microwave/radar, ultrasonic wave detection, vibration or video. For our project we
required some form of area detection around the fountain. With this in mind we
researched ultrasonic, microwave, video and passive infrared detection
technologies for our motion detection method.
32
2.2.7.1 Video
Video motion detection uses a closed circuit television system. The monitoring
system constantly scans the images from the cameras for changes in the
ambient light to detect motion. These types of systems were too expensive and
overly complicated for the needs of this project. The idea of using video to detect
motion was quickly discarded as a viable means of detection.
2.2.7.2 Ultrasonic
Ultrasonic motion detectors generate ultrasonic waves and recognize disruptions
in the waves to detect motion. When someone enters the area of detection
waves are reflected resulting in a change in the wave pattern and signaling
motion in the area. While ultrasonic sensors are relatively inexpensive they are
prone to false motion detection signals caused by excess air currents that disturb
the wave pattern. Our application requires an outdoor installation, so we felt that
this type of sensor was not the best choice for our project.
Figure 16: Ultrasonic motion detector (Image used with permission from
the Cypress Semiconductor Corp)
2.2.7.3 Microwave
Microwave detectors use the same principles of detection as ultrasonic except
that they use a much higher frequency wave. These higher frequency waves can
penetrate all construction materials, i.e. brick, wood, concrete and drywall. With
this added sensitivity, we felt that this sensor would also provide too many false
motion detection signals.
2.2.7.4 Passive Infrared
Passive infrared detection circuits detect the infrared radiation given off by all
objects. To detect motion, the sensing circuit will compare the infrared signal
33
from two sensors and, by using the differences in infrared radiation, detect
motion. This type of sensor is shown in Figure 18 below.
Figure 17: Passive Infrared (Image used with permission from the
Panasonic Co.)
The passive infrared motion detection was the easiest and most cost effective
method to implement for our project. Once this method was selected, we needed
to research sensors and the supporting circuitry to interface them with the
microcontroller. We wanted to be able to detect motion from at least ten feet
away and with a horizontal field of coverage at least ninety degrees.
We came across several sensors from different manufacturers. To maximize the
effectiveness of the motion sensor, we needed as wide a field of coverage as
possible in both the horizontal and vertical axis as well as long range and slow
movement sensitivities. We utilized Google, Newark and Digi-key’s websites to
narrow down the selection based on our voltage and range requirements. We
found sensors from Panasonic Electric Works, Murata Manufacturing Co. and
Nicera Philippines Inc. that met our basic requirements.
The selection was further narrowed down by price; the sensor from Panasonic
Electric Works was immediately eliminated because it cost over one thousand
times as much as the sensors from Murata Manufacturing and Nicera
Philippines. Next we compared the horizontal and vertical detection angles of the
remaining sensors. The sensors from Murata have a viewing angle of 45º left and
right of center. The sensor from Nicera has a viewing angle of 62.5º left and right
of center; the Nicera sensor has the advantage over the Murata sensor. Finally,
we looked at the cost of the sensors and their respective Fresnel lenses. The
Nicera sensor and lens were both cheaper than the Murata sensor and lens.
Knowing all of the factors, we chose to use the Nicera Philippines RE200B
pyroelectric passive infrared sensor coupled with a Fresnel lens for our motion
detection circuitry.
34
A Fresnel lens is plano-convex lens, meaning one side is flat and the other is
convex, which has been flattened while retaining its optical characteristics. This
is shown in Figure 19 below.
Figure 18: Fresnel vs. Plano Convex Lens (pending permission from
Questex Media Group)
The lens is now thinner and has had its absorption losses reduced. The flat white
window seen on motion detectors is the flat side of the Fresnel lens. The lens
condenses the incoming light allowing for a longer detection length. So that there
are not just two large rectangle sensing areas, the lens is comprised of multiple
sections. Each of these sections is a Fresnel lens which creates multiple smaller
detection areas. With different faceting and sub-lenses the overall lens creates a
range of detection areas that are interleaved with one another. These detection
areas are then focused onto the sensor as seen in Figure 19 below.
Figure 19: PIR Sensor with Fresnel Lens (Image used with the permission
of the Cypress Semiconductor Corp.)
These focused beams allow the sensor to have larger coverage areas and
greater depth of coverage within these areas. Using the Fresnel lens in
conjunction with the passive infrared motion sensor greatly enhances the
35
functionality of our overall design and allows us to conservative energy and
resources when the fountain is not being viewed by anyone.
2.2.8 Ambient Light Sensor
During the daylight hours the light from the LEDs is not very visible. In order to
conserve energy, the LED drivers are turned off during this time. In order to
accomplish this task we implemented a day/night sensor circuit to provide input
to the microcontroller. There are two photosensitive components we looked at to
use in our day/night circuit, the light dependent resistor and the phototransistor.
Light dependent resistors, or photoresistors are resistors that decrease their
resistance with increasing light intensity. Light dependent resistors, or LDRs, are
made of highly resistive semiconductor materials. As the light intensity increases
on the LDR, bounded electrons absorb enough energy to jump to the conduction
band. This addition of these free electrons in the conduction band causes the
overall resistance of the LDR to decrease. LDRs based on cadmium sulfide
(CdS) have a sensitivity curve that closely resembles the sensitivity response of
the human eye. LDRs have a range of resistance from less than 100 Ω when
fully illuminated to greater than 10 MΩ in darkness. LDRs can be found in various
applications such as clock radios, security alarms, and street lights.
There are several factors that limit the applications of LDRs. The resistance of
the sensor is dependent on the thick film microstructure of the semiconductor
material. This allows for a wide tolerance in the sensor’s resistance. The
resistance also has a long term memory which is governed by the amount of light
the sensor is exposed to and the light history of the past several days.
Phototransistors are transistors designed in a transparent package that allow the
light to bias the transistor. The base current of the transistor is generated by light
striking the base collector junction of the transistor. As base current is generated,
we see a marked increase in the collector current. This built in gain allows the
device to accommodate TTL level voltages for a wide range of light levels.
Phototransistors are sensitive to light wavelengths from 300 nm to 1100 nm; this
spectrum range fully encompasses the visible spectrum of the human eye.
Phototransistors also have a quicker response time than that of the light
dependent resistor.
Since the cost of a phototransistor and a light dependent resistor are comparable
to one another and the better overall response is received from the
phototransistor, we chose to use the phototransistor for the basis of our ambient
light sensor circuitry.
To select the phototransistor necessary for our design, we set up a few basic
requirements such as wavelength sensitivity, dark current, viewing angle,
mounting style, and cost. For the wavelength rating, we wanted a transistor that
was sensitive to the same wavelengths that are visible to the human eye. Since
the human eye can typically see wavelengths from 380 to 750 nm, we wanted a
phototransistor with wavelength sensitivity centered about a wavelength of 565
36
nm. Phototransistors are commonly made from silicon, germanium, indium
gallium arsenide, and lead(II) sulfide. Phototransistors made from silicon have
wavelength sensitivities from 190 to 1100 nm and germanium phototransistors
have sensitivities that range from 400 to 1700 nm. Phototransistors made from
indium gallium arsenide (InGaAs) or lead(II) sulfide (PbS) have wavelengths that
fall outside of the useful range of our project. The range of spectral sensitivity
from silicon phototransistors covers the range of wavelengths we desired so we
concentrated our research on silicon based phototransistors.
We wanted to keep the dark current rating as low as possible. The dark current is
extremely temperature dependent and limits the minimum static light level that
can be reliably detected; the lower the dark current rating, the greater the
accuracy of our detector. As for viewing angle, the wider the better; however
since we are only looking to detect ambient light and not the light of a very
specific area, this requirement carried less importance. Using these criteria we
narrowed our choice down to Vishay Semiconductor’s TEPT4400. This
phototransistor met all of our criteria and it is a low-cost device as well.
2.2.9 Nozzle Flow Cutter Mechanism
The cutting mechanism portion of the flow nozzle is used to redirect or block the
laminar stream of water leaving the flow nozzle. Several factors were taken into
account before we could settle on any one particular design. The factors involved
are the overall size of the mechanism, speed as it moves to block the water
stream, voltage and power requirements of the actuator, the control circuitry to
activate the mechanism, its ability to withstand the environmental factors it will be
subjected to, and cost.
Overall size of the mechanism was important because it is mounted directly on
top of the flow nozzle. Since we’ve decided to go with smaller nozzles in order to
reduce the size and cost of the water pump, we have reduced the available
mounting surface area available for the cutting mechanism. The next factor we
considered is speed, if the cutting mechanism is too slow it will cause turbulence
in the stream’s leading or trailing edges, causing the stream to break apart. While
this does not affect the nozzles operation, it diminishes the aesthetic effect of the
fountain as a whole. As we are utilizing a single voltage power source in our
design, the actuator must operate using 5 VDC or less. Each of the different
actuating methods we looked at required a different type of control circuitry.
These control circuits range from a bipolar stepper motor driver to a simple DC
circuit to actuate a linear solenoid. Once again the voltage requirement of the
control scheme selected is limited to 5 VDC. Cost is the final factor which must
be addressed. As a group we are solely funding this project, therefore we have
agreed to use the most economical methods and parts when designing this
project.
After taking each of these factors into account we had the following methods of
actuation as viable solutions: linear solenoids, stepper motors, servo motors and
rotary solenoids.
37
2.2.9.1 Linear Solenoids
Linear solenoids are readily available, come in a wide variety of specifications,
and are relatively easy to interface with a microcontroller. We had two main types
of linear solenoids to choose from, push or pull. In the design, we considered a
linear solenoid which, when energized, would push a blade/arm into the stream
of water to block it. It would then spring return to the unblocked position when deenergized. This configuration would have left the solenoid de-energized most of
the time thus preventing the coil from overheating and extending its useful
lifetime.
Next, we took into account the solenoid’s ability to function in an outdoor
environment. While measures will be taken to minimize the occurrence, it is
inevitable that at some point the solenoid will get wet. To this end, if an open
frame solenoid were implemented it would require added environmental
protection through some kind of housing or shielding. To eliminate this
requirement, we focused our research on tubular solenoids which completely
house the coil of the solenoid. This eliminated the need of additional housing or
shielding thereby reducing cost and the overall footprint of the cutting
mechanism. Unfortunately, we were unable to find a suitable solenoid that would
operate on a 5 volt supply.
2.2.9.2 Stepper Motor
The next possible solution was to use a stepper motor. Stepper motors can be
precisely positioned without the need of feedback. This would have allowed us to
move the cutting arm into and out of the water stream with a high degree of
accuracy. There are three main types of stepper motors: permanent magnet,
hybrid synchronous and variable reluctance. Most of the hobby stepper motors
we researched were permanent magnet stepper motors. These stepper motors
were generally two phase stepper motors, meaning they either had unipolar or
bipolar winding arrangements for the electromagnetic coils. Each of these
configurations has its advantages and disadvantages.
The unipolar stepper motor has the advantage of a simpler control circuit as you
do not have to switch the direction of current through the windings in order to
reverse the pole of the electromagnet. There are two windings per phase, one for
each direction of the magnetic field. This would have relieved us of the need to
switch the direction of the current through each of the windings. The drawback to
this scheme is that only 50% of the windings are utilized, therefore the
performance is low to moderate, but it also generates less heat. The lower
performance of the unipolar motor was not a concern for this application because
we would only be moving the motor to two locations and even that would only be
on an infrequent basis.
The bipolar stepper motor has the advantage of utilizing 100% of the windings
and therefore provides more holding torque. This advantage is not necessary for
our purposes. With only one winding per phase, the current through the phase
must switch direction in order to reverse the magnetic poles. To accomplish this
38
H
switching, a more complicated driver would have been required, most likely an HBridge arrangement as shown in Figure 20 below.
Figure 20: Bipolar Stepper Motor (Image used with the permission of Cyril
Buttay)
The use of a stepper motor would have also require it to be shielded or sealed
against the environmental conditions. While sealed stepper motors can be found
found,
the added cost must be factored into the selection process. Both the unipolar and
bipolar stepper motors can be rrun
un using the 5 VDC power supply and they are
relatively
ly small so speed of actuation would not be a problem. Looking to
minimize cost and to kkeep
eep the driver design as simple as possible we ruled out
using a bipolar stepper motor because of the more complicated controller
circuitry.
2.2.9.3 Rotary Solenoid
The nextt actuation option was the rotary solenoid. Rotary solenoids also come in
a wide variety of specification and they
they, too, are easily interfaced with a
microcontroller. With rotary solenoids
solenoids, instead of push and pull actions,
actions they have
clockwise and counterclockwise rotational acti
action.
on. Either of these actions would
have suited our purpose. When ene
energized, the solenoid would rotate the cutting
arm into the laminar stream
stream, blocking the flow of water. When we no longer
wanted to block the stream, the solenoid would be de-energized
rgized and spring
returned to the home positio
position. This scheme of actuation minimize
izes the period
when the coil of the solenoid is energized and thereby minimize coil heating and
extend the lifetime of the coil. Unfortunately, like the linear solenoid
solenoid, we were
unable to locate a suitable solenoid that would actuate with such a low suppl
supply
voltage.
39
2.2.9.4 Servo Motors
The final actuating method that was available to us was the servo motor. Servo
motors are motors that are mechanically linked to a potentiometer; the internal
electronics convert a pulse width modulated signal into a position command.
Once the signal is received by the internal electronics, the motor is energized
until it the potentiometer reaches the desired value corresponding to the signaled
position. The desired position is determined through the width of the pulse
received by the servo. A pulse width modulated signal can easily be developed
using the pulse width timer in a microcontroller or through a simple driver circuit
using a basic timer microchip like the LM555.
The servo motor also allows us to accurately position the cutting arm without the
need for feedback circuitry. The servo motors are generally small in size, high
speed servos are readily available, most servo motors run on a 5 VDC supply
voltage, and the control circuitry is designed with or without using one of the
pulse width modulated outputs from the microcontroller. Basic servo motors used
in radio controlled hobby designs are inherently designed to withstand the
environmental factors that that our project subjects them to. The only prohibitive
factor against the use of the servo motors was the cost as compared to some of
the other actuator choices.
Based on our research it appeared that, in order to maintain a single voltage
power supply scheme and to keep costs down, the use of servo motors was our
best option. After all of our research was completed, we selected a HITEC HS56HB servo. This servo has a 0.12 second/60º speed rating and 13.88 oz-inch
torque specifications. The servo has the following dimensions (units are in mm):
Figure 21: HITEC HS-56HB Servo Dimensional Drawing (Image used with
the permission of the HITEC RCD USA)
40
2.1.9 Fiber optic to LED interface
In order to transfer the light from the LED’s to the laminar flow cutter, we are
using the LED/Fiber coupler shown below.
Figure 22: LED to Fiber Coupler (pending permission from Fiber Optic
Systems Inc)
The coupler sits over the LED and creates an interface between the LED and
fiber cabling. Through this coupler, the light from the LED travels down the fiber
cabling to the laminar flow cutter. At that point the light is transferred to the water.
2.2.10
User interface
The user interface allows the user some basic controls over the fountain system
for both aesthetic and troubleshooting purposes. We are integrating basic
ON/OFF controls for each of the primary colors of the LEDs, the ability to deenergize the entire system, the ability to power up and down the water pump,
and the ability to control the cutting mechanism of each nozzle. To accomplish
most these basic tasks, the microcontroller is only required to receive 1s and 0s,
i.e. 5 or 0 VDC, at the appropriate digital I/O point to carry out the desired action.
For the system and pump power control we are incorporating basic toggle or
rocker switches, with sufficient voltage and current ratings, to control the AC
power to each of them respectively. As for controlling the LEDs and the cutting
mechanisms, the main design limitation was to ensure that it was an intuitive
design for ease of user operability and functionality. There is one other main
factor we took into consideration beyond the electrical specifications, and that
was cost. We researched several possible solutions from simple toggle switches
to graphical LCD touch panels.
2.2.10.1
LCD Touch Screens
Liquid crystal display (LCD) screens come in almost any shape or size. They can
be custom made to suit most needs. Used in conjunction with touch pad
overlays, they can create a touch panel. The LCD screens are segregated into
two main categories, alphanumeric which only display alphanumeric characters,
and graphic displays which can display bitmaps and alphanumeric characters. A
graphic LCD (GLCD) touch panel with a bitmap could have been used to supply
the user interface. We briefly looked into using a GLCD touch panel but we
41
quickly determined that the material cost, added programming, and the amount
of I/O required to implement this configuration was not cost effective or
necessary as it would have only been a secondary user interface in the event
that the infrared remote control was no longer working.
2.2.10.2
Manual Switches
In lieu of using the GLCD touch panel, the next logical choice for the user
interface was simple electromechanical switches. The switches we needed for
our project were one of the very last items we researched. There is more to
switch selection then just ON and OFF. There are four basic steps we used to
select the appropriate switch. They were user needs, engineering limitations,
actuator type, and ensuring that the switch is robust enough to withstand the
environment in which it is operated in. Following these basic steps ensured that
our switch selection satisfies all the needs of our project. The first step was to
see how the user interacts with the interface. A poorly designed interface can
prevent a great idea from ever being utilized because it is too difficult for the user
to use or understand. We looked at what size would be appropriate and how
often it would be used. For instance the system and pump ON/OFF switches are
going to be used more often than the backup switches used to control the lighting
sequences, and therefore they are larger, easily accessible, and clearly labeled.
After determining the user needs, we next considered the engineering limitations
of each switch. Knowing the load requirements is essential for proper switch
selection. Is the load inductive or resistive? What voltage and currents are being
passed through the switch? Contact materials and power ratings are important.
What kind of mounting is necessary? How much space is available? What types
of terminations are required and or desired? All of these questions placed some
type of engineering limitation that we considered before selecting switches.
The third step was determining actuator type. There are a wide array of options
to fit any and all design needs. There are pushbuttons, toggles, rockers, sliders,
rotary, momentary or maintained, illuminated or non-illuminated and they all
come in various colors and sizes. Each style has its own unique use and, if
chosen correctly, can serve to enhance the user interface.
The final step was ensuring that the switch withstands its environment. Our
switches are located in a suitable enclosure for outdoor use. Since we live in
Florida, the switches see temperatures in excess of one hundred degrees and
high humidity as well. We needed to ensure that each switch met the appropriate
IP code rating. For example IP 65-rated switches protect against dust and direct
high-pressure sprays of water, and IP 67-rated switches protect against
temporary immersion in up to 1 m of water. At the other end of the spectrum, IP
60-rated switches only protect against the ingress of larger, solid objects such as
dirt.
The most electrical rating sensitive switches are the system and pump power
switches. The water pump for our project has ratings specified by the
42
manufacturer. The project utilizes a 110 VAC, 60 Hz, single phase, 0.5 hp, 0.37
KW centrifugal pump. This means that it has a running current of approximately
3.4 amps. Since the motor on the pump is an inductive load we were concerned
about the in rush current; in rush current being the initial instantaneous maximum
starting current of a device. An AC electric motor can draw several times its full
load current when it is first energized. If the switch were undersized for this
current, the contacts would be fused together. To keep this from happening, we
selected switches based on not only the running current and rated voltage but
the power requirement of the pump as well. To this end we selected a nonilluminated rocker switch, part number YRM22S2DBRNN, from the Cherry
Corporation that was rated for 125 VAC, 20A, ¾ HP. This switch is slightly
oversized for our needs but we were unable to find a suitable switch at exactly ½
hp rating. Since it is always safer to oversize the ratings of a switch than
undersize them, we felt this was a satisfactory solution.
The next switch we looked at was the AC power to the 5 VDC power supply
switch. Since all of the loads on 5 VDC power supply can be treated as resistive
loads sizing of this switch was much less complicated. We used the maximum
output voltage and the maximum current output from the linear voltage regulator
in the power supply of 5V±3% and 3A to appropriately size this switch. Using
these ratings we selected the C&K Components 125 VAC 4A non-illuminated
rocker switch part number D102J12S217DQA from Digi-Key Corp. Knowing the
ratings for this switch and the pump power switch, we know that we can also use
the same switch from the pump to control the AC power to the entire system.
This switch allows us to turn off all systems at one time.
For the manual control of the individual nozzle cutter mechanisms, we felt that a
momentary pushbutton was the best actuator type. Since we did not want the
water streams continuously blocked but pulsed to give the appearance of the
water “jumping,” this style offered the most intuitive solution. Using the criteria of
a momentary pushbutton with a normally open contact was the basis for our
search. For aesthetic reasons and for clarity we chose a round pushbutton to
help differentiate the nozzle switches from the system and pump power switches.
The normally open contact inputs a logical 0 to the microcontroller during normal
operations and when the nozzle cutter is to be closed the pushbutton is
depressed and a logical 1 is sent to the microcontroller to actuate the cutter
servo motor. When the button is released the cutter will travel back to the
unblocked position.
The final switches we needed were the switches to provide digital inputs to the
microcontroller for user selections. While these switches are a backup method of
control, we still needed to follow the four basic steps of switch selection. These
switches allow the user to manually select the preprogrammed lighting
sequences or to manually control which LEDs are continuously on or off in lieu of
the infrared remote control. Due to the large number of digital inputs required to
provide this functionality, the switches needed to be relatively small but still easy
to operate. The electrical ratings for the switches were not hard to meet since
43
they are only passing 5 VDC and virtually no current. The actuator style we
decided that would provide the necessary functionality for the user and would
easily satisfy the electrical rating requirements is the dual-inline package or DIP
switch. This type of actuator also alleviates the need to allocate a relatively large
space to accommodate so many switches. Again, like the other switches utilized,
the DIP switches are mounted inside the enclosure; this precludes the need to
make them weather resistant as they are fully protected from the elements.
2.2.11
Pump Controls
To control the pump we have installed a relay into the voltage supply line for the
pump. Our original goal was to try and accomplish this without using a float
switch. This lead us to research a circuit that had 2 exposed metal probes set at
different depths. When the water was at an adequate level the circuit was
complete, causing a closed path for current. We found a schematic on
instructable.com that achieved this circuit with 3 volts, one NPN transistor, 2
resistors and a potentiometer. When the water fell below the acceptable level,
the LED went out indicating to the user that it was time for a water refill. Due to
the changing conductivity of tap water, the potentiometer could be adjusted for
proper circuit operation.
However, there were a few problems with this circuit. While it indicated to the
user that the water was at an acceptable level, it didn’t turn off the pump when
the LED extinguishes. Modification of this circuit could have been considered, but
after discussion, it was decided that placing exposed metal rods into water and
then applying voltage would probably not be the best idea. If our fountain was
fully enclosed and not exposed to human interference, this idea may have been
worth further exploration.
Next, we decided that a float switch would most likely be the most efficient
method of pump control. Float switches come in 2 designs, normally open and
normally closed, and many float switches can be modified to run in either mode.
For our purposes we needed a float switch that is normally closed and only
opens when water levels fall below the determined safe zone. We accomplished
this by attaching the float switch to the side of the fountain basin; when the float
switch changes states, the power to the pump is deactivated. We looked for a
float switch that operates at 5V; this float switch is in series with a 5V relay that
controls the pump. It would have been possible to just place the float switch in
series with the pump and not use a relay, but when pumps start they can draw up
to 10 times their steady state current. This can lead to quick destruction of a float
switch. So, in order to avoid this condition, we placed the float switch on a circuit
that is isolated from the pump. This isolation will extend the life of the float switch.
Float switches come in many variations and many materials. For our purposes,
we needed as inexpensive a float switch as possible. Looking at aquarium
enthusiast websites gave use more economical options then the plumbing sites.
In researching the circuit, we found a design for a relay circuit on
http://lava.lounge111.net/diy_water_level_alarm.htm. This circuit, with some
44
slight modifications, was ideal for our applications. The following circuit is the
unmodified circuit from the lava lounge site:
Figure 23: Living Lava Low Water Level Alarm (pending
pending permission from
Living Lava)
We modified the circuit to contain a 5 volt relay instead of 12V. This allowed
allow us to
use the same voltage for all circuitry on the PCB. Our circuit also does not
contain the push button shown in the lower portion of the schematic.
We decided to use the ii-float
float switch from Aquahub (FLT001) This float switch is
normally closed, but can be changed to normally open. The max switching
voltage is 220VAC and max switching current is 2.5A. These spec
specifications are
more than sufficient for placement into our 5V line. According to the
manufacture’ss specification sheet: “When the float drops to within .12” (+/
(+/- .04”)
of the bottom clip, the internal reed contacts draw together and complete a
circuit. When
en the float rises .20” (+/
(+/- .04”) from the bottom clip, the contacts
separate and open the circuit.” Because this is the normal operation of the float
switch, we changed the operation by taking off the fl
float
oat and inverting it. This
allows the float switch to operate in the manner we need to complete our circuit.
We also eliminated one of the float switches shown above. The above design
uses two float switches to monitor the water level b
between
etween 2 distinct water levels.
Since
ince we are only concerned with the llow
ow level consequences,
consequences we are not
monitoring a high level situation.
The relay we are using must handle normal household power on the secondary
circuit. A single pole single throw circuit (SPST) is sufficient in this design.
design In
conducting research we found that there were many SPST relays to choose
from, but when we started narrowing our parameters to include only those relays
that function normally closed, our options dwindled fast. The relay we found was
45
from Omron and is the G6B-2114P-US5. It is a SPST normally closed relay that
supports up to 5 amps on the secondary coil. This is important because the
pump is rated for 3.4 amps. This relay is a though-hole board mount part.
2.2.12
Printed Circuit Board
As part of our project we designed a PCB that will house all of our circuitry. We
needed a PCB of sufficient size to contain the following circuitry:
•
•
•
•
•
•
•
LED drivers
Microcontroller circuitry
Peripheral interface
Pump controls
DSP circuitry
5V Power Supply
Color Organ
Because of our limited knowledge of PCB fabrication, we needed first to research
what exactly is involved in fabrication and the terminology used to discuss this
topic. Xilinx has a PCB designer’s guide for the Virtex-5 FPGA, although we are
not using the Virtex-5 FPGA, the information in the introductory chapter covers
PCB design basics. The designer’s guide states “PCB technology has not
changed significantly in the last few decades. An insulator substrate material
(usually FR4, an epoxy/glass composite) with copper plating on both sides has
portions of copper etched away to form conductive paths. Layers of plated and
etched substrates are glued together in a stack with additional insulator
substrates between the etched substrates. Holes are drilled through the stack.
Conductive plating is applied to these holes, selectively forming conductive
connections between the etched copper of different layers.”
We determined the number of layers needed for our design. The number of
layers is determined by number of signals, and how many power and ground
planes are used. We attempted to keep the most simplistic approach to our
fabrication in order to keep our costs down. As the number of layers increase, the
cost of the PCB also increases. We have a 5V power plane and a ground plane.
If we adhered to the Virtex-5 guidelines we would have been looking at a
minimum of 4 layers. One layer would be for ground, one layer would be for 5V
power, and the third layer would contain our signal layer. Normally the signal
layer is sandwiched between the power and ground layer in order to isolate the
signals from external noise.
While researching the PCB development process, we realized that on our
constrained budget it would be difficult to economically design a multilayer board.
We researched the following options for possible PCB fabrication firms: PCB123,
4PCB and ExpressPCB, as well as a Do-It-Yourself method.
PCB123 allows the user to download their software for free, design a board and
have it fabricated within a short amount of time. The pricing structure is straight
46
forward and listed on the website in an open manner. The website states that a
single sided PCB can be turned in one day, for an order smaller than 75 PCBs.
PCB123 allows designers to design boards up to 6 layers. This allows for
increased complexity of our board design, but, as the number of layers
increases, so does the price. One aspect of PCB123 that is appealing is their
large parts library. When designing a board, it is important to have the proper
footprint for the part you are installing. By working with software that includes a
large number of parts, the chance of us using the incorrect footprint significantly
decreases. The software also does real time parts pricing from DigiKey. This
aspect is appealing because it allows us to create our PCB and simultaneously
create a parts list for ordering the needed parts. PCB123 also offers a discount to
unsponsored senior design groups of $100. This discount is appealing in light of
the fact that our sponsorship for this project fell through.
The second company we looked at for PCB fabrication was ExpressPCB. This
company offers all its own software for free download, which is similar to
PCB123. They recommend using their software to create a schematic first, then
linking the schematic to the PCB to make the design process easier. They offer
an array of different types of boards from single to double sided and varying
sizes as well. They do not however offer 6 layer boards, but given our lack of
actual PCB design knowledge, we know that we aren’t designing a board of that
magnitude. ExpressPCB offers what they call a Standard MiniBoard for a fixed
price of $51.00 this would include 3 identical PCBs that are 2 layers and
3.8X2.5in. However, if we were to have varied from this standard size the pricing
structure becomes less straight forward.
The formula they use for the standard 2 layer board is:
The cost of your PCB order depends on the size and quantity of the boards. Our
pricing formula is: $55 + ($0.65 * NumberOfBoards * BoardAreaInSquareInches)
+ ($1.00 * NumberOfBoards).
That means that two 3x5 boards cost $77, whereas one 3x5 two layer boards
from PCB123 cost $48.50.
The last company we looked at was 4PCB. 4PCB offers the same benefits as the
previous 2 companies with lower prices. They have downloadable software for
schematic and PCB design, but at a substantially lower cost. For Senior Design
students they offer a $33.00 two layer PCB. This PCB can be any size up to 60sq
inches. And they also offer a four layer board for only $66.00. The only
drawback to using this company is the 2 week lead time on all purchases, but
with proper time management this should not be a make or break issue.
We also looked in to a Do-It-Yourself PCB method; we could have used a pressand-peel PCB transfer system. This process would have allowed us to
manufacture a PCB in our homes. Once the PCB design is laid out using a PCB
design program, it would be printed to special press-and-peel paper using a laser
jet printer. The press-and-peel paper is a Mylar backed paper that inhibits the ink
47
from absorbing into the paper and drying after printing. The laser jet printer ink
would then be transferred to a clean copper clad PCB board using a heated iron.
It is very important to be sure the copper clad PCB is clean. Once the PCB is
fully cooled the press-and-peel paper is pulled away leaving an imprint of the
routing on the PCB. The PCB is then soaked in a muriatic acid solution to
remove the exposed copper. Then the board is cleaned, drilled, and prepared for
component mounting. Although this method appears to have quite a low cost, the
incurred cost would be in dealing with chemical and adhering to the proper
hazmat disposal methods for the spent acid which would contain copper (a heavy
metal). We would have also been responsible for the drilling of the through holes;
lacking the proper equipment to make these holes would result in greater cost for
purchasing the appropriate equipment. Oxidation also occurs quickly, and we
would have had to purchase a sealant in order to protect the copper runs.
After careful consideration, it was decided it would best benefit us to have a
manufacturing company spin our PCB. Our largest constraint in this project was
price. Comparing the manufacturing companies led us to choose the most
economical option; 4PCB was our choice for our PCB fabrication needs. At the
point of our research, we were unsure of the dimensions of our PCB. 4PCB
allowed us the flexibility to change the sizing of our board without changing the
price we will be paying for the board as long as we stay within the 60sq. inches
specified by 4 PCB.
2.2.13
Enclosure
The enclosure is responsible for housing the Printed Circuit Board Assembly.
This assembly will be slightly larger than 60 square inches so that it can house
our PCB and other circuitry. Because we are certain of the maximum size of the
PCB, we chose an enclosure that comfortably houses the PCB and the attaching
hardware. Because of the risk of electrostatic damage to the PCB, the enclosure
we chose is ESD safe. To conform to our pricing structure we did not spend more
than $15.00 on an enclosure.
2.2.14
Fiber Optic Transmission Lines
Fiber optic transmission lines are made of either plastic or glass. The light is
transmitted down the fiber. A fiber optics cable usually consists of a core,
cladding, coating, strengthening fibers and a cable jacket. Because our
transmission lines are placed within the laminar nozzle, we chose the smallest
diameter cabling possible to transmit the light. Will have 2 transmission lines,
one for each LED/nozzle.
2.2.15
Laminar Flow Nozzle
Laminar flow of any fluid agrees roughly with our innate sense of "smooth;" it is
non-turbulent flow, flow free of swirls, eddies, back currents, or other
disturbances. A completely laminar flow has no flow normal to it, only along it.
When the flow is laminar, the flows in the stream are parallel and for flow
48
between two parallel surfaces we consider the flow as made up of parallel
laminar layers. In a pipe, these layers are cylindrical and may be called stream
tubes. In laminar flow, no mixing occurs between adjacent layers and it occurs at
low average velocities.
We chose to build our nozzle from basic supplies you could find in any home
improvement store. The main body of our nozzle was constructed from four inch
SCH 40 PVC pipe. SCH 40 PVC can easily withstand pressures in excess of two
hundred pounds. This rating well exceeds the maximum discharge pressure of
our pump. It is also relatively inexpensive as compared to any other potential
building materials such as acrylic tubing or stainless steel piping. The nozzle also
requires a means of reducing the velocity of the water entering. We considered
several types of materials from foam filter pads for ponds to basic foam sponges.
We chose basic foam sponges due to their low cost and availability. In order to
straighten the water flow so that it is all traveling in the same direction and
roughly the same speed we are using plastic straws.
As the water enters the large diameter of the nozzle body, it is moving at different
speeds and direction, i.e. very turbulent. In Figure 24 below, we can see that the
velocity of the water near the edges is travelling slower than the water in the
center due to friction along the walls of the pipe. Having the water enter the
straws forces the water to travel in a single direction and shapes the velocity
profile of the water. As the water travels through the straws its velocity profile
becomes more parabolic in nature. When all of the individual streams of water
exit the straws they have similar velocity profiles. These streams then mix
together creating a uniform velocity profile across the entire nozzle, essentially
averaging the speeds of the individual straw flows. When the water reaches the
exit of the nozzle it is all traveling at roughly the same speed and direction thus
creating a laminar stream of water.
Figure 24: Velocity Profile of Laminar Fluid Flow (Image used with the
permission of Dr. Richard E. Klabunde)
49
To ensure that the stream remains as laminar as possible as it exits the nozzle,
we constructed the outlet of the nozzle as a smooth tapered hole. This minimizes
the surface area that the stream is in contact with as it leaves the nozzle. With
the surface area reduced, there is less friction on the outer edge of the stream
which has a minimal effect on the velocity of the outside laminar layers of the
stream. Creating a smooth taper with a sharp and well defined inner edge also
prevents the stream from twisting as it travels out of the nozzle giving the stream
the appearance of a smooth and clear glass rod as it travel along its arc.
2.2.16
Pump
One of the key components to the project is the water pump. There are five
fundamental styles of pumps: direct lift, displacement, velocity, buoyancy and
gravity. Direct lift consists of a volume of water lifted in a container, i.e. a rope
and a bucket. A displacement pump moves a fluid by trapping a fixed volume and
then forcing out the discharge of the pump, similar to a piston. A velocity pump
increases the flow rate of the fluid to increase its kinetic energy. To increase the
potential energy of the fluid, the velocity is slowed down just prior to entering the
discharge of the pump. Buoyancy pumps or airlift pumps have compressed air
injected into the lower end of a discharge pipe as the air rises. Due to its lower
density than water; the water travels up the discharge pipe due to inertia. A
gravity pump is simply a siphon. Out of these methods we quickly eliminated the
direct lift and gravity methods. Next, we eliminated the buoyancy method due to
its unstable flow rate and weak suction. This left us with the displacement and
velocity pump methods.
Centrifugal and positive displacement pumps are the two most widely used pump
configurations. Both have excellent lift and flow rate capabilities that could have
satisfied or exceeded all of the needs of our project. Both can be run on single
phase 120 VAC circuits. However, the displacement pump was eliminated due to
two major factors; first is its tendency to have pulsation properties in its
discharge. These pulsations make the stream out of the nozzle look like it is
“bouncing” up and down. This subtracts from the aesthetic appearance of the
fountain. The second and most important is cost. We were unable to locate a
small positive displacement pump at a cost similar to a centrifugal pump. Even
though the positive displacement pump had many excellent qualities, ultimately
the centrifugal pump was chosen by default due to cost. Based on our research
and project requirements we have selected a TEMCO centrifugal, single phase,
110 VAC, ½ hp pump for our project.
2.3 Software
In order to program our microcontroller we had to make some decisions on which
level of coding we wanted to use to create our software file. The PIC
microcontrollers are able to be coded in either assembly or C. If we wanted to
develop in C we would have had to use a C compiler compatible with the PIC
family. Dr. Weeks was kind enough to point out that High-Tech C offers a C
50
compiler for the entire PIC family of microcontrollers. The software normally runs
about $500 for a standard license. But luckily for us, we are able to use the free
version of the software. High-Tech C has an interface that easily allows us to
assign the status of the I/O pins. This allows us to easily assign which pins would
be set as inputs and which pins would be assigned as outputs. By selecting radio
buttons of the I/O pins you wish to assign, the High-Tech program generates the
C code needed for the I/O pins. The High-Tech C software also interfaces
seamlessly with MPLAB.
MPLAB is the free software from Microchip, both Assembly and C programming
languages can be used with MPLAB IDE. The MPLAB IDE contains tutorials and
sample code to help with code development.
51
3
Design
3.1 Design Methods
After completing the research phase of our project we moved on to the design
phase. In designing our Dynamic Liquid Light Fountain, cost was the largest
objective. Next was size; we needed to design a product that could be easily
transportable with a total cost under $650.00. We also had to be sure that all
components and circuitry for the PCB fit in an enclosure approximately 60 square
inches in area. In adhering to these group imposed objectives, we set out to most
efficiently design our fountain. The use of simulation software and laboratory
breadboard process ensured that each circuit was functional before the PCB
fabrication process began. This allowed for more efficient troubleshooting and
testing processes.
3.2 Hardware
3.2.1 Power Supply
Thus far, we have looked into two different types of power supplies, linear and
switched-mode. After reviewing the steps necessary to design both of the power
supplies, we decided to build a standard linear power supply in order to power up
the electronics for the Digital Liquid Light Fountain.
The main items we acquired/purchased for this power supply are a 120 volt AC
step-down transformer, 4 power diodes (bridge-rectifier), 3 capacitors, a 5V/3A
voltage regulator (LM350K), and 2 resistors - 1 240Ω resistor and 1 5K Ω
potentiometer (to set the ouput voltage for the voltage regulator). After priceshopping all of the components, we kept the price around thirty dollars. We
created a simulated power supply circuit verifying an output voltage of 5V in
Multisim shown in Figure 25 below.
52
Figure 25: Simulated power supply circuit showing 120V AC input and a 5V
DC output.
Depicted in the circuit is a 120 volt AC input voltage operating at 60Hz. We have
a fused switch (not shown) located on the primary side of the transformer so that
the user is able to shut off the 5V portion of the power supply while still
maintaining 120VAC for the pump operation. This voltage is then transformed by
a step-down transformer into approximately 12 volt AC using a standard 12 volt,
3 amp enclosed power transformer which we purchased from Radio Shack. Once
the voltage is at a lower level, it is then rectified by a bridge rectifier which
consists of 4 power diodes. From this point, the voltage ripples are smoothed out
by a 4700µF smoothing capacitor. Finally, the LM350K voltage regulator ensures
that we have a constant voltage level of 5 volts so that the elements in our circuit
function properly. The output voltage is set at 5V by the voltage divider network
consisting of a 240Ω resistor and a 5K Ω potentiometer as per the voltage
regulator specifications. The output current from the voltage regulator is
guaranteed at three amps which will depend on the load applied to the supply.
The input voltage (120VAC) is shown in yellow on channel 1 of the oscilloscope
while the output voltage (5VDC) is shown in blue as a straight line. The digital
multi-meter also confirms that the output voltage is measured at 5 volts as
expected.
3.2.2 Microcontroller Interface
We are using the PIC16F887 microcontroller. The microcontroller does not
require much by way of external circuitry for proper operation. We placed a
bypass capacitor on the input power to further filter noise from our circuit.
53
There are 35 I/O pins on the PIC16F887. We are using 22 of the I/O lines as
inputs. We are using 6 for the automated program selection, 2 for manual cutter
control, 1 for water level, 1 for IR remote control, 1 for day/night sensor, 1 for
motion sensor, 1 for initiating manual control of LEDs, 6 for LED manual on/off, 2
for external oscillator (for IR remote control), and 1 for color organ. We are also
using 9 for outputs; they are 6 for LED control, 2 for cutter control and 1 for pump
control.
Port A is being used for monitoring the inputs from the peripherals. Pin RA0
monitors the ambient light sensor. Pin RA1 monitors the infrared sensor. Those 2
inputs are then ANDed together and the resulting digital output determines if the
environmental conditions are sufficient for executing code. Pin RA2 monitors the
water level circuitry while pin RA3 monitors the IR remote control.
Port E monitors the inputs from the switches. Pin RE0 monitors switch 1, pin RE2
monitors switch 2, pin RE3 monitors switch 3, and pin RE4 monitors switch 4. If
the remote control is in use the dip switches are all set to OFF. This indicates
that the switch inputs are to be disregarded by the microcontroller. If the dip
switches are set in the manual switch position, each switch indicates a program
that has been selected. Only 1 switch is set to ON at a time, this allows for a total
of four program to be selected. When all switches are set to 0, the Dynamic
Liquid Fountain will dance to the music.
Port B contains the outputs to the LED drivers and the cutters. Pin RB0 is the
output to signal to the green LED associated with the first LED driver unit. Pin
RB1 is the output to signal to the red LED associated with the first LED driver
unit. Pin RB2 outputs a signal to the blue LED associated with the first LED driver
unit. Pin RB3 outputs a signal to the green LED associated with the second LED
driver unit. Pin RB4 outputs a signal to the red LED associated with the second
LED driver unit. Pin RB5 outputs a signal to the blue LED associated with the
second LED driver unit. RC1 and RC2 control the cutter circuitry; this allows us to
have at least 2 cutters and laminar flow nozzles. The laminar flow nozzle requires
the use of pulse width modulation in order to open and close the cutter.
3.2.3 LED Drivers
Since one of the simplest and most inexpensive ways to provide power to a LED
circuit and the way that is recommended by most is a constant current source,
we looked at implementing this into our design for the DLLF. Typically, it consists
of a small integrated circuit and several other outside components. The result is a
constant current supplied to the LEDs no matter what type of input voltage exists
or what type of forward voltage drop the LED has, which is especially important
to consider when using high-power LEDs such as the ones we are using for the
DLLF. Shown below in Figure 26 is a basic constant current source hooked up to
a microcontroller, similar to the set-up we considered for the DLLF. This circuit
shows multiple LEDs which is an option if we want to eventually increase the
54
amount of light provided to the water as it flows from the pump, but we are
implementing a higher power LED instead. After reviewing the options available
to us, we decided to go with a simpler circuit shown in Figure 26 below.
Figure 26: LED driver circuit implemented with microcontroller.
3.2.4 IR Remote Control Circuitry
The circuitry to support the infrared remote control receiver is relatively simple as
seen in Figure 27 below. Resistor R1 and capacitor C2 are recommended by the
manufacturer to improve the robustness against electrical overstress. X1 is the
external crystal oscillator used to ensure the timing of the IR signal decoding
loop. An external oscillator is used instead of an interrupt timer because the loop
must run very fast, i.e. 50 microseconds. An interrupt timer would be too long
due to the call, the return, and the necessary context switching that is involved.
Capacitors C2 and C3 develop the load capacitance (CL) for the oscillator crystal
as specified by the manufacturer. Using the following equation and a value of 18
pF for CL and 5 pF for the stray capacitance (CS) we determined the value for C2
and C3.
;< = =
;> ∗ ;?
A + ;B
;> + ;?
55
H>
CD EF = G I + J EF
>H
H = ;> = ;? = >K EF
Figure 27: Infrared Remote Control Receiver Circuitry
The backbone to the implementation of the infrared receiver is software driven.
The applicable code will be discussed in the software section of this document.
3.2.5 Passive IR Sensor Circuitry
The design of the circuitry for our passive infrared motion sensor is based on the
circuit provided as an application example in the datasheet for the BISS0001
motion sensor decoder pictured in Figure 28.
56
Figure 28: PIR Example Application Circuit (Image used with the
permission of the Micro Power Corp.)
The example circuit has several features which were not necessary for our
implementation. Specifically, we are already using a regulated 5 VDC power
supply; therefore the voltage regulation portion can be removed. There is a light
dependent resistor (R3) connected to Pin 9 (VC, the trigger disabled pin) used to
inhibit the motion detector from working during the daytime. Since we require the
motion sensor to be operational at all times Pin 9 was connected to VDD (VC
>.2VDD enables operation). Also, the output of the decoder is used to bias a
transistor which drives the coil of a 12 VDC relay; this portion of the circuit is also
unnecessary for our application and was deleted. We also want the decoder to
be retriggerable, which will continue to extend the time that the output will remain
high as long as motion is detected. As a result, pin 1 was connected to VDD. The
duration of time that the output pin (VO) remains high after trigger is calculated
using the following equation:
LM ≅ 24576 ∗ .+ ∗ O
Since the fountain will remain active for four minutes after motion is detected, a
value of nine hundred seconds will be used for TX. The value for R10 is assumed
to be 10 KΩ and the value of C6 was calculated using as follows:
O ≅
LP
24576 ∗ .+ O ≅ 240/24576 ∗ 10000
O ≅ 0.9766 ST
57
A capacitor with a value of 1.0 µF was used. This value, which is slightly larger
than the calculated value, provides a high output for approximately sixteen
minutes.
To provide a 0.1 millisecond inhibit time between triggers (TI) we used the
following equation:
LU ≅ 24 ∗ V ∗ /
A resistor value of 15 KΩ was used for R9 and we calculated the value of
capacitor C7 as follows:
/ ≅ LU /24 ∗ V / ≅ .0001/24 ∗ 15000
/ ≅ 277.78 'T
A capacitor with a value of 270 pF was used. This value, which is slightly smaller
than the calculated value, provides a trigger inhibit time of approximately 0.0972
milliseconds.
Placing the switch J1 in the position indicated in Figure 29 places 5 VDC on pin
1, which makes the decoder circuit retriggerable. The output, pin 2, was
connected directly to the microcontroller to enable or disable fountain operations.
Figure 29: PIR Motion Sensing Circuit
58
3.2.6 Ambient Light Sensor Circuitry
We decided to use the phototransistor coupled with an operational amplifier as
the basis of our day/night circuitry due to its faster response time, lack of
memory, and its versatility to more easily interface with TTL level components.
There are two varieties of phototransistor circuits, binary/logic and analog. For
our purpose a binary/logic circuit provides the input to the microcontroller. In
keeping with the desire to minimize energy consumption, the circuit is designed
as a dark sensor. The reasoning behind this is that the circuit is energized for a
longer period of time waiting for the light level to decrease enough for the LEDs
to be visible. Minimizing the time the circuit is energized extends the usable
lifetime of the circuit components.
The binary circuit detects the ambient light level and outputs a logic value
corresponding to whether or not the level is above or below the set point level for
detection. The circuit will be setup as an inverting circuit, outputting a logic “0”
when the light is above the level of detection, or a non-inverting circuit, outputting
a logic “1” when the light is above the level of detection. The circuit in Figure 30
includes a hysteresis function to minimize unnecessary switching of the circuitry
if the light level fluctuates around the detection level. The circuit also allows the
ability to more easily set the sensitivity level of the circuit then if a light dependent
resistor were used.
U1A is an operational amplifier configured as a comparator. Potentiometer R1 is
used to set the light detection level. A low resistance value (i.e. a few thousand
ohms) sets a high detection level for the light to exceed before any switching can
occur, making the circuit less sensitive. If a larger potentiometer were used, i.e.
100 KΩ, a low light detection level would be set, making the circuit more
sensitive. Resistors R2 and R3 set up a voltage divider network that generates
the reference voltage (Vref) for the operational amplifier. Resistor R5 is a pull up
resistor for the open collector output of comparator. Resistor R4 is used for
hysteresis; with the use of hysteresis there is a dead band between light levels
that switches between “0” and “1.” This prevents unnecessary switching if the
light level is near the detection level; the smaller the value of R4 the larger the
dead band between switching.
As light strikes the phototransistor, U2, it begins to conduct. The more light that
strikes U2, the more it conducts. As the conduction of U2 increases the voltage
at the non-inverting terminal (V+) of U1A decreases. Once V+ is below the value
of Vref the output of U1A switches to a logic “0” voltage level. When the light
intensity striking U2 decreases, the amount of conduction of U2 decreases. This
causes V+ to increase, and once V+ is greater than Vref, the output of U1A
switches to logic “1” voltage level.
59
Figure 30: Day/Night Circuit
3.2.7 Servo Driver Circuitry
The servos used for the cutter mechanism require a .9 to 2.1 millisecond pulse
repeated every 20 milliseconds (or 50 Hz) to control its position. A 1.5
millisecond pulse would put the servo at the midpoint position. Our original
concept was to utilize the pwm outputs from the microcontroller but since the
refresh rate of the servo control pulse is much slower than the clock of the
microcontroller that was not a practical solution. Our final solution was to use a
standard LM555 timer to generate our control pulses. These pulses used in
conjunction with digital outputs from the microcontroller provided two position
control of the servo. Since we only needed a cut and an uncut position for the
cutter mechanism this schemed provided all of the necessary controls.
In this circuit LM555 is configured as astable multivibrator. The main timing
capacitor, C1, is always charged to the voltage level which is determined by the
voltage on LM555 pin 5 around 1.6V. When the timing capacitor is charged only
with current coming through 33KΩ resistor, the charging takes around 2
milliseconds. When control voltage is applied from the microcontroller, the
charging current increases when control voltage increases. When the capacitor is
fully charged, LM555 starts to discharge the capacitor through 100K ohm
resistor. The discharging continues until the voltage has reached the half of the
control voltage (1.6V/2 = 0.8V). The discharge time is determined by the resistor
between LM55 pins 2 and 7. The 100 KΩ resistor in this circuit makes this time to
60
be around 15 milliseconds. When the capacitor is discharged, the circuit start
charging it again.
Figure 31: Laminar Flow NozzleFigure 31: Laminar Flow Nozzle
3.2.8 Laminar Flow Nozzle and Cutter Mechanism
The nozzle is constructed from the following supplies obtained at local home
improvement centers:
•
24” x 4” diameter SCH40 PVC
pipe
•
Silicone sealant
•
24” x 25’ vinyl screening
•
24” x ¼” diameter threaded
rod
•
12” x 36” x ¼” acrylic sheet
•
½” NPT water hose fitting
•
18” x ¼” diameter stainless steel
tubing
•
¾” x ¼” plastic cord grip fitting
with locking nut
•
4 Packages of standard nonbending drinking straws
•
(8) ¼” nuts, washers and lock
washers
We used the Laminar Nozzle, Outlet Plate, Inlet Plate, Servo Mounting Plate,
Cutter Arm and Gasket drawings shown in future figures as a reference to
construct the nozzle. Shown in Figure 31 is a complete drawing of the nozzle.
61
Figure 31: Laminar Flow Nozzle
62
The main body of the nozzle was made by taking the 24” long piece of 4” SCH40
PVC pipe and cutting it down to a length of 15 ¾”. The remaining 8 ¼” piece was
used later on to create the internal retaining rings. After the body was cut to
length, the end was sanded down slightly to remove any rough edges left over
from the cutting process. This was done to ensure that the end is as “squared off”
as possible to provide adequate sealing surfaces for the gaskets to mate up
against. Using the leftover piece of 4” PVC from the body, we cut two 1 ¾” long
rings and one 2” long ring. These rings are used to secure the inner pieces of the
flow nozzle. These rings also had all rough edges sanded off to prevent them
from creating any turbulence inside the nozzle. At the drill press, we drilled a ½”
diameter hole for the water inlet in accordance with the Laminar Nozzle drawing.
The outlet and inlet plates for the laminar nozzle are shown in Figure 32 and
Figure 33 below.
Figure 32: Outlet Plate for Laminar Nozzle
Note 1: Nozzle outlet is a tapered hole from a 0.5” diameter hole on the exterior
to a 0.25” diameter hole on the interior side of the plate at a 45º angle.
Note 2: The sealing groove is cut on the interior side of the plate at a depth of
0.125”.
63
Figure 33: Inlet Plate for Laminar Nozzle
Using a band saw, we cut out three 5” x 5” squares from the acrylic sheet. We
measured out and marked the four 5/16” diameter holes on all three plates.
Using a drill press to ensure that the holes are drilled straight, we bored out all of
the holes. Then, we measured out and marked the sealing grooves on the two
end plates. Using a router or milling machine, we cut the sealing grooves out of
the two end plates. After the grooves were cut, we ensured no leftover material
or debris remained on the sealing surface. We then measured out and marked
the center points of all three plates. At the center of the inlet end plate, we drilled
a ¾” hole and fit the cord grip fitting in the hole. We sealed around the cord grip
fitting with the silicone sealant and locked it in place using the locking nut. This
cord grip fitting holds the fiber optic guide tube in place and allows for proper
positioning of the fiber optic guide tube. At the center of the outlet endplate on
the exterior side (the side without the sealing groove), using the drill press, we
drilled a tapered hole. The hole is ¼” in diameter on the interior surface and ½” in
diameter on the exterior surface. At the center of the servo mounting plate, we
measured and marked a 1” diameter hole and the two servo mounting holes as
per the Servo Mounting Plate drawing shown in Figure 34. We drilled out the
holes at the drill press.
64
Using one of the retaining rings previously cut as a template, we marked out a 4”
diameter circle on the sponge material. Then, using a long sharp knife, we cut
out the circle from the sponge material. In the center of the sponge circle, we
made a ¼” slit. Next, we used a piece of paper or cardboard for a template and
cutout a 5” diameter circle. Using this temple, we then cut out four 5” circles from
the screening material. In the center of each screen circle we cut a ¼” diameter
circle. We made a single cut in the 2” retaining ring and slid it into the nozzle
body. Then, we marked the distance of overlap and cut most of the overlap
material off, leaving the ring slightly oversized to prevent cutting the ring too
small. We placed the ring back inside the body and retried the fit until the ring just
fits inside. Next, we removed the ring and centered one of the screen circles over
the inlet end of the body. We slid the cut retaining ring into the body being careful
not to tear the vinyl screen. Then, we continued to slide the ring into the body
until the outer edge of the ring was 6 1/8” inside the body. Then, we placed a
small bead of silicone all the way around the ring and smoothed it out with the tip
of our finger and allowed the silicone to set.
Next, we slid the sponge circle into the nozzle body from the inlet end until it was
just pressing against the already installed retaining ring. We verified that there
was a 2 1/8” gap between the sponge and the inlet end of the body. Then, we cut
a section out of one of the remaining retaining rings just large enough to
accommodate the water inlet fitting. We centered a screen circle over the inlet
end of the body and, with the section cut out of the retaining ring aligned with the
hole for the inlet fitting, slid the screen and retaining ring into the nozzle body.
We slid the ring into the body until it was flush against the sponge. We verified
that the ring was ¼” from the edge of the nozzle body. We then placed a bead of
silicone sealant around the ring and smoothed it over. Then, we secured the inlet
water fitting to the body. Figure 34 shows the Servo Mounting Plate, Figure 35
shows the Cutting Arm, and Figure 36 shows the Endplate Gasket.
65
Figure 34: Servo Mounting Plate
Figure 35: Cutting Arm
66
Figure 36: Endplate Gasket
Note 3: The cutting arm is made from 1/8” aluminum.
Note 4: The sealing gasket is made from 1/8” thick rubber gasket material.
Next, we slid the ¼” stainless steel tubing through the cord grip fitting on the inlet
end plate until it protruded approximately 14” past the interior side of the inlet
plate. The final position of the tube was determined once all assemblies were in
place. We then placed one of the gaskets over the end of the tubing and
positioned it in the sealing groove of the inlet endplate. Then, we carefully
inserted the tubing through the holes in the screens and sponge until the
endplate and gasket mated up with the inlet end of the nozzle body.
At this point, we filled the nozzle with the plastic straws; ensuring that the straws
were straight and not twisted inside the body. Once the straws were packed
tightly in the body, we repeated the process of inserting a retaining ring and
screen against the straws. We then slid the three fiber optic cables inside the
stainless steel tubing until they extended ¼” beyond the end of the tubing. We
used a silicone sealant to seal the end of the tubing around the fiber optics
without getting any on the polished end of the fiber optics. We placed the
remaining gasket in the sealing groove of the outlet nozzle and placed the
endplate on the outlet of the nozzle body. Next, we placed a flat washer, lock
washer and nut on the end of each piece of threaded rod. Following this, we
inserted a threaded rod through each of the corner holes of the inlet plate and
67
then out through the holes of the outlet plate. Next, we placed a flat washer and
lock washer on each thread rod and ensured that they were resting on the outlet
plate. We threaded a nut down each rod until they were hand tight against each
lock washer. We alternately tightened each nut until a solid seal was achieved
and allowed the silicone sealant to completely set before testing the nozzle.
While the silicone sealant was setting, we mounted the servo motor to the servo
mounting plate and fastened the cutting arm to the servo motor shaft. We then
threaded a nut down each thread rod until each nut was ¾” above the outlet
plate. We placed a lock washer and then a flat washer down each threaded rod
and slid the servo mounting plate down the threaded rods. We then placed a flat
washer and lock washer down each threaded rod and then threaded a nut down
each rod until the mounting plate was securely fastened to the nozzle. Finally, we
made the electrical connections between the servo motor and the
microcontroller. The cutting mechanism was then ready for testing.
3.2.9 Fiber Optic to LED Interface
In order to transfer the light from the LED’s to the laminar flow cutter we designed
a LED/Fiber coupler. The coupler sits over the LED and creates an interface
between the LED and fiber cabling. Through this coupler the light from the LED
travels down the fiber cabling to the laminar flow cutter. At that point the light is
transferred to the water.
3.2.10
User Interface
The user interface consists of both primary and secondary systems. The primary
user interface is the infrared remote control. For our project, we are utilizing a
programmable universal remote control. We chose the Philips Pronto TS1000 for
its versatility and due to the fact that we obtained one for free. The Pronto has a
3.8" diagonal touch screen. The touch screen has a resolution of 240 x 320
pixels with four color grey scale. It has 1 MB of non-volatile flash memory, 512k
SRAM, a serial interface, infrared code learning and an infrared operating range
of approximately 33 feet. There are seven programmable access buttons and a
built in light sensor that automatically turns on the backlight in low-light
environments. The sensitivity of the light sensor was adjusted to suit our needs.
Through the use of the Pronto Edit, graphical editing software, we were able to
create any type of control panel or menu driven system we desired to control the
fountain. This remote has the capability to allow the user to create macros and
timers to send control sequences to the microprocessor. Using this remote
control allows us to create and label all the buttons and menus we require for our
current project, and any future additions that we may make in the future can
easily be programmed into the remote. The Pronto TS1000 is able to learn IR
codes from existing remotes or we can generate our own codes and program
them into the remote and assign them to any button, graphical or direct access,
we choose. Using this remote allows us to ensure that the remote provides all the
functionality that we want and allows the interface to be customizable to almost
any user specification.
68
The secondary portion of the user interface consists of various electromechanical
switches, from DIP to rocker switches. Using appropriately sized rocker switches,
we have enabled the user to turn ON and OFF the entire system by removing the
120 VAC power that feeds both the 5 VDC power supply (which feeds all of the
electronic circuitry from the microprocessor to the low water level sensing
circuitry), and the centrifugal water pump. Another rocker switch is used to deenergize the 5 VDC power supply but allow the centrifugal pump to continue to
operate. This switching combination allows the user to de-energize all or part of
the system for various user needs and troubleshooting.
DIP switches make up a bulk of the secondary user interface. While we could
have purchased one continuous block of switches to satisfy the entire project
requirements, we chose to break the DIP switches into smaller blocks. The
reason for breaking the DIP switches into smaller blocks is to aid the user in
identifying the appropriate switch. By using blocks of six we can separate the six
preprogrammed selector switches from the six individual LED ON/OFF input
switches. With switches being relatively small and close together, it is sometimes
difficult to actuate the correct switch in a long block of DIP switches; this design
choice alleviates this problem. The final block of six DIP switches is used to
select manual or automatic operation and provides spare switch positions for
future system expansion if desired.
Two momentary pushbuttons round out the last of the switch portion of the user
interface. When the system is placed in manual mode, the pushbuttons provide
the user with the means to control the individual nozzle cutter mechanisms. By
using non-locking momentary pushbuttons we ensure that the nozzle cutting
mechanisms cannot be unintentionally blocked and require a constant user input
to block the streams exiting the nozzles.
3.2.11
Pump Control Circuitry
The pump control circuitry is responsible for protecting the pump from running
dry, a condition that would significantly reduce the life of the pump. The circuit
contains a relay that operates in normally closed position. The normally closed
relay allows the pump to remain active while water levels are considered at a
safe level. When the water level drops, a float switch deactivates the normally
closed circuit and turns off the pump. This circuit is also responsible for ensuring
the microcontroller does not run when there is no water output. This circuit was
designed to run off the 5 volt DC power supply. The circuitry turns off the pump
when water levels fall below 6 inches to prevent the pump from running dry.
69
The pump control circuitry consists of a primary and secondary circuit. The
schematic
shown
in
Figure 37: Relay Driver
was used for the basis of the pump control circuitry. If the water level falls below
6 inches the float switch opens and triggers the RB0/INT switch on the
microcontroller. This in turns opens the relay which turns off the pump. When a
satisfactory water level has returned the software returns from the interrupt
subroutine and then reinitiates the pump and program to normal operation.
70
Figure 37: Relay Driver
3.2.12
Printed Circuit Board
Although we were unable to fully design the PCB before the December 14, 2009
deadline for the paper we knew that we would fabricate our PCB through 4PCB.
4PCB has a student special consisting of one PCB with a maximum area of 60
square inches that costs only $33.00 plus shipping. Our PCB was laid out in early
January using the software provided by 4PCB. This software claims to have the
largest parts library available from free software solutions. However after utilizing
the software, we found that this wasn’t true. We had to manually enter in a
majority of the footprints for our design. These footprints were then linked to a
schematic symbol which, for the most part, were each included in the software.
Then, once each schematic symbol and footprint were created, we combined
them into a symbol. We entered a complete schematic into the software. Once
the schematic was complete, we were able to choose an option for the software
to convert the schematic to a PCB design, optimizing the layout of the board.
Once this was complete, we cleaned up the design, partitioning the board so that
it was easy to navigate once we received it back from manufacturing for ease of
solder.
Before sending the PCB to fabrication we had to be sure all designed circuits
work as indicated though simulation. This was done by bread boarding all circuits
before PCB fabrication.
Our board was a 2 layer, one sided board made from FR-4. The general layout of
the circuitry is shown in Figure 38 below. The top layer consists of all
components and the signal runs. The bottom layer contains the ground plane.
71
We used as many through hole components as possible to allow for easy
soldering.
Figure 38: PCB preliminary Layout
3.2.13
Enclosure
The enclosure is an off the shelf part that is made from a non-rusting material
and has a removable/hinged lid for testing and troubleshooting purposes. The
max dimensions for this enclosure were not to exceed 40”x21”x7”. Fortunately,
we were able to obtain this enclosure at no cost. It comfortably houses our PCB,
DIP switches, pushbuttons, and other circuitry.
3.2.14
Software
Software for this project was developed using MPLAB, the free development
software provided by Microchip. Because of the availability of open source code
on the internet we developed the code using assembly language. We
programmed our Microchip in a block fashion.
The first block of program we developed was the cutter control. We wanted the
code to be able to drive the servos of the cutter in 2 directions to open and close
the nozzle. We are using 2, of the 4 PWM I/O pins, RD5 and RD6, in order to
control the cutters. By varying the pulse widths we are able to vary the amount of
time the cutter is open and the amount of time the cutter is closed. There are
four variations in which the cutters are driven. We also have one variation that
keeps the cutters open continuously so that the user can better see the LED’s
light up the laminar streams of water. Using the development board, we are
outputting the pulse width modulated signals to LED’s, allowing us to see the
72
modulation. Then, once we were satisfied with the visual PWM outputs we
continued on to the next block of the program.
Next, we developed the LED driver block. This consists of the development of 4
separate programs that turn off and on the LEDs in order to color the water from
the nozzle. The red, blue, and green lights are mixed in order to create a wider
range of colors. The chosen LED program runs in a continuous loop until a new
program is chosen by the user. Once the first 2 blocks of software were
developed we combined them to run together so that the cutter and LEDs are
running at the same time for each of the four programs. After this, we wrote the
code for monitoring the peripherals. The signal for the Passive IR and the
Ambient Light sensors is ANDed together and the microcontroller only executes
a user chosen program if the output from the AND gate is a 1. This ensures that
programs are only run when the user can see the Dynamic Liquid Light Fountain
in its best visual display.
The program also requires an interrupt to be acknowledged if the ANDed output
from the IR sensor and Ambient Light Sensor goes low for longer than 5 minutes.
This is monitored and timed using a clock. If at any point during the 5 minute
countdown the ANDed output goes high the timer restarts its countdown. The
final block of code that was written allows the user to play music. The
microcontroller then filters the music frequencies and, depending on the
frequency, the LED’s are driven in a pattern in order to create a display that
appears to dance with the music. This will not require use of code to drive the
cutter mechanism but just to drive the LEDs depending on the frequency of the
music played.
73
4
Testing
Testing was completed in phases. The first phase of testing consisted of circuit
simulation. The circuit simulation was conducted in tandem with the design
phase of the project. Once circuitry was simulated and was functioning within the
outlined parameters we bread boarded the circuit. While the circuit was bread
boarded, we verified that the circuits still functioned within the given
specifications and that the actual circuit functions the same way as the computer
simulated circuit. We then put the finalized circuit into a schematic capture tool,
4PCB’s free software. This tool allowed us to create the necessary files for PCB
fabrication. Once the PCB was obtained from the board house we again tested
the circuitry. The following section explains what measures we took to test the
various pieces of the dynamic liquid light fountain before the final testing phase.
4.1 Safety Procedures
Testing was conducted in the Senior Design Laboratory. We adhered to normal
UCF lab safety processes. To minimize the risk of electric shock we followed
these guidelines. We avoided all contact with capacitors in energized circuits. We
also took precautions to remove all conductive hand jewelry before working with
electricity. When problems occurred in our circuitry, including shorts and opens,
we first removed power and conducted resistance checks to try to find the faulty
components. Because components have the potential to become hot and burn
the skin, we avoided touching them for a minimum of 3 minutes after power was
removed.
4.2 PCB Testing
Once the PCB returned from fabrication we took a series of steps to ensure
proper fabrication.
The following steps were taken before components were installed on the PCB:
1. Visual Inspection of PCB runs. Avoiding unnecessary contact with copper
runs.
2. Using an ohm meter ring out power and ground lines, ensuring no
inadvertent grounding of power runs.
After part installation:
1. Conduct visual inspection of the solder joints.
2. Conduct ohm checks to ensure proper power and ground.
After all ohm and visual tests were conducted we tested the individual circuits as
indicated in the following sections. The individual circuits were checked using the
isolation switches placed on the PCB. These switches enhance the trouble
shooting and testing process. For example, between the transformer, which
74
converts 120VAC to 5VDC from wall power, and the 120VAC source, we placed
a switch that can isolate the 5VDC. There is also a test point on the output of the
voltage regulator to allow us to verify the regulated output voltage.
4.3 Power Supply
The first thing we did in order to properly test our power supply was to determine
the different tests that were recommended. Most of the test definitions can be
found in greater detail in the IEC 60050 and the IEEE 100 documents. The
different tests, definitions, and conditions include, but are not limited to: Active
Mode, Active Mode Efficiency, No Load, No Load Power, Unit under Test,
Ambient Temperature, Power Factor (True), Total Harmonic Distortion (THD),
Apparent Power (S), Instantaneous Power, Active Power (P), Nameplate Input
Voltage, Nameplate Input Frequency, Nameplate Output Voltage, and Nameplate
Output Current.
The Active Mode is the condition where the input of the power supply is wired to
the AC line voltage while the output is wired to the DC load drawing part of the
nameplate power output of the power supply that is greater than zero. The Active
Mode Efficiency is actually a ratio that is expressed as a percentage of the total
real power DC output that is produced by the power supply to the real power AC
input that is required to produce the voltage. See IEEE 1515-2000, 4.3.1.1.
The No Load condition is where the input of the power supply is wired to an AC
source that is consistent with that of the nameplate AC input voltage of the power
supply. The difference is that the output is not connected to any loads in the
system. The No Load Power can be better referred to as the efficiency and by
definition be zero (0) when calculated by using percentages. For this procedure
the No Load Power is defined by using the wattage of real AC power being
consumed in the No Load condition by the power supply. The Unit Under Test
(UUT) is the condition where the power supply samples are being tested. The
Ambient Temperature is considered the outside ambient air temperature that is
surrounding the UUT. The Power Factor (True) can be represented as a ratio of
the real, or active power (P) watts that are consumed by the apparent power (S),
designated as volt-amperes (VA). The definition below of the power factor
includes both the effect of displacement and distortion.
T =
W
The Total Harmonic Distortion (THD) is a ratio that can be expressed as a
percent of the Root Means Squared (RMS) value of the fundamental component.
The below equation represents the ratio where the I13 is equal to the RMS value
of the 13th current signal harmonic:
75
LX"U =
,
Y,, + Z, + [, + -, + ⋯ .Z
.
The Apparent Power (S) is a product of RMS current (VA) and the RMS voltage.
The Instantaneous Power is a product of the instantaneous current and the
instantaneous voltage at the terminal pair of the load or the port. The Active
Power (P) is the RMS value of instantaneous power that is taken over a given
period of time. Most meters or measuring equipment take an average of active
power during a number of periods or cycles. The Nameplate Input Voltage is the
specified AC input voltage of the power supply given by the manufacturer on the
label or housing on the power supply. This voltage is most often given as a range
voltage. The Nameplate Input Frequency is the specified AC input frequencies of
the power supply also listed on the housing by the manufacturer. Most power
supplies have several different frequencies listed.
The Nameplate Output Voltage is much like the input voltage and is specified,
but it can be expressed as either AC or DC depending on the use of the power
supply. In our project our output voltage is DC. The difference is that the output
voltage is determined by the actual inputs and current applied to the power
supply and the outputs may vary from the specified amount. The Nameplate
Output Current is the specified current by the manufacturer listed on the housing,
but the listed amount is a range that the power supply can operate without
damage or failure. Our supply can operate at a max peak output current of 4
amps but is rated for a continuous output current of 3 amps. The loading
amounts for the power supply can be determined by multiplying the nameplate
output current amount by 100%, 50%, or 25%.
4.3.1 Testing Conditions
The conditions for testing were performed using the following constants: The
Measuring Equipment, the Testing Room, The Test Voltage, The Input AC
Reference Test Voltage, and the Test Leads. These conditions must be a
constant or the process of testing and calculating is more unpredictable.
The measuring equipment for the power measurements was fabricated by a
calibrated voltmeter and ammeter, but can also be effectively taken using a
power analyzer and oscilloscope. As we can find specified in IEC 62301, the
measurements of active power of about 0.5 watts or greater needs to be
calculated using an uncertainty factor of greater than 2%, while active power
measurements with less than 0.5 watts has an uncertainty factor greater than
0.01 watts. For our project we have a voltage greater than 0.5 watts so we use a
2% correction factor.
The testing room is a controlled room and can be specified in IEC 62301. All
tests are performed in a room that has an air speed close to the UUT of less than
0.5 m/s with the ambient temperature being maintained at around 23 degrees
Celsius for the entire test. The use of an externally powered fan, heater, or air
76
conditioner was avoided. The UUT is tested using a thermally non-conductive flat
surface. The Test Voltage should be an AC source that supplies constant input
voltage to the UUT and can be specified in IEC 62301. The UUT input voltage
and frequency are specified with a variance of 1%. The frequency and voltage of
our project are approximately 115 VAC at 60 Hz as stated on the nameplate
voltage and frequency combination. The Input AC Reference Source Voltage
should be capable of producing and delivering at least 10 times the nameplate
input power to the UUT that can be specified in IEEE 1515-2000. The AC source
type is not as important as the stability of the input so for this project are using a
normal household outle. The THD of the supplied voltage to the UUT should not
exceed 2%, including the 13th harmonic specified in IEC 62301. Also specified in
IEC 62301, the peak value of the test voltage is kept between 1.34 and 1.49
times the RMS value.
The Test Leads used for the measurement equipment are just as important if not
more important than the equipment itself. The leads should be constructed of a
large enough gauge and short length that it does not affect the readings and to
avoid the introduction of induced voltage errors in the testing process. In IEEE
1515-2000 table B.2, “Commonly used values for wire gauges and related
voltage drops” can be used to verify the correct wire gauge is used.
4.3.2 Measuring Approach
The first step in the measurement approach was to prepare the UUT for testing.
If there are any internal switches on the UUT that control the power flow to the
AC input, they were turned to the “ON” position. The power supply packaged for
consumer use should have a hard wired power cable provided by the
manufacturer with the proper gauge cables and wiring. We have several options
available for connecting measuring equipment to the output of this power supply.
The option we chose is to cut the cord immediately outside of the adjacent
connector and attach the leads of the equipment to the stripped wires.
We are also able to test the efficiency of an open circuit board power supply
before it gets implemented into the finished enclosure and the connection of its
DC output wires. It is important that no matter what configuration you test in the
power supply, it must be tested in its final configuration in order to accurately
represent how it will function during the demonstration.
We simulated the load conditions as accurately as possible. Most all single
voltage external power supplies have some sort of nameplate output current. The
values are calculated by using the table below. These are the values used to
figure out the four main active mode load conditions and also to no load
condition. We ensured that the UUT was tested using all the load conditions
found in Table 5 below.
77
Table 5: Test conditions for power supply
While testing we remembered the 2% allowable variance from the nameplate
output current and not just the one we calculated. We could have for example
tested the UUT at “Load Condition 3” by testing within the range of 48% to 52%
of the rated output current. In IEEE 1515-2000, it notes that we can test
additional load conditions, but these were not really required as part of this
procedure. A set-up of the load conditions applied to the power supply is shown
below in Figure 39 .
Figure 39: Simulation of load conditions
The loading guideline was calculated in order to properly load the power supply
while producing all four of the active mode loading conditions. We purchased 1
and 10 ohm, 5 and 2 watt resistors from Radio Shack to obtain the proper load of
approximately 3 amps. Even though the power supply is designed to operate
using different load characteristics, resistors provide a standardized reference for
testing multiple times and for different product comparison. The resistive loads
don’t necessarily need to be exactly measured by an ohmmeter because if you
have a variable resistor, it can be adjusted to the point where the ammeter
reaches the desired percentage calculated using the nameplate output current.
However, it was simpler, cheaper and quicker to purchase resistors from Radio
Shack for testing purposes.
Shown in the figure below is the simplified schematic using an external power
supply testing set up while applying a variable load resistance. While testing, the
desired output current is adjusted in the constant current mode instead of just
78
adjusting the required output power in constant power mode. Below Figure 40
showing the configuration of our testing equipment in order to properly test the
UUT:
Figure 40: Correct set-up of testing equipment
While choosing the proper testing sequence it helps to consult the IEC 62301,
which states that instantaneous measurements are only acceptable when the
power readings are stabilized using a particular load condition. Upon conducting
efficiency measurements the UUT should be operated at 100% of its nameplate
current output for no less than 30 minutes to verify all is functioning properly.
After the power supply has had this warm up period, we maintained the AC input
power for a duration of about 5 minutes in order to properly asses the stability of
the UUT. If there was no power drift noted that exceeded 5% from the maximum
value observed, we may consider the UUT stable and the measurements were
accurately recorded at the end of the 5 minutes. We continued to do this method
for all of the load conditions. The 30 minute warm up period was required each
time you break for longer than an hour or so.
If the AC input power was unstable during the 5 minute duration, we must consult
the guidelines established in the IEC 62301 for measuring an average power or
an accumulated energy over a given time for both the DC output and the AC
input. The efficiency measurements were tested using the sequence of load
condition 1 to load condition 5 shown in the table above. We calculated the
efficiency by dividing the measured active output power of the UUT at any given
load condition by the active AC input power measured at that load condition. The
efficiency average is calculated by the arithmetic mean of the efficiency values
calculated by test conditions 1-4 in the above table. This is not intended to
represent the weighted average efficiency because it just a simple arithmetic
79
average of the active mode values. The values can vary according to the duty
cycles of the devices powered by the power supply.
As part of the parameters we looked for we calculated the consumption of power
of the UUT at each of the load conditions 1-4. The power consumption is the
difference between the active output power at the given load condition and the
AC active input power at the specified load condition. For example, we calculate
the consumption of power at load condition 5 having no load, is equal to the AC
input active power at the given load condition.
As we followed through the testing procedures it was important we followed a
certain path for recording test data. The test report data includes the UUT
manufacturer, the UUT Model Number, the UUT Output cord length, the location
of any internal/external switches, the known loads and hardware, the nameplate
information, scaled pictures of the power supply, the ambient temperature around
the UUT, date and location of test, and the test equipment information. It’s
important that when testing, we record the key data that is both calculated and
measured such as the voltage and frequency at each load condition. Below is a
table that summarized the recommended collection of the data.
Figure 41: Values tested in order to verify the Power Supply is operating
correctly
By using the table above, we easily compared our test data to the other recorded
data and also our calculated amounts. Another way to display usable data is to
display it in a graphical form, easily done in Excel. A good sample format for this
can be found in IEEE 1515-2000, section 4.3.1.2 in figure 10, the “Input vs.
Output Power” chart. By using the graphical format we have a useful way to
show a power supply’s relative efficiency, which includes the AC active input
power and the active output power using 100%, 75%, 50%, 25%, and zero
percent of the nameplate current output.
At the conclusion of our testing, we evaluated whether or not the power supply
was performing correctly. It was imperative that the power required for the DLLF
is provided efficiently and safely from our power supply. If any of the conditions
80
were unstable, we would have reconsidered our design and implemented
changes to hardware where necessary.
When we first constructed our power supply with the appropriately rated heat
sink, we verified the output voltage at half load, or 1 ½ amp. The output voltage
was 5.24V. We ran this test, taking voltage measurements every 10 minutes,
until the power supply had been on for about an hour. At each increment, the
voltage measured exactly 5.24V. Thus, we knew that the power supply was
operational at 50% load. After this, we added more load resistors to bring the
load up to 100% at 3 amps. Even though this is about 150% of our actual load,
we wanted to make sure that the power supply was more than adequate for our
project, including any unforeseen additional required circuitry that was added. At
9:08 pm, our output voltage was 5.02V with a 3 amp load. Again, we took voltage
measurements at 10 minute intervals to verify that the voltage regulator was not
overheating, thus verifying that our heat sink was sufficiently rated. At 9:18 pm
the output voltage was measured at 5.04V. Again, at 9:28 pm the output voltage
was measured at 5.03V. We continued this test until 10:08 pm at which time the
voltage was measured at 5.03V. Thus, our power supply testing phase was
complete and we were confident that the power supply we designed and
constructed will power our electronics safely. Shown in Figure 44 is our simulated
load.
Figure 42: Power supply testing at full-load.
81
4.4 LED Driver
To test the LED drivers, we first connected the components required for the LED
driver. We used the senior design lab and set everything up on a breadboard.
Next, we connected the driver to the power supply and ground using all safety
precautions necessary. We then determined how we should send a signal to the
transistor to indicate that the circuit is to be turned on. We decided to bypass the
transistor for testing purposed. For verification of the current the LED is drawing,
we placed a voltmeter in series with the circuit. An example of this set-up is
shown in Figure 43 below:
Figure 43: Current test for LED driver.
We verified that the current flowing through the circuit is below the maximum
LED current of 500mA. We did this by connecting the voltmeter in series with the
power supply and the transistor. We also verified that the proper voltage was
being applied to the LED in order to turn it on. This voltage cannot exceed the
forward voltage rating of each resistor. We did this by connecting the voltmeter in
parallel with the node in which the LED is connected. We verified that these
values were within operation range for each LED we used before we connected
the LEDs to the circuit and before we connect the microcontroller to the circuit.
Both of these components were much more expensive than the individual
transistors and resistors so we wanted to be sure that they were protected
against excessive voltage and current.
4.5 Pump Controls
Before PCB fabrication we bread boarded this circuit to ensure proper function.
To test the pump control circuitry we first tested the relay. The relay is
deactivated by the float switch when the water level falls below 6 inches. This
was simulated by tripping the float switch and ensuring the relay opened when
the float switch state was changed. Once we verified that the float switch and
relay were working properly, we hooked up a test load to the circuit. This
82
removes any chance that the pump would be adversely affected by the testing
process. We used a voltmeter to ensure that when the float switch was opened
the relay power was not flowing through the secondary circuit which contains the
pump. Before integrating the pump into the circuit we verified the primary and
secondary circuits were functioning as designed. Once this was verified we
incorporates the pump into the circuit and tested again. When testing was
complete and the circuit was verified as functional it was incorporated into the
PCB design.
When the PCB returned from fabrication and the preliminary testing of the PCB
was complete we tested this circuit by changing the state of the float switch,
which tripped the relay and removed power from the pump.
4.6 Nozzle and Cutter Mechanism
Testing of the cutter mechanism required the code to be completed since it
develops the pulse width modulated output. Once the code was developed and
tested we connected the outputs of the microcontroller to the two servo motors.
Once the servos were connected, we manually initiated the mechanisms to
ensure that the arms traveled into the correct position. After any adjustments
were made we tested the nozzle and cutter together. We connected the nozzle to
the pump and supplied the pump with sufficient water to prime the pump and to
maintain proper operation. We energized the pump and aimed the nozzle at the
catch basin. Then, we checked for proper stream clarity, length and height. After
the proper stream was established, we pressed the manual cutter actuation
button on the user interface panel and checked that the cutter arm moved into
position and blocked the stream. We released the pushbutton and made sure
that the arm moved out of the way and that the stream was once again properly
established. Following a successful test of the first nozzle, we repeated the
procedure for the second nozzle.
4.7 Motion Detector
Since the passive infrared sensor and the associated decoder chip cannot be
simulated using Multisim or PSpice the circuit design was tested after the circuit
was actually constructed. Once the motion detector was built, it was tested
before it was connected to the microcontroller. Just a couple of additional
components and a stopwatch were all that were necessary to test its
functionality. Connecting a basic red LED, due to its lower turn on voltage, and a
500 Ω resistor, to limit current flow, in series with the output to ground gave us a
visual indication of when motion was detected and allowed us to time how long
the output remained high. The testing could have also been accomplished using
a multichannel oscilloscope, with one channel of the oscilloscope connected to
pin 14, input trigger from sensor, and one channel connected to pin 2, decoder
output. During the following test procedure when the LED is on the pin 2 will be
high.
83
We placed the sensor at a location that will simulate the final installation position.
Once the circuit was assembled and the 5 VDC power supply was turned on we
waited approximately 30 to 60 seconds for the sensor to stabilize. During the
stabilization time the LED blinked several times. Once the sensor stabilized and
the LED was continuously off we checked the circuit’s operation. Waving a hand
in front of the sensor triggered its operation and the LED illuminated. Once the
LED was on, started the stopwatch and did not create any motion in front of the
sensor. After approximately sixteen minutes the LED turned off as expected, and
we recorded this time. This verified that that the active high output time was
working as calculated.
With the LED still off we moved in front of the sensor. Once the sensor was
active and the LED turned on, we started the stopwatch again, and did not create
any motion in front of the sensor for at least three minutes. After three minutes,
we generated motion in front of the sensor again, then created no motion again
in front of the sensor and ensured that the LED remained on for the same sixteen
minutes following the second triggering. This verified that the retriggering function
of the motion detector was working properly.
The final test was done to verify the range of the sensor. With someone watching
the trigger signal on the oscilloscope, we started walking in from the left side and
then the right side to see at what point the sensor triggered the motion detector.
This verified the detection angle for the sensor. The last test was to start walking
in from a distance at which the sensor was not triggered and then see how close
to the sensor we needed to get to trigger the motion detector. After all
parameters of the motion sensor were successfully tested, we then connected it
to the microcontroller.
4.8 Ambient Light Sensor
To test the design of the ambient light sensor circuit, it was simulated in Multisim.
The phototransistor cannot be modeled in Multisim so the phototransistor was
replaced by a 2N2222 NPN transistor and a switch as depicted in Figure 444
below.
84
Figure 44: Ambient Light Detection Simulation Circuit
An open switch simulates a dark condition where the phototransistor will not
conduct. The output on channel 1 (Green) is high. Once the switch closes, a
daytime condition where the transistor conducts, the output drops to a low. The
results of the simulation, in Figure 45, verify our design.
Figure 45: Ambient Light Detection Simulation Results
85
After the circuit was built, it was tested prior to connecting it to the
microcontroller. A voltmeter was connected to the output pin of U1A and then the
circuit was energized. An opaque cup was placed over the phototransistor and
the output transitioned from a logic level 0 to a logic level 1 voltage. Once this
was verified, the cup was removed and the voltage transitioned from the logic
level 1 to a logic level 0. After the circuit operation was successfully verified it
was then connected to the microprocessor.
4.9 Servo Driver
To test the design of the servo driver circuit, it was simulated in Multisim. To
simulate the input from the microcontroller a switch and a 5VDC supply were
substituted into the circuitry as depicted in Figure 44 below.
Figure 46: Servo Driver Simulation Circuit
A closed switch simulates a call from the microcontroller to cut/block the stream
and an open switch simulates an uncut/unblock call from the microcontroller.
86
Figure 47: Servo Driver Simulation
After the circuit was built, it was tested prior to connecting it to the
microcontroller. A graphical multimeter was connected to the output pin of the
LM555 timer and then the circuit was energized. The pulse width was measured
and then a 5 VDC signal was applied and the pulse width was measured again to
verified that the two pulses were of the proper duration. The circuits were then
connected to the servos and tested again to make sure that the servos
maintained their position and travelled appropriately when a control signal was
applied. Then the circuit was connected to the microcontroller for a final
operational check.
Once the servos were fully tested and mounted on the mounting plate R5 was
adjusted to place the cutting arm in the exact proper location in relation to the
outlet of the nozzle.
4.10 Microcontroller Software Simulations
In order to test the software we developed we purchased the PIC16F887
development board. Then in accordance with the design software design plan
described in the previous section we began writing the code. The test board
allowed us to test each block of code as it was developed. This board allowed us
to drive the LED circuits before the PCB board was spun. This intermediate step
allowed for us to develop code in parallel with the PCB layout and spinning.
4.11 Microcontroller and External Circuit Interface
Before the microcontroller was placed onto the PCB board we ensured that all
inputs to the PCB were correct. This was accomplished by doing voltage checks
at the inputs to the microcontroller on the printed circuit board before the
microcontroller was installed into the circuit. Once we were certain that the
87
inputs were all within the tolerances allowed for the microcontroller, we installed
the microcontroller.
4.12 Final Testing Phase
A complete system test was conducted before final presentation of our project. In
order to keep track of our testing procedures we developed a series of charts to
complete to verify proper working conditions of our project.
5V Power Supply
Location
Theoretical Value (V)
Power In
120
Output from Step Down Transformer
12
Input to Voltage Regulator
10
Output from Step Voltage Regulator
5
Actual (V)
123
15.4
13.2
5.02
Table 6: 5V Power Supply
LED Drivers
Theoretical Value
5.0V
350mA
Input Voltage
Input Current
Actual
5.02V
310mA
Table 7: LED Driver
Input Voltage
Output for Lighted Situation
Output for Darkened Situation
Ambient Light Sensor
Theoretical Value
5V
0
1
Actual
5.02V
0.058V
1.15V
Table 8: Ambient Light Sensor
Passive IR Sensor
Input Voltage
Output for no motion
Output for motion
Theoretical Value
5V
0
1
Actual
5.02V
0.055V
0.998V
Table 9: Passive IR Sensor
Pump Control Circuitry
Theoretical Value
Voltage on Primary Circuit
5V
Voltage on Secondary Circuit when relay is closed
120V
Current Through Secondary Circuit
3.4A
Voltage on Secondary Circuit when relay is open
0V
Actual
5.02V
122V
3.33A
0.100V
Table 10: Pump Control Circuitry
88
5
User Manual
To use the DLLF the user needs only to turn on the power switches located on
the front of the electronics enclosure.
The user can then choose manual or remote control by toggling the DIP switches
located on the PCB.
The first switch on the third bank of DIP switches indicated manual/remote mode.
When positioned as shown the DLLF is in Remote mode. The user then selects
the programs
ms from the Remote shown in Figure 48.
Figure 48: Remote Mode
For Manual Mode the user selects from the first two banks of DIP switches.
Bank1 allows the user to cho
choose any combination of the RGB LEDs:
SW1-1 RED
SW1-4 RED
SW1-2 GREEN
SW1-5 GREEN
SW1-3 BLUE
SW1-6 BLUE
89
Figure 49: Manual Control
Bank2 allows the use to choose from the following programs:
SW2-1 ROTATE
SW2-4 JUMP BLUE
SW2-2 JUMP RED
SW2-5 NO LIGHT
SW2-3 JUMP GREEN
SW2-6 SERVO CONTROL
Finally, to turn off the DLLF the user should turn off which ever program is
running. Then turn off the switches on the front panel of the DLLF.
90
6
Administration and Conclusion
6.1 Project Administration
The following block diagram is an overview of the general layout of our project.
Each team member was assigned a series of responsibilities and those items
were researched by the assigned individual. All design and layout decisions for
the project were made by team consensus.
Figure 50: Project Block Diagram
In order to keep track of our progress, we developed the following chart which
allows for a quick overview of the status of our project. As of December 14, 2009
the research and design was complete on all aspects of the Dynamic Liquid Light
Fountain. We then began acquisition of components for bread boarding and
software development.
91
Device
Group Member
Status
Passive infrared sensor
Peter Bunora
Research Complete
Ambient light sensor
Peter Bunora
Research Complete
User interface
Peter Bunora
Research Complete
IR remote control sensor
Peter Bunora
Research Complete
Laminar flow nozzle &
flow cutting mechanism
Peter Bunora
Research Complete
Microcontroller
Sarah Weston
Research Complete
Pump control circuits
Sarah Weston
Research Complete
DC power supply
Brandy Smith
Research Complete
LED driver circuits
Brandy Smith
Research Complete
Microcontroller
Development Board
Sarah Weston
Acquired
PCB
Sarah Weston
Research Complete
Signal Filtering for Audio
Brandy Smith
Research Complete
Inputs
Figure 51: Tasking Responsibility
6.2 Budgetary/Financial Data
This project was group funded, with equal distribution of cost. A budget restraint
of $650.00 dollars had been put into place by the group member’s financial
situations. Originally we thought we had obtained sponsorship from RRI Energy,
Inc. but that fell though. This price includes all incidental cost and equipment. In
order to minimize cost we attempted to acquire many of the PCB components
though manufacturer samples. It’s common practice for manufacturers to send
upwards of 10 free (including shipping) samples to companies to improve
chances of companies implementing designs with new technology. By using a
work address, our group attempted to acquire most, if not all, PCB level
components using this method. This approach allowed us to decrease cost by
approximately 10 to 20%. The following budget shown in Figure 51 and Figure 52
shows our complete expenditures including samples:
92
Component Description
Vendor
Quantity
Cost
Total
Electrical
Resistors, capacitors, switches, etc.
Digi-Key
n/a
$121.72
$121.72
Resistors, capacitors, switches, etc.
Newark
n/a
$59.48
$59.48
Development Board
MicroChip
1
$60.27
$60.27
Fiber optic cable
Fiber Optic Products Inc.
1
$37.00
$37.00
LED connectors, glue
Radio Shack
1
$5.10
$5.10
RGB LEDs
E-bay
5
$8.99
$44.99
PCB Fabrication
4PCB
1
$50.25
$50.25
PIR
E-bay
1
$2.00
$2.00
Fresnel Lens
Electronics123
1
$2.00
$2.00
Float Switch
Chicago Sensor
1
$15.20
$15.20
Samples Received
Headers
Millmax
2
$0.00
$0.00
Headers
Samtec
2
$0.00
$0.00
Major League Electronics
Subtotal:
$398.01
Figure 51: Total DLLF Electronics Budget
Component Description
Value
Vendor
Mechanical
Quantity
Cost
Total
$30.39
Nozzle Parts
Lowes
1
$30.39
Nozzle Parts
Home Depot
1
$19.38
Drinking Straws (Nozzles)
Party City
1
$9.90
$9.90
Servos
E-bay
2
$46.26
$46.26
Pump
E-bay
1
$37.00
$37.00
TOTAL:
$19.38
$142.93
Grand Total:
$540.94
Figure 52: Mechanical Budget
6.3 Project Timeline
In order to limit our stress and allow time for the group to work on other
curriculum, we aimed to adhere to a strict schedule in the construction of our
project. January 11, 2010 we began our initial prototyping of the Dynamic Liquid
Light Fountain; this process lasted approximately 60 days. We completed our
PCB design and layout and submitted the board for processing with 4PCB on
March 10th and received our board back from them on March 16th. In parallel to
this process we began software development for the microcontroller. Once the
PCB was received, we performed our voltage and continuity checks on it as
stated earlier and then soldered all components onto the board. We continued to
troubleshoot the PCB including incorrectly entered connections on some of the
93
ICs due to lack of experience using PCB software. However, once this issue was
resolved our circuit worked just as they did when they were bread boarded. Aside
from this, our PCB and circuitry worked almost precisely as we had originally
designed and planned.
Our initial demonstration with Dr. Richie was on Wednesday, March 17th. At this
time, we had all circuitry bread boarded and had just received our PCB back from
fabrication. We had also completed the power supply design and testing and had
a steady 5V output. We were able to demonstrate some software completion as
well including switching on one or more of the LED colors. We demonstrated how
the passive motion detector circuit detected motion using an LED light and how
the day/night sensor was able to switch from 0 to 5V when triggered by low
lighting (covering the sensor with a cup). We also turned in our corrected Senior
Design paper.
Shortly after this demonstration, we received our paperwork for the final
presentation which was to be scheduled on April 21-23rd. We quickly obtained
our panel of reviewers which consisted of Dr. Wasfy Mikhael, Dr. Elena Flitsiyan,
Dr. Thomas Wu, and Dr. Vik Kapoor and scheduled our final presentation for
Thursday, April 22, 2010 at 2:00 pm in HEC 450 with a short demonstration
outside the HEC building immediately following. On the day of the demonstration,
we verified that everything we needed for our presentation was brought on
campus. That morning, we practiced our power point presentation and then
assembled our fountain. We did some last minute tweaking and verified that
everything was in proper order before presenting our project to the committee.
The timeline shown in Figure 53: Estimated Time Line is a summary of the
milestones for our project.
Figure 53: Estimated Time Line
94
7
Conclusion
The Dynamic Liquid Light Fountain has turned into a successful prototype.
Should someone wish to purchase our project or build one of his/her own, it will
provide them with a new and entertaining way to enhance the aesthetic value of
their yard. At the beginning of the project, we had already received several
inquiries as to when it was scheduled to be completed and demonstrated. There
was also an interest from people on how they could purchase a fountain after it
was complete. This level of interest increased our desire to ensure that we
designed and built the fountain as correctly and visually pleasing as possible.
The team worked well together to overcome various design problems and found
ways to provide an excellent design and final product with limited financial
resources. When problems arose, no one pointed fingers at the other person;
instead, we moved forward with the solutions to our problems in a timely manner.
A few of the problems that arose during the construction and implementation of
our project are listed below with viable solutions for a future DLLF:
Mechanical:
Problem: Smooth nozzle stream was difficult to obtain due to
unsteady pump head.
Solution: Implemented surge volume which further smoothed the
laminar flow.
Solution for future projects: Purchase a steadier pump that provides
better volume control.
Hardware:
Problem: While implementing the peripherals, 5V and ground line
on header were at equal potential -> troubleshooting lead to the
discovery of incorrect 4PCB symbols.
Solution: White wired the runs to correctly complete the schematic.
Software:
Problem: Trouble implementing PWM control of the servos.
Solution: Created a daughter board containing additional hardware
to allow microcontroller to send only digital outputs for servo
control.
Problem: Color Organ relied heavily upon software implementation.
Solution for future projects: implement circuitry using hardware.
In summary, we thoroughly enjoyed designing and creating the Dynamic Liquid
Light Fountain.
95
8
Table of Figures
Figure 1: General structure of a linear AC to DC power supply .......................... 10
Figure 2: Typical transformer (Image used with the permission of Wikipedia GNU
Free Documentation.) ......................................................................................... 11
Figure 3: Non-center-tapped rectifying circuit ..................................................... 12
Figure 4: Center-tapped rectifying circuit ............................................................ 13
Figure 5: Power Supply circuit with filter capacitance shown. ............................. 14
Figure 6: Typical application of a LP3872ES-5.0 voltage regulator (Image used
with permission from National Semiconductor.) .................................................. 15
Figure 7: Typical application of a Micrel, Inc. MIC29300 series voltage regulator
(Image used with permission from Micrel, Inc.)................................................... 16
Figure 8: General structure of a switched-mode power supply ........................... 17
Figure 9: Comparison of a Linear versus Switched Mode Power Supply ........... 18
Table 1: Typical characteristics of a high brightness LED................................... 21
Figure 10: Typical constant current source with microcontroller ......................... 24
Table 4: Specifications for parts needed to build constant current source .......... 25
Figure 11: An additional configuration to drive our LEDs. ................................... 26
Figure 12: Example of a manufactured LED driver application (Image used with
permission from LuxDrive) .................................................................................. 27
Table 2: Important characteristics of a dual operational amplifier ....................... 28
Figure 13: Typical configuration of the color organ. ............................................ 29
Table 3: Components required to build a color organ ......................................... 30
Figure 14: A three-channel spectrum analyzer with LED displays ...................... 31
Figure 15: RC-5 Protocol Pulse Train (Image used with permission from San
Bergmans) .......................................................................................................... 32
Figure 16: Ultrasonic motion detector (Image used with permission from the
Cypress Semiconductor Corp) ............................................................................ 33
Figure 17: Passive Infrared (Image used with permission from the Panasonic
Co.) ..................................................................................................................... 34
Figure 18: Fresnel vs. Plano Convex Lens (pending permission from Questex
Media Group) ...................................................................................................... 35
Figure 19: PIR Sensor with Fresnel Lens (Image used with the permission of the
Cypress Semiconductor Corp.) ........................................................................... 35
Figure 20: Bipolar Stepper Motor (Image used with the permission of Cyril
Buttay) ................................................................................................................ 39
Figure 21: HITEC HS-56HB Servo Dimensional Drawing (Image used with the
permission of the HITEC RCD USA)................................................................... 40
Figure 22: LED to Fiber Coupler (pending permission from Fiber Optic Systems
Inc) ...................................................................................................................... 41
Figure 23: Living Lava Low Water Level Alarm (pending permission from Living
Lava) ................................................................................................................... 45
Figure 24: Velocity Profile of Laminar Fluid Flow (Image used with the permission
of Dr. Richard E. Klabunde) ................................................................................ 49
96
Figure 25: Simulated power supply circuit showing 120V AC input and a 5V DC
output. ................................................................................................................. 53
Figure 26: LED driver circuit implemented with microcontroller. ......................... 55
Figure 27: Infrared Remote Control Receiver Circuitry ....................................... 56
Figure 28: PIR Example Application Circuit (Image used with the permission of
the Micro Power Corp.) ....................................................................................... 57
Figure 29: PIR Motion Sensing Circuit ................................................................ 58
Figure 30: Day/Night Circuit ................................................................................ 60
Figure 31: Laminar Flow Nozzle ......................................................................... 62
Figure 32: Outlet Plate for Laminar Nozzle ......................................................... 63
Figure 33: Inlet Plate for Laminar Nozzle ............................................................ 64
Figure 34: Servo Mounting Plate ........................................................................ 66
Figure 35: Cutting Arm ........................................................................................ 66
Figure 36: Endplate Gasket ................................................................................ 67
Figure 37: Relay Driver ....................................................................................... 70
Figure 38: PCB preliminary Layout ..................................................................... 71
Table 5: Test conditions for power supply........................................................... 77
Figure 39: Simulation of load conditions ............................................................. 77
Figure 40: Correct set-up of testing equipment ................................................... 78
Figure 41: Values tested in order to verify the Power Supply is operating correctly
............................................................................................................................ 79
Figure 42: Power supply testing at full-load. ....................................................... 80
Figure 43: Current test for LED driver. ................................................................ 81
Figure 44: Ambient Light Detection Simulation Circuit ........................................ 84
Figure 45: Ambient Light Detection Simulation Results ...................................... 84
Figure 46: Servo Driver Simulation Circuit .......................................................... 85
Figure 47: Servo Driver Simulation ..................................................................... 86
Table 6: 5V Power Supply .................................................................................. 87
Table 7: LED Driver ............................................................................................ 87
Table 8: Ambient Light Sensor............................................................................ 87
Table 9: Passive IR Sensor ................................................................................ 87
Table 10: Pump Control Circuitry ........................................................................ 87
Figure 48: Remote Mode .................................................................................... 88
Figure 49: Manual Control .................................................................................. 90
Figure 50: Project Block Diagram ....................................................................... 91
Figure 51: Tasking Responsibility ....................................................................... 92
Figure 51: Total DLLF Electronics Budget .......................................................... 93
Figure 52: Mechanical Budget ............................................................................ 93
Figure 53: Estimated Time Line .......................................................................... 94
97
9
Appendix
9.1 Sources
Rozenblat, Lazar (2003).
SMPS Switching Power Supply Design.
<http://www.smps.us>
Johnson, Dave (2009).
Circuit-Classic Linear 5v Power Supply Using 6.3vac
<www.discovercircuits.com/DJ-Circuits/+5V%Transformer.htm>
Transformer.
“Schottky Diode.” Wikipedia
<http://en.wikipedia.org/wiki/Schottky_Diode>
Purdie, John C. (2003).Switched Mode Power Supplies.
<http://www.electronics-tutorials.com/basics/switched-mode-powersupplies.htm>
Arnold, Rob (2006) LED Center
LED Basics.
<http://led.linear1.org/what-are-the-electrical-characteristics-of-leds/>
Klipstein, Don (01/01/2000) The LED Light
L.E.D. Basics.
<http://www.theledlight.com/led101.html>
Kutscha, Tim (2005) Making a Color Organ.
<http://wolfstone.halloweenhost.com/ColorOrgans/clomak_MakingColorOrgan.ht
ml>
Beerten, Toon (2002-2009) High Power LED Mood Lamp.
<http://www.electronics-lab.com/projects/games/005/index.htm>l
Cake, Aaron (09/20/2009) 3 Channel Spectrum Analyzer
http://www.aaroncake.net/circuits/3chspec.asp
SB-Projects: IR remote control: Philips RC-5. Retrieved 5 Nov. 2009
< http://www.sbprojects.com/knowledge/ir/rc5.htm>
3 channel IR remote control. Retrieved 5 Nov. 2009
< http://www.sixca.com/eng/articles/remote/>
Stepper Motors. Retrieved 5 Nov. 2009
< http://www.omega.com/prodinfo/stepper_motors.html>
98
H-bridge - Wikipedia, the free encyclopedia. Retrieved 12 Nov. 2009
< http://en.wikipedia.org/wiki/H_bridge>
Hitec RCD : Servos. Retrieved 9 Dec. 2009
< http://www.hitecrcd.com/servos/show?name=HS-56HB>
CV Physiology: Laminar Flow. Retrieved 21 Nov. 2009
< http://www.cvphysiology.com/Hemodynamics/H006.htm>
IP Code - Wikipedia, the free encyclopedia. Retrieved 8 Dec. 2009
< http://en.wikipedia.org/wiki/IP_Code>
Circuit-ED - Electronic Development Products. Retrieved 17 Nov. 2009
< http://www.circuit-ed.com/TouchPanel-Overlay-for-128x64-GLCDP162C8.aspx>
Choosing the Detector for your Uniquie Light Sensing Application Retrieved 30
Oct. 2009
< http://www.engr.udayton.edu/faculty/jloomis/ece445/topics/egginc/tp4.html>
Light/Dark Detector. Retrieved 30 Oct. 2009
< http://www.aaroncake.net/circuits/lightdrk.asp>
Dark Activated Switch. Retrieved 30 Oct. 2009
< http://www.circuit-diagrams.com/dg21-Dark-Activated-Switch.php>
About motion sensors. Retrieved 29 Oct. 2009
< http://www.shed.com/tutor/sensors.html>
Fresnel lens - Wikipedia, the free encyclopedia. Retrieved 31 Oct. 2009
< http://en.wikipedia.org/wiki/Fresnel_lens>
Ultrasonic Motion Sensor - Cypress Semiconductor. Retrieved 29 Oct. 2009
< http://www.cypress.com/?rID=82>
How to use Pyroelectric ("Passive") Infrared Sensors (PIR). Retrieved 1 Nov.
2009
< http://www.ladyada.net/learn/sensors/pir.html>
Stepper Motor Control. Retrieved 9 Nov. 2009
< http://www.pyroelectro.com/tutorials/stepper_motor/index.html>
PICServo Controller. Retrieved 9 Nov. 2009
< http://www.digitalnemesis.com/info/projects/picservo/>
99
Water lifting devices. Retrieved 7 Dec. 2009
< http://www.fao.org/docrep/010/ah810e/AH810E05.htm#5.3.1>
Centrifugal Pump | Centrifugal Pump Repair | Centrifugal Pump Training.
Retrieved 10 Dec. 2009
< http://www.centrifugalpumpguide.com/>
Inrush current - Wikipedia, the free encyclopedia. Retrieved 10 Dec. 2009
< http://en.wikipedia.org/wiki/Inrush_current>
Ultrasonic Motion Detector.pdf. Retrieved 28 Oct. 2009
< http://web-ee.com/images/UltrasonicMotionDetector.pdf>
The guide to laminar flow. Retrieved 10 Oct. 2009
< http://laminar.forumotion.com/laminar-nozzle-talk-and-pictures-f1/the-guide-tolaminar-flow-t18.htm>
How to identify your Sch 40 Pvc Pipe Size. Retrieved 10 Oct. 2009
< http://flexpvc.com/PVCPipeSize.shtml>
Miga Motor Company : Modern Motion : Shape Memory Alloy Actuators : Home.
Retrieved 4 Nov. 2009
< http://www.migamotors.com/>
Solenoid glossary - The Solenoid Company. Retrieved 4 No. 2009
< http://www.thesolenoidcompany.com/glossary.php>
Solenoid Basics. Retrieved 4 Nov. 2009
< http://www.ledex.com/basics/basics.html>
Fiberoptic Systems, Inc., Retrieved 15 Oct, 2009
<http://www.fiberopticsystems.com/cust5.htm>
PCB123, Retrieved 20 Oct 2009
<http://www.pcb123.com>
Express PCB, Retrieved 20 Oct 2009
<http://www.expresspcb.com>
PCB Design, Retrieved 20 Nov 2009
<http://www.pcbdesign.org>
USNA EL461, Retrieved 20 Nov 2009
<http://www.usna.edu/EE/ee461 >
100
10
Permissions
10.1.1
Hitec HS-56HB
Hello Peter,
Thank you for choosing Hitec products. You may definitely use the spec sheet
in its entirety for your senior design project.
Thank you,
Billy Tompkins
Customer Service Rep.
Hitec RCD, LLC
Multiplex USA
Phone (858) 748- 8440
Fax (858) 859-2618
12115 Paine St.
Poway CA, 92064
10.1.2
Panasonic
Hello Peter,
We have no problem with you using an image from our NaPiOn datasheet. Please let us
know which ones you intend to use, and we can also help if you require something
additional.
In return we ask that you provide a copy of your senior design paper to review the
NaPiOn inclusion.
Attached is the most current datasheet - let us know if you have any questions.
Regards,
Tom Monczka
Product Manager
Technical Marketing Division
Panasonic Electric Works Corp. of America
Tel: (908) 464-3550 x2151
Fax: (908) 464-5719
http://pewa.panasonic.com
10.1.3
Cypress
Hello Peter,
Thank you for your interest in Cypress products.
101
In regards to your query below, please confirm you will not edit the material or any
other content of the application note without explicit, written
permission from Cypress. Please also remember to cite Cypress as the owner of the
image.
As long as the above clauses are met, you can go ahead with using image of figure 7
from application note AN2105. Please let me know if you have
any questions or need further information.
Regards,
Ashwin Varma
Cypress Customer Care
10.1.4
RC-5 Protocol
Hello Peter,
You have my permission.
Regards,
San Bergmans
www.sbprojects.com
10.1.5
Parabolic Velocity Profile
Peter,
You have my permission to use the figure you requested in your senior design
paper. I wish you the best as you continue your studies.
Sincerely,
Richard Klabunde, PhD
Athens, Ohio
10.1.6
National Semiconductor
Dear Brandy,
National Semiconductor Corporation has received your request
for permission to republish National Semiconductor’s copyrighted
material.
We need you to comply with the following requirements and you may do
so:
We need a note from you that contains the following information from Section 1:
Section 1:
1. requester name, company, address, fax and phone number
102
2. professor name, contact person, university, address,
fax and phone number for the paper, CD or the related book.
3. list of specific parts or files to be republished (or portions of
datasheet or application notes, i.e. figure 12, section 1)
4. what quantity you will be printing
5. what amount you will be charging the end user for this information
(i.e. the cost of the final publication)
6. what countries you will be printing in
You can send this information to:
National Semiconductor Corporation
Attention - Diane Trevino
3689 Kifer Road
Mail Stop G1-325
Santa Clara, CA 95051
Section 2:
1. In your printed paper or CD duplicated publication, you must acknowledge
that you are using National Semiconductor’s copyrighted material as
described in http://www.national.com/legal/ and insert the following:
Copyright © 2009 National Semiconductor Corporation
2900 Semiconductor Drive
Santa Clara, CA 95051, U.S.A.
All rights reserved
2. You must state that this information/material is reproduced with
permission from National Semiconductor and reference our
website at http://www.national.com.
3. You may use this information for only the purpose you have stated in
your original request, i.e. to be included in a paper, printed book or CD.
This material is not to be published on the internet.
4. By giving this permission, National Semiconductor does not allow
you to use our product name, company name, etc. in any promotion,
affiliation, or as sponsor of your products and services.
If you agree to the above, please sign and fax back this form to
National Semiconductor at (408) 721-1304, ATTN: Corey Coronado.
Regards,
Web Business at National
You can forward the above information to people who come your way for
permission to reprint for datasheets and application notes.
103
10.1.7
Micrel, Inc.
Hello Brandy Smith:
You have permission to use Figure 3 on page 17 of the MIC29xxx Datasheet
in your paper. Please credit the figure to Micrel Semiconductor. You may
have a problem as this datasheet on the Micrel Website is "Locked" and
graphics cannot be clipped from the PDF.
You may be able to scan and then copy the artwork.
Thank you for your interest in Micrel products.
Regards,
Michael J. English
Staff Applications Engineer
Micrel Semiconductor
408 474-1291 Voice
408 474-1000 Fax
[email protected] Email
10.1.8
Luxdrive
Hello Brandy,
Absolutely. On a side note, we are very education centric and have a number of
EE PHDs and professors from Vermont Technical College on our staff. If you
need any further support, I am sure I can get you additional resources.
Best Regards,
Jon
Jonathan Wish
LEDdynamics, Inc.
104