1
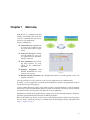
RTI Monitor
User’s Manual
Version 5.1.0
© 2010-2013 Real-Time Innovations, Inc.
All rights reserved.
Printed in U.S.A. First printing.
December 2013.
Trademarks
Real-Time Innovations, RTI, and Connext are trademarks or registered trademarks of Real-Time
Innovations, Inc. All other trademarks used in this document are the property of their respective
owners.
Copy and Use Restrictions
No part of this publication may be reproduced, stored in a retrieval system, or transmitted in any
form (including electronic, mechanical, photocopy, and facsimile) without the prior written
permission of Real-Time Innovations, Inc. The software described in this document is furnished
under and subject to the RTI software license agreement. The software may be used or copied only
under the terms of the license agreement.
Technical Support
Real-Time Innovations, Inc.
232 E. Java Drive
Sunnyvale, CA 94089
Phone:
(408) 990-7444
Email:
[email protected]
Website: https://support.rti.com/
Contents
1
Welcome............................................................................................1-1
2
Starting Monitor .................................................................................2-1
2.1 Command-line Options ........................................................................................................................ 2-1
3
Using Monitor.....................................................................................3-1
3.1 Tree Views ............................................................................................................................................... 3-1
3.2 Working with Monitor’s Panels........................................................................................................... 3-3
3.3 Entity-Specific Panels ............................................................................................................................ 3-4
3.3.1 Status Panel .............................................................................................................................. 3-5
3.3.2 Chart Panel ................................................................................................................................ 3-6
3.3.3 Description Panel .................................................................................................................... 3-7
3.3.4 Notifications Panel ................................................................................................................... 3-9
3.3.5 Distributed Logger Panel ......................................................................................................3-11
3.4 System-Wide Panels and Tables......................................................................................................... 3-14
3.4.1 System Overview Panel ........................................................................................................ 3-14
3.4.2 All Notifications Table .......................................................................................................... 3-17
3.4.3 System Types Table ............................................................................................................... 3-18
3.4.4 Processes Table ....................................................................................................................... 3-18
3.5 Joining and Leaving Domains ........................................................................................................... 3-19
3.6 Saving and Loading Data .................................................................................................................. 3-19
3.7 Connecting and Disconnecting the Display..................................................................................... 3-20
3.8 Changing Transport Settings in the Configuration File ................................................................. 3-20
iii
Chapter 1
Welcome
RTI® Monitor is a graphical tool that
displays monitoring data from RTI
Connext™ (formerly RTI Data Distribution Service) applications.
Monitor will help you:
❏ Understand your system with
an easy-to-use graphical view
into your entire Connext application.
❏ Verify your design by making
sure the entities in your Connext applications are communicating as expected.
❏ Tune performance by providing deep statistics on every
aspect of the middleware’s
operation.
❏ Optimize
integration with
detailed information on every
entity in your system.
❏ Monitor real-time operation with a dashboard of tools to see traffic patterns, errors, lost
samples, and more.
You can run Monitor on the same host as the Connext application or on a different host.
To enable a Connext application to provide monitoring data to Monitor, the application needs to
use the Monitoring Library plug-in.
Connext notifies Monitoring Library every time an entity is created/deleted or a QoS is changed.
Monitoring Library also periodically queries the status of all entities. Monitoring Library sends all
the data to Monitor once it gets the data from the Connext application.
Monitoring is enabled in the application by setting values in the DomainParticipant’s PropertyQosPolicy (programmatically or through an XML QoS profile).
Refer to the Monitoring Library Getting Started Guide, included with the Monitoring Library bundle, for details. Monitoring Library is available from the RTI Support Portal (accessible from
https://support.rti.com/).
1-1
Chapter 2
Starting Monitor
On Linux systems:
If you have RTI Launcher, you can use its Tools tab to start Monitor.
Or you can start Monitor using the provided rtimonitor script. For example, if you installed
Monitor in /opt/rti, start it by entering:
> /opt/rti/RTI_Monitor_<version>/scripts/rtimonitor
Command-line options are described in Section 2.1.
On Windows systems:
If you have RTI Launcher, you can use its Tools tab to start Monitor.
Or, from the Windows Start menu, navigate to RTI Connext <version>, RTI Connext Tools
<version> Components, RTI Monitor <version> and select RTI Monitor.
Or you can double-click <installation directory>\scripts\rtimonitor.bat in your browser.
You can also start it from the command-line if you need to use any of the options described in
Section 2.1.
2.1
Command-line Options
Monitor accepts the command-line options in Table 2.1.
Table 2.1
Command-line Options
Option
-aggregationPeriodSeconds <seconds>
Description
Monitor periodically goes through all the monitored entities in
the system (this information is saved in its own database) to
calculate aggregated statistics and states. This value controls
that minimum period (specified in seconds).
Default: 5 seconds
-help
Displays all command-line options.
-historyDepth <value>
Monitor saves some statistics’ history, so it can be displayed in
the charts. This option controls how much historical data
(number of samples) is saved per monitoring topic.
Default: 12 samples
2-1
Command-line Options
Table 2.1
Command-line Options
Option
-ignoreTypeConflicts
Description
Instructs Monitor to ignore any type conflicts. In Monitor, type
conflicts are based on type-code equality rather than type compatibility. This command-line option can be useful if you have
types that have different type-codes but are compatible.
Default: Not specified (do not ignore type conflicts)
Specifies which domains Monitor will join when it starts up.
<domain_id_list> is a list of domain IDs, each separated by a
comma.
-initialDomainIds <domain_id_list>
To specify multiple domain IDs on a Windows system,
enclose the comma-separated IDs in quotation marks. For
example: -initialDomainIds “31, 32”.
Default: If not specified, you will be prompted to enter a
domain ID when Monitor starts.
-matchRefreshPeriodSeconds
<seconds>
-notificationHistoryDepth <value>
-pruneDeadObjectsPeriodSeconds
<seconds>
Specifies the period at which to refresh the system overview
panel's matches.
Default: 5 seconds
Specifies the number of notifications to keep per entity.
Default: 12 notifications
Sets the period at which Monitor should clean up user-interface
objects (such as the Host, and Process nodes in the tree views)
that are no longer current (have no more children nodes in the
tree view). This value should be increased when dealing with
very large systems where the time to complete discovery is
longer than the default value of 3 seconds.
Default: 3 seconds
-spawnReadThreads
Instructs Monitor to use multiple threads (according to the
number of cores on the host) to retrieve data from its Connext
DataReaders (which contain monitoring data). This is typically
only needed for very large systems.
Default: Not specified (use a single read thread to retrieve data
at a period of 1 second)
Sets the verbosity for Monitor and Connext.
-verbosity <value>
0: silent (both Connext and Monitor)
1: errors (both Connext and Monitor)
2: warnings (Monitor only)
3: warnings (both Connext and Monitor)
4: information (Monitor only)
5: tracing (Monitor only)
6: tracing (both Connext and Monitor)
Default: 1
2-2
Chapter 3
Using Monitor
Monitor consists primarily of tree views and panels. There is also a toolbar for easy access to the
most commonly used commands. This chapter provides more details on Monitor’s components.
3.1
Tree Views
There are two tree views on the left:
❏ The Physical View displays all entities, arranged by their physical containment.
❏ The DDS Logical View displays all the entities, arranged by domains and topics.
When you select an entity in one of the panels, it becomes selected in the tree.
3-1
Tree Views
Figure 3.1
Monitor’s Toolbar
Sy
st
em
O
A
ll N ver
vi
ot
ew
ific
Sy
at
st
em ion
s
Ty
Pr pe
s
oc
es
se
s
Ba
ck
w
ar
Fo
d
rw
ar
d
A
ut
oJo
in
Jo
A
ct
in
iv
D
e
om
D
Le
om
a
av
in
ai
e
ns
D
D
o
is c
m
ai
on
Sa ne n
ve c
t
Lo Da
ad ta
C Da
le
ar ta
A
ll N
T il
e
ot
ific
at
St
at
io
ns
us
C
ha
r
D t
es
cr
ip
N
ot ti o
ific n
a
D
is t t i o
rib ns
ut
ed
Lo
gg
er
Entity-specific Panels
System-wide Panels
Figure 3.2
Physical and DDS Logical Views
Physical View
DDS Logical View
Note: “Topics” and “DomainParticipants” appear strictly to help organize the tree; they are not
entities. If you select either of these while viewing an unpinned entity-specific panel, Monitor behaves
as if you selected the domain or DomainParticipant above it in the tree.
Similarly, when you select an entity in a tree, any entity-specific panels are updated to display
information for the newly selected entity. One exception to this is if you use the pin button
in the upper-left corner of the panel. When a panel is pinned to an entity, it will periodically
receive updated data for the pinned entity—even when another entity is selected in the tree.
3-2
Working with Monitor’s Panels
Note: You may see a yellow question mark icon
on entities in the tree views:
❏ The question mark always appears on DomainParticipants and the 'Topics' under them
that
are
created
with
the
Monitoring
Library
option
rti.monitor.config.new_participant_domain_id. These DomainParticipants are created
solely to publish monitoring topic data; they do not publish monitoring data about
themselves.
❏ For other types of entities, the question mark means monitoring data is not available. For
information on enabling Monitoring Library in a Connext application, see the RTI
Monitoring Library Getting Started Guide.
3.2
Working with Monitor’s Panels
Monitor has several panels that display monitoring data in graphical and tabular form. Some
panels show data for a specific selected entity, while others show system-wide information:
❏ Entity-Specific Panels
• Status Panel (Section 3.3.1)
• Chart Panel (Section 3.3.2)
• Description Panel (Section 3.3.3)
• Notifications Panel (Section 3.3.4)
• Distributed Logger Panel (Section 3.3.5)
❏ System-wide Panels and Tables
• System Overview Panel (Section 3.4.1)
• All Notifications Table (Section 3.4.2)
• System Types Table (Section 3.4.3)
• Processes Table (Section 3.4.4)
You can create these panels by:
❏ Using the Window, Create Panel option from the menu
❏ Right-clicking an entity and selecting from the pop-up menu (entity-specific panels only)
3-3
Entity-Specific Panels
❏ Clicking a button on the toolbar (see Figure 3.1)
You may have multiple panels of each type open at the same time.
Panels can be arranged by various options in the Window menu. There is also a Tile button in
the toolbar.
Tile button
3.3
Entity-Specific Panels
The contents for entity-specific panels change to show whatever entity is currently selected in
the tree view. You can, however, ‘pin’ a panel to an entity to prevent it from switching contents;
to do so, use the pin button
in the upper-left corner of the panel. When a panel is pinned to
an entity (you will see the pin button changed to
), it will periodically receive updated data
for the same pinned entity—even when another entity is selected in the tree. The entity for the
entity-specific panel (pinned or unpinned) is indicated by the entity hierarchy list at the top of
the panel.
The backward
and forward
entity-selection history.
buttons in the toolbar can be used navigate through the
3-4
Entity-Specific Panels
3.3.1
Status Panel
The Status panel displays real-time statistics for the selected entity.
Figure 3.3
Status Panel
Parent list for the selected entity
Delta value
shows the
change for
the update
period
Sequence numbers are displayed for:
—Reliable DataWriters when “Filter by match” is set to All Matches
—DataReaders when “Filter by match” is set to a specific endpoint (not All Matches)
It displays statuses of the selected entity, or an aggregation of all the statuses of all the entities
that belong to that selected item. For example, if you select a DataWriter, the statuses are just for
that entity. If you select a Publisher, the statuses are an aggregation of those for all DataWriters
that belong to that Publisher. Aggregation calculation period can be controlled by the commandline parameter -aggregationPeriodSeconds (see Table 2.1 for details).
Basic and Advanced options are provided. Basic data only includes Sample Statistics and
Heartbeat Statistics (for reliable readers or writers only). The Advanced option shows all the
available statuses for the entity (some of the data is only available for reliable readers or writers).
Warnings and Error Statuses
Warnings and errors are checked for some of the statuses; warnings are highlighted in yellow,
errors are in red. See Section 3.3.4 for details on which statuses are checked for warnings or
errors. To clear the warnings and errors status of ALL entities in the system, select the
button from the toolbar or Actions, Clear All Notifications from the menu.
The Common Information section shows you general information about the entity—the GUID
for the entity for this panel, when the data was last updated, and the current update period. The
version of the remote entity is also provided (except for System, Host, and Process) in this panel.
If the version of the remote entity is incompatible with Monitor, it will be marked as a warning
3-5
Entity-Specific Panels
(the background will be yellow). In this situation, very little data will be available about the
remote entity (generally, just the information discovered about the DomainParticipant).
Filter by match only appears for DataWriters and DataReaders. If anything other than All
matches is selected, the data shown in the Status panel will only include data that belongs to the
matching kind that you have selected—a subset of the data for the entire entity.
Filter options for DataWriters
❏ All matches
❏ A selected locator
❏ A selected matching
endpoint
(DataReader)
Filter options for DataReaders:
❏ All matches
❏ A selected matching endpoint (DataWriter)
Above: Example filter options for a DataWriter. The
locators are for the transports. The matching endpoint
is a DataReader.
Below: Example filter options for a DataReader. The
matching endpoint is a DataWriter.
3.3.2
Chart Panel
The Chart panel graphs the selected statistics (on the Y axis) over time (the X axis) for the
selected entity.
You can control the time range with the slider at the bottom of the main window, and other chart
properties by right-clicking within the chart area.
Filter by match only appears for DataWriters and DataReaders— Section 3.3.1 describes the
choices.
The Chart Data options depend on the type of the selected entity.
The number of samples that can be displayed in the chart is controlled by the -historyDepth
command-line option (see Table 2.1 for details).
To plot multiple chart data for the same entity at the same time, create multiple Chart Panels.
3-6
Entity-Specific Panels
Figure 3.4
Chart Panel
3.3.3
Description Panel
The Description panel’s contents depend on what is selected in the tree view. There are three
tabs which may appear:
❏ QoS
(for
all
Connext
entities)—Shows the
QoS settings for the
selected entity.
Figure 3.5
Description Panel’s QoS Tab
3-7
Entity-Specific Panels
❏ Builtin Topic Data
(for DomainParticipants,
DataWriters,
and
DataReaders)—Shows
the propagated QoS in
the builtin topic for the
selected entity.
❏ Data Type
Figure 3.6
Description Panel’s Builtin Topic Data Tab
Figure 3.7
Description Panel’s Data Type Tab
(for DataWriters and
DataReaders)—Shows
the type name and ID;
type code serialized size;
and IDL representation of
the associated data type:
The Description panel is not
applicable when a system, host,
or process is selected, since they
are not DDS entities.
3-8
Entity-Specific Panels
3.3.4
Notifications Panel
The Notifications panel displays
Figure 3.8 Notifications Panel
the selected entity’s current status
(normal, warning or error) and a
historical list of all related alarm
statuses.
Warnings
are
highlighted in yellow, errors are
in red.
Clearing Notifications
To clear the warnings and error
status of ALL entities in the
system, select the
button from
the toolbar or Actions, Clear All
Notifications from the menu.
Historical statuses will never be
cleared. The number of saved
historical statuses is controlled by
the
-notificationHistoryDepth
command-line
option
(see
Table 2.1 for details).
Table 3.1 lists the conditions that
are considered warnings or
errors.
Table 3.1
Warning and Error Conditions
Entity
DataReader
Conditions
Warning or Error
Type Inconsistency (see Section 3.3.4.2)
Error
Incompatible QoS
Error
Samples rejected
Error
Deadlines missed
Warning
Liveliness lost
Warning
Samples lost
Warning
Using push_on_write = false with best-effort reliability or an
Error
asynchronous publisher
DataWriter
Type conflicts (equality comparison)
Error
Incompatible QoS
Error
Inactivated DataReaders
Warning
Liveliness lost
Warning
Deadlines missed
Warning
DomainParticipant
On same host as another DomainParticipant that does not
Error
agree on using shared memory
Topic
Inconsistent topic status
Error
Type conflicts might be ignored if the -ignoreTypeConflicts command-line option is used (see
Table 2.1 for details).
3-9
Entity-Specific Panels
3.3.4.1
Additional Information from RTI Distributed Logger
RTI Distributed Logger is a library that enables applications to publish log messages to Connext. If
you are interested in purchasing Distributed Logger, please contact your RTI Sales representative.
If a Connext application uses Distributed Logger, the log messages it sends to Monitor are used as
an integral part of the entity state kept for the associated Process. You can see this in Figure 3.9,
where log messages have changed the Process' state to Error because there are error-level log
messages. This is a simple but powerful way to monitor the health of a distributed system with
minimal integration work. If the application already tracks its state, it can write updates to the
state for Warning and Error to the log. Those will be picked up by Monitor and reflected in the
display.
See also: Distributed Logger Panel (Section 3.3.5).
Figure 3.9
Notifications Panel: Integrating Log Message Level with Entity State
Note: Monitor cannot downgrade entity state from Error to Warning to Normal. You can make
this change explicitly with the Clear All Notifications button on the toolbar.
3.3.4.2
Understanding Type Consistency
Monitor includes partial support for the "Extensible and Dynamic Topic Types for DDS" specification from the Object Management Group (OMG)1. This section assumes that you are familiar
with Extensible Types and you have read the Core Libraries and Utilities Getting Started Guide
Addendum for Extensible Types.
Monitor proactively checks for type consistency. This is done as new types are discovered from
DataWriters and DataReaders. If there are type inconsistencies, they will be added to the notifications for the DataWriter and DataReader. The type-consistency checking considers TypeObject
information described in the “Extensible and Dynamic Topic Types for DDS” specification.
1. http://www.omg.org/spec/DDS-XTypes/
3-10
Entity-Specific Panels
How Monitor determines type consistency:
1. If the TypeObject information is missing for either the DataWriter or DataReader:
a. If the registered type names are different, then they are inconsistent.
b. If the registered type names are equal:
• If the TypeCode information is missing for either the DataWriter or DataReader, or
if the TypeCodes are equal, they are consistent.
• Otherwise, they are inconsistent.
2. If the TypeObject information is present for both the DataWriter and DataReader:
a. If the DataReader’s TypeConsistencyEnforcementQosPolicy’s kind is set to
DISALLOW_TYPE_COERCION:
• If the types are not structurally identical, then they are inconsistent.
• Otherwise, they are consistent.
b. If the DataReader’s TypeConsistencyEnforcementQosPolicy’s kind is set to
ALLOW_TYPE_COERCION:
• If the DataReader type is not assignable to the DataWriter type, then they are
inconsistent.
• Otherwise, they are consistent.
3.3.5
Distributed Logger Panel
Monitor’s Distributed Logger panel allows you to see messages from Distributed Logger, a separate library that can be integrated with Connext applications. You can also use this panel to control Distributed Logger.
Distributed Logger is integrated into Monitor's entity state (normal, warning, and error) tracking
feature. Therefore error and warning messages logged to an application's logging system and
sent to Monitor through Distributed Logger will change a process’ status to Error and Warning,
respectively.
The Distributed Logger panel is associated with Process entities. Therefore it only displays
information when a Process is selected from the Physical View and that Process is running an
instance of Distributed Logger.
As seen in Figure 3.10, the Distributed Logger panel has three tabs:
❏ Messages Tab (Section 3.3.5.1)
❏ State and Controls Tab (Section 3.3.5.2)
❏ File Logger Tab (Section 3.3.5.3)
When a Process containing an instance of Distributed Logger is selected, the cached log messages
populate the table in the Messages tab, and the State and Controls and File Logger tabs are
updated to reflect the state of the Distributed Logger instance.
3-11
Entity-Specific Panels
Figure 3.10 Distributed Logger Panel
Selected
Process
3.3.5.1
Messages Tab
The Messages Tab, shown in Figure 3.10 and Figure 3.11, displays a table containing the log
messages from the currently selected Process. The messages can include those logged using the
application’s logging library, RTI Logger, as well as the standard out and standard error of the
application, depending on how the application configured Distributed Logger.
By default, the messages are presented sorted based on the order in which they were written. By
clicking on the column headers, you can re-sort the table to meet your needs. The panel also has
a “Find” button to do simple string searches, a control to limit the number of rows which are displayed, and a view filter which shows filters messages that are less severe than the selected
level. At the bottom of the panel is a detailed display for the selected messages from the table.
This is primarily useful when the log message contains multiple lines (only a single line is displayed in the table).
3-12
Entity-Specific Panels
Figure 3.11 Distributed Logger Panel’s “Messages” Tab
Messages from
all Distributed
Logger instances
for the selected
Process
Details for the
selected
message
3.3.5.2
State and Controls Tab
The State and Controls tab, shown in Figure 3.12, provides the ability to control the verbosity of
the Distributed Logger instance directly from Monitor. It also provides control over the RTI Logger verbosity and shows the most recent (if any) response to commands it has processed.
Figure 3.12 Distributed Logger Panel’s “State and Controls” Tab
}
}
}
Distributed
Logger
Verbosity
Control
Connext
Verbosity
Control
Most recent
response to
a command
3-13
System-Wide Panels and Tables
3.3.5.3
File Logger Tab
The File Logger tab, shown in Figure 3.13, provides a way to save log messages for a single Process to a file. This is especially useful when issues are noticed for a Process and you want to capture the output to share with others for analysis. Another more general-purpose way to save log
messages to a file is provided as an example with Distributed Logger and is detailed in the Distributed Logger Getting Started Guide.
The File Logger tab provides inputs for the file path and the queue size. There are displays that
show how many messages have been written as well as dropped (due to queue size). The current and maximum queue sizes are also displayed.
Note: The File Size may not update as quickly as the Messages Written count. In fact, the File
Size is usually zero until several messages have been written. This is because buffering is used
to increase the throughput performance while writing to the file.
Figure 3.13 Distributed Logger Panel’s “File Logger” Tab
3.4
System-Wide Panels and Tables
System-wide panels and tables show a summary of the states of the whole system.
3.4.1
System Overview Panel
The System Overview panel displays a map of the entities in the system.
You can change the criteria for how items in the map are highlighted by selecting the Notifications, Matches, or Measurement option. A Key is provided to indicate the meaning of the different highlights in the map.
If the Notifications option is selected, the map will show all the entities in the system and their
colors will show if they are in normal, warning or error mode.
If the Matches option is selected, the map will show all the entities that are currently matched
and all the entities that are currently unmatched due to potential errors.
For an ‘ideal match,’ opposing endpoints (DataWriters and DataReaders) must have the same
domain ID, same topic name, and belong to compatible partitions (if any are specified). This list
of ideal matches is compared to the list of actual matches received from Monitoring Library to
determine which entities are marked as matches or mismatches in the map. There are various
3-14
System-Wide Panels and Tables
Figure 3.14 System Overview Panel (Notifications Option)
A visual map of the system.
The outer-most box represents the host.
T=
DR =
DW =
Sub =
Pub =
DP =
P:# =
Topic
DataReader
DataWriter
Subscriber
Publisher
DomainParticipant
process ID
reasons for a mismatch, such as incompatible QoS or data types, misconfigured discovery peers,
or use of the Connext ignore_*() APIs, among other reasons.
The matches are shown at the peer-level only. That is, if you select a Publisher, you will not see
matches for the DataWriters that belong to it. Table 3.2 provides more information on what
matches are shown for selected entities.
Table 3.2
Peer-Level Objects
If you select this type of object ...
You will see matching information for ...
Host
Hosts
DomainParticipant
DomainParticipants
Publisher
Subscribers
Subscriber
Publishers
DataWriter
DataReaders
DataReader
DataWriters
Topic
Topics
If an entity is highlighted as ‘Partially Matched,’ some (not all) of its child entities are not
matched (such as a Publisher that has one matched DataWriter and one or more unmatched
DataWriters.)
3-15
System-Wide Panels and Tables
The -matchRefreshPeriodSeconds command-line option controls how often the matching information is refreshed (see Table 2.1 for details).
Figure 3.15 System Overview Panel (Matches Option)
If the Measurement option is selected, the Measurement and Scale drop-down menus are
enabled. Measurement allows you to select which data value to display in the map. Scale
allows you to control the scaling factor of the data value.
Figure 3.16 System Overview Panel (Measurement Option)
3-16
System-Wide Panels and Tables
Move the mouse over an entity in the map will show you the details of that entity for the
selected highlight mode.
The Display Name Controls simply control how the items in
the map are labeled (or whether they are hidden). Each entity
types can be hidden from the map, appear with no name label,
be labeled tersely (with just an abbreviation for the entity type,
such as T for a Topic), or include more information, such as
Entity Name, Role Name, or Topic Name.
3.4.2
All Notifications Table
The All Notifications Table shows you all the current errors and warnings for the entire system
(not just the currently selected entity).
Figure 3.17 All Notifications Table
This panel has filters to include or exclude warnings/errors. Errors are shown in red. Warnings
are shown in yellow.
If a row is selected in the table, the Select in Views button selects the entity in tree views on the
left.
The Find button is useful for searching through a large table. (This is a simple string search, so
you must use the exact same form as displayed in the table.)
Clicking on a column heading will sort the table by the values in that column. Clicking it again
will sort in the opposite order.
The
button just above the vertical scrollbar allows you to choose which columns appear in
the table. It also has options to pack (resizes) columns and enable a horizontal scrollbar. (Note: to
enable the ‘Pack Selected Column’ option, select a cell in the top row.)
Click here to see
these options
You can change the order of the columns by simply dragging them to a new place in the table.
Clearing Notifications
To clear the notifications, select the
tions from the menu.
button from the toolbar or Actions, Clear All Notifica-
3-17
System-Wide Panels and Tables
3.4.3
System Types Table
The System Types table displays all the known data types in the selected domain.
Figure 3.18 System Types Table
The Domain drop-down menu includes a list of all the joined domain IDs for you to select.
Like the All Notifications Table (Section 3.4.2), this table also has a
button (above the vertical
scrollbar) to control the columns that appear in the table. You can also sort the table based on
any of the columns by clicking the column heading.
The Find button is useful for searching through a large table. (This is a simple string search, so
you must use the exact same form as displayed in the table.)
3.4.4
Processes Table
The Processes table displays memory and CPU information for all the processes in the system.
Figure 3.19 Processes Table
These values are valid only if the host is a Linux or Windows system.
For multi-core machines, CPU usage can be greater than 1.
Like the All Notifications Table (Section 3.4.2), this table also has a
button (above the vertical
scrollbar) to control the columns that appear in the table. You can also sort the table based on
any of the columns by clicking the column heading.
For example, you can quickly sort by Total CPU to see which process is using the most. When
the process row is selected in the table, you can use the Select in Physical View button to see
where this process is within the physical tree.
The Find button is useful for searching through a large table. (This is a simple string search, so
you must use the exact same form as displayed in the table.)
3-18
Joining and Leaving Domains
3.5
Joining and Leaving Domains
By default, Monitor will automatically discover and join all active DDS domains.
To enable/disable this feature, use the
button or select
Domain, Auto-join active domains from the menu. The
enabled/disabled status for this feature is preserved between
launches of Monitor.
If the Auto-join feature is enabled: First, Monitor will join
domain 0. Then all other active domains will be discovered
through their announcements in domain 0. Each discovered
domain will be joined if it has not already been joined.
To see the currently joined domains, select Domain, Show Current Domains... from the menu.
You can manually join and leave specific domains by using the
and
buttons on the toolbar or the commands in the Domain menu. Note: When auto-join is enabled, Monitor cannot
leave domain 0.
If you leave a domain, it will not be rejoined automatically unless you disable and then re-enable
the Auto-join feature.
3.6
Saving and Loading Data
Monitor can work with live data or data that’s been saved to a file. To save monitoring data, use
the
button on the toolbar or select File, Save Data... from the menu. The file will be saved in
a Serialized Java Objects format (.ser).
To load a data file, use the
Data... from the menu.
button on the toolbar or select File, Load
When Monitor is working with saved data, you will see (Historical data
mode) in the title bar, followed by the filename. For example:
Monitor will save notifications, descriptions, and statistics (for DomainParticipants, DataReaders, and DataWriters), up to the history depth or notification history depth for every object being
monitored.
Notes:
❏ While viewing saved data, you will not see built-in topic data or the IDL representation
of the data type in the Description panel. This information is not saved in the data file.
❏ You cannot save data while using a loaded data file.
❏ After viewing saved data, to return to live data you must reconnect to the domain(s) that
you want to monitor by joining the domain (see Section 3.3.5).
3-19
Connecting and Disconnecting the Display
3.7
Connecting and Disconnecting the Display
To stop Monitor from updating the display (while still receiving data), select the
the toolbar or Actions, Disconnect Display from the menu.
To resume display updates, select the
from the menu.
button on
button on the toolbar or Actions, Connect Display
Note: Data samples may be lost at the Connext level while Monitor’s display is disconnected
because the History QoS is configured to only keep the last few samples.
3.8
Changing Transport Settings in the Configuration File
The QoS used by Monitor are in <installation directory>/config/rtimonitor_qos_profiles.xml.
You can edit this file to adjust the QoS to fit your system's needs. The typical use case is to adjust
the transport settings so that they align with the other applications in the system, as these are
critical for communication. However, changing any other settings in this file may result in
unpredictable behavior and is not supported.
Generally, the configuration file is editable on the system. There are certain circumstances where
it cannot be updated, such as on Windows 7 when Monitor is installed in the "Program Files"
directory. If this is the case, open your text editor with 'administrative' permissions before opening the QoS file.
3-20