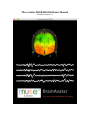
1
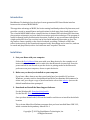
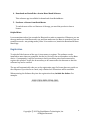
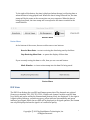
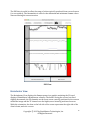
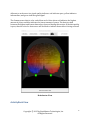
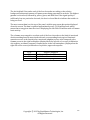
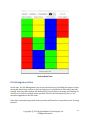
The e-‐Avatar MUSE MOOD Software Manual Software Version 1.1 Table of Contents Introduction ........................................................................................................................................... 3 Installation ............................................................................................................................................. 3 Registration ........................................................................................................................................... 4 Menu View .............................................................................................................................................. 5 Common Views ...................................................................................................................................... 6 Header Menu ..................................................................................................................................................... 6 Footer Menu ...................................................................................................................................................... 7 EEG View ................................................................................................................................................. 7 BrainAvatar View ................................................................................................................................. 8 ActivityRank View ................................................................................................................................ 9 File Management View ..................................................................................................................... 11 Saving Data ........................................................................................................................................... 12 Playback ................................................................................................................................................ 12 Snapshots .............................................................................................................................................. 12 Marking Events ................................................................................................................................... 12 Data Files .............................................................................................................................................. 13 Sensor Placement ............................................................................................................................... 13 Scientific Literature .......................................................................................................................... 15 Additional Help ................................................................................................................................... 16 Copyright © 2015 by BrainMaster Technologies, Inc. All Rights Reserved 2 Introduction BrainMaster Technologies has developed a next-‐generation EEG-‐based brain interface known as the e-‐Avatar MUSE MOOD. This app takes advantage of MUSE, the brain-‐sensing headband produced by Interaxon, and provides a portal to mental fitness and applications for both non-‐clinical and clinical uses. The e-‐Avatar MUSE MOOD offers a simple wireless 4-‐channel EEG with basic EEG functions, plus a unique volumetric projector based on a unique projection technique. This program is useful for mental health professionals, therapists, coaches, or any practitioner interested in a high-‐quality EEG for a low cost that can be used with minimal preparation or fuss. The dry sensors connect quickly to the client’s forehead, providing 4 channels of EEG that reflect brain activity in the frontal and temporal areas. Recordings can be seen live, and can be saved and played back, with a clock indicator and "snapshot" function. Installation 1. Pair your Muse with your computer Follow the User’s Manual that came with your Muse device for the complete set of instructions. In short, you need to make sure that Bluetooth is turned on. Press the power switch for six seconds to put the device in pairing mode. In the Bluetooth preferences on your computer, choose to pair the device. 2. Make sure you have Java installed on your computer If you have a Mac, chances are that you already have Java installed. If you have Windows, you may need to download and install the Java Runtime Environment. In either case, you can get a copy of Java from Oracle over at this website. Just use the default installation when prompted. 3. Download and Install the Muse Support Software For the Windows OS: Download this bundle For the Mac OS: Download this bundle Once you have downloaded, click on the installer and choose to install in the default location. The e-‐Avatar Muse Mood Software assumes that you have installed Muse SDK 3.2.3, which contains the dependency MuseIO 3.6.1. Copyright © 2015 by BrainMaster Technologies, Inc. All Rights Reserved 3 4. Download and Install the e-‐Avatar Muse Mood Software This software app is available for downloads from BrainMaster. 5. Purchase a License from BrainMaster To unlock most of the cool features of the app, you need the product to have a license. Helpful Hints It can sometimes take a few seconds for Bluetooth to make a connection. Whenever you use the app, make sure that Bluetooth is on, and then make sure the Muse is turned on (just use normal use mode -‐ not pairing mode.) After 10 seconds or so, launch the BrainAvatar Muse Mood App. Registration To unlock all the features of the app, it is necessary to register. The software can be installed on more than one computer, but the key is tied to the serial number on the Muse device. Consequently, it will be necessary to have your Muse paired and connected to register this product. It will also be necessary to be connected to the Internet so that the software key can be verified. The app will automatically take you to the registration page if a license does not reside on the computer. If you choose to cancel, only a limited set of functions will be available. When entering the Software Key into the registration form, include the dashes. For example: A1B2-C3D4-E5F6-G7H8-J9K0 Copyright © 2015 by BrainMaster Technologies, Inc. All Rights Reserved 4 Registration View Menu View Once the software is registered, the Menu View will be the first screen presented after launch. The Menu View offers four starting points: EEG; BrainAvatar; ActivityRank; File Management. Clicking on one of those four bars will open the corresponding view. Copyright © 2015 by BrainMaster Technologies, Inc. All Rights Reserved 5 Menu View Common Views Header Menu At the top of the screen, there are three buttons that allow direct transition to the other menu items described in the Menu View section of this document. To the right of these buttons, there is a button labeled “Camera” that takes a screenshot of this view. There is more discussion on this feature in the Snapshots section of this document. Copyright © 2015 by BrainMaster Technologies, Inc. All Rights Reserved 6 To the right of this button, the time is displayed when the app is collecting data or when the data is being played back. When the data is being collected live, the time stamp will be the same as the current time on your computer. When the data is being played back, the time stamp will correspond to the times recorded in the saved data file. Header Menu Footer Menu At the bottom of the screen, there are either one or two buttons. Receive Muse Data – to start receiving the data being sent by the Muse Stop Receiving Muse Data – to pause the display of Muse data If you currently saving the data to a file, then you see a second button: Mark Stimulus – to insert a timestamp into the data file being saved Footer Menu EEG View The EEG View displays the raw EEG and Gamma power data. The channels are ordered (from top to bottom): FP1, FP2, TP9, TP10. Within each channel, both the raw EEG data (top, black) and power within the Gamma band (bottom, blue) are displayed. To the right is a signal quality indicator: red indicates poor, yellow indicates intermediate, and green indicates good signal. While the raw EEG will be displayed at all signal qualities, the Gamma can only be displayed when the signal is of a sufficient quality. Copyright © 2015 by BrainMaster Technologies, Inc. All Rights Reserved 7 The EEG data is scaled is reflect the range of values typically produced from a neural source (i.e. non-‐artifact). The Gamma data is scaled to the maximum and minimum Gamma values observed during the current session. EEG View BrainAvatar View The BrainAvatar View displays the Gamma power in a graphic emulating the 3D voxel display of BrainMaster’s BrainAvatar software. The head is facing the screen, but tilted slightly downwards; the FP channels are the lower, more centrally positioned color sources within the image and the TP channels are the higher, more laterally positioned sources. With this orientation, the data on the left side of the screen represents the right side of the client’s brain, and vice-‐a-‐versa. Copyright © 2015 by BrainMaster Technologies, Inc. All Rights Reserved 8 Adjacent to each source is a signal quality indicator: red indicates poor, yellow indicates intermediate, and green indicates good signal. The Gamma power data is color-‐coded from red to blue where red indicates the highest amount of power and blue indicates the lowest amount of power. The data is scaled between the highest and lowest data values observed during this session. If the data quality is poor, then the color for that source will be black to indicate that artifact is being received. BrainAvatar View ActivityRank View Copyright © 2015 by BrainMaster Technologies, Inc. All Rights Reserved 9 The ActivityRank View ranks each of the four electrodes according to the relative, background-‐subtracted amount of Gamma power being generated at each site. The highest gamma is colored red, followed by yellow, green, and then blue. If the signal quality is sufficiently low at a particular electrode, the box is colored black to indicate that artifact is being received. The most current data is at the top of the panel, with the past seven data points displayed down the screen. The data is updated approximately every 70-‐80 milliseconds, which means that at any given time the view is displaying the last 500-‐650 milliseconds of Gamma brain activity. The columns are arranged to correlate each of the four electrodes to the kind of emotional decision-‐making function associated with each corresponding brain region. Emotional sensation occurs at the frontal poles; emotional judgment occurs at the temporal poles. Gamma power in the right hemisphere (displayed on the left side of a screen) is indicative of a negative, avoidance response; Gamma power in the left hemisphere (displayed on the right side of the screen) is indicative of a positive, approach response. TP10 Negative Judgment FP2 Negative Emotional Sensation FP1 Positive Emotional Sensation TP9 Positive Judgment Copyright © 2015 by BrainMaster Technologies, Inc. All Rights Reserved 10 ActivityRank View File Management View At this time, the File Management view serves the function of providing the option to begin saving the data from a session to file (top button), or to playback a saved session (bottom button). Selecting either button will launch a File Chooser where the name and location of a data file to be saved or loaded can be specified. The files will automatically have a “.txt” extension appended to the file name. If the data is already being saved, then top button will function to stop the process of saving the data. Copyright © 2015 by BrainMaster Technologies, Inc. All Rights Reserved 11 If a file has just been selected and loaded, the top button will be grayed out, and the bottom button will contain the text. “Stream Live EEG Data”, which indicates the intention to switch back from playing back the saved data to receiving live data. To begin playing back data from the loaded file, switch to one of the data views and control the playback by selecting the Start, Pause, or Continue buttons. The playback will automatically loop back to the start of the file when it reaches the end. Saving Data Please see the prior section on the File Management View for instructions on saving data. Playback Please see the prior section on the File Management View for instructions on loading a saved data file. Note that during playback, the time stamp in the upper right reflects time data recorded in the loaded file. Also, if the data file contains any user-‐specified event marks, the view panel will flash magenta at that time step to indicate the mark. The signal strength indicators are not active during playback. Snapshots The snapshot function is activated by pressing the Camera button located in the Header Menu portion of any of the data display views. The application will make a copy of the current view and write this image to a file in .png format. The file will be written to whatever directory in which the app currently resides. The filename will begin with the word “screenshot” followed by the timestamp at which the image was captured. For example: screenshot-‐2015-‐Feb-‐2-‐17.34.12.979.png Marking Events If the application is currently saving data, each of the data view will contain a button that says “Mark Stimulus” on the right side of the footer menu. By selecting this button, a line will be inserted into the data file being saved to indicate the timestamp at this mark, along with the identifier, “MARKED_BY_USER”. Copyright © 2015 by BrainMaster Technologies, Inc. All Rights Reserved 12 Data Files Data is saved in comma-‐delimited text files. The file header specifies the order in which the channel data is listed: Tp9, FP1, FP2, TP10. The first entry on each line is the time stamp indicating the year, month, day, hour, minute, second, millisecond, microsecond at which the data was received. The next four numbers represent the data value at each of the electrode locations. The final item indicates the kind of data: EEG, Gamma, and GammaSession. The exception to this pattern is entries inserted when the Mark Stimulus button is pressed – these lines have the same number of commas for ease of data manipulation when importing into data analysis programs, such as Excel, but there is no data between the comma marks. The Muse encodes the raw EEG data as a value between 0.0 and 1682.0 microvolts. Values around 800-‐900 microvolts reflect neural activity; values outside this range tend to be artifact. The Gamma data is not sent as frequently as the EEG data is sent from the Muse. This value is computed as the log of the EEG’s power spectrum in the frequency band from 30-‐50 Hz. The units are Bels and they are given on a log scale. Consequently, negative numbers correspond with an absolute power of less than 1. When the value is 0.0, it indicates that the signal quality was low and the value could not be computed. Typical values will range between -‐2.0 and 2.0. The GammaSession data is unitless and ranges between 0 and 1 to indicate the current power relative to a baseline computed as a function of recent historical values. For example, if the user's historical gamma power has been between 0.2 and 0.4, and their current gamma power is 0.3, then their session score will be 0.5 since 0.3 is halfway between 0.2 and 0.4. Sensor Placement In 1958, International Federation in Electroencephalography and Clinical Neurophysiology adopted standardization for electrode placement called 10-‐20 (and further refined to the 10-‐10) electrode placement system. This system standardized physical placement and designations of electrodes on the scalp. Electrode placements are labeled according adjacent brain areas: F (frontal), C (central), T (temporal), P (posterior), and O (occipital). MUSE data is collected from sites Fp1 and Fp2 (Prefrontal or forehead) as well as Tp9 and Tp10 (Temporal-‐Posterior or between the T9 & P9 and T10 & T10 sites). These sites are colored red in the following figure. Copyright © 2015 by BrainMaster Technologies, Inc. All Rights Reserved 13 10-‐10 Electrode Placement System The Muse contains three additional sensors: the center sensor is the system ground and the outside sensors are the two reference sites for computing the voltage differences. Copyright © 2015 by BrainMaster Technologies, Inc. All Rights Reserved 14 MUSE Sensor Locations EEG signals are typically broken into frequency bands for further analysis: Delta, Theta, Alpha, Beta, and Gamma. The Gamma activity in this system is the log band power between 30 and 50 Hz. Within this frequency band, emotional sensation can be detected at the frontal poles; emotional judgment can be detected at the temporal poles. Gamma power in the right hemisphere is indicative of a negative, avoidance response; Gamma power in the left hemisphere is indicative of a positive, approach response. These responses are pre-‐ cognitive, meaning that they are detected before the client is aware of their feelings or choices. TP10 Negative Judgment FP2 Negative Emotional Sensation FP1 Positive Emotional Sensation TP9 Positive Judgment Scientific Literature Additional reading can be found in the following peer-‐reviewed publications describing the science behind the e-‐Avatar MUSE MOOD, as well as implications for the counseling community: Copyright © 2015 by BrainMaster Technologies, Inc. All Rights Reserved 15 Collura, T. F., Zalaquett, R. P., Bonnstetter, C. J., & Chatters, S. J. (2013). Toward an operational model of decision making, emotional regulation, and mental health impact. Advances in mind-‐body medicine, 28(4), 18-‐33. Collura, T.F., Bonnstetter, R.G., & Zalaquett, C. (2014) Seeing inside the client's mind. Counseling Today, 57(6) 24-‐27. Additional Help If you have any questions that were not answered in this manual, please contact us at BrainMaster for help: [email protected] Copyright © 2015 by BrainMaster Technologies, Inc. All Rights Reserved 16