1
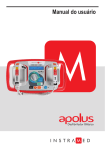
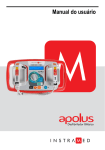
RFID Logger Software User Manual Rev 1.0 Table of Contents 1. 2. 3. 4. System Overview ..................................................................................................................................................................... 2 Installation ............................................................................................................................................................................... 2 USB RFID Interface Box............................................................................................................................................................ 3 Operation ................................................................................................................................................................................ 4 4.1. 4.2. 4.2.1. 4.2.2. 4.2.3. 4.2.4. 4.2.5. 4.3. 5. File menu ................................................................................................................................................................... 4 Device Menu .............................................................................................................................................................. 5 Preferences ................................................................................................................................................................ 5 Advanced Preferences ............................................................................................................................................... 5 Help ........................................................................................................................................................................... 5 Quick Load Icons ............................................................................................................................................................ 6 TABS......................................................................................................................................................................................... 7 5.1. 5.1.1. 5.1.2. 5.2. 5.2.1. 5.2.2. 5.2.3. 5.3. 5.3.1. 5.3.2. 6. Start Up .......................................................................................................................................................................... 4 Menu overview .............................................................................................................................................................. 4 GRAPH TAB .................................................................................................................................................................... 7 Icons .......................................................................................................................................................................... 7 Displaying Recorded Data .......................................................................................................................................... 8 DATA TABLE TAB ............................................................................................................................................................ 9 Synchronizing Data .................................................................................................................................................... 9 Exporting Table Data ............................................................................................................................................... 10 Printing Table Data .................................................................................................................................................. 10 DEVICE SETUP TAB ....................................................................................................................................................... 10 General Tab ............................................................................................................................................................. 10 Alarms Tab ............................................................................................................................................................... 12 RFID Interface Box Specification ........................................................................................................................................... 13 6.1. 6.2. Page 1 Specifications ............................................................................................................................................................... 13 FCC Statement ............................................................................................................................................................. 13 Rev 1.0 03122014 AJW 1. System Overview It is important that you read this manual completely and follow all safety precautions before operating this instrument. • This device is not intended for use in any medical or nuclear application. • This device is not intended for use in flammable or explosive environments. • Do not operate with a power source other than the one recommended in this manual. • Do not operate this device outside of the recommendations in this manual. The RFID Logger software is used in conjunction with the RFID Interface Box (part number 53969920 shown right) to read and write information from passive Near Field Communication (NFC) RFID Track-Its ). The interface box is a peripheral accessory that plugs into the USB port on a PC or Laptop. The tags can also be read using the NFC capability of certain mobile smart phones TM TM and Tablets. There is software available for Android devices on the Google Play Store – refer to the ANDROID RFID LOGGER APPLICATION USER GUIDE or RFID LOGGER QUICK START GUIDE for further information. Full details on the Track-It RFID Loggers is available in online and the RFID LOGGER USER MANUAL. The RFID Logger Software and manuals can be downloaded from: http://www.monarchinstrument.com/Software/Track-It_RFID_PC_Install.zip 2. Installation The RFID Logger software allows a user to read and display data and program the Logger. In order to interact with an actual device you will need a USB RFID Logger Interface Box (part number 5396-9920). See below. This installation is detailed for a Windows 7 system – It is similar for Windows 8. Note: Before reinstalling or upgrading the software, remove the existing versions using the Control Panel – Add/Remove Programs Download the software from http://www.monarchinstrument.com/ Software/Track-It_RFID_PC_Install.zip then unzip it and run CD_Start.exe (double click the program). The installation program will launch and display the menu shown right. If you plan to use the help files you will need to install the Acrobat TM Reader if not already present on your system. Click “Install Acrobat Reader”. To install the actual application software click the “Install Software” button. This will launch the RFID Track-It setup wizard shown below left. Click the “Next >” button to continue to the license agreement. Accept the license agreement – “I Agree” (or quit the installation) and click the “Next >” button to continue. You will then be asked to enter your information – name and business. Enter the information if you wish and click the “Next >” button to continue. Now select the installation folder – shown below right. If you wish to change the default for any reason, enter the new install location and whether the installation will be accessible to all users of this machine or just you (default). Click the “Next >” button.. Page 2 Rev 1.0 03122014 AJW On the “Confirm Installation” screen click the “Next >” button. The software will be installed. Note: This program requires the DotNet component. If it is not found on the system it will be installed. When completed click the “Close” button. A short cut icon (shown here) will be placed on the desktop. 3. USB RFID Interface Box In order to read the RFID Loggers on a PC you need to have the USB RFID Interface Box (part number 5396-9920). This Interface Box plugs into any PC USB port using the supplied USB 2.0 A Male to Mini-B 4 pin Male cable. The RFID Interface Box is identified as an HID-compliant device by Windows and does not require any special drivers. When the unit is first plugged in it may take a few minutes until the device is recognized and ready. The Interface Box must be active before running the software program. The green LED on the top panel should blink at a 1 second rate if the device is ready. The LED remains on while data is read or written to the device. Ensure the RFID Logger is placed on the designated spot on the Interface Box (shown left) to ensure reliable communication. Page 3 Rev 1.0 03122014 AJW 4. Operation 4.1. Start Up To start the program double click the RFID Logger icon shown on the right or select the program from the Start menu. The program start up window will appear as shown below. 4.2. Menu overview There are a number of menu items at the top left of the window and four function buttons at the top right of the window. 4.2.1. File menu The choices are as follows: Open This allows the user to select a previously saved file on the PC. File must be a .dat format. Save As This allows the user to save a previously opened or loaded file to the PC Export This allows the user to export the data from a previously opened or loaded file in comma delimited (CSV) format. View Summary Note: this requires that data be loaded. This will pop-up a window (shown right) that summarizes the information about the Logger. The information includes the device type, unit tag, serial number, device status, data summary, alarm activity and record information. This information may be printed by clicking the “Print” button. The window may be closed by pressing the “Close” button. Print Summary Note: this requires that data be loaded. This allows the device summary (above) to be printed directly. Clear This will clear all data from the program Exit Closes the program Page 4 Rev 1.0 03122014 AJW 4.2.2. Device Menu The choices are as follows: Upload Device Data This loads the data from a logger in the USB Interface Box. The user has the option to save this data to the PC hard drive. Read Image from Device This loads an image of the memory (includes header and data) on the device and saves it to the PC hard drive 4.2.3. Preferences This allows the user to set preferences for time/date format, engineering units and other relevant information. Temperature Units – select °C or °F Quick View Auto Close – if selected will close the popup window after 5 minutes. Language – Select language option from pull down menu. Time Format – Select 12 or 24 hour format Date Format – select mm/dd/yyyy or dd/mm/yyyy Time Zone – Set Time Zone for your area. Use Logger Time Zone – if checked the software will display the data using the time zone in the logger and will show time and date as set at the point of origin. If unchecked, time and date will be displayed in local time as set by the time zone setting. Select OK to accept, CANCEL to exit without change or ADVANCED to select additional preferences. 4.2.4. Advanced Preferences This allows the user to set preferences for auto software update checking and parameters for Mean Kinetic Temperature (MKT) as shown below. If the “Dew Point” is checked, a new trace will be plotted on the graph and a new column will be displayed on the data table if both Temperature and Humidity channels are enabled for Temp/Hum logger. 4.2.5. Help Allows the user to access this help file, check for software updates and check the revision of the software. Page 5 Rev 1.0 03122014 AJW 4.3. Quick Load Icons The four function buttons at the top right of the screen allow for data uploads. Upload data from Logger - This loads the data from a logger in the USB Interface Box. The user has the option to save this data to the PC hard drive. Equivalent to “Device – Upload Device data” above. Upload data from file – This loads previously saved data from a .dat file from the PC hard drive. Upload Quick Summary from Logger - This will load and display a quick summary from the Logger in a pop-up window. This shows the current status of the Logger. It identifies the Logger, shows the start time, time of the last sample, the record status, the number of samples recorded and the battery condition. It also shows the current alarm status. Record status can be ON – Logger is recording, OFF – Logger is not recording due to termination by button or is armed and is waiting to record (waiting for delay time or button press) and Memory Full which indicates the logger has completed the record cycle. This information can be printed using the PRINT button or the window can be closed using the CLOSE button. Note that if the window is left open and Auto Close is checked in the preferences, the window will close itself after 5 minute. Upload Quick Summary from File - This will load and display a quick summary from a previously saved data in a pop-up window. The information is the same as described above. Page 6 Rev 1.0 03122014 AJW 5. TABS 5.1. GRAPH TAB The Graph tab allows for the visualization of data. The user can choose to load an already saved file by clicking the “Upload data from file” icon or upload data from a logger by clicking the “Upload data from Logger” icon Note that in order to upload data from a logger you will need the USB RFID Interface Box. 5.1.1. Icons The graphic area is fully interactive. Data can be zoomed and scrolled, the interaction controlled by the icons above the graph. Mouse over the icons for a brief description of their function. - Pan This is the default cursor. It is used to scroll the trends horizontally and vertically by simply right clicking in the graphics area. Traces can be scrolled individually by clicking and dragging the individual vertical scales or together by clicking and dragging in the graphics area. - Expand / Compress Click this button to expand (zoom) or compress the graph along the x-axes (time) and y-axis (scale). Traces can be zoomed individually by clicking and dragging the individual vertical scales or together by clicking and dragging in the graphics area. - Zoom In Click this button to zoom in the graph. - Zoom Out Click this button to zoom out the graph. - Zoom Window Click this button to zoom to a user-defined window. When clicked, the cursor will turn into a draw window tool. Draw a window around the area of interest by holding the right mouse button and dragging the window. On release, the window area will fill the graphics screen. - Zoom X-Axis to Fit Click this button to fit all data into one screen. - Cursor Click this button to enable the cursor. There are several cursor options to enable in depth examination of the data on the graph. See below. Page 7 Rev 1.0 03122014 AJW - Scroll to End Click either the left or right scroll button to jump to the start or end of the data. - Original Scale Click this button to set the graph back to the original scale. - Clear Click this button to clear the graph and return to the start up state. There is a TEXT BOX at the top right of the graph. By default this will contain the device description, the serial number and Unit Tag. 5.1.2. Displaying Recorded Data Once loaded the data is displayed on the graph. Use the icons above to navigate around. On load all the data will be shown in a single graph. If the logger has more than one channel, all channel will be displayed. The examples here are for a temperature/humidity logger. Traces displayed can be disabled by unchecking the box for that channel on the bottom left of the graph. The vertical scales for each channel will be in the corresponding color of the trace for easy identification as is the background of the digital display. If you move the cursor anywhere on the graph and right click the mouse you will bring up the setup menu shown below. There are several options: 5.1.2.1. Channel Setup The Channel Setup dialog allows the user to modify the properties of each channel. Channel Visible Marker Type Marker Size Line Type Line Thickness Data Trace Color Alarm Trace Color Selects a channel Turns the trace on or off for the selected channel Identifies the actual points recorded. The trace is extrapolated between these points. The points can be marked by a square, circle or diamond. The user can also select None for no marker. Adjusts the size of the marker on the points. Identifies the trace type. It can be solid, dashed or dotted. Adjusts the thickness of the trace. Changes the trace color for the selected channel. Changes the alarm trace color for the selected channel. 5.1.2.2. Using the Cursor The cursor is turned on and off using the Cursor icon. This uses a single cursor to identify a point on the traces as shown here. When the mouse is moved over the cursor line the pointer will turn into a pointing finger. If you left click at this time you can drag the cursor line left or right, the data in the travelling window will update the time and value of the points in the target circle. Page 8 Rev 1.0 03122014 AJW 5.2. DATA TABLE TAB The Data Table tab displays the graphic data in tabular format with the time and date stamp of the samples along with the actual data recorded. The exact content depends on the type of logger being used. The Alarm information, in the Alm 1, Alm 2 etc. columns indicate whether the data point is in alarm – indicated by “^” for high alarm or “v” for low alarm. The user can use the scroll bar to see all the data. On the right of the window is a summary of all data recorded and the record mode used. 5.2.1. Synchronizing Data The synchronizing option allows a user to identify points on the graph using the data table and vice versa. To jump from the data table to the corresponding point on the graph, double click the value of interest in the data table as shown right. This will open the graph page with a box around the point of interest. Place the cursor in the box to see details of the point. Note that in order to see the detail and select points on the graph you should set the marker type and size in the setup option and zoom the graph accordingly. To jump from a point on the graph to the corresponding value in the data table move the cursor over the point on the trace, the cursor will change to a pointing hand, click the point and it will jump to the data table. Page 9 Rev 1.0 03122014 AJW 5.2.2. Exporting Table Data Data can be exported as a Comma Separated Variables (CSV) file by using the “Export” button shown right. The data transferred is the information in the summary area. The user can select to include all the data by checking the “Include Data Table” check box as shown right. The CSV file can then be TM imported into an Excel spread sheet. 5.2.3. Printing Table Data Data can be printed using the “Print” button shown above. The user can select to include all the data by checking the “Include Data Table” check box as shown above. 5.3. DEVICE SETUP TAB Clicking this tab will bring up the Device Setup Window There are two sub tabs – General and Alarm. The content of the General Tab is what is shown above. 5.3.1. General Tab The General Tab is where most parameters of the Logger are programmed. To set Alarms select the Alarm sub tab. To populate this page you can simply select the Data Setup tab and start with a clean set of parameters, or you can load a previously saved set of parameters by clicking the PC – Load Config button and searching for the .bin file, or you can load a configuration from a Logger by placing the logger on the Interface Box and clicking the Device – Read Config button. To send the configuration to the Logger click the Device – Send Config button. To save a copy of the configuration to the PC for later use click the PC – Save Config button. Page 10 Rev 1.0 03122014 AJW This page displays all programmable and non-programmable information about the logger. Most of the parameters can be programmed as indicated below. This page shows the Device Type, the device Serial Number and the condition of the Battery. None of these can be changed by the user. The following parameters can be changed. 5.3.1.1. Unit Tag The Unit Tag is 19 alphanumeric characters that can be used to identify the device. Enter a name that makes sense to you or leave it as it is. 5.3.1.2. Record Mode There are three ways the logger can have recording start Record Now The logger will start recording as soon as the configuration is sent to the device. Record on Button The logger will start recording when the button is pressed for more than 3 seconds. Note that in this mode the recording can also be stopped by pressing the button for more than 3 seconds. Once stopped however, the recording can only be started again by sending a new configuration to the logger. Record Later The logger recording will be delayed by a preset time. When this mode is selected a Delay Time field will be visible. You can enter a delay time from 1 minute to 999 hours. 5.3.1.3. Time and Time Zone The time displayed is the PC time and cannot be altered by the user. This is used as the reference time that is synchronized with the logger when the configuration is written. If the “Use Logger Time Zone” check box is checked, time on the graph and data table will be shown relative to the time zone in the logger itself. If unchecked the selected time zone will be overwritten in the logger. 5.3.1.4. Record and Sample Rate Record Rate - This is the rate at which the logger takes a sample and stores it in the logger memory. Refer to the Advanced settings below for further information. Select the Record Rate from the drop down menu. Choices are from 10 seconds to 60 minutes. This is all that is required to set the record rate if there are no Advanced options selected. Record Time - is the length of time the logger will record for based on the Record Rate selected. It is also a function of the number of channels in the logger and which of those channels is enabled – see below. This cannot be modified by the User. Sample Rate - If you check the Advanced radio button the Advanced options will be shown – see right. This allows the User to choose a sample rate, which is the rate at which the logger takes a sample of whatever it is recording e.g. Temperature. This sample rate is independent of the Record Rate described above. The sample rate is always less than or equal to the record rate. For this example the Record Rate is set to 5 minutes, so every 5 minutes a value is stored in memory, however the Sample Rate is set at 10 seconds, so every 10 seconds the logger takes a sample. That means after 5 minutes the logger will have taken 30 samples. The Sample rate allows the User to take more data than is recorded which saves memory space. How these samples are processed depends on the Sample Mode below. Sample Mode - Click the radio button alongside the Sample Mode you wish to use. Instantaneous The Sample rate is the same as the Record rate which is equivalent to deselecting Advanced. If you select Instantaneous the sample rate will be defaulted to the record rate. Average All samples collected between Record Rates are averaged (it is a rolling average) and then stored in memory. Page 11 Rev 1.0 03122014 AJW Maximum Minimum The maximum value of all samples taken is stored in memory at the Record rate. This is useful if you are looking for a high alarm while recording at a slower rate. The minimum value of all samples taken is stored in memory at the Record rate. This is useful if you are looking for a low alarm while recording at a slower rate. 5.3.1.5. Channels Only present if the logger being used has more than one channel. In the above case the User can select whether to record both Temperature AND Humidity or just one of these. It is not possible to disable both channels. If the radio button is checked that channel is enabled. Note – a two channel unit will record for twice as long if only one channel is enabled. 5.3.2. Alarms Tab The logger has alarms which are dependent on the type of logger being used. To view or set the Alarms select the Alarms tab. This will bring up the Alarm window shown below. This is the Alarm window from a Temperature/Humidity logger. It has two alarms per channel. The alarms are numbered 1 and 2 for Temperature and 3 and 4 for Humidity. Alarms can be enabled or disabled by clicking the (ENABLED) or change the state of the alarm. In the above example Alarm 2 is disabled. (DISABLED) icons. Each click will Alarms can be High or Low . Check the radio button to the left of the arrow to select. In the above example Alarms 1 and 3 are set as HIGH alarms, Channels 2 and 4 are set as LOW alarms. The value of the alarm can be set by clicking the text window and entering the alarm value. Note that if you enter illegal values they will not be accepted. Also a LOW alarm cannot be higher than a HIGH alarm and vice versa. Temperature Alarms in °F are rounded to the nearest 1° and are then converted to °C before being saved to the logger. Similarly the alarm value is read from the logger in °C and converted to °F. This may result in a slight rounding error which means the value entered in °F could be different to what is displayed by +1°F. This is also the accuracy of the Alarm. The temperature engineering units can be set using the Preferences Menu. Page 12 Rev 1.0 03122014 AJW 6. RFID Interface Box Specification 6.1. Specifications Protocol: Carrier Frequency: Carrier Modulation Index: Output RF Power: ISO/IEC 15693 (single subcarrier). 13.56MHz 13.553MHz min – 13.567MHz max ISO/IEC 15693 30% 55mW Interface: Power: Antenna: Size: Operating Temperature: USB (mini socket). USB cable provided. 5V from USB Port (100mA max) Fixed PCB etched antenna Plastic enclosure – 10.5cm x 6.5cm x 2.25cm (LxWxH) 0°to +50°C Operating Modes: Idle (no RF – normal mode). Read Tag – max on time 7 sec on user command, Write tag – max on time 3 sec on user command. 6.2. FCC Statement FCC ID: 2ABSR-5396-9920 This device complies with Part 15 of the FCC rules. Operation is subject to the following conditions: 1.) This device may not cause harmful interference. 2.) This device must accept any interference received, including interference that may cause undesired operation. 3.) Changes or modifications not expressly approved by Monarch Instrument could void the user’s authority to operate this device. Product FCC Label Page 13 Rev 1.0 03122014 AJW