1
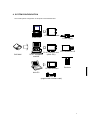
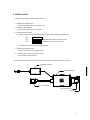
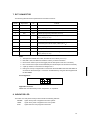
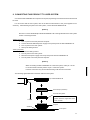
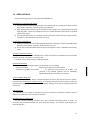
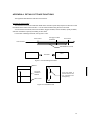
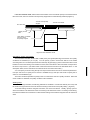
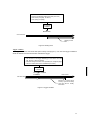
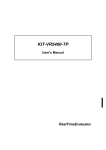
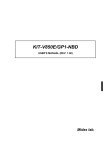
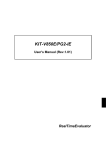
RTE-V850E/GP1-IE
USER'S MANUAL (REV.1.01)
RealTimeEvaluator
REVISION HISTORY
Rev. 1.00 June 20, 2002
First edition
Rev. 1.01 November 15, 2002
Revising following chapters
* "Measured value of execution time" was added to Chapter
10, "Cautions "
* Interface circuits RESET- and STOP- were added to
Appendix C,
* The time command was added to Appendix B, "Internal
Commands "
1
CONTENTS
1. OVERVIEW ................................................................................................................................................................3
2. MAIN FEATURES ......................................................................................................................................................4
3. HARDWARE SPECIFICATIONS ..............................................................................................................................5
4. SYSTEM CONFIGURATION.....................................................................................................................................7
5. INSTALLATION.........................................................................................................................................................8
6. DIP SWITCH SETTING.............................................................................................................................................9
7. EXT CONNECTOR ..................................................................................................................................................10
8. INDICATOR LED......................................................................................................................................................10
9. CONNECTING THIS PRODUCT TO USER SYSTEM ..........................................................................................11
Turning on power ..................................................................................................................................................11
Turning off power ..................................................................................................................................................11
10. PRECAUTIONS .....................................................................................................................................................12
Precautions for connecting user system ..........................................................................................................12
Handling RTE-V850E/GP1-IE.............................................................................................................................12
Checking connection with host ..........................................................................................................................12
Inputting external clock.........................................................................................................................................12
Caution related to delay time..............................................................................................................................12
HALT instruction....................................................................................................................................................12
Measured value of execution time.....................................................................................................................12
APPENDIX A. DETAILS OF TRACE FUNCTIONS....................................................................................................14
Overview of trace function....................................................................................................................................14
Delay count.............................................................................................................................................................15
Trace execution mode..........................................................................................................................................15
Sub-switch, section, and qualify.........................................................................................................................16
Starting trace..........................................................................................................................................................16
Trigger condition ...................................................................................................................................................17
Stopping trace........................................................................................................................................................18
Terminating trace..................................................................................................................................................18
Forced delay mode...............................................................................................................................................19
2
1. OVERVIEW
The RealTimeEvaluator-V850E/GP1-1E (hereafter referred to as "RTE-V850E/GP1-IE") is an in-circuit
emulator for NEC's RISC microcontroller V850E/GP1. It is a highly transparent, small, lightweight product,
using a chip dedicated to the emulator.
GHS's Multi can be used as a debug monitor. As the host system, a PC98 series or DOS/V computer,
on which Windows with an environment where the above Multi operates runs , is used, and connection
between the host system and RTE-V850E/GP1-IE is established by using a dedicated PCMCIA card or an
interface card for the desk-top PC.
This product is supplied with the following accessories.
1.
RTE-V850E/GP1-IE main enclosure
:
1
2.
RTE for Win32 setup disk
:
1
3.
User's Manual (1 set)
:
1
4.
GND clip
:
1
5.
RTE-PS03 power supply
:
1
6.
Pack set
:
1
The following options are also necessary for using this product. They are not standard accessories.
7.
Interface kit (interface card and cable set)
One of the following interface kits is necessary.
• PC card interface kit
• Interface kit for PC98 desk-top PC
• Interface kit for DOS/V desk-top PC
• Interface kit for PCI bus
8.
Debugger
• GHS C + Multi + Midas server
3
2. MAIN FEATURES
Source level debugger: GHS's Multi can be used.
By using GHS's Multi, seamless debugging can be executed under an integrated environment of
C/C++.
Main debugging operations, such as executing programs, setting breakpoints, and inspecting
variables, can be performed on the source code through mouse operation.
Highly transparent emulation functions
By using an emulator-dedicated chip, the emulator can be controlled without the original functions of
the CPU restricted. Almost all the signal lines are directly connected to the emulation chip, so that highly
transparent emulation functions, functionally as well as electrically, are provided.
Sufficient emulation memory capacity provided as standard
Emulation memory with a capacity equivalent to that of the internalROM and RAM of the CPU is provided,
so that debugging can be performed with a margin of memory.
Real-time trace functions
An execution history several times longer than that with the conventional trace technique can be traced
in real time by the branch information trace technique. Moreover, a wealth of event functions and a function
of time tag that can measure up to 30 hours support debugging of an embedded system.
Many dedicated cards available for communication with host
Four types of card interfaces are available.
The PC card is a Type-2 card defined by PCMCIA
Ver2.1/JEIDA Ver4.2. It can be used with a model that has a card slot. A card supporting the C bus can be
used with a PC98, and that supporting the ISA bus and PCI bus can be used with a PC-AT.
4
3. HARDWARE SPECIFICATIONS
Emulation block
Target device
V850E/GP1 (LQFP-208)
Emulation function
Operating frequency
Clock supply
Main clock
64 or 32 MHz
Automatic switching between external and internal
clocks (internal: 16 MHz)
Internal ROM emulation capacity
1 MB
Internal RAM emulation capacity
48 KB
Event function
Number of events
Execution address setting
8
Data access setting
6
Address specification
Data specification
Status specification
Number of stages of sequencer
Loop counter
Specifiable range
Maskable
Maskable
4
12
2
Break function
Hardware breakpoints
2
Software breakpoints
100
Break setting by event
Supported
Step break
Supported
Manual break
Supported
Break by external signal (High/low edge)
Supported
Trace function
Trace data bus
24 bits
Trace memory
64 bits × 128k words
Trigger setting
Trigger setting by execution address
Supported
Trigger setting by data access
Supported
Trigger setting by event
Supported
Trigger setting by external input
Supported
Start/stop specification by execution address
Supported
Trace delay
0 - 1FFFFh
Time tag
100 ns - 30h
Disassemble trace data display function
Provided
Complete trace mode specification function
(non-real time)
Provided
Internal RAM real-time display
Supported
Pin mask function
RESET-, NMI, STOP-
Operating voltage
+5.0 or +2.5 V
5
Host & interface blocks
Item
Contents
Target host machine
PC98 series
DOS/V machine
Debug monitor
GreenHills Multi (Windows95/98/NT/2000)
Interface
PC-Card Type2 (PCMCIA Ver2.1/JEIDA Ver4.2 or later)
C bus, ISA bus, PCI bus
Power supply
Dedicated power supply: RTE-PS03 (in: 100 V, out: +5 V, 3.5 A)
6
4. SYSTEM CONFIGURATION
The overall system configuration of this product is illustrated below.
PC98 interface card
PC98 series
PC-AT interface card RTE-V850E/GP1-IE
PC-AT compatible
(ISA & PCI)
machine
PC card interface
Pack set
Note PC
HRS
GHS Multi
Power supply
Cable
(supplied with interface card)
7
5. INSTALLATION
Install this product using the following procedure.
1. Installing the interface card.
→ Refer to the manual of each interface card.
2. Installing RTE for Win32.
→ Refer to the manual of RTE for Win32.
3. Initializing RTE for Win32.
(1) Start up ChkRTE2.exe and initialize RTE for Win32 with the following parameters.
RTE:
V850E/GP1-IE
I/F-1:
<< Specifies the interface card to be used.
I/F-2:
<< Specifies an IO port as necessary.
→ For details, refer to the manual of RTE for Win32.
4. Installing the debug monitor.
→ Refer to the manual of the debug monitor.
5. Connecting this product to the user system.
→ See Chapter 9 of this manual.
The following figure illustrates connection of this system (an example of using the PC card).
Dedicated AC adapter
RTE-V850E/GP1-IE
SW
PC card interface
User interface block
GND clip
8
6. DIP SWITCH SETTING
The DIP switch at the tip of the RTE-V850E/GP1-IE is used to set a mode of emulation.
SW1
Symbol
1
----
Function
Default
2
PLLSEL1
3
PLLSEL2
4
CLKHALF
ON
5
RSV
OFF
Factory-set condition (Do not change the default value.)
ON
ON
Specifies a multiplication factor of PLL.
ON
6
RSV
7
F_NBD_EXT
Specifies the type of the NBD tool to be connected to the target.
OFF: Connects RTE-NBD2. ON: Connects other than RTE-NBD2.
OFF
OFF
8
CLKINT
Specifies a mode of selecting the clock to be supplied to the CPU.
ON: Internal clock, OFF: Auto
ON
[PLLSEL1], [PLLSEL2], [CLKHALF]
Specifies a multiplication factor of PLL. The following setting is reserved.
Be sure to use the operating frequencies of only 64 and 32 MHz.
CLKHALF
PLLSEL2
PLLSEL1
Operating frequency
ON
OFF
OFF
(48 MHz)
ON
OFF
ON
(72 MHz)
ON
ON
OFF
(80 MHz)
ON
ON
ON
64 MHz
OFF
ON
ON
32 MHz
Caution: The frequency of 32 MHz is supported only by an ICE of Revision "5" or later.
[F-NBD-EXT]
Specifies the type of the NBD tool to be connected to the target.
Set this bit to OFF if no NBD tool is used.
OFF:
This setting is used when the RTE-NBD2 is used.
With this setting, the flyby access command from the ICE and an access from the
RTE-NBD2 can be simultaneously used because they are arbitrated.
Remark: At this time, the connector of this ICE must be connected to the EXT connector of the
RTE-NBD2.
ON:
This setting is used when an NBD tool other than the RTE-NBD2 is used.
With this setting, the flyby access command of the ICE cannot be used when the user
system (target) is connected.
The following table shows the combinations that can be used depending on the status of the
switch.
Switch
status
ICE: Flyby access
Without target
OFF
ON
With target
O
O
×
External:
NBD access
Usable type of NBD tool
O
RTE-NBD2 tool (EXT cable must be connected.)
O
Other than above
[CLKINT]
Specifies a mode of selecting the clock to be supplied to the CPU.
OFF:
Supplies the clock of the user system if the user system is connected. If the user
system is not connected, the internal clock is supplied.
ON:
Always supplies the internal clock (16 MHz).
9
7. EXT CONNECTOR
The following table shows the specifications of the EXT connector.
Pin No.
Signal name
I/O
Contents
1
RSV
Output
2
EXI0
Input
External input signal #0 (pulled down at 10 kΩ )
3
RSV
Input
RSV: Connected to RTE-NBD2
4
EXI1
Input
External input signal #1 (pulled down at 10 kΩ )
5
SVMODE-
Output
6
EXI2
Input
7
RESETOUT-
Output
8
EXI3
Input
9
GND
--
10
TRG-
Output
RSV: Connected to RTE-NBD2
Signal that goes high while user program is executed (open-collector
output, pulled up at 1 kΩ ).
External input signal #2 (pulled down at 10 kΩ )
Reset output. Outputs low pulse of about 50 ms when RESET command
is executed (open-collector output, pulled up at 1 kΩ ).
External input signal #3 (pulled down at 10 kΩ )
Signal ground
Trigger output. Goes low when trace trigger is detected (open-collector
output, pulled up at 1 kΩ ).
Notes:
1. The input level of EXI0, EXI1, EXI2, and EXI3 is LV-TTL level (+3 to +5 V).
2. EXI0, EXI1, EXI2, and EXI3 are loaded to memory as trace information.
3. EXI0 can be used to input a trace trigger (see the description of the tron command).
4. EXI1 can be used to input an external break (see the description of the extbrk command).
5. A pull-up resistor is connected to a voltage of +5 V.
6. RSV (pins 1 and 3) is a signal that is connected to the RTE-NBD2 when the RTE-NBD2 is
connected to the same target. Connection is established by using the cable supplied with
the RTE-NBD2.
Pin configuration:
9
7
5
3
1
10
8
6
4
2
JEXT pin configuration
Applicable connector:
XG4M-1031 manufactured by Omron Corporation, or equivalent
8. INDICATOR LED
The LEDs on a side panel of this product indicate the following statuses.
POWER:
Lights when power is supplied to the RTE system.
USER:
Lights when power is supplied to the user system.
RUN:
Lights when the u ser program is executed.
10
9. CONNECTING THIS PRODUCT TO USER SYSTEM
Connect the RTE-V850E/GP1-IE to a personal computer, by referring to the manual of the interface kit to
be used.
For connection with the user system, refer to the technical documents of the pack supplied as an
accessory. After attaching the pack to the user system, connect the RTE-V850E/GP1-IE.
[Caution]
Be sure to connect the GND clip of the RTE-V850E/GP1-IE to the signal GND of the user system
before connecting the CPU.
Turning on power
1. Turn on power to the host personal computer.
2. Connect the RTE-dedicated power supply to the power jack of the RTE-V850E/GP1-IE.
3. Turn on power to the user system.
4. Start up the debug monitor.
Turning off power
1. Exit from the debug monitor.
2. Turn off power to the user system.
3. Disconnect the power supply from the power jack of the RTE-V850E/GP1-IE.
4. Turn off power to the host personal computer.
[Caution]
When connecting the RTE-V850E/GP1-IE to the user system, match pin 1 of the
in-circuit emulator with the position of pin 1 of the user system.
Incorrect connection may cause malfunctioning of all the units connected.
The following figure illustrates connection with the user system.
Tip of RTE-V850E/GP1-IE
TQ socket (for protection)
TQ socket with guides
To GND
Be sure to use the TQ socket with
guides. Otherwise, signal lines will be
short-circuited.
TQ pack
Soldered
User system
11
10. PRECAUTIONS
Note the following points when using the RTE-V850E/GP1-IE.
Precautions for connecting user system
1) The RTE does not operate when power to the user system is off. Do not leave the in-circuit emulator
in this status. Otherwise, the user system may m alfunction.
2) When turning power to the user system off and then back on again, turn on the RTE system from the
beginning again. If power to the target is turned on or off with the RTE system turned on, the RTE
system may hang up.
3) The RTE system may not turn on correctly if the CPU on the user system does not correctly operate.
In addition, some commands may cause a hang-up.
Handling RTE-V850E/GP1-IE
1) Make sure that the pins of the socket exposed at the bottom of the tip do not touch any metallic object
while they are energized. Otherwise, malfunctioning may occur.
2) Do not warp or bend the flexible board at the tip to 90 degrees or more. Otherwise, the lines may
break.
Checking connection with host
After installation, first execute "ChkRTE2.exe" to select and set the host interface card and the RTE
system to be used, and perform a connection test.
For details, refer to "RTE for Win32 Installation Manual".
Inputting external clock
The following restrictions apply when an external clock is to be supplied.
* Input from oscillator:
* Connection of oscillator such as Xtal:
Keep the clock frequency to within 32 MHz.
The frequency range must be 8 to 20 MHz. The
constants of the external capacitor must be individually
adjusted depending on the oscillator to be used.
Caution related to delay time
Almost all the signals are directly connected between the CPU in the RTE and the user system.
However, there is a delay time of about 3 ns (typ.), as compared with when the CPU is directly connected,
because of the wiring length and capacitance up to the tip. Design the user system, taking this delay time
into account.
HALT instruction
If a break occurs as a result of execution of the HALT instruction, the address on break is the first
address of the instruction next to the HALT instruction.
Measured value of execution time
The time command displays execution time "from execution immediately before to break". Its
measured value includes overhead time (error of several clocks). The following case requires your
particular attention.
12
→ The measurement error doubles if a breakpoint is set at the execution start address. Therefore,
remove the breakpoint at the execution start address when the execution time is measured.
13
APPENDIX A. DETAILS OF TRACE FUNCTIONS
This appendix describes the real-time trace function.
Overview of trace function
The real-time trace function writes the details of the execution (trace data) output from the CPU in the
trace buffer in the ICE for each execution. You can check the data using the trace command.
You can set the trace mode, trace start condition, trigger condition, section condition, qualify condition,
and other conditions to specify the loading of trace data.
For the flow of loading trace data, see Figures 1 and 2.
Start of trace
The trigger condition
is satisfied.
End of trace
CPU execution
Data loaded into the ICE
CPU
Trace
Trace data
Figure 1 Flow of loading trace data
End
The trigger
condition is
satisfied.
If the trace buffer in
the ICE becomes full,
it is overwritten from
the beginning.
Start of trace
Figure 2 Trace data in ICE
14
Delay count
The delay count means the number of cycles in which trace data is to be loaded after the trigger
condition is satisfied (Figure 3). The number of cycles differs depending on the type of CPU execution. One
cycle is not one execution unit.
Start of trace
The trigger condition is
satisfied.
End of trace
CPU execution
Trace data is loaded
during the specified
number of cycles.
Figure 3 Flow of delay count
Trace execution mode
In the real-time mode, trace data is loaded with priority given to the CPU execution. If the trace buffer
(FIFO) in the CPU becomes full, part of trace data may not be loaded (Figure 4).
When the trace buffer in the CPU is full
CPU execution
Loading of trace
data
The details of
execution during
this section are lost.
Overflow information and
not trace data is written in
the trace buffer.
Figure 4 Real-time mode
15
In the non-real-time mode, all trace data can be loaded. If the trace buffer (FIFO) in the CPU becomes
full in this mode, the CPU execution is temporarily stopped and is automatically restarted (Figure 5).
The CPU is temporarily
stopped.
The CPU is restarted.
CPU execution
Loading of trace
data
Trace data is not loaded
when the CPU is
temporarily stopped.
Figure 5 Non-real-time mode
Sub-switch, section, and qualify
The sub-switch indicates whether OR or AND (set by tenv [subor|suband]) of the section and qualify
conditions are satisfied (on) or not (off). You can specify cycles in which trace data is to be loaded
according to the on or off status (sswon/sswoff command). By specifying cycles in which trace data is to be
loaded for sswon and nothing to be loaded for sswoff, the on/off status of this sub-switch corresponds to
the start or stop of trace. (The initial value of the sswon/sswoff command is as described above. In the
description below, these commands are assumed to be set to their initial value.)
You can specify a section using the tsp1 and tsp2 commands and evt secon and secoff parameters.
Use tsp1 and secon to specify that a section is established (on) and tsp2 and secoff to specify that a
section is not established (off).
The event condition specified for qualify in the evt command is used as a qualify condition. When the
event condition is satisfied, the qualify condition is also satisfied.
Starting trace
To start loading trace data, the following methods are available: Forced start method (tron force) and
the method using the status of the sub-switch according to the section and qualify setting. (Figure 6)
To set the loading condition using the sub-switch, use sswon and sswoff. Usually, specify cycles in
which trace data is to be loaded for sswon and nothing to be loaded for sswoff. According to this setting,
trace data is loaded in the sub-switch on state and the loading of trace data is stopped in the sub-switch off
state.
16
• Start unconditionally loading trace data (tron force)
• Set section point (tsp1, evt secon)
• Set qualify (evt qualify)
The condition
is satisfied.
Start of trace
CPU execution
Loading of trace
data
Figure 6 Starting trace
Trigger condition
A trigger condition is used as the start point of delay count (Figure 7). You can set a trigger condition to
check the details of the execution before and after the trigger.
• The instruction at the trigger address (tp) is executed or trace data
(td1, td2, td3, or td4) is accessed.
• The external signal condition is as specified (tron noext|posi|nega).
• The event match point factor is established (evt match).
The condition
is satisfied.
The trigger condition
is satisfied.
End of trace
CPU execution
Execution is traced during
as many cycles as the delay
count and trace is forcibly
terminated.
Figure 7 Trigger condition
17
Stopping trace
To stop loading trace data, use the status of the sub-switch according to the section and qualify setting.
(Figure 8)
To set the loading condition using the sub-switch, use sswon a nd sswoff. Usually, specify cycles in
which trace data is to be loaded for sswon and nothing to be loaded for sswoff. According to this setting,
trace data is loaded in the sub-switch on state and the loading of trace data is stopped in the sub-switch off
state.
• Set section point (tsp2, evt secoff)
• Set qualify (evt qualify)
The condition
is satisfied.
Stop of trace
Start of trace
Stop of trace
CPU execution
Loading of trace
data
Loading of trace
data
Figure 8 Stopping trace
Terminating trace
After trace is terminated, no more trace data is loaded.
When the end condition is satisfied, unlike the stop condition, trace is not restarted (Figure 9).
• Stop CPU execution.
• Forcibly terminate trace (troff).
• End delay count.
The condition
is satisfied.
Start of trace
End of trace
CPU execution
No more data is loaded.
Loading of trace
data
Figure 9 Terminating trace
18
Forced delay mode
In the forced delay mode, trace is forcibly terminated when trace data is loaded during the specified
delay count (number of cycles) after the start of trace. In this mode, the trigger condition is ignored (Figure
10).
When CPU execution starts, trace is started in this mode.
Start of trace
End of trace
CPU execution
Trace terminates after trace
data is loaded during as many
cycles as the delay count.
Figure 10 Forced delay mode
19