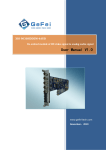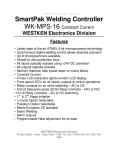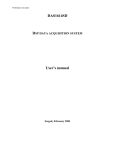
1
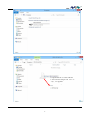
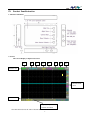
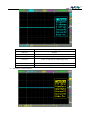
DSO Nano V3 User’s Manual Contents I Product Intro………………………………………………………………………………………..…….2 II General Safety Rules ……………………………………………………………………………….. 2 III Major Functions ………………………………………………………………………………………..2 IV Operation Precautions …………………………………………………………………………………..3 V General Inspection………………………………………………………………………………………. 3 VI Functional Inspections.............................................................................................................................. 3 VII Battery Recharging Instruction……………………………………………………………………….3 VIII Firmware Upgrades………………………………………………………………………….3 IX Product Familiarization………………………………………………………………………………. 5 1. Interface and Buttons………………………………………………………………………………5 2. Screen………………………………………………………………………………………………5 X Measurement Operation Instruction………………………………………………………………….6 1. Parameter Area Intro…………………………………………………………………………………6 2. Measurement Area Intro………………………………………………………………………6 3. Specific Parameters Intro………………………………………………………………………6 XI Application Examples……………………………………………………………………………….11 1. Example One: Measure Simple Signal……………………………………………………………11 2. Example Two: Measure with Cursor………………………………………………………………12 3. Example Three: Save Waveform Image……………………………………………………………13 4. Example Four: Acquire Single Signal………………………………………………………………14 5. Example Five: Compare Waveform Signals………………………………………………………15 I Product Intro DSO Nano pocket size oscilloscope is a compatible 32bit digital storage oscilloscope. Based on ARM TM Cortex -M3, it’s equipped with 320*240 color display, USB port and recharging function. It’s compact, simple to operate; meets the basic demands of school lab, electric furniture repairmen and electric engineering. II General Safety Rules To ensure your safety & avoid any damages to the product/connected devices, please read the following safety rules carefully. To avoid any possible dangers, please use this product according to the rules. Use appropriate power cord. Please use dedicated power cord which is certified in the country/region. Connect/disconnect properly. Do not plug/unplug when the probe(s)/test lead(s) is connected to the power source. Before you plug/unplug the current probes, please disconnect the power to the circuit-under-test. Observe all terminal ratings. To avoid fire/electric shock, please don’t measure signal with DC100V or above, or the device might be destroyed. Please read the manual carefully to know the detailed info of related ratings before connection. Please do not operate in humid environment. Please do not operate in inflammable/explosive environment. Please keep the surface of the product clean and dry. III Major Functions Display 2.8” color TFT LCD display resolution 320×240 Display Colors 65K Virtual Broadband 0-200kHz Max. Sampling Rate 1Msps 12 bit Sampling Storage Depth 4096 points Transverse Sensitivity 1uS/Div~2S/Div(1-2-5 stepping) Vertical Sensitivity 10mv/Div~10V/Div(x1 probe) 0.5V/Div~10V/Div(x10 probe) Input Resistance >500KΩ Max. Input Voltage 80Vpp(x1 probe) Coupling Mode DC Triggering Mode Auto,Normal,Single,None Fre,Duty,Vp-p,Vrms,Vavg,Vmax,Vmin Vertical Precise Measurement Cursor Horizontal Precise Measurement Cursor Auto Measurement Rising/Falling Edge Trigger Triggering Cursor Triggering Sensitivity Cursor Hold/Run Inbuilt Test Signal 10Hz~1MHz(1-2-5 stepping) Waveform Storage 2Mbyte PC Connection Interface Connection through USB Recharging Method Recharging through USB interface Dimensions 105mm×53mm×8mm 2 IV Operation Precautions ▌Temperature: Working condition:+0℃ to +500℃ Non-working condition:-20℃ to +60℃: ▌Humidity: Working condition:High temperature:40°C - 50°C,0%-60%RH Working condition:Low temperature:0°C - 40°C,10%-90%RH Non-working condition:High temperature:40°C- 60°C,5%-60%RH Non-working condition:Low temperature:0°C - 40°C,5%-90%RH V General Inspection When you get a new DSO Nano, it’s suggested to inspect the product by the following steps: 1.Inspect for damage caused by shipping. If the carton/plastic protection pad is seriously damaged, please keep the package until the product and accessories pass the inspection electrically and mechanically. 2.Inspect the product Please contact the company if the following problems occur: 1) product surface is damaged, 2) product doesn’t work properly, 3) product does not pass performance test. If the damage is resulted from shipping, please keep the package and contact the transportation department/ RIGOL distributor who is in charge of this service, for repair or exchange. VI Functional Inspection Make a quick functional inspection to ensure the product is working soundly. Please perform following steps: 1. Turn on the power supply, access homepage of the oscilloscope. 2. Connect the oscilloscope with standard signals (e.g. square wave 20KHz,Vpp=5V), set the switch on probe tip as 1X, plug oscilloscope probe to the jack. Check whether the measured signal value is the same as the standard value; it can be calibrated if the margin is small. VII Battery Recharging Instruction When the battery sign shows as “ be power on or off while recharging. ”, or when the display is dim, please recharge in time. The product can VIII Firmware Upgrade To upgrade firmware, please perform following steps: 1. Open web to access www.minidso.com, download the latest applicable firmware to your PC. 2. Simultaneously press “▼” of DSO Nano and turn on power supply, enter DFU firmware upgrade mode. 3. Use USB to connect DSO Nano to your PC, a removable disk named DFU V3_26_D will appear on your PC. Copy the hex firmware to the root directory of your disk. After the extension of the firmware changes from “hex” to “rdy”, restart DSO Nano, thus firmware is upgraded. Here we upgrade firmware to the latest Version 201V4_22. 3 1. Copy file from PC to virtual USB disk 2. After extension changes from “hex”to “rdy”,it is upgraded. 4 IX Product Familiarization 1. Interface & Buttons 2. Screen The screen display is depicted as below: A B C D E F G H Parameter Area Measurement Area Parameter Area Display the position of current waveform The table below shows the intro of button functions 5 Button Function A Run/Hold Choose to save current file ▲ Upward selection ▼ Downward selection ◄ (left/decrease)change setting parameters ► (right/increase)change setting parameters OK Menu Choose to save current parameter setting NOTE:There are corresponding colors for items in Parameter Area and Measurement Area. X Measurement Operation Instruction 1. Parameter Area Intro Menu Item Function(Operate: Press ◄or ►) A AUTO/NORM/SINGL/NONE Automation/Normal/Single B 10mV-10V(1-2-5 stepping) y-axis voltage per grid C ×1/×10 multiple D 1uS—2S(1-2-5 stepping) x-axis voltage per grid E -Inp/Data/-Data/Inp+D/D-Inp/Inp-D/Off Operation of 2 waveforms (Inp is current waveform; D/Data is previously saved waveform);Off is hide Inp and D/Data waveform F G H Triggering Method: Falling trigger, Rising edge trigger. ±80mV—±7.8V edge Horizontal triggering range Power supply by battery/ by USB / 2. Measurement Area Intro Item Function Intro Yn Y-axis Function Setting Xn X-axis Function Setting Tr Triggering Function Setting Me Measurement Function Setting Ex Waveform Operation Function Setting Fn Save and Load Function Setting Sn Output Waveform Parameters Setting Ca Calibration Setting 3. Specific Parameter Intro Choose the items in parameter area through “▲” or “▼”. Press “OK” to access parameter setting menu, use “▲” or “▼” to choose the parameter item, and then use “◄” and “►” to change the parameter value of the place where the cursor blinks. (1)Annotation of Yn parameters 6 Y Ranges Y-axis voltage per grid ProbeAtt Multiple FitRange Auto adjustment Y Offset Waveform adjusts up & down within the window CursorV1 Cursor V1:top limit of visible trigger level CursorV2 CursorV2:bottom limit of visible trigger level CursorTp Hide/ Display Measurement Cursor (2)Annotations of Xn Parameters 7 TimeBase X-axis voltage per grid Fit Base Auto adjustment ViewPosi Horizontal movement to view waveform SmplDpth Internal storage depth(1k~6k) CursorT1 Time measurement cursorT1 CursorT2 Time measurement cursorT2 CursorTp Hide/Display Measurement Cursor (3)Annotations of Tr parameters Choices of Triggering Mode SyncMode AUTO/NORM/SINGL/NONE Automation/Normal/Singular TrigMode Rising edge/falling edge triggering mode Auto Fit Auto adjustment Threshol Horizontal Triggering Position Level Sensitiv Horizontal Triggering Range CursorTp Hide/Display Horizontal Triggering Position Level (4)Annotations of Me Parameters 8 Freq Signal Frequency Duty Duty factor Vrms Voltage Effective Value Vavg Average Value of Voltage Vp-p Peak-to-Peak Voltage Vmax Maximum Voltage Vmin Minimum Voltage (5)Annotations of Ex Parameters Ext Refn 2 waveforms operation (Inp is current waveform; D/Data is previously saved waveform) -Inp/Data/-Data/Inp+D/D-Inp/Inp-D/Off Ext Posi Display current waveform 9 (6)Annotations of Fn Parameters Save Bmp Save bmp file (waveform image) to the built-in U disk Save Dat Save dat file to the built-in U disk Save Buf Save buf file (sampling buffering data) to built-in U disk Save Csv Save csv file (export sampling buffering data)to built-in U disk Load Dat load Dat Load Buf load Buf (7)Annotations of Sn Parameters Out Freq Signal output frequency Out Duty Signal output dutyfactor 10 (8)Annotations of Ca Parameters Oscilloscope Calibration:Press A Cal Zero Calibration without voltage CalRange Calibration with voltage Restore Master Reset XI Application Examples 1. Example One: Measure Simple Signal Observe one unknown signal in a circuit, quickly measure & display the signal’s frequency & peak-to-peak value. Please operate according to following steps: Connect the channel probe to the detection point of the circuit. Set the Channel mode as AUTO, adjust the (Horizontal) time calibration and (Vertical) voltage calibration, make sure the signal displays clearly. Adjust Threshol horizontal triggering position to make signal display stable. Use “▲” or “▼” to choose Me items in Measurement Area, then press “M”, use “◄” or “►”to choose the signal 11 parameters that need analysis, e.g. Freq(frequency), Duty(dutyfactor), Vpp(peak-to-peak voltage)etc., the measured value will be displayed at the lower right corner of the screen, as shown in the image below: 2. Example Two: Measure with Cursor Measured value A cursor can be used to measure the time and voltage of the waveform very quickly. (1)Measure the cycle of signal source Please operate according to the following steps: Use “▲” or “▼”to choose Xn items in Measurement Area. Press “OK” Use “▲” or “▼” to choose CursorV1 Use“◄” or “►” to adjust the position of CursorV1 to the crest. Use “▲” or “▼” to choose CursorV2 Use“◄” or “►” to adjust the position of CursorV2 to the valley. And get:△V=1.00mS i.e. the cycle of signal source. As shown in the image below: T1 12 T2 (2)Measure peak-to-peak value of the signal source. Please operate according to following steps: Use “▲” or “▼” to choose Yn items in Measurement Area Press “OK” Use “▲” or “▼” to choose CursorV1 Use “◄” or “►” to adjust the position of CursorV1 to the crest Use“▲” or “▼”to choose CursorV2 Use “◄” or “►” to adjust the position of CursorV2 to the valley And get:△V=2.08V. i.e. the cycle of signal source, as shown in the image below: V1 V2 3. Example Three:Save waveform image Sometimes waveform images need to be archived or analyzed on PC platform. Please operate according to following steps: Use “▲” or “▼” to choose the Fn items in Measurement Area, press “OK”, use“▲” or “▼” o choose Save Bmp, and then use “◄” or “►” to choose the file name on the lower right corner of the screen ,e.g.Save000.BMP, as shown in the image; and then press“||” to save it to the built-in U disk. Just copy the image to your PC, and you can analyze the waveform image. 13 4. Example Four: Acquire Single Signal It’s the superiority and feature of digital oscilloscope to easily aquire non-periodic signals like impulsion and sentus. To aquire a single signal, you need a priori knowledge of it to set trigger level & trigger edge. E.g. if impulsion is a TTL PWL logic signal, trig level should be set as 2V, trig edge as rising edge trig. If the signal is not stable, it’s suggested to observe in a normal triggering mode to define trig level & trig edge. Operation steps are as follows: Connect the channel probe to the detection point of the circuit. Set the triggering: set F as (rising edge trigger) Triggering setting: DC Coupling. Adjust horizontal time level and vertical scale to proper range. Adjust proper triggering threshold. Use “ ▲ ” or “ ▼ ”to choose Tr items in Measurement Area, press “M”; use “ ▲ ” or “ ▼ ”to choose SyncMode, and then use “◄” or “►” to choose signal triggering mode, wait for the signal that match the triggering condition to show up. If there is one signal reaching the preset threshold, it will be sampled and displayed on the screen. As shown in the picture. 14 5. Example Five: Compare waveform signals Please operate according to following steps: Input standard signal waveform to the channel, chose Data in EX, and then choose Save001.DAT to save the waveform, as shown in the image below. Input unknown to-be-measured signal to the channel, choose Fn → Load Dat → Load001.DAT, and then the to-be-compared waveforms are shown on the screen simultaneously, as shown in the image. 15