1
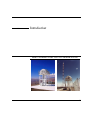
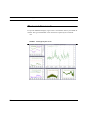
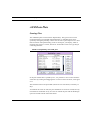
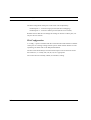
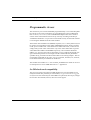
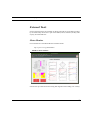
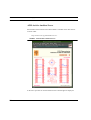
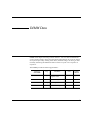
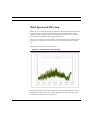
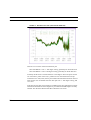
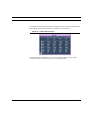
EUROPEAN
SOUTHERN
OBSERVATORY
Organisation Européenne pour des Recherches Astronomiques dans l’Hémisphère Austral
Europäische Organisation für astronomische Forschung in der südlichen Hemisphäre
VERY LARGE TELESCOPE
VLT
Astronomical Site Monitor
ASM Data
User Manual
Doc.No. VLT-MAN-ESO-17440-1773
Issue 1.0
Date 31.03.1999
S. Sandrock & R. Amestica
Prepared.......................................................................................................
Name
Date
Signature
M. Sarazin
Approved .....................................................................................................
Name
Date
Signature
M. Sarazin
Released ......................................................................................................
Name
Date
Signature
VLT PROGRAMME * TELEPHONE: +49 89 32006-0 * FAX: +49 89 320 2362
2
ASM Data User Manual - 1.0
VLT-MAN-ESO-17440-1773
ASM Data User Manual - 1.0
VLT-MAN-ESO-17440-1773
Change Record
Issue/Rev.
1.0
Date
31.03.1999
Section/Page affected
Reason/Initiation/Document/Remarks
3
4
ASM Data User Manual - 1.0
VLT-MAN-ESO-17440-1773
Contents
CHAPTER 1.
. . . . . . . . Introduction . . . . . . . . . . . . . . . . .7
The ASM on La Silla
The ASM on Paranal
CHAPTER 2.
8
9
. . . . . . . . Data Displays and Access . . . . .11
The ‘asm’ Command
ASM Data Plots
12
13
Starting Plots
Plot Configuration
Programmatic Access
15
La Silla backward compatibility
ASM Data Archive
External Tools
16
17
Meteo-Monitor
ASM Archive Ambient Server
ASM Data User Manual
5
CHAPTER 3
. . . . . . . . . DIMM Data. . . . . . . . . . . . . . . . 19
Seeing
20
Comparing Science Image Quality to DIMM Data
CHAPTER 4
CHAPTER 5
6
. . . . . . . . . Meteo Data . . . . . . . . . . . . . . . . 23
Air Pressure
Particle Count
25
26
Relative Humidity
Temperature and Dew-Point
Wind Speed and Direction
27
28
29
. . . . . . . . . Schluß . . . . . . . . . . . . . . . . . . . . 33
ASM Data User Manual
VLT-MAN-ESO-17440-1773
CHAPTER 1
Introduction
FIGURE 1.
The DIMM at La Silla - Meteo tower and DIMM on Paranal
ASM Data User Manual
7
Introduction
This manual describes the data produced and provided by the Astronomical Site
Monitor (ASM) on Paranal and La Silla, respectively, and the user interfaces to
access and display them.
Following this brief overview of the La Silla and Paranal ASMs, the individual data
attributes and their detailed meaning are described in the coming chapters for each
device (DIMM, Meteo, etc.).
The ASM on La Silla
• Location: Cerro La Silla 2400 m; 70 42’ W; 29 16’ S
• Distance from coast: 40 km
The Vaisala meteorological station was installed at La Silla in February 1985, it
includes, on a 30 m high mast, a number of sensors. The archive database started
storing data on January 1st, 1994. The following measurements are provided:
• 30 m level: Wind speed and direction
• 2 m level: Temperature, Humidity, Barometric pressure
The ESO seeing monitor (DIMM2) was installed in March 1991, on a 5m high
tower, close to the Schmidt telescope as part of the permanent Astronomical
Weather Station (AWS). Routine operation started in September 1991 and full
automation was reached in December 1993. Seeing measurements were initially
conducted from Cerro Vizcachas, 7 km to the East of La Silla, and once candidate
site for the VLT, from Oct. 1988 to Feb. 1991. As part of the same ridge, Vizcachas
and La Silla present similar seeing conditions.
The meteorological station compute and store average, root mean square and
extrema of each parameter during a preset averaging period (20 min). The sampling intervals are 2 seconds for digital sensors (wind speed and direction) and one
minute for analog sensors (Temperature, Humidity, Pressure). Twenty minute averages are ingested into the database.
The seeing is defined as the Full Width Half Maximum of a stellar image observed
with a perfect large telescope, at 500 nm wavelength and at zenith. It is measured
8
ASM Data User Manual
VLT-MAN-ESO-17440-1773
Introduction
over periods of a few minutes all night long. Maximum wind speed for operation is
about 18 m/s and sky must be clear in the zenith area.
The ASM on Paranal
• Location: Cerro Paranal, 2635 m (after levelling, 2664 m before)
70 24’ 5” W; 24 37’ 24” S
• Distance from coast: 12 km
The Vaisala meteorological station was installed in Paranal in October 1984 and
upgraded in June 1998. It includes, on a 30 m high mast, a number of sensors. The
following measurements are provided:
•
•
•
•
30 m level: Wind speed and direction, Temperature, Humidity, Particle Count
20 m level: Wind speed (three-dimensional), Particle Count
10 m level: Wind speed and direction
2 m level: Temperature and Humidity, Barometric pressure
The ESO seeing monitor (DIMM1) was installed in April 1987, at the northern
edge of the summit, and replaced by a more modern copy (DIMM3) in September
1990. Measurements were suspended in July 1991 for the 14 months duration of
the levelling work. Seeing has been then monitored during the construction period
of the VLT observatory with few interruptions. Finally, DIMM3, upgraded to VLT
standards and fully automatized was re-commissioned in August 98 as part of the
VLT Astronomical Site Monitor (ASM). Measurements are taken at 6 m above
ground.
The meteorological station compute and store average, root mean square and
extrema of each parameter during preset averaging periods (1 and 20 minutes). The
sampling intervals are 2 seconds for digital sensors (pressure, wind speed and
direction) and one minute for analog sensors (Temperature, Humidity). One and
twenty minute averages are ingested into the database (compared to only 20 min at
La Silla).
The seeing is defined as the Full Width Half Maximum of a stellar image observed
with a perfect large telescope, at 500 nm wavelength and at zenith. It is measured
ASM Data User Manual
9
Introduction
over periods of about a minute all night long. Maximum wind speed for operation
is about 18 m/s and sky must be clear in the zenith area.
The resolution of the various sensors can be taken from the tables in the coming
chapters. Approximate values, applying for Paranal and La Silla, are the following:
•
•
•
•
•
10
Wind direction: 5.63 deg (threshold: 0.3 m/s)
Wind speed: accuracy ~2% over 10 m/s (threshold: 0.4 m/s)
Temperature: accuracy ~0.1 deg
Humidity: linearity about 1%
Seeing: better than 10% above 0.25 arcsec
ASM Data User Manual
VLT-MAN-ESO-17440-1773
CHAPTER 2
Data Displays and
Access
The data that ASM provides are presented in form of plots and numerical data panels. This chapter describes in general the available display tools, which are part of
the ASM control software.
Most of these features require direct access to the ASM workstation
wasm.pl.eso.org for Paranal, respectively wasm.ls.eso.org for La Silla.
Without this access one can still query the ESO on-line archive, as shown at the end
of the chapter.
ASM Data User Manual
11
Data Displays and Access
The ‘asm’ Command
To open the ASM data displays, login on the wasm machine and set your DISPLAY
variable. The typical ASM data screen can then be opened by the command:
asm
FIGURE 2.
12
ASM typical plot screen
ASM Data User Manual
VLT-MAN-ESO-17440-1773
Data Displays and Access
ASM Data Plots
Starting Plots
The ASM data plots are based on the RtapPlotDisp. The typical screen can be
invoked with the asm command mentioned before, or individual plots can be
opened by starting RtapPlotDisp. On this one can select a plot and press View. Note
that an instance of RtapXColorMngr must be running for your display, which is
implicitly the case for a console, but not for X-terminals. In this case type RtapXColorMngr& before.
FIGURE 3.
RtapPlotDisp with ASM plots
In the plot window that is opened by View, it is possible to move vertical and horizontal axes by clicking and dragging them. To remove the scroll arrow, click again
on it.
The maximum time in the plot buffer (which one can scroll back) is normally 1.5
days.
To maintain the screen in order, the plots should not be moved or resized, but only
maximized or minimized. In any case one can refresh the plot with the “Redesign”
option accessible with the 3rd mouse button.
ASM Data User Manual
13
Data Displays and Access
The basic arrangement of the plots on the screen can be adjusted by:
asmPlotOption 1 - to select a larger plot size (but then overlapping)
asmPlotOption 2 - to select a smaller plot size (but all at once visible)
Remark however that this will change the settings for all users of these plots, not
only for the own session!
Plot Configuration
A “Config...” option is available with the 3rd mouse button which allows to disable
certain pens or to change scaling and axis options. Most of these features are selfexplaining, for details refer to the Rtap documentation.
The time scale should always be selected with respect to the six divisions on the
horizontal axis, i.e. usually 24h, 12h, 6h, 3h, 1h is appropriate.
The vertical axis has normally a fixed (no automatic) scaling.
14
ASM Data User Manual
VLT-MAN-ESO-17440-1773
Data Displays and Access
Programmatic Access
The normal way to access the ASM data programmatically is via remote Rtap database access to the wasm environment. As precondition the system configuration
files /etc/hosts, /etc/services, and /etc$RTAPROOT/RtapEnvList on the wasm as
well as on the client machine must be set up correctly according to the Rtap or
VLTSW documentation. /etc/passwd on wasm needs an entry for the same user that
is accessing the database from the client machine.
Then all the usual VLTSW tools (dbRead, sequencer, C/C++ library functions) can
be used to access attributes in the public ASM database branch, which is located
under @wasm:ASM:Public. Alias-based access makes life easier, so that one can
simply read @wasm<alias>Meteo.data or @wasm<alias>Dimm.data to get the
whole data table of Meteo and DIMM respectively. One can further detail the
address, e.g. @wasm<alias>Meteo.data(TA1L,average) reads the 20-minute average of the air temperature at 30 m height. The first word inside the parentheses
specifies the tag as listed in the device data tables in the coming chapters. The second requests a field and can be value, average, maximum, minimum, etc.; however,
not all these fields may be available for all devices.
The module asm includes a C++ class asmTCS_INTERFACE.C which can serve as
an example how to access ASM data from a C++ application.
La Silla backward compatibility
The previous system on La Silla provided the files meteo.last and dimm.last via
anonymous FTP. This possibility is still available, i.e. ftp to wasm.ls.eso.org, give
anonymous as user-name and your email address as password, then cd pub, and get
the two files. For Paranal, however, there is no such support.
ASM Data User Manual
15
Data Displays and Access
ASM Data Archive
A selected subset of the ASM data is ingested into the ESO on-line archive. Special
keywords are used for each parameter, which can be looked up in the ASM data
dictionary under:
http://archive.eso.org/dicb/DID/ESO-VLT-DIC.ASM-<version>
where <version> represents the latest release.
All public keywords used by ASM begin with ‘GEN AMBI’. The description of
individual keywords can be queried starting from:
http://archive.eso.org/dicb/
16
ASM Data User Manual
VLT-MAN-ESO-17440-1773
Data Displays and Access
External Tools
Several web-based tools are available to display selected sets of the data provided
by the ASM. They do not form a part of the ASM (control) software, but they shall
anyway be mentioned here.
Meteo-Monitor
For La Silla there is the Meteo-Monitor available under:
http://epu.ls.eso.org/lasilla/dimm
FIGURE 4.
Meteo-Monitor
It shows the up-to-date meteo and seeing data together with trending over one day.
ASM Data User Manual
17
Data Displays and Access
ASM Archive Ambient Server
Selected data of the Paranal and La Silla ASMs is available on the ESO archive
web site under:
http://archive.eso.org/asm/ambient-server
FIGURE 5.
ASM Archive Ambient Server
In the lower part also sun and moon data for the selected night are displayed.
18
ASM Data User Manual
VLT-MAN-ESO-17440-1773
CHAPTER 3
DIMM Data
DIMM means Differential Image Motion Monitor. A 30 cm class automated telescope is used to image a target star and split the light path into two spots by means
of a special optics setup. Among other values, from that image, the Seeing is determined by measuring the differential motion of the two spots over a sequence of
exposures.
The DIMM provides the following parameters:
Keyword
GEN AMBI
Tag
Parameter
Unit
FWHM
Seeing
Seeing at 500 nm wavelength at zenith
DIMM AIRMASS
Airmass
Airmass of target star
DIMM RA
PosAlpha RA of target star
HHMMSS
DIMM DEC
PosDelta
DDMMSS
ASM Data User Manual
Declination of target star
arcsec
Update
Interval
typ. 60 s
19
DIMM Data
Seeing
The plot DimmPlotSeeing displays the seeing curve.
FIGURE 6.
Seeing Plot (DimmPlotSeeing)
Two curves are available which both display the same value. For the green curve
(Seeing with Quality), red flags in the plot indicate rejected sequences, i.e. those
for which the configured validation criteria were not met (sorry, you are not permitted to change these!). Alternatively the yellow curve can be enabled for which no
quality indication is plotted. Note that if both curves are enabled, the yellow is plotted over the green one.
While the DIMM cannot deliver new data, e.g. when the telescope presets to a new
target star, during bad weather conditions when the DIMM must close, or in case of
a system failure, the plotted curve is forced to zero. As soon as valid new data is
ready, the normal curve plotting is resumed.
20
ASM Data User Manual
VLT-MAN-ESO-17440-1773
DIMM Data
Although two consecutive seeing samples are connected with a straight line, it does
of course not mean that there are valid values in between. Only the samples themselves represent valid seeing data. Even in the “red-flag-case” a dotted line is plotted, simply repeating the last valid value.
To display the current seeing value and its attributes, a small panel can be opened
with the command asmDimm.
FIGURE 7.
asmDimm panel
When no up-to-date seeing value can be provided (which is for the same cases as
when red flags in the plot appear), then its display becomes shaded.
The panel shows additionally the parameters for which the seeing has been determined: the time as well as position and airmass of the target star.
The moving bar indicates the progress of an ongoing measurement. When the bar
arrives at the right edge, the seeing display is updated.
Comparing Science Image Quality to DIMM Data
One should apply the following rules:
• Use ‘long exposures’, i.e. longer than ca. 30 seconds
• Convert the DIMM data (given at airmass = 1) to observing airmass, multiplying DIMM data by (airmass)0.6.
• Convert the DIMM data (given at wavelength λ0 = 0.5 µm) to observing center
wavelength λ, multiplying DIMM data by (λ0/λ)0.2.
• Rebin DIMM data to the exact time span of the science exposure.
ASM Data User Manual
21
DIMM Data
• Eight-meter class telescopes have reduced image motion due to finite outer
scale of turbulence, leading to an improvement of up to 10% compared to the
DIMM data.
22
ASM Data User Manual
VLT-MAN-ESO-17440-1773
CHAPTER 4
Meteo Data
The automatic weather stations of La Silla and Paranal are not the same, therefore
the provided data set is different. Consequently also the plots may differ in appearance. The subsequent images show the Paranal version.
La Silla provides the following parameters; note that some of the tags have a different assignment than those for Paranal:
Keyword
GEN AMBI
Tag
Parameter
Unit
Range
(Accuracy)
Update
Interv.
Statistics
Interval
-40 .. +60
(+/- 0.2)
60 s
20 min
60 s
20 min
TEMP1
TEMP2
TEMP3
TA1L
TA2L
TG1L
Temperature @ 30 m
Temperature @ 2 m
Ground Temperature @ -0.1 m
C
TEMPDEW2
TD2L
Dew Temperature @ 2 m
C
RHUM2
RH2L
Relative Humidity @ 2 m
%
0 .. 100
(+/- 1)
60 s
20 min
PRES
PRESQNH
PA1L
QHNL
Local Air Pressure @ 2 m
Normalized Pressure (sea level)
mbar
600 .. 1100
(+/- 0.1)
60 s
20 min
WIND SPEED1
WIND SPEED2
WIND SPEED3
WS1L
WS3L
WS2L
Wind Speed @ 30 m
Wind Speed @ 20 m
Wind Speed @ 10 m
m/s
0.4 .. 75
(+/- 0.5)
60 s
20 min
ASM Data User Manual
23
Meteo Data
Keyword
GEN AMBI
WIND DIR1
WIND DIR2
WIND DIR3
Tag
WD1L
WS3L
WD2L
Parameter
Wind Direction @ 30 m
Wind Direction @ 20 m
Wind Direction @ 10 m
(North = 0, East = 90)
Unit
deg
Range
(Accuracy)
Update
Interv.
0 .. 360
(+/- 3.0, resolution 5.6)
WS>0.4 m/s
60 s
Range
(Accuracy)
Update
Interv.
Statistics
Interval
20 min
For Paranal the following Meteo data is provided:
Keyword a
GEN AMBI
Tag b
Parameter
Unit
Statistics
Interval
TEMP1
TEMP2
TA1x
TA2x
Air Temperature @ 30 m
Air Temperature @ 2 m
C
-40 .. +60
(+/- 0.2)
60 s
1 + 20 min
TEMP3
TG1x
Ground Temperature @ -0.1 m
C
-40 .. +60
60 s
1 + 20 min
TEMPDEW1
TEMPDEW2
TD1x
TD2x
Dew Temperature @ 30 m
Dew Temperature @ 2 m
C
60 s
1 + 20 min
RHUM1
RHUM2
RH1x
RH2x
Relative Humidity @ 30 m
Relative Humidity @ 2 m
%
0 .. 100
(+/- 1)
60 s
1 + 20 min
PRES
PRESQNH
PA1x
QHNx
Local Air Pressure @ 2 m
Normalized Pressure (sea level)
hPa
500 .. 1100
(+/- 0.1)
60 s
1 + 20 min
(not archived)
PT3
Pressure trend over 3 hours
hPa
60 s
20 min
WIND SPEED1
WIND SPEED2
WS1x
WS2x
Wind Speed @ 30 m
Wind Speed @ 10 m
m/s
0.4 .. 75
(+/- 0.5)
60 s
1 + 20 min
WIND DIR1
WIND DIR2
WD1x
WD2x
Wind Direction @ 30 m
Wind Direction @ 10 m
(North = 0, East = 90)
deg
0 .. 360
(+/- 3.0, resolution 5.6)
WS>0.4 m/s
60 s
1 + 20 min
WIND SPEEDU
WIND SPEEDV
WIND SPEEDW
UU3x
UV3x
UW3x
Wind Speed @ 20 m U comp.
Wind Speed @ 20 m V comp.
Wind Speed @ 20 m W comp.
U: horizontal into 330 deg
V: horizontal into 240 deg
W: vertical up
m/s
-60 .. +60
(U/V: 1.5%,
W: 3% rms,
resol. 0.01)
60 s
1 + 20 min
DUSTS1
DUSTL1
DUSTS2
DUSTL2
M11L
M12L
M21L
M22L
0.5 µm Particle Count @ 30 m
5.0 µm Particle Count @ 30 m
0.5 µm Particle Count @ 20 m
5.0 µm Particle Count @ 20 m
1/m3
0 .. 107
60 s
20 min
a. This is the keyword with which the 1-min average of this parameter is archived in the ESO on-line database.
b. This is the tag in the Rtap database table and in the log file for this parameter. ‘x’ can be ‘S’ for 1 min or ‘L’
for 20 min statistics interval.
24
ASM Data User Manual
VLT-MAN-ESO-17440-1773
Meteo Data
Air Pressure
This plot shows the air pressure, actual and normalized for sea level. For Paranal
also a pressure trend over the last 3 hours is provided.
FIGURE 8.
Air Pressure Plot (MeteoPlotAP)
ASM Data User Manual
25
Meteo Data
Particle Count
This plot shows in four curves the particle count (dust) in 20 and 30 m height, for
particles of 5 and 0.5 µm each.
The scaling is logarithmic to accomplish a reasonable display over the whole possible range (1 to 10 million particles per m3).
FIGURE 9.
26
Particle Count Plot (MeteoPlotPC)
ASM Data User Manual
VLT-MAN-ESO-17440-1773
Meteo Data
Relative Humidity
Relative humidity is measured in two heights for Paranal. La Silla provides only
one value.
FIGURE 10.
Relative Humidity Plot (MeteoPlotRH)
The orange and red limit lines are just recommendations to close the telescope
when the humidity exceeds this value, they have no other effect. Interactive configuration of these lines is not supported.
ASM Data User Manual
27
Meteo Data
Temperature and Dew-Point
The air temperature is measured in two heights, with additional ground temperature.
The dew point is a calculated value depending on air temperature, humidity, and
pressure. It is recommended to close the telescope when the dew point comes near
the air temperature, in either height.
FIGURE 11.
Temperatures Plot (MeteoPlotTH)
For Paranal the dew point is provided for two heights, while for La Silla there is
only one.
28
ASM Data User Manual
VLT-MAN-ESO-17440-1773
Meteo Data
Wind Speed and Direction
These two plots contain the average as well as the minimum and maximum values
of the last minute. The area between minimum and maximum appears shaded,
while the average is drawn as solid line in between. Therefore one can easily see
the variability in wind speed (gusts) and wind direction.
The green curve shows the sensor data for 30 meter height and is connected to the
vertical axis on the left, the yellow shows for 10 meter and connects to the right
axis.
The preferable time scale for both is 6 hours.
FIGURE 12.
Wind Speed Plot (MeteoPlotWS)
As for humidity, the orange and red limit lines are just recommendations to close
the telescope when this value is exceeded. They have no other effect. Interactive
configuration of these lines is not supported.
ASM Data User Manual
29
Meteo Data
FIGURE 13.
Wind Direction Plot (MeteoPlotWD180/360)
There are two versions of the wind direction plot:
MeteoPlotWD180 - with +/- 180 degree scaling, preferably for North direction
MeteoPlotWD360 - with 0..360 degree scaling, preferably for South direction
Normally the direction is measured from 0 to 360 degrees. Since the plots connect
two consecutive points with a line, a problem occurs when the direction wraps
around from 0 to 360 (north). Such a plot would look awkward for direction around
north. In this case one should select the other plot with +/- 180 degree scaling, and
vice versa.
Note that only the data of two height are included in the plot, although for La Silla
and Paranal wind data for three heights are provided.The middle height is actually
omitted. Also the three-dimensional data of Paranal is not shown.
30
ASM Data User Manual
VLT-MAN-ESO-17440-1773
Meteo Data
To display the current wind parameters in numerical form, enter the command asmMeteoWind. The latest data will then be updated on your terminal.
FIGURE 14.
asmMeteoWind display
In the shown tags for Paranal, ‘S’ stands for 1-minute statistics and ‘L’ for 20minute statistics. The instant value ‘act’ is for both the same.
ASM Data User Manual
31
Meteo Data
32
ASM Data User Manual
VLT-MAN-ESO-17440-1773
CHAPTER 5
Schluß
wasm asm:~ 44 > msgSend ““ asmwsControl getsune ““
MESSAGEBUFFER:
Next sun event in 10h:15m (now is night).
ASM Data User Manual
33
Schluß
34
ASM Data User Manual
VLT-MAN-ESO-17440-1773