1
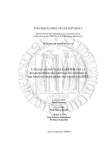
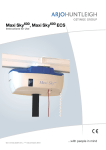
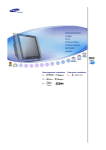
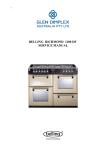
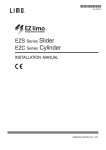
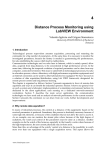
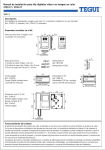
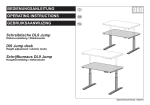
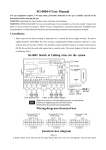
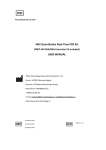
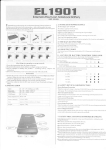
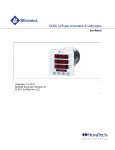
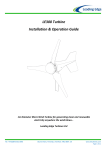
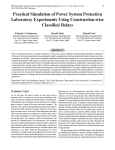
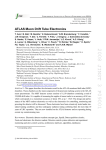
Ageing Test of ATLAS RPCs at CERN’s Gamma
Irradiation Facility
G. Aiellia , M. Alviggib , V. Ammosovd , M. Biancoc M. Bigliettib , P. Camarria , V. Canaleb , M. Capriob , R. Cardarellia ,
G. Carlinob , G. Chiodinic , F. Conventib , R. de Asmundis b , M. Della Pietrab , D. Della Volpeb ,
A. Di Ciaccioa , A. Di Simonea,1 , E. Gorinic , F. Grancagnoloc , P. Iengob , B. Libertia , A. Nisatie ,
Fr. Pastoree , S. Patricellib , R. Perrinoc , M. Primaverac , R. Santonicoa , G. Sekhniaidzeb , E. Solfarolia , S. Spagnoloc ,
Yu. Sviridovd , R. Varie , S. Venezianoe , V. Zaetsd .
a
b
University of Rome ”Tor Vergata” and INFN Sezione di Roma II
University of Naples ”Federico II” and INFN Sezione di Napoli
d
IHEP, Protvino
c
University of Lecce and INFN Sezione di Lecce
e
INFN Sezione di Roma I
Abstract— An ageing test of three ATLAS production RPC
stations is in progress at X5 GIF, the CERN irradiation facility.
The chamber efficiency as a function of the operating voltage
is measured at different source intensities, up to a maximum
counting rate of about 700 Hz/cm2 . All along the test, plate
resistivity has been monitored using two different methods: by
measuring the I-V characteristics in pure Ar, and by comparing
the efficiency vs high voltage curves at different source intensities.
The increase in plate resistivity, which is one of the dominant
ageing effects for RPCs with phenolic-melaminic electrodes, has
been shown to be strongly dependent on environmental relative
humidity. Indeed, after setting to values between 40% and 50%
the relative humidity of both the operating gas and the air
surrounding the chambers, a significant decrease of the plate
resistivity has been observed.
I. I NTRODUCTION
The accelerator background at LHC will be dominated by
soft neutrons and gammas that are generated by interactions of
beam protons at very small angle [2]. Such a heavy background
calls for severe requirements on the trigger detector in terms of
rate capability and time resolution, which is crucial for bunch
crossing identification. Moreover, for almost all the chambers
installed in the ATLAS cavern, it will be impossible to perform
any hardware reparation or substitution once the commissioning
of the detector is terminated. It is therefore crucial that the
chambers do not show any abnormal ageing effect which could
degrade their performace during the ∼10 years of the ATLAS
operation. For this reason an ageing test of three production
ATLAS RPCs is being performed at CERN. The chambers are
irradiated with γ rays in order to test their rate capability and
to integrate the total charge of 0.3C/cm2 corresponding to ∼
10 ATLAS years at the rate of 100Hz/cm2 which includes a
safety factor of 5.
1 Corresponding
author.
[email protected]
Tel.
+39
062023644.
E-mail:
An-
Fig. 1. Experimental setup at X5/GIF, with the trigger configuration used for
cosmic rays runs.
II. E XPERIMENTAL SETUP
The Gamma Irradiation Facility, GIF, located downstream
of the final dump of the X5 beam, uses a 137 Cs source of
20Ci to produce a large flux of 660 keV γ rays. A system
of lead filters allows to reduce the flux up to a factor of 104 .
The X5 muon beam can also be sent into the area. A more
detailed description of this facility and of the characteristics
of the γ flux can be found in [1]. Three production ATLAS
RPC chambers (type BML-D, with gas volumes of 1.4m2 ) are
installed in the GIF area, along the beam line. A schematical
view of the setup is shown in figure 1. The chambers have 2
0-7803-8701-5/04/$20.00 (C) 2004 IEEE
detector layers which are read out by strips oriented in both
the η and ϕ directions. The chambers are perpendicular to the
X5 beam line, with the long side (about 4m) oriented in the
vertical direction. For details on the chamber structure, see [3].
The trigger is provided by the coincidence of three scintillator
layers of 33x40 cm2 , each made of a three slabs hodoscope.
During the beam runs, the three layers are aligned along the
beam line, while for the cosmic rays runs, they are arranged as
a telescope with the axis oriented at 40 degrees with respect
to the vertical direction, in order to maximize the trigger rate.
Signals from the frontend electronics are sent to a standard
ATLAS “splitter board” [4] as in the final architecture foreseen
for the trigger and readout electronics, and subsequently to
TDCs working in common stop mode (see [5]) which record
up to 16 hits per event per channel, in a 2µs gate. Both the
leading and falling edges of the signals are recorded. The data
acquisition is performed using a LabViewTM application.
The DCS system, monitors both the low and and high voltages
as well as the gap currents. The chambers are operated with
the standard ATLAS gas mixture C2 H2 F4 /i–C4 H10 /SF6 =
94.7/5/0.3. Gas composition, together with all relevant environmental data such as pressure, temperature and relative
humidity are controlled as well. The gas relative humidity, also
monitored by the DCS, is set in the range of 30%-50% by
bubbling in water a fraction of the total gas flow.
In July 2003 the gas closed loop was introduced on 4 out
of the 6 tested gas gaps, in order to simulate the real working
conditions in ATLAS. The output gas of the chambers goes
through a system of filters and then is sent again in the gaps,
together with a fraction of fresh gas. The two remaining gaps
were left in open flow for comparison. The total gas flow was
set at 40 l/h, and the fraction of recirculated gas has been
gradually increased up to 95%. Gas samples were taken at the
input and output of the chambers and analyzed in order to find
any polluting component related to the chamber operation.
III. C HAMBER PERFORMANCE
During the test, the chamber efficiencies are periodically
monitored using cosmic rays triggered by the scintillators.
Higher statistics efficiency measurements are made whenever
the X5 muon beam is available.
For each event, the muon trajectory is reconstructed. The
scintillator slabs of the trigger system, of size 11x40cm2 , would
only allow a very modest tracking. The tracking capability is
therefore improved using the hits recorded by the RPCs, as
described below:
1) hits recorded by the RPC under test are ignored in the
tracking.
2) only hits registered in a time window of 25ns around the
beam peak are considered useful for the track reconstruction, in order to reduce the probability to use an accidental
photon hit in the tracking.
3) for each electronic channel (i.e. for each strip) a dead
time of 50ns is applied by the analysis algorithm, in order
to avoid any double counting due, for example, to after
pulses.
4) tracks are reconstructed only for events showing a single
cluster in at least three layers (out of the five available).
This is useful to improve the quality of the reconstructed
track eliminating, for example, di-muon events.
5) a track in both the η and ϕ directions is required.
6) the layer is considered efficient if it shows a cluster
aligned to the track within ±1 strip.
The steps described above are repeated for each gas gap. Single counting rates and average cluster sizes are also measured
for each layer.
Chamber efficiencies at closed source, measured periodically
both with cosmic rays and with the X5 beam, did not show
any loss along the test. Figure 2 shows the efficiency vs HV
plots for Station 1 gap 1 ϕ at different source intensities.
The high current driven by the gaps under source irradiation
causes a voltage drop across the plates. Due to this drop, the
plateaus show a shift towards higher voltages and a slower
raise, compared with the plateaus taken without irradiation.
This effect is enhanced in winter by low operating temperatures
(10÷15 C) which increase the plate resistivity.
IV. AGEING EFFECTS IN R ESISTIVE P LATE C HAMBERS
Long time operation of resistive plate chambers is known
(see for example [10]) to produce two main ageing effects,
which degrade the detector performance:
• changes in the chemical composition of the plates may
increase their resistivity, thus reducing the rate capability.
• the quality of the inner surface of the plates is degraded
by continuous operation with fluoride-rich gas mixtures,
leading to an increase of the noise in the detector.
Both effects have been extensively studied during this test,
and appropriate techniques have been introduced to reduce to
an acceptable level all the losses in performace related to the
detector ageing.
A. Plate resistivity evolution
It has long been known [6] that the electrical properties of
the plastic laminate depend on the environment temperature
and relative humidity. Materials such as phenolic-melaminic
laminates have a negative temperature coefficient, i.e their resistivity decreases for increasing temperature. Moreover, when
the plates are exposed to dry air circulation, their resistivity
gradually increases even by a large factor. This effect is
completely reversible once the sample is left at room RH
for a sufficient time. On the other hand, plates kept under
high current densities (hundreds of µA/m2 ) for long periods,
also show a gradual increase in resistivity which is found to
be faster when the plates are operated at lower RH values.
This effect of the relative humidity has been shown [8] to be
selective, in the sense that its effect is much more effective
if the humidification is performed on the anode side of each
plate. These observations suggest that both the gas mixture
and the external environment need to be humidified in order
to guarantee that the anodes of the two electrode plates are
operated in the proper RH conditions. To achieve the necessary
control on the external relative humidity, the area surrounding
0-7803-8701-5/04/$20.00 (C) 2004 IEEE
efficiency
Gap 1 - ϕ
500
450
1
400
0.8
Gap current (uA)
350
0.6
no source
0.4
0.2
gap 1
300
gap 2
gap 3
250
gap 4
gap 5
200
gap 6
a.f. 2
150
full source
100
50
0
8.5
9
9.5
10
10.5
HV (kV)
0
0
500
1000
1500
2000
2500
3000
Standard voltage (V)
Fig. 2.
Efficiency versus high voltage at different source intensities, as
measured with the muon X5 beam.The plot refers to Station 1, gap 1, ϕ,
after 5 ATLAS years of ageing.
Fig. 3.
I-V characteristics in pure Argon.
Resistivity evolution
gap 1 Argon
gap 2 Argon
gap 3 Argon
gap 4 Argon
gap 5 Argon
gap 6 Argon
Gap1 eff. plateau
Gap2 eff. plateau
Gap3 eff. plateau
Gap4 eff. plateau
Gap5 eff. plateau
Gap6 eff. plateau
mC/cm^2
RH fresh gas
200
350
300
150
250
200
100
150
100
50
Integrated Charge (mC/cm^2)
RH
400
ρ (G Ω cm) @ 20 °C
the three chambers under test has been delimited using PET
foils. The air relative humidity near the chambers is hence
controlled by means of two humidifiers.
Two different methods were followed for the resistivity
measurements:
HV drop correction. This method is based on the comparison
of the efficiency plateaus with and without source irradiation.
The current driven under irradiation is much higher than the
one just due to the muon beam or cosmic rays. This current
produces a significant voltage drop across the plates and the
voltage applied to the gas can be written (see [7]) as
50
0
0
11/10/2002 19/01/2003 29/04/2003 07/08/2003 15/11/2003 23/02/2004 02/06/2004 10/09/2004
Vgas = V − Rpl Igap
(1)
where Vgas is the effective voltage on the gas gap, V is the
power supply voltage and I is the current driven by the gap.
This drop causes the efficiency plateaus under irradiation to
be shifted at higher HV values, as shown in figure 2. This shift,
allows to evaluate the plate resistivity when the gap current is
also measured.
I-V characterstic in pure Argon. The standard ATLAS gas
mixture is replaced by pure Ar. As shown in figure 3, the I-V
curve is characterized in this case by a transition region around
V=2 kV with a fast current increase. For higher voltages a
linear current increase is observed. We assume that above the
transition voltage, the drop across the Argon remains constant,
so that the slope ∆V /∆I in the linear region gives the plates
total resistance.
Figure 4 shows the evolution of the plate resistivity as a
function of time for the six gaps under test. The relative
humidity of the gas mixture is shown as well. Starting from
October 2003 both the inner gas and the environment surrounding the chambers were put under a constant 50% RH value.
The resulting decrease in resistivity is clearly visible in the
plot. This effect was shown to be reversible: a second period
without humidification of the external air has produced again
an increase in the plate resistivity.
Fig. 4. Plate resistivity evolution. The controlled environment RH period is
marked, together with the gas RH all along the test.
B. Surface damage and noise level monitoring
The gap current, defined as the total current driven by the gas
as read on a resistance put on the ground connection of the gap,
is continuously monitored by the DCS system. It is a reliable
estimator of the number of avalanches in the gap and therefore
of the noise level, when measured at low irradiation. Gap
current measurements as a function of the operating voltage
where taken almost daily all along the test, pointing out two
main causes for the increase of the noise in the detector:
• temperature increases have shown to be responsible for
increases in the gap currents (at working point);
• any malfunctioning of the gas system, such as insufficient
total flow or lack of maintenance of the recirculation
system’s filters, had a serious impact on the gas gaps,
causing a rapid increase of the gap currents.
Figure 5 shows the variation of the working currents of the
six gaps along the test as well as the operating temperature.
Current measurements are taken at closed source. It is clear
the correlation between temperature and current variations, in
particular for Station1, gap2 (gap 2 in the plot). The current
0-7803-8701-5/04/$20.00 (C) 2004 IEEE
Working current evolution
gap 1 open flow
gap 5 closed loop
gap 2 open flow
gap 6 closed loop
1 volume/2 h
gap 3 closed loop
T
V. DAMAGE RECOVERY
50% external RH
35
30
Wrong mixture
Filter exausted
25
25
20
20
15
15
10
10
5
0
Temperature (°C)
30
21/10/02
5
29/1/03
9/5/03
17/8/03
25/11/03
4/3/04
Fig. 5. Working current evolution. Gap numeration is given here starting
from the nearest to the source (gap 1) to the farthest (gap 6). The gas flow (in
volumes per hour) is reported, together with the start of the recirculation test.
External RH control is indicated as well.
Ohmic current evolution
gap 1 open flow
gap 2 open flow
gap 3 closed loop
gap 5 closed loop
gap 6 closed loop
T
gap 4 closed loop
recirculation stop
0.7
30
0.6
25
0.4
20
0.3
15
0.2
Temperature (°C)
Current (micro A)
0.5
10
0.1
0
21/10/02
5
29/01/03
recirculation stop with no major effects on the working currents
lead indeed to a high increase in the ohmic currents.
1 volume/0.5 h (recirculation)
40
Current (micro A)
gap 4 closed loop
09/05/03
17/08/03
25/11/03
04/03/04
Fig. 6. Ohmic current evolution. Gap numeration is given here starting from
the nearest to the source (gap 1) to the farthest (gap 6).
increase, which is amplified in summer, is however completely
reversible, as shown in the plot. Working currents have also
proven to be an effective tool to detect any malfunctioning of
the gas recirculation system. The two arrows in figure 5 point
out peaks of current due to two of such events: the first is due
to a wrong gas mixture and the second one to the exhaustion
of one of the filters of the recirculation system.
In addition to working current, a useful parameter for the
diagnostics of the plate surface status is the measurement of
ohmic current, defined as the gap current at low voltage, where
no gas multiplication is possible. Ohmic currents are only due
to conduction through the internal surface and can therefore
indicate the presence of pollutants on the plate surface before
any actual damage of the surface can occur. The typical HV
range for ohmic currents measurements is 5÷7kV . Figure 6
shows the evolution of the ohmic currents for the gaps under
study. A comparison with figure 5 clearly shows that ohmic
currents have very small absolute values but show larger relative
increases as a consequence of gas problems. For example, the
effect of filter exhaustion is much bigger on the ohmic currents
than on the working currents. Wrong gas mixture didn’t have
any influence on the ohmic currents, as expected, while a
The X5/GIF test was also an important benchmark for testing
suitable techniques of damage recovery. The most significant
case of recovery followed an accident in which, after an
integrated charge corresponding to about 7 ATLAS years (with
a safety factor of 5), a malfunctioning of the recirculation
system caused the suspension of the gas flow while a problem
with the DCS system prevented the HV to be turned off. The
result was a three days operation period under full irradiation
with no gas flow. As a consequence, the chambers showed a
very high increase in both ohmic and working currents which
prevented the chambers from reaching full efficiency under
full irradiation. At closed source, however, chamber performace
was still satisfactory. The recovery procedure consisted in the
following steps:
• the chambers were fluxed with pure Argon at 3 volumes/hour for about five weeks, and a sensitive decrease
of the gap currents was observed. Nevertheless, the noise
level at working point was still too high to allow efficient
operation of the chambers under full irradiation, being
still ohmic and working currents greater than their normal
values by a factor 3.
• for
the following two months the chambers
were fluxed with an isobutane enriched mixture
(C2 H2 F4 /i–C4 H10 /SF6 = 84.7/15/0.3), keeping
their HV at a low value (7kV ). The decision to increase
the isobutane concentration is based on the observation,
made in previous tests, about the strong effect of isobutane
in recovering a damaged plate surface. Indeed, during the
operation with the new mixture both ohmic and working
currents returned to their normal values, as shown in
figure 7, where the values of the currents are plotted as
a function of time. For clarity, only the measurements
taken at the same temperature are shown.
VI. C ONCLUSION
The measurements performed at X5-GIF on three ATLAS
production RPCs provided important information on the ageing
effects of the gas gaps. As known from previous tests [10],
the plate resistivity increased significantly at the beginning of
the test, mainly due to the dry environment. Once the relative
humidity of the experimental area has been put under control
and set around ∼50%, the resistivity showed a significant
decrease. The performance of all tested chambers remains much
above the ATLAS requirements. Indeed, after an integrated
charge corresponding to 7 ATLAS years (including a safety
factor of 5) all the gaps under test showed a very good detection
efficiency even at fully opened source, with a counting rate of
about 600Hz/cm2 .
Both ohmic and closed source working currents were used to
monitor the quality of the internal plate surface. Any problem
related to the gas system has shown to generate an increase on
both currents. In particular, the increase on the ohmic currents
0-7803-8701-5/04/$20.00 (C) 2004 IEEE
25
1
0.8
23
20
21
15% isobutane
gap
1
Serie1
gap
2
Serie2
gap
3
Serie3
gap
4
Serie4
Serie5
gap
5
Serie6
gap
6
TSerie7
25
I (uA)
30
1.2
27
T (°C)
35
I (uA)
15% isobutane
Serie1
gap 1
Serie2
gap 2
Serie3
gap 3
Serie4
gap 4
Serie5
gap 5
Serie6
gap 6
Serie7
T
27
25
23
0.6
21
T (°C)
40
15
10
19
Working
currents
17
5
0
13/02/2004
15
03/04/2004
23/05/2004
12/07/2004
31/08/2004
0.4
0.2
19
Ohmic
currents
17
0
13/02/2004
15
03/04/2004
23/05/2004
12/07/2004
31/08/2004
Fig. 7. Gap current isotherms. The values of ohmic and gap current of the six gaps are plotted as a function of time. Only measurements taken at the same
temperature are plotted.
was shown to be a very early and safe indicator of gas poisoning. These increases were completely reversible, provided that
the gas flow and composition are promptly restored to correct
values.
The present gas recirculation system has been proven to be
(so far at the level of ∼4 ATLAS years of ageing) adequate to
ATLAS, provided that the filters are properly maintained and
changed when necessary.
Damage recovery procedures such as Argon fluxing and
low voltage operation with isobutane-enriched mixtures were
successfully applied after a critical stop of the gas system
which caused major damages to the internal plate surface.
ATLAS RPCs have thus shown to be robust enough to tolerate
extremely harmful events, on the condition that proper recovery
techniques are applied.
R EFERENCES
[1] S. Agosteo et al., A facility for the test of large area muon chambers at
high rate, CERN-EP-2000-031, February 16th, 2000.
[2] A. Ferrari and P. Sala, ATLAS Internal Note, MUON-NO-162 (1997).
[3] ATLAS Muon Collaboration, ATLAS Muon Spectrometer Technical Design Report, CERN/LHCC 97-22.
[4] ATLAS Collaboration, ATLAS First-Level Trigger Technical Design Report, CERN/LHCC 97-22 (1998).
[5] E. Gennari et al., 32 channel TDC VME board - User’s Manual,
http://sunset.roma2.infn.it/tdc/tdcboard.ps.
[6] R. Cardarelli et al., Avalanche and streamer mode operation of resistive
plate chambers, NIM, Nuclear Instruments and Methods in physics
research A382 (1996).
[7] G. Aielli, Ph.D. thesis, University of Rome Tor Vergata, February 2001.
[8] G. Aielli et al., Electrical conduction properties of phenolic-melaminic
laminates, presented at the ”VII Workshop on Resistive Plate Chambers
and related detectors”, Clermont-Ferrand, October 20-22, 2003.
[9] G. Aielli et al., F− ions Production in RPC Operated with Fluorine
Compound Gases, presented at NSS 2004, Rome October 16-22 2004.
[10] G. Aielli et al., Performance of a large size RPC, equipped with the final
ATLAS front-end electronics, at X5-GIF facility, NIM Nuclear Instruments
and Methods in physiscs research A456 (2000) 77.
0-7803-8701-5/04/$20.00 (C) 2004 IEEE