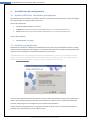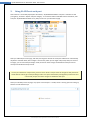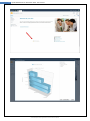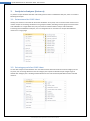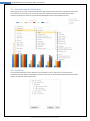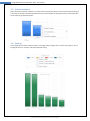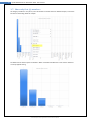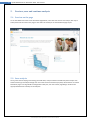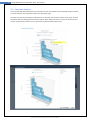
1
Kyubit OLAPCharts for SharePoint 2010 - User manual OLAPCharts for SharePoint 2010 User manual © 2011, All rights reserved www.kyubit.com 2 Kyubit OLAPCharts for SharePoint 2010 - User manual Contents 1. 2. 3. Installation and configuration ........................................................................................................................ 3 1.1. Kyubit OLAPCharts installation prerequisites ....................................................................................... 3 1.2. Kyubit Setup application ........................................................................................................................ 3 Using OLAPCharts web part ........................................................................................................................... 4 2.1. Provide valid OLAP connection .............................................................................................................. 5 2.2. Start analysis / create OLAP Chart ......................................................................................................... 5 Analysis techniques (features) ....................................................................................................................... 7 3.1. Set measure for OLAP chart .................................................................................................................. 7 3.2. Set category axis for OLAP chart ........................................................................................................... 7 3.3. Set series axis for OLAP chart ................................................................................................................ 8 3.4. Set filters ................................................................................................................................................ 8 3.5. Isolate members .................................................................................................................................... 9 3.6. Sorting ................................................................................................................................................... 9 3.7. Show only first (x) members ................................................................................................................ 10 3.8. Drill down and up ................................................................................................................................ 11 3.9. Drill by.................................................................................................................................................. 12 3.10. Drillthrough ......................................................................................................................................... 13 4. Chart visual appearance ............................................................................................................................... 14 5. Preview, save and continue analysis ............................................................................................................ 15 6. 5.1. Preview on the page ............................................................................................................................ 15 5.2. Save analysis ........................................................................................................................................ 15 5.3. Continue Analysis ................................................................................................................................ 16 FAQ ............................................................................................................................................................... 17 www.kyubit.com - [email protected] © 2011 www.kyubit.com, All rights reserved. Errors and omissions expected 3 Kyubit OLAPCharts for SharePoint 2010 - User manual 1. Installation and configuration 1.1. Kyubit OLAPCharts installation prerequisites Kyubit OLAPCharts for SharePoint is standalone SharePoint solution that consist primary of a web part designed for implementation in SharePoint 2010 environment. Server side prerequisites: SharePoint 2010 (Foundation or Server) ADOMD (Should be there already with SharePoint 2010 installation. If not, could be installed within setup) MSCharts (Should be there already with SharePoint 2010 installation. If not, could be installed within setup) Client side prerequisites: Internet Explorer 7 or higher 1.2. Kyubit Setup application OLAPCharts for SharePoint is deployed as standard SharePoint solution (wsp) with additional actions to modify desired SharePoint application web.config file. To make whole setup process very simple, Kyubit provides setup application that would perform all necessary installation job in few clicks. KyubitOLAPCharts.wsp could be deployed manually using STSADM.exe. In that case, some additional manual changes to SharePoint application web.config should be made. To provide you correct web.config parameters, write to [email protected] if for any reason you wish to deploy solution manually. After you select desired SharePoint Site Collection setup will first check OLAPCharts setup status. OLAPCharts is solution that is globally deployed to SharePoint, but activated as a feature only on to desired SharePoint site collection. Setup program is also designed to retract solution from SharePoint. Another feature of setup application is to register license key, when full version is purchased and license file obtained. Select Site Collection and click ‘Import License’. www.kyubit.com - [email protected] © 2011 www.kyubit.com, All rights reserved. Errors and omissions expected 4 Kyubit OLAPCharts for SharePoint 2010 - User manual 2. Using OLAPCharts web part After solution is successfully deployed to SharePoint, “KyubitOLAPChart2010” web part is available on web parts gallery, located in “Kyubit” web part category. To use functionalities of OLAPCharts for SharePoint, add web part “KyubitOLAPChart2010” to any web part zone on your SharePoint page. After you add web part to the page, edit web part height to desired size. Web part width will be automatically adjusted to available width, but its height is set manually. After you set height and perhaps web part name on the page, you can close web part design mode, because all other changes to OLAPCharts web part is done directly from OLAPChart Analysis view. To save your OLAP chart analysis work, just click “Save” while in analysis view. All changes to web part will be saved without need to go to web part design mode. This special functionality is designed to perform fast and user friendly analysis and other changes to OLAPCharts web part. When you add web part to the page, only option “Start Analysis” is visible, which is starting point for setting up OLAP chart and OLAP analysis. www.kyubit.com - [email protected] © 2011 www.kyubit.com, All rights reserved. Errors and omissions expected 5 Kyubit OLAPCharts for SharePoint 2010 - User manual 2.1. Provide valid OLAP connection To get any data from OLAP cube, first provide valid OLAP connection in Analysis view “Connection” tab. Provide Server name, OLAP Database name and OLAP Cube name. If connection data is valid, message will appear that connection was successful. Automatically, in the middle of analysis view, option will appear, “Add initial dimension to see OLAP data”. 2.2. Start analysis / create OLAP Chart To see data in OLAP Chart, chart category has to be set. After you select OLAP dimension level for chart categories, chart will be drawn. www.kyubit.com - [email protected] © 2011 www.kyubit.com, All rights reserved. Errors and omissions expected 6 Kyubit OLAPCharts for SharePoint 2010 - User manual www.kyubit.com - [email protected] © 2011 www.kyubit.com, All rights reserved. Errors and omissions expected 7 Kyubit OLAPCharts for SharePoint 2010 - User manual 3. Analysis techniques (features) To perform analysis of OLAP cube data and visually present results in OLAPCharts web part, users can combine following techniques: 3.1. Set measure for OLAP chart Initially, first measure in the cube will be used to show data. At any time, user can choose other measure to be used for analysis and charting. All Measures are grouped in folders, following measure-groups structure within cube metadata. On a single OLAP chart, only one measure could be used for analysis and visualization. Combining several OLAPCharts web part, user can integrate look on more than one analysis with different measures on a single page. 3.2. Set category axis for OLAP chart To start with analysis and visualization user must select certain dimension level for the chart category axis. At any time, user can change dimension level for category axis to perform desired analysis and get insight in desired data. Category axis is showing selected dimension level amount division/distribution within selected measure. www.kyubit.com - [email protected] © 2011 www.kyubit.com, All rights reserved. Errors and omissions expected 8 Kyubit OLAPCharts for SharePoint 2010 - User manual 3.3. Set series axis for OLAP chart Optionally and at any time, certain cube dimension level could be set for series axis in OLAP chart. Also, series axis could be removed at any time. Series axis represents additional amount division/distribution within category axis dimension hierarchy amount division/distribution for the chart selected measure. 3.4. Set filters To show values filtered for certain dimension level members, user can select one or more dimension hierarchies for filters. Within selected filter dimension level, user can select desired members which would be used to actually filter (slice) analysis data. www.kyubit.com - [email protected] © 2011 www.kyubit.com, All rights reserved. Errors and omissions expected 9 Kyubit OLAPCharts for SharePoint 2010 - User manual 3.5. Isolate members Alternative way to set filter members is to select them by directly (visually) from the chart elements (clicking on a chart bar for example). Selected (Isolated) dimension level member will be placed to filters and analysis data will be sliced using selected member. 3.6. Sorting Chart categories and series could be sorted in ascending or descending order. To select sorting action, click on the legend (series or measure) and select preferred sorting. www.kyubit.com - [email protected] © 2011 www.kyubit.com, All rights reserved. Errors and omissions expected 10 Kyubit OLAPCharts for SharePoint 2010 - User manual 3.7. Show only first (x) members All category members or only first 5, 10 or 20 members could be shown for defined analysis, to be more focused on interesting details of analysis. Set OLAP chart to show only first 5 members. Which 5 members would be first in the view is relative to currently applied sorting. www.kyubit.com - [email protected] © 2011 www.kyubit.com, All rights reserved. Errors and omissions expected 11 Kyubit OLAPCharts for SharePoint 2010 - User manual 3.8. Drill down and up To gain interactivity with OLAP chart data, each shown member (that belongs to dimension hierarchy) could be selected to drill down (to hierarchy level below) or drill up (to hierarchy level above). On this way with only few clicks user gets insight in amounts distribution on each hierarchy level for a given analysis. www.kyubit.com - [email protected] © 2011 www.kyubit.com, All rights reserved. Errors and omissions expected 12 Kyubit OLAPCharts for SharePoint 2010 - User manual 3.9. Drill by Most frequently used technique (feature) while analyzing OLAP cube data is “Drill by” functionality. Each shown member in OLAP chart, could be further analyzed by some other dimension level and get insight how amount of certain member is distributed/divided over some other available cube dimension level. www.kyubit.com - [email protected] © 2011 www.kyubit.com, All rights reserved. Errors and omissions expected 13 Kyubit OLAPCharts for SharePoint 2010 - User manual 3.10. Drillthrough OLAP chart analysis shows aggregated amounts for given dimension levels. At certain moment users would like to see details within shown aggregations. For that purpose, drillthrough query could be executed. To perform drillthrough, drillthrough columns should be selected first. Each dimension level could be selected as drillthrough column for which detailed data should be visible in drillthrough query results. www.kyubit.com - [email protected] © 2011 www.kyubit.com, All rights reserved. Errors and omissions expected 14 Kyubit OLAPCharts for SharePoint 2010 - User manual 4. Chart visual appearance To find most appropriate (desired) look of analysis chart for your needs, there are available visual options which user can chose while in analysis mode (view). Chart Types ( Column chart, bar chart, pie chart, doughnut chart ...) Chart color pallete (Color of chart elements) Chart theme (Chart background color) 2D/3D chart view Show/Hide Values (Numbers on the chart) Legend position (options to display legend) Height and with (web part design mode) Font Font size Font color Show/Hide selected filters (on the underlying SharePoint page) Show/Hide measure title (on the underlying SharePoint page) Show/Hide category title (on the underlying SharePoint page) Pie/doughnut display options Any visual element could be changed while analyzing data and be previewed on underlying SharePoint page. Combining above visual elements user creates desired chart visual outlook to integrate chart into existing design of the SharePoint page. www.kyubit.com - [email protected] © 2011 www.kyubit.com, All rights reserved. Errors and omissions expected 15 Kyubit OLAPCharts for SharePoint 2010 - User manual 5. Preview, save and continue analysis 5.1. Preview on the page To see how OLAP chart looks on the SharePoint page bellow, users does not have to save analysis, but only to select preview of the chart on the page, to see how it fits visually to current SharePoint page layout. 5.2. Save analysis At any point while analyzing and charting your OLAP data, analysis could be saved directly from analysis view without need to go to web part design view. From that moment saved analysis (chart) will be shown on related SharePoint page. To change width and height of the web part, user has to enter page design mode and set appropriate dimensions directly on the web part. www.kyubit.com - [email protected] © 2011 www.kyubit.com, All rights reserved. Errors and omissions expected 16 Kyubit OLAPCharts for SharePoint 2010 - User manual 5.3. Continue Analysis Any user with OLAP data read permissions has option to click on the OLAP chart on SharePoint page and select to continue analysis from the point saved on the SharePoint page. User does not need to have web part edit permission in SharePoint to continue analysis. If user does not have SharePoint web part editing permission for the page on which OLAP chart exists, user will not be able to save his/hers analysis work, but there are no restrictions to perform OLAP analysis itself. www.kyubit.com - [email protected] © 2011 www.kyubit.com, All rights reserved. Errors and omissions expected 17 Kyubit OLAPCharts for SharePoint 2010 - User manual 6. FAQ 6.1. Licensing Question: Is it necessary to obtain license for each user (per user) that connects to OLAPChart web part? Answer: No, only one OLAPCharts license (Site, Site Collection or Server license) is required for one OLAPCharts installation. There is no licensing (or any other) limitation in number of users that connects to application. Question: Is it necessary to obtain additional licenses for each server CPU? Answer: No, one license (Site, Site Collection or Server license) is required regardless of server CPU number. Question: Is my license bound to hardware and what to do in case of hardware upgrade or replacement? Answer: License is bound only to server domainname\servername, Site Collection ID or Site ID (depending on chosen license type), which is provided in the procedure of license purchase. OLAPCharts could be reinstalled on completely new environment as still use the same license as long as it has the domainname\servername, Site Collection ID or Site ID (depending on chosen license type) for which the license is purchased for. Question: Is it necessary to obtain different license type (Software assurance) to have right to use future versions of AnalysisPortal? Answer: No, once purchased license for OLAPCharts gives user right to download and use any future version of OLAPCharts software. 6.2. Installation (FAQ) Question: What are prerequisites to install AnalysisPortal software? Answer: SharePoint 2010 Server or SharePoint 2010 Foundation Question: How to install OLAPCharts? Answer: Kyubit provides Setup.exe which will guide user to install OLAPCharts SharePoint solution (wsp) to chosen Site Collection. SharePoint solution (wsp) could be also installed manually, but if for any reason you wish to do so, please consult with our support team ([email protected]) to see what additional actions you have to take in that case. Setup.exe has also functionalities to apply purchased license file. www.kyubit.com - [email protected] © 2011 www.kyubit.com, All rights reserved. Errors and omissions expected 18 Kyubit OLAPCharts for SharePoint 2010 - User manual 6.3. Using OLAPCharts for SharePoint (FAQ) Question: What analysis scenarios/actions OLAPCharts for SharePoint supports? Answer: Support actions are drill down, drill up, drill by, drillthrough, isolation, filtering. User selects OLAP cube dimension (hierarchy) for Category and Series axis, measure that would be used and dimensions hierarchies that would be used for filtering (slicing). Question: How to visually integrate OLAPCharts web part in visually customized SharePoint environment? Answer: OLAPCharts has options to fine tune visual appearance by selecting chart type, color pallete, font, font-size, font family and other visual elements. OLAPCharts supports very small charts and large chart scenarios. Question: Is it possible to analyze different OLAP data sources other than MS SQL Server Analysis Services? Answer: No, OLAPCharts is designed to work with MS SQL Server Analysis services 2005/2008 and any future MS SQL Server Analysis services releases. Question: Is there possibility to use OLAPChart on MOSS 2007? Answer: No, OLAPCharts is designed to work only with SharePoint 2010 Foundation or Server version. www.kyubit.com - [email protected] © 2011 www.kyubit.com, All rights reserved. Errors and omissions expected