1
Drawing and Analyzing Causal DAGs with DAGitty
User Manual for Version 2.0
Johannes Textor
January 24th, 2013
Abstract
DAGitty is a software for drawing and analyzing acyclic causal diagrams, also known in
epidemiology as directed acyclic graphs (DAGs). DAGitty’s functions include the identification of minimal sufficient adjustment sets for estimating causal effects, diagnosis of insufficient
or invalid adjustment via the identification of biasing paths, and the derivation of testable
implications.
DAGitty is written with typical epidemiological use cases of DAGs in mind, but researchers
and students of other disciplines such as econometrics, sociology, or psychology could find it
useful as well. DAGitty should run directly and without installation in any web browser that
supports modern HTML and JavaScript.
Contents
1 Introduction
1.1 Causal diagrams . . . . . . . . . . . . . . .
1.2 Citing DAGitty . . . . . . . . . . . . . . . .
1.3 Running DAGitty online . . . . . . . . . .
1.4 Installing DAGitty on your own computer .
1.5 Migrating from earlier versions of DAGitty
.
.
.
.
.
.
.
.
.
.
.
.
.
.
.
.
.
.
.
.
.
.
.
.
.
.
.
.
.
.
.
.
.
.
.
.
.
.
.
.
.
.
.
.
.
.
.
.
.
.
.
.
.
.
.
.
.
.
.
.
.
.
.
.
.
.
.
.
.
.
.
.
.
.
.
.
.
.
.
.
.
.
.
.
.
.
.
.
.
.
.
.
.
.
.
2
2
3
3
4
4
2 Loading and saving diagrams
2.1 DAGitty’s textual syntax for causal diagrams . . .
2.2 Loading a textually defined diagram into DAGitty
2.3 Modifying the graphical layout of a diagram . . . .
2.4 Saving the diagram . . . . . . . . . . . . . . . . . .
2.5 Exporting the diagram . . . . . . . . . . . . . . . .
.
.
.
.
.
.
.
.
.
.
.
.
.
.
.
.
.
.
.
.
.
.
.
.
.
.
.
.
.
.
.
.
.
.
.
.
.
.
.
.
.
.
.
.
.
.
.
.
.
.
.
.
.
.
.
.
.
.
.
.
.
.
.
.
.
.
.
.
.
.
.
.
.
.
.
.
.
.
.
.
.
.
.
.
.
.
.
.
.
.
4
5
5
5
6
6
user interface
. . . . . . . . . .
. . . . . . . . . .
. . . . . . . . . .
. . . . . . . . . .
. . . . . . . . . .
. . . . . . . . . .
. . . . . . . . . .
. . . . . . . . . .
.
.
.
.
.
.
.
.
.
.
.
.
.
.
.
.
.
.
.
.
.
.
.
.
.
.
.
.
.
.
.
.
.
.
.
.
.
.
.
.
.
.
.
.
.
.
.
.
.
.
.
.
.
.
.
.
.
.
.
.
.
.
.
.
.
.
.
.
.
.
.
.
.
.
.
.
.
.
.
.
.
.
.
.
.
.
.
.
.
.
.
.
.
.
.
.
.
.
.
.
.
.
.
.
.
.
.
.
.
.
.
.
.
.
.
.
.
.
.
.
.
.
.
.
.
.
.
.
6
6
6
6
6
7
7
7
7
3 Editing diagrams using the graphical
3.1 Creating a new diagram . . . . . . .
3.2 Adding new variables . . . . . . . . .
3.3 Renaming variables . . . . . . . . . .
3.4 Setting the status of a variable . . .
3.5 Adding new connections . . . . . . .
3.6 Deleting variables . . . . . . . . . . .
3.7 Deleting connections . . . . . . . . .
3.8 Displaying the moral graph . . . . .
1
.
.
.
.
.
.
.
.
.
.
.
.
.
.
.
4 Analyzing diagrams
4.1 Paths . . . . . . . . . . . . . . . . . . . . . . . . . . .
4.2 Adjustment sets . . . . . . . . . . . . . . . . . . . . .
4.2.1 Total versus direct effect . . . . . . . . . . . . .
4.2.2 Minimal sufficient adjustment sets . . . . . . .
4.2.3 Finding minimal sufficient adjustment sets . . .
4.2.4 Forcing adjustment for specific covariates . . .
4.2.5 Avoiding adjustment for unobserved covariates
4.3 Testable implications . . . . . . . . . . . . . . . . . . .
.
.
.
.
.
.
.
.
.
.
.
.
.
.
.
.
.
.
.
.
.
.
.
.
.
.
.
.
.
.
.
.
.
.
.
.
.
.
.
.
.
.
.
.
.
.
.
.
.
.
.
.
.
.
.
.
.
.
.
.
.
.
.
.
.
.
.
.
.
.
.
.
.
.
.
.
.
.
.
.
.
.
.
.
.
.
.
.
.
.
.
.
.
.
.
.
.
.
.
.
.
.
.
.
.
.
.
.
.
.
.
.
.
.
.
.
.
.
.
.
.
.
.
.
.
.
.
.
7
7
8
8
9
9
9
9
9
5 Acknowledgements
10
6 Legal notice
10
7 Bundled libraries
10
8 Bundled examples
10
9 Author contact
11
1
Introduction
1.1
Causal diagrams
To convey an idea of the purpose of DAGitty, we give a very brief introduction on the subject of
causal diagrams; for a more detailed account, we recommend the book Causality by Judea Pearl
[7], or the corresponding chapter Causal Diagrams in the epidemiology textbook of Rothman,
Greenland, and Lash [8]. Note that in epidemiology, causal diagrams are also frequently called
DAGs.1 Simply put, a DAG is a graphic model that depicts causal relationships between certain
variables of interest. An arrow X → Y is drawn if there is a direct causal effect of X on Y .
Intuitively, this means that the natural process determining Y is directly influenced by the status
of X, and that altering X via external intervention would also alter Y . However, an arrow X → Y
only represent that part of the causal effect which is not mediated by any of the other variables
in the diagram. If one is certain that X does not have a direct causal influence on Y , then the
arrow is omitted. This has two important implications: (1) arrow directions should be congruent
to temporal order, or else the diagram violates the “principle of causality” (causes must precede
their effects); (2) the omission of an arrow is a stronger claim than the inclusion of an arrow – the
presence of an arrow depicts merely the “causal null hypothesis” that X might have an effect on
Y.
Mathematically, the semantics of an arrow X → Y can be defined as follows. Given a DAG G
and a variable Y in G, let X1 , . . . , Xn be all variables in G that have direct arrows Xi → Y . Then
G claims that the causal process determining the value of Y can be modelled as a mathematical
function Y := f (X1 , . . . , Xn , Y ) where Y (the “causal residual”) is a random variable which is
independent of all the Xi .
For example, the sentence “smoking causes cancer” could be translated into the following
simple causal diagram:
smoking
lung cancer
1 The
term “DAG” is somewhat confusing to computer scientists and mathematicians, for whom a DAG is simply
an abstract mathematical structure without specific semantics attached to it.
2
We would interpret this diagram as follows: (1) The variable “smoking” refers to the smoking
behaviour prior to a later assessment of cancer in that person; (2) the natural process by which
a person develops cancer might be influenced by the smoking behaviour of that person; (3) there
exist no other variables that have a direct influence on both smoking behaviour and cancer. A
slightly more complex version of this diagram might look as follows:
smoking
tar deposit in lungs
lung cancer
This diagram is about a person’s smoking behaviour at a time t1 , the tar deposit in her lungs
at a later time t2 , and finally the development of cancer at an even later time t3 . We claim that
(1) the natural process which determines the amount of tar in the lungs is affected by smoking; (2)
the natural process by which lung cancer develops is affected by the amount of tar in the lung; (3)
the natural process by which lung cancer develops is not affected by the person’s smoking other
than indirectly via the tar deposit; and finally (4) no variables having relevant direct influence on
more than one variable of the diagram were omitted.
A causal diagram is thus an encoding of assumptions about the causal relationships between
the variables of interest. In an epidemiologic context, one of these variables is usually called the exposure, and another special variable is called the outcome. Importantly, if all assumptions encoded
in the diagram hold, then we can infer sets of variables for which to adjust in an observational
study to minimize bias. For example, consider the following causal diagram:
smoking
?
carry matches
cancer
If we were to perform an association study on the relationship between carrying matches in
one’s pocket and developing lung cancer, we would probably find a correlation between these
two variables. However, as the above diagram indicates, this correlation would not imply that
carrying matches in your pocket causes lung cancer: Smokers are more likely to carry matches in
their pockets, and also more likely to develop lung cancer. This is an example of a confounded
association between two variables, which is mediated via the biasing path (bold). In this example,
let us assume with a leap of faith that the simplistic diagram above is accurate. Under this
assumption, would we adjust for smoking, e.g. by averaging separate effect estimates for smokers
and non-smokers, we would no longer find a correlation between carrying matches and lung cancer
as such adjustment would close the biasing path. Adjustment sets will be explained in more detail
in Section 4.2.
The purpose of DAGitty is to aid study design through the identification of suitable, small sufficient adjustment sets in complex causal diagrams and, more generally, through the identification
of causal and biasing paths as well as testable implications in a given diagram.
1.2
Citing DAGitty
If you publish research results obtained with the help of DAGitty, please cite either the letter in
Epidemiology where DAGitty is announced [14] or the research paper that describes the algorithmic methods that had to be developed to make DAGitty possible [15] or both.
1.3
Running DAGitty online
There are two ways to run DAGitty: either from the internet or from your own computer. To run
DAGitty online, simply open its URL in your favourite browser:
3
http://www.dagitty.net
DAGitty should run in every modern browser. Specifically, I expect it to work well on recent
versions of Firefox, Chrome, Opera, and Safari as well as on Internet Explorer (IE) version 9.0 or
later (i.e., IE versions that support SVG graphics). IE versions prior to 9.0 (that don’t support
SVG graphics) should allow performing all diagnosis functions but cannot display the graphics as
well as modern browsers2 . If you encounter any problems, please send me an E-Mail so I can fix
the problem; see contact information at the end of this manual. Keep in mind that DAGitty is
used daily by dozens to hundreds of people throughout the world and they all benefit from bug
fixes, so please do consider investing the time to notify me if you encounter any bugs.
1.4
Installing DAGitty on your own computer
DAGitty can be “installed” on your computer for use without an internet connection. To do this,
download the file
http://www.dagitty.net/dagitty.zip
which is a ZIP archive containing DAGitty’s source. Unpack this ZIP file anywhere in your file
system. To run DAGitty, just open the file dags.html in the unpacked folder. However, exporting
models as PDF, JPEG or PNG graphics currently only works with an internet connection because
the conversion is performed by the DAGitty server.
1.5
Migrating from earlier versions of DAGitty
The following two issues are important for users of older DAGitty versions. New users can skip
this section.
• It is now possible to have more than one exposure and/or outcome. This means that the
old model text data convention where the variable in the first line is the exposure and the
variable in the second line is the outcome is no longer used. Hence, if you open a model
created with an earlier version in DAGitty 2.0, it will seem that exposure and outcome have
become normal variables. To fix this, simply use the “e” and “o” keys to set exposure and
outcome again and save the new model text data.
• Spaces in variables are now finally reliably supported. The way this works is that any variable
name containing spaces or other special symbols is converted using “URL encoding” – e.g.
“patient sex” will turn into “patient%20sex” (of course DAGitty will do this automatically
for you). This may look strange but ensures that DAGitty models can be safely e-mailed,
posted on websites, stored in word documents etc. without having to worry about line
breaking. If you have an older DAGitty model containing spaces in variable names, DAGitty
2.0 should open this model correctly and perform the conversion itself. If it does not, consider
sending me your model by e-mail so I can investigate.
2
Loading and saving diagrams
This section covers the three basic steps of working with DAGitty: (1) loading a diagram; (2)
manipulating the graphical layout of the diagram; and (3) saving the diagram. First of all,
any causal diagram consists of vertices (variables) and edges (direct causal effects). You can
either create the diagram directly using DAGitty’s graphical user interface (explained in the next
R
section), or prepare a textual diagram description in a word processor such as Microsoft Word and then import this description into DAGitty. In addition, DAGitty contains some pre-defined
examples that you can use to become familiar with the program. To do so, just select one of the
pre-define examples from the “Examples” menu.
2 While this would be redeemable, I’d much rather invest my time in improving DAGitty for modern browsers
than fixing it for old IE versions. If you absolutely need to run DAGitty on older IEs and encounter severe problems,
please contact me.
4
(a) vertex labels
EE
DO
A1
B1
Z1
(b) adjacency list
ED
AEZ
BDZ
ZED
(c) resulting graph
A
B
Z
E
D
(d) augmented vertex labels
E E @-2.2,1.6
D O @1.4,1.6
A 1 @-2.2,-1.5
B 1 @1.4,-1.5
Z 1 @-0.3,-0.1
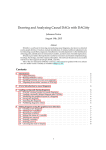
Figure 1: Example for a textual model definition with DAGitty (a,b: model text data; c: resulting
diagram). When the diagram is edited within DAGitty (d), the vertex labels and adjustment
status are augmented with additional information that DAGitty uses to layout the vertices on
the canvas (rightmost column): the layout coordinates of each variable are indicated behind the
@ sign.
2.1
DAGitty’s textual syntax for causal diagrams
DAGitty’s textual syntax for causal diagrams is based on the one used by the DAG program by
Sven Knüppel [4]. A diagram description (model text data) consists of two parts:
1. A list of the variables in the diagram
2. A list of connections between the variables
The list of variables consists of one variable per line (blank lines are ignored by DAGitty).
After each variable name follows a character that indicates the status of the variable, which can be
one of “1” (normal variable), “A” (adjusted for), “U” (latent/unobserved), “E” (exposure), or “O”
(outcome). If you prepare your diagram description in a word processor rather than constructing the diagram in DAGitty itself, you may encounter problems when you use spaces or other
special symbols in variable names (e.g. instead of “patient sex” you should write “patient sex”).
This restriction does not apply when you construct the diagram using DAGitty’s graphical user
interface.
The list of connections consists of several lines each starting with a start variable name, followed
by one or more other target variables that the start variable is connected to. Figure 1 contains
a worked example of a textual model description. When you modify a diagram within DAGitty,
the vertex labels will be augmented by additional information, to help DAGitty remember the
layout of the vertices and for other purposes (see rightmost column in Figure 1).
2.2
Loading a textually defined diagram into DAGitty
To load a textually defined diagram into DAGitty, simply copy&paste the variable list, followed
by a blank line, followed by the list of connections into the “Model text data” text box. Then click
on “Update DAG”. DAGitty will now generate a preliminary graphical layout for your diagram
on the canvas, which may not yet look the way you intended it to look, but can be freely modified.
2.3
Modifying the graphical layout of a diagram
To layout the vertices and edges of your diagram more clearly than DAGitty did, simply drag the
vertices with your mouse on the canvas. You may notice that DAGitty modifies the information
in the “Model text data” field on the fly, and augments it with additional position information for
each vertex. In general, all changes you make to your diagram within DAGitty are immediately
reflected in the model text data.
5
2.4
Saving the diagram
To save your diagram locally, just copy&paste the contents of the “Model text data” field to a text
R document, and save that file locally to your computer3 .
file, e.g. a Microsoft Word When you wish to continue working on the diagram, copy the model text data back into
DAGitty as explained above.
2.5
Exporting the diagram
DAGitty can export the diagram as a PDF or SVG vector graphic (publication quality) or a JPEG
or PNG bitmap graphic (e.g. for inclusion in Powerpoint). Select the corresponding function from
the “Model” menu. If you want to edit the graphical layout of the diagram or annotate it, it is
recommended to export the diagram as an SVG file and open that in a vector graphics program
such as Inkscape.
3
Editing diagrams using the graphical user interface
You are free to make changes directly to the textual description of your diagram, which will be
reflected on the canvas next time you click on “Update DAG”. However, you can also create,
modify, and delete vertices and connections graphically using the mouse.
3.1
Creating a new diagram
To create a new diagram, select “New Model” from the “Model” menu. You will be asked for
the names of the exposure and the outcome variable, and an initial model containing just those
variables and an arrow between them will be drawn. Then you can add variables and connections
to the model as explained below.
3.2
Adding new variables
To add a new variable to the model, double-click on a free space in the canvas (i.e., not on an
existing variable) or press the “n” key. A dialog will pop up asking you for the name of the
new variable. Enter the name into the dialog and press the enter key or click “OK”. If you click
“Cancel”, no new variable will be created.
3.3
Renaming variables
To rename an existing variable, move the mouse pointer over that variable and hit the r key. A
dialog will pop up allowing you to change the variable name.
3.4
Setting the status of a variable
In DAGitty, variables can have one of the following statuses:
• Exposure
• Outcome
• Unobserved (latent)
• Adjusted
• Other
3 This
is most easily done by clicking in the text field, pressing “CTRL + A” to select the entire content of the
text field, then pressing “CTRL + C” to copy the selected content. You can then paste the content into Microsoft
Word using “CTRL + V”
6
To turn a variable into an exposure, move the mouse pointer over that variable and hit the e
key; for an outcome, hit the o key instead. To toggle whether a variable is observed or unobserved,
hit the u key; to toggle whether it is adjusted, hit the a key. Changing the status of variables may
change the colors of the diagram vertices to reflect the new structure and information flow in the
diagram (see below).
At present, each variable can only have one status at a time, e.g., variables can not be both
unobserved and adjusted or both exposure and unobserved. This may also change in future
versions of DAGitty.
3.5
Adding new connections
To add a new connection, double-click first on the source vertex (which will become highlighted)
and then on the target vertex. The connection will be inserted. If a connection existed before in
the opposite direction, that connection will be deleted, because otherwise there would now be a
cycle in the model.
Instead of double-clicking on a vertex, you can also move the mouse pointer over the vertex and
press the key “c”. Connections are by default drawing using a straight line, but you can change
that moving the mouse pointer to the line, pressing and holding down the left mouse button, and
“bending” the line by dragging as appropriate.
3.6
Deleting variables
To delete a variable, move the mouse pointer over that variable and hit the del key on your
keyboard. All connections to that variable will be deleted along with the variable. In contrast to
DAGitty versions prior to 2.0, all variables can now be deleted including exposure and outcome.
3.7
Deleting connections
A connection is deleted just like it has been inserted, i.e., by double-clicking first on the start
variable and then on the target variable. A connection is also deleted automatically if a new one
is inserted in the opposite direction (see above).
3.8
Displaying the moral graph
To identify minimal sufficient adjustment sets, DAGitty uses the so-called “moral graph”, which
results from a transformation of the model to an undirected, typically smaller, graph. This procedure is also highly recommended if you wish to verify the calculation by hand. See the nice
explanation by Shrier and Platt [11] for details on this procedure.
In DAGitty, you can switch between display of the model and its moral graph by pressing the
m key.
4
Analyzing diagrams
4.1
Paths
Causal diagrams contain two different kinds of paths.
• Causal paths start at the exposure, contain only arrows pointing away from the exposure,
and end at the outcome. That is, they have the form e → x1 → . . . → xk → o.
• Biasing paths are all other paths in the model.
With respect to a set Z of adjusted variables (that can also be empty if we are not adjusting
for anything), paths can be either open or closed (also called d-separated [6]). A path is closed
with respect to Z if one or both of the following holds:
7
C1
M
X
Y
C2
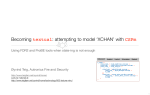
Figure 2: A causal diagram where the total and direct effects are not equal. The total effect is
the effect mediated only via the thick (both dashed and solid) arrows, while the direct effect is
the effect mediated only via the thick arrow.
• The path p contains a chain x → m → y or a fork x ← m → y such that m is in Z.
• The path p contains a collider x → c ← y such that c is not in Z and furthermore, Z does
not contain any successor of c in the graph.
Otherwise, the path is open. Note that in particular, a path consisting of only one arrow is
always open, no matter the content of Z. Also it is possible that a path is closed with respect to
the empty set Z = {}.
It is not easy to verify by hand which paths are open and which paths are closed, especially
in larger diagrams. DAGitty highlights all arrows lying on open biasing paths in red and all
arrows lying on open causal paths in green. This highlighting is optional and is controlled via the
“highlight causal paths” and “highlight biasing paths” checkboxes.
4.2
Adjustment sets
Finding sufficient adjustment sets is one main purpose of DAGitty. In a nutshell, a sufficient
adjustment set is a set S of covariates such that adjustment, stratification, or selection (e.g. by
restriction or matching) will minimize bias when estimating the causal effect of the exposure
on the outcome (assuming that the causal assumptions encoded in the diagram hold). You can
read more about controlling bias and confounding in Pearl’s textbook, chapter 3.3 and epilogue
[6]. Moreover, Shrier and Platt [11] give a nice step-by-step tutorial on how to test if a set of
covariates is a sufficient adjustment set.
To identify adjustment sets, the diagram must contain at least one exposure and at least one
outcome.
4.2.1
Total versus direct effect
One can understand adjustment sets graphically by viewing an adjustment set as a set Z that
blocks all all biasing paths while keeping desired causal paths open (see previous section). DAGitty
considers two kinds of adjustment sets:
• Adjustment sets for the total effect are sets that block all biasing paths and leave all causal
paths unblocked. In the literature, if the effect is not mentioned (e.g. [11, 4]), then usually
this kind of adjustment set is meant.
• Adjustment sets for the direct effect are sets that block all biasing paths and all causal paths,
and leave only the direct arrow from exposure to outcome (i.e., the path e → o, if it exists)
unblocked.
In a diagram where the only causal path between exposure and outcome is the path e → o,
the total effect and the direct effect are equal. This is true e.g. for the diagram in Figure 1. An
example diagram where the direct and total effects are not equal is shown in Figure 2.
8
As proved by Lauritzen et al. ([5], see also Tian et al. [16]), it suffices to restrict our attention
to the part of the model that consists of exposure, outcome, and their ancestors for identifying
sufficient adjustment sets. This is indicated by DAGitty by coloring irrelevant nodes in gray. The
relevant variables are colored according to which node they are ancestors of (exposure, outcome,
or both) – see the legend on the left-hand side of the screen. The highlighting may be turned on
and off by toggling the “highlight ancestors” checkbox.
4.2.2
Minimal sufficient adjustment sets
A minimal sufficient adjustment set (MSAS) is a sufficient adjustment set of which no proper
subset is itself sufficient. For example, consider again the causal diagram in Figure 1. In this
example, the following three sets are sufficient adjustment sets for the total and direct effects
(which are equal in this diagram):
{A, B, Z}
{A, Z}
{B, Z}
All these sets block all biasing paths while leaving the causal path open, and are thus sufficient.
The sets {A, Z} and {B, Z} are minimal sufficient adjustment sets while the set {A, B, Z} is
sufficient, but not minimal. In contrast, the set {Z} is not sufficient, since this would un-block the
path E ← A → Z ← B ← D: Because both E and D depend on Z, adjusting for Z will induce
additional correlation between E and D.
4.2.3
Finding minimal sufficient adjustment sets
Whenever you create a new causal model or make changes to it, DAGitty will calculate all minimal
sufficient adjustment sets and display them in the “Adjustment for total effect” and “Adjustment
for direct effect” fields, respectively.
4.2.4
Forcing adjustment for specific covariates
You can also tell DAGitty that you wish a specific covariate to be included into every adjustment
set. To do this, move the mouse over the vertex of that covariate and press the a key. DAGitty
will then update the list of minimal sufficient adjustment sets accordingly – every set displayed is
now minimal in the sense that removing any variable except those you specified will render that set
insufficient. However, when you adjust for an intermediate or another descendant of the exposure,
DAGitty might tell you that it is no longer possible to find a valid adjustment set.
4.2.5
Avoiding adjustment for unobserved covariates
You can tell DAGitty that a certain variable is unobserved (e.g. not measured at present, or not
measurable because it is a latent variable) by moving the mouse over that covariate and pressing
the u key. DAGitty will only calculate adjustment sets that do not contain unobserved variables.
However, if too many or some important variables are unobserved, then it may be impossible to
close all biasing paths.
4.3
Testable implications
The adjustment sets obtained from a causal diagram will only be appropriate for estimating the
desired total or direct effect if the causal assumptions encoded in the diagram are accurate. To
some extent, these assumptions can be tested via the (conditional) independences implied by the
diagram: If two variables x and y are d-separated by a set Z, then x and y should be conditionally
9
independent given Z. The converse is not true: Two variables x and y can be independent given
a set Z even though they are not d-separated in the diagram. Furthermore, two variables can
also be d-separated by the empty set Z = ∅. In that case, the diagram implies that x and y are
unconditionally independent.
DAGitty displays all minimal testable implications in the “Testable implications” text field.
Only such implications will be displayed that are in fact testable, i.e., that do not involve any
unobserved variables. Note that the set of testable implications displayed by DAGitty does not
constitute a “basis set” [7]. Future versions will allow choosing between different basis sets.
In general, the less arrows a diagram contains, the more testable predictions it implies. For
this reason, “simpler” models with fewer arrows are in general easier to falsify (Occam’s razor).
5
Acknowledgements
The author wishes to thank Michael Elberfeld, Juliane Hardt, Sven Knüppel, Keith Marcus, Judea
Pearl, Sabine Schipf, and Felix Thoemmes (in alphabetical order) for enlightening discussions
(either in person, per e-mail, or on the SEMnet discussion list) about DAGs that made this
program possible. Furthermore, I thank Marlene Egger, Angelo Franchini, Ulrike Förster, Dirk
van Kampen, Jeff Martin, Jillian Martin, Karl Michaëlsson, David Tritchler, Eric Vittinghof, and
other users for sending feedback and bug reports that greatly helped to improve DAGitty.
6
Legal notice
Use of DAGitty is (and will always remain) freely permitted and free of charge. You may download
a copy of DAGitty’s source code from its website at www.dagitty.net. The source code is
available under the GNU General Public License (GPL), either version 2.0, or any later version,
at the licensee’s choice; see the file LICENSE.txt in the download archive for details. In particular,
the GPL permits you to modify and redistribute the source as you please as long as the result
remains itself under the GPL.
7
Bundled libraries
DAGitty ships along with the following JavaScript libraries:
• Prototype.js, a framework that makes life with JavaScript much easier. Only some parts of
Prototype (mainly those focusing on data structures) are included to keep the code small.
Developed by the Prototype Core Team and licensed under the MIT license [13].
Furthermore, DAGitty uses some modified code from the Dracula Graph Library by Philipp
Strathausen, which is also licensed under the MIT license [12].
Versions of DAGitty prior to 2.0 used the Raphaël library for smooth cross-browser vector
graphics in SVG and VML, developed by Dmitry Baranovskiy [2]. However, the dependency
on Raphaël was removed starting from version 2.0 as I anticipate only supporting SVG-capable
browsers in the future.
I am grateful to all authors of these libraries for their valuable work.
8
Bundled examples
DAGitty contains some builtin examples for didactic and illustrative purposes. Some of these
examples are taken from published papers or talks given at scientific meetings. These are, in
inverse chronological order:
• Polzer et al., 2010 [3]
10
• Schipf et al., 2010 [9]
• Shrier & Pratt, 2008 [11]
• Sebastiani et al.4 , 2005 [10]
• Aicd & Campos, 1996 [1]
Another example was provided by Felix Thoemmes via personal communication (2013).
9
Author contact
The author of DAGitty, i.e. me, would be glad to receive feedback from those who use DAGitty in
their research or for educational purpose. Also, you are welcome to send me your with suggestions
or requests for features that you miss in DAGitty:
Johannes Textor
Theoretical Biology & Bioinformatics
Universiteit Utrecht, The Netherlands
[email protected]
bioinformatics.bio.uu.nl/textor/
References
[1] Silvia Acid and Luis M. De Campos. An algorithm for finding minimum d-separating sets in
belief networks. In Proceedings of the twelfth Conference of Uncertainty in Artificial Intelligence, pages 3–10, 1996.
[2] Dmitry Baranovskiy. Raphael–javascript library. http://raphaeljs.com, 2010.
[3] Ines Polzer et al., 2010. personal communication.
[4] Sven Knüppel and Andreas Stang. DAG program: identifying minimal sufficient adjustment
sets. Epidemiology (Cambridge, Mass.), 21(1):159, 2010.
[5] S. L. Laurizen, A. P. Dawid, B. N. Larsen, and H.-G. Leimer. Independence properties of
directed markov fields. Networks, 20(5):491–505, 1990.
[6] Judea Pearl. Causality: models, reasoning, and inference. Cambridge University Press, 2000.
[7] Judea Pearl. Causality: Models, Reasoning and Inference. Cambridge University Press, New
York, NY, USA, 2nd edition, 2009.
[8] Kenneth J. Rothman, Sander Greenland, and Timothy L. Lash. Modern Epidemiology.
Wolters Kluwer, 2008.
[9] Sabine Schipf, Robin Haring, Nele Friedrich, Matthias Nauck, Katharina Lau, Dietrich Alte,
Andreas Stang, Henry Völzke, and Henri Wallaschofski. Low total testosterone is associated
with increased risk of incident type 2 diabetes mellitus in men: Results from the study of
health in pomerania (SHIP). The Aging Male, 2010. in press.
[10] P. Sebastiani, M. F. Ramoni, V. Nolan, C. T. Baldwin, and M. H. Steinberg. Genetic dissection and prognostic modeling of overt stroke in sickle cell anemia. Nat. Genet., 37:435–440,
Apr 2005.
4 The
example actually shows only a small part of their DAG.
11
[11] Ian Shrier and Robert W. Platt. Reducing bias through directed acyclic graphs. BMC Medical
Research Methodology, 8(70), 2008.
[12] Philipp Strathausen.
Dracula graph layout and drawing framework.
graphdracula.net, 2010.
http://www.
[13] Prototype Core Team. Prototype. http://www.prototypejs.org, 2010.
[14] J. Textor, J. Hardt, and S. Knüppel. Dagitty: A graphical tool for analyzing causal diagrams.
Epidemiology, 22(5):745, 2011.
[15] J. Textor and M. Liśkiewicz. Adjustment criteria in casual diagrams: an algorithmic perspective. In Proceedings of the 27th Conference on Uncertainty in Artificial Intelligence, pages
681–688. Corvallis, OR: AUAI Press, 2011.
[16] Jin Tian, Azaria Paz, and Judea Pearl. Finding minimal d-separators. Technical Report
R-254, UCLA, 1998.
12