1
EMIST GUI MANUAL
ESVT (Experiment Specification and
Visualization Tools) Version II
MANUAL
Web: http://emist.ist.psu.edu
Newsgroup: pubnews.cse.psu.edu/psu.cse.research.emist
Copyright 2005 The Pennsylvania State University
ESVT (GUI) MANUAL
Page 1 of 13
Table of contents
1. Overview ........................................................................................................................ 2
2. Getting started................................................................................................................. 2
2.1. System requirements................................................................................................ 2
2.2. Installation................................................................................................................ 2
2.3. MySQL Database..................................................................................................... 2
3. Topology Design ............................................................................................................ 2
3.1. Basic operation......................................................................................................... 2
3.2. Miscellaneous features............................................................................................. 3
4. Topology conversion and script generation................................................................ 4
4.1. Node name and index conversion ............................................................................ 5
4.2. Additional start-up command scripts ....................................................................... 5
4.3. Virtualized LAN segment information file.............................................................. 6
4.4. Internet Worm Simulation File format .................................................................... 7
4.5. Import Topology from GT-ITM .............................................................................. 7
5. Visualization (Overview) .............................................................................................. 7
5.1. Log files preparation ................................................................................................ 7
5.3. Interpreting the animation........................................................................................ 8
5.4. Controlling animation .............................................................................................. 9
5.5. Charts and other views............................................................................................. 9
5.6. Output traffic data to text file................................................................................... 9
5.7. Internet scale-down worm experiment visualization ............................................. 10
6. Data Management of traffic traces files using MySQL........................................... 10
7. User defined visualization (Link/Flow Traffic)........................................................ 11
7.1 Preparation .............................................................................................................. 11
7.2 Starting the visualization......................................................................................... 11
7.3 Data sources ............................................................................................................ 13
7.4 Visualization Options ............................................................................................. 13
8. Important Parameters ................................................................................................ 13
9. Features in the next version ....................................................................................... 13
Copyright 2005 The Pennsylvania State University
ESVT (GUI) MANUAL
Page 2 of 13
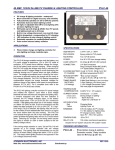
1. Overview
The ESVT (Experiment Specification and Visualization Tools, or GUI in this manual) provides an
integrated environment to interact with DETER or EMULAB test-beds and to conduct network
security emulation/simulation experiments. The ESVT is a modular, component-based topology
editor, a TCL script generator, a worm experiment designer and a visualization tool for
experimental results. First, the tools offer a topology editor toolbar for user to draw network
topologies including computer/end-host nodes, switch nodes, router nodes, sub-network/Internet
interfaces and links. Each of these network components has configurable properties such as
bandwidth and link latency, which can be stipulated and modified. Alternately, user can import a
scale-free topology generated by GT-ITM tool into ESVT editor. The GUI can then generate a TCL
script from a designed network topology in several formats: NS/2 format, DETER/EMULAB
format without LAN, DETER/EMULAB format with LAN and virtualized nodes. Finally, the GUI
can visualize the resulting experimental data (captured in TCPDUMP format or from MySQL
database tables with NETFLOW-like format) by animation, sliding charts and figures, and other
advanced views.
New features in version II:
• Support of binary TCPDUMP trace file;
• New flow (NetFlow similar) format for network traffic and automatic conversion from
TCPDUMP trace file to flow/packet dual tables;
• Database (MySQL) for trace management;
• User-defined link traffic visualization, including entropy and chi-square view.
2. Getting started
2.1. System requirements
Currently, the EMIST GUI only runs on Windows XP and Windows 2000 platforms and requires at
least 1000MByte of a combination of RAM and virtual memory.
2.2. Installation
Copy the executable PsuESVT2.exe to the chosen directory. During its first run, the GUI program
will register itself with Windows and will associate itself with ‘.wor’ file type.
2.3. MySQL Database
ESVT can store (with conversion) experimental trace data (TCPDUMP files currently) with
MySQL database. To use this feature, MySQL database server is to be installed with the following
account and database set up:
1. Default super user account with empty string ‘’ as user id and password.
2. One user database named “deter_exp”.
3. In database deter_exp, one user table ‘experiments’ with the following structure:
{exp_name varchar(20) KEY;
link_name varchar(10);
note
varchar(100);
}
3. Topology Design
3.1. Basic operation
The ESVT can be used to design network topology which includes five different network
components: computer/host, switch, router, link and Internet/sub-network.
Copyright 2005 The Pennsylvania State University
ESVT (GUI) MANUAL
Page 3 of 13
Adding a network component: Click on the corresponding component icon on the toolbar, move the
mouse pointer to the main window and click on the desired location to add a new component. To
add a link, click on the source component, hold the mouse button down and move the mouse
pointer to the target component, then release the mouse button.
Selecting a component: Click the Select icon on the toolbar (Arrow icon) to switch to “select mode”,
then click on the target component (the selected component will be highlighted). To select a group
of components, hold the mouse button down to draw rectangular box over the components. To
deselect a component or group of components, click on a blank space in the main window.
Tip: Click on a switch component while holding the CTRL key will select the switch and all the host
nodes connected by the switch.
Moving a component: Select the component (single left-click on the component) and drag it to the
target location.
Editing a property of a component: Each component has various properties which can be modified,
select the component and right-click to open the property dialog window.
Figure 1: Topology design—property editing
User can also change the properties of a group of components or all components by invoking the
“Global component and script property configuration” (Tools-> Global component and script
property). The currently globally changeable properties include host susceptibility and link
bandwidth.
Deleting a component: Select the component and choose menu Edit->Delete to delete it.
3.2. Miscellaneous features
Copyright 2005 The Pennsylvania State University
ESVT (GUI) MANUAL
Page 4 of 13
There are some other helpful features in the GUI, which include:
Topology zoom: Zoom in, zoom out, zoom by, and click-zoom. Click the zoom in or zoom out icon
on the toolbar for larger or smaller zoom. Right-click on a blank space to open the zoom-by
window. Hold down the ‘CTRL’ key and right-click on the main window to zoom to level 8
centered at the click point.
Index display: GUI internal component index number starts from 0 for each class of components.
To show the index number of each network component, choose menu View->show computer
index, View->show switch index or View->show router index.
Computer node finder: Choose View->Zoom to component to open the dialog, and then input the
computer node index. The found node will be located on the center of the main window.
Copy and Paste: Select a component or a group of components, then copy and paste using the
right-click menu.
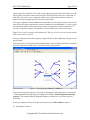
Virtual node: A switch component has one special property “Simulated Lan”. Modifying this
property will change the way the GUI generates a DETER/EMULAB script. A virtualized switch is
distinguished from a real switch by its color and symbol.
Figure 2: Virtualized LAN
4. Topology conversion and script generation
After finishing the topology design, you can save and restore your design using File->Save and
Copyright 2005 The Pennsylvania State University
ESVT (GUI) MANUAL
Page 5 of 13
File->Load menu items. Besides the customized binary representation, the GUI supports exporting
the design in four different output formats: NS, one-to-one DETER format, DETER format with
virtual nodes, and DETER format with VM nodes. You can generate a script file in a specific
format by choosing “output format” from menu NS2/Emulab.
1) NS2/Emulab->Save as a TEXT NS file: GUI will generate NS scripts when File->Save
menu item is invoked.
2) NS2/Emulab->Save to DETER script (one 2 one): GUI will generate DETER format
without virtual nodes.
3) NS2/Emulab->Generate DETER script (V node): GUI will generate DETER format
with virtual nodes.
4) NS2/Emulab->Generate DETER script (VM node): GUI will generate DETER format
with VM nodes for the virtualized LAN.
4.1. Node name and index conversion
GUI internal component index number starts from 0 for each class of components. In the TCL
script all components except link are named by the following formula:
Computer:
n-(GUIindex)
Switch:
n-(ComputerCount+GUIindex)
Router:
n-(ComputerCount+SwitchCount+GUIindex)
Network:
n-(ComputerCount+SwitchCount+RouterCount+GUIindex)
Currently script generator doesn’t assign IP addresses for components. The mapping between node
name and test-bed IP address is based on test-bed /etc/hosts file.
4.2. Additional start-up command scripts
In the DETER script, there are additional start-up commands after the topology script lines. You
can modify or delete them for your particular experiment. Also you can change the root directory of
start-up commands by change the “Node Startup Command Directory” field in the “Global
component and script Property configuration” dialog.
Copyright 2005 The Pennsylvania State University
ESVT (GUI) MANUAL
Page 6 of 13
Figure 2.A. Global component and script property configuration dialog
In the dialog, there are some other parameters that affect the TCL script generation:
• The “Experiment Duration” value will be one command-line parameter for the start-up
commands or scripts, which can be utilized by user application to control the duration of
the experiment.
• By default, user does not need to specify OS for test-bed node and test-bed will assign
LINUX as the node operation system. If “Use FREEBSD by default” checkbox is checked,
the script will add a additional line for every node “tb-set-node-os $n(##) FBSD-STD”,
except VM nodes which use special “pvcm” OS.
4.3. Virtualized LAN segment information file
When generating a virtualized network segment, the GUI generates another separate file named
map.001 which includes information regarding that sub-network. Upload this file to the DETER
test bed computer so that the experimental programs can access it. The following lines are part of an
example map.001 file.
#node & virtual node map file
#n-#### TYPE(B/I/V/R) S/N #####(GUI node index) #####(Last segment of IP)
n-208 V N 75 254
n-208 V N 69 253
n-208 V N 65 252
n-208 V N 61 251
n-208 V N 56 250
n-208 V N 59 249
Each line of the map.001 file represents one virtualized/real host node. The fields of each line are:
node name, node type or line type (B for Bandwidth, I for Internet node, V for virtual node, R for
Copyright 2005 The Pennsylvania State University
ESVT (GUI) MANUAL
Page 7 of 13
real node), node susceptibility (S for susceptible, N for not susceptible), node GUI internal index
and last byte of node IP address.
Note: the GUI will override map.001 if there is map.001 file in the directory.
Note: Map.001 file format may be slightly different in example above than in other GUI versions.
4.4. Internet Worm Simulation File format
For Internet scale-down worm experiment, use NS2/Emulab->[Topology Format
Conversion]->Read Internet topology from file (SLAMMER) to read the topology file. A
sample of the scale-down topology file is shown below.
*********************************************************
network 0.0.0.0/17 3
worm 0.0.72.101
worm 0.0.85.214
worm 0.0.123.42
network 0.0.128.0/17 1
**********************************************************
4.5. Import Topology from GT-ITM
To import a scale-free topology generated by GT-ITM topology tool, use
NS2/Emulab->[Topology Format Conversion]->Read GT-ITM Format to read the topology
file. This operation takes some time to finish and user may need substantial editing after the import
is done.
5. Visualization (Overview)
5.1. Log files preparation
To use the visualization feature of the GUI, all log files are required to be placed in the same
directory. The log files are shown below:
1) HOSTLIST file: This is the /etc/hosts file of any experimental node and is renamed to
‘hostlist’. The GUI uses the hostlist file to obtain a mapping between the internal index
number (node, LAN, and link number in the script file) and the assigned IP address of a
corresponding node.
2) TCPDUMP log file: The name of log file is tcplog_NN.NN.NN.NN. The log file can be in
either binary format (default, TCPDUMP switch -w) or plain text format. Note for text
format that the timestamp on each dump line has to be an unformatted number (using –tt
option when running TCPDUMP program).
3) Worm infection file: The name of worm infection file can be either log_XXXX or
log_NN.NN.NN.NN, where XXXX is a node index number and NN.NN.NN.NN is an IP
address of node. The following is an example of a worm infection file:
3 by n-8-link6 10.1.5.3 at:1074366335.249722
Note: These files are only for WORM experiment.
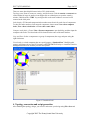
5.2. Starting visualization
After collecting traffic and worm infection log files from an experiment, the GUI can visualize the
result with the following steps:
Copyright 2005 The Pennsylvania State University
ESVT (GUI) MANUAL
Page 8 of 13
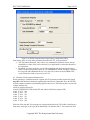
1) Change the step time: Choose NS2/Emulab->Change Step Time. Specify an integer
value between 1 and 60000 milliseconds.
2) Load the data: Choose NS2/Emulab->DETER/EMULAB visualization (V node). When
the dialog box named “Please locate the file directory” appears, go to the directory that
contains all the necessary files (HOSTLIST file, Worm infection files, and TCPDUMP log
files) and click the Open button (with or without clicking on any file in the directory).
After the GUI finishes calculating the starting time (the earliest TCP/UDP packet time minus two
step times) and the traffic data of each link, it will visualize the data immediately and show the
status of the network. Note that the calculation time will vary according to the performance of
your machine and size of the log file.
Figure 3: Worm propagation animation
5.3. Interpreting the animation
The color of a link represents the traffic volume on that link (in KBps and in Mbps). The color of a
host indicates the host status.
Link color
1) Light Gray: less than 1 percent of bandwidth
2) Green: more than 1 percent of bandwidth
3) Yellow: between green and red
4) Red: more than 30 percent of bandwidth
Host color (Varied by experiment. The following example is for worm experiment.)
1) Red: Infected node.
2) Green: Vulnerable node but not infected
3) Gray: Non-vulnerable node
Copyright 2005 The Pennsylvania State University
ESVT (GUI) MANUAL
Page 9 of 13
5.4. Controlling animation
The GUI provides the following two buttons on the right-most side of the toolbar to allow users to
control the animation.
| |: Toggle between pause and resume animation
|-⎯|: Move to a specific point in entire simulation time
5.5. Charts and other views
1) Bar chart: Shows the change in traffic on a particular link. Right-click on a particular link
to show a pop-up menu and choose Bar Chart to switch to this view.
Figure 4. Link traffic bar chart
2) Worm traffic chart: Shows the traffic composition on a link. Right-click on a particular
component to show a pop-up menu and choose Worm Traffic to switch to this view. The
blue part of a bar represents the non-worm background traffic volume. The red part of a bar
stands for worm traffic. Currently, this worm traffic chart feature can identify only
SLAMMER worm traffic.
To return to the main animation view (main window) from a bar chart view or a worm traffic chart
view, choose menu View->Normal view.
5.6. Output traffic data to text file
You can save the traffic data of a link into a text-file format for, e.g., further statistical analysis
using another software package. Click on the link and choose ->Output traffic. The following is a
Copyright 2005 The Pennsylvania State University
ESVT (GUI) MANUAL
Page 10 of 13
sample of a traffic data file in which each line shows traffic data on a link during one time-step
interval.
Traffic(kps)
0.000
0.000
2649.600
2649.600
3974.400
5289.600
23846.400
36432.000
39081.600
38419.200
41068.800
39744.000
39744.000
Packets
0
0
4
4
6
8
36
55
59
58
62
60
60
WormTraffic(kps) WormPackets
0.000
0
0.000
0
0.000
0
0.000
0
0.000
0
0.000
0
0.000
0
0.000
0
0.000
0
0.000
0
0.000
0
0.000
0
0.000
0
5.7. Internet scale-down worm experiment visualization
For Internet scale-down worm experiment, use NS2/Emulab->Internet Simulation Visualization
to see the worm infection animation. Choose View->Statistics/Traffic to check the worm infection
curve. The followings are samples of an infection log file, which must be named gui_result.
InfectedIP: 0.0.72.101 Time: 0.00 TotalScans:
InfectedIP: 0.48.170.103 Time: 3.52 TotalScans:
4315 Scan/Worm: 4315
8630 Scan/Worm: 4315
6. Data Management of traffic traces files using MySQL
ESVT supports experimental data storage and retrieval using database. If MySQL database is
installed as required in the installation section, ESVT will automatically detect the installation and
store the traffic traces on the link into database tables with necessary conversion when user chooses
Link Visualization and clicks the plot button.
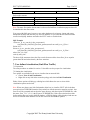
ESVT reads and converts one TCPDUMP trace file into two separate database tables. One table
holds the generated NETFLOW-like flow series, and another table stores the detailed packet
records. The flow table is named with the fashion of topology name plus link index number plus
“flow”. E.G., if the topology file name is real2xx.wor, the flow table for the link 61 will be named
with real2xx_wor_61_flow. The packet table is named similarly, e.g., real2xx_wor_61_packet.
Data structures of two tables are listed below.
Flow table/list structure
Column Name
Flow_id
Src_ip
Src_port
Dst_ip
Dst_port
Protocol
Start_time
Last_time
Total_bytes
Total_packets
Status
Data type
Integer
Char[16]
Smallint[6]
Char[16]
Smallint[6]
Smallint[6]
Double
Double
Integer
Integer
Smallint[6]
Note
1--tcp;2--udp;3--icmp
1--Just_Syn;
Copyright 2005 The Pennsylvania State University
ESVT (GUI) MANUAL
Page 11 of 13
5--Established;10--Closed
Packet table structure
Column Name
Flow_id
Packet_time
Packet_size
Data type
Integer
Double
Smallint[6]
Note
Note: The same flow/packet data structure is also used in link/flow visualization purposes that will
be introduced in the next section.
User can use MySQL query browser or any other database tools to inspect, import and export,
manipulate the trace data after they are saved in database. Or you can load trace data from other
sources into MySQL database and utilize the ESVT tools to visualize them.
SQL Example
“Select src_ip, src_port,dst_ip,dst_port,protocol,\
start_time,last_time,total_bytes,total_packets,status from vm20_wor_9_Flow \
Union ALL \
Select src_ip, src_port,dst_ip,dst_port,protocol,\
start_time,last_time,total_bytes,total_packets,status from vm20_wor_19_Flow \
where flow_id>=100 \
order by start_time”
The above SQL statement selects the flow records from two tables whose flow_id are equal or
greater than 100 and orders them by the flow start time.
7. User defined visualization (Link/Flow Traffic)
7.1 Preparation
The same procedure as outlined in section 5.1 should be used to prepare for visualization
7.2 Starting the visualization
Two options are available for the user to visualize data on network link:
• Choose View->Link Visualization
• Right click on any link in the network topology and selection Link Visualization
Either of these options will bring up a dialog box which allows the user to select which
visualization options are desired.
Note: When user chooses one link (link number editor box) to visualize, ESVT will do the data
conversion from TCPDUMP format to flow/packet lists with the structures stated in section 6. One
flow file will be generated and saved on the same directory with the original TCPDUMP file, with
the name “flow_****” (**** is the IP part of TCPDUMP file). If the conversion has been done
before and the data was saved in MySQL database, a YES/NO dialog will be displayed and user can
choose to load data from database or re-do the conversion and database updates.
Copyright 2005 The Pennsylvania State University
ESVT (GUI) MANUAL
Page 12 of 13
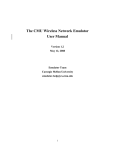
Figure 5: Example dialog box for user defined visualization.
Fig. 5 shows what the dialog box looks like. The tabs across the top allow the user to select different
options, attributes, and view types. Once the user has selected the desired options, pressing Plot
will bring up a dialog box so that the user may select the location of the data files. Select the
location of the files and click OK. The visualization results are displayed in the main window.
Clicking on a single plot will zoom-in and show further statistics related to the plot which was
clicked on.
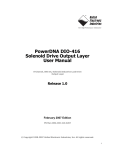
Figure 6: Sample visualization output. Clicking on any plot will zoom-in and show further details.
Copyright 2005 The Pennsylvania State University
ESVT (GUI) MANUAL
Page 13 of 13
7.3 Data sources
User can choose to visualize traffic data of one specific link by inputting Link Number
(automatically filled if user right-clicks the link to start the link visualization dialog), or he/she can
visualize and analyze flow data that results from a SQL query. To do this, user can check the From
SQL box and input an appropriate SQL statement in the pop-out window. The system will report an
error message if the SQL statement is not correct or not supported by the MySQL database.
7.4 Visualization Options
The dialog box provides the user with two features to better help visualize traffic data; attribute
filtering, and view-type specification. Attribute filtering allows the user to filter out unwanted data.
This allows the user to see only data related to the experiment. Filtering is accomplished by
changing the view type. The available options are; link view, IP view, and protocol view. Each type
allows the user to filter data specific to that type by selecting options given in the various dialog box
tabs. View-type specification allows the user to specify which plots or views he or she desires to
visualize. This includes line plots, bar plots, histograms, connection views, etc.
8. Important Parameters
For efficiency consideration, the tools are designed with upper limits for component number and
flow/packet number in the link visualization.
Topology
Computer nodes
5000
Switch nodes
2000
Router nodes
1000
Network/Internet nodes 10
Links
5000
Links per Switch (Max) 120
Links per Router
10
Link visualization
Flow number
1,000,000
Packet number
5,000,000
9. Features in the next version
•
•
•
•
Support of popular network topology formats: The GUI will support the output from
popular scale-free topology generators (e.g., those of GA Tech and Umich) and will
convert it to EMIST GUI format.
Experiment and data management: The GUI will be an interface to the DHS data
repository and will incorporate traffic traces of different formats into EMIST ESVT.
Traffic source generation tool from TCPDUMP and NETFLOW traces.
Trace file digestion tool.
Copyright 2005 The Pennsylvania State University