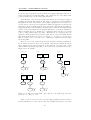
1
Universität des Saarlandes
Fachrichtung 6.2 – Informatik
PO-Box 15 11 50, 66041 Saarbrücken, Germany
Alexsa
Algorithm explanation by Shape Analysis
Extensions to the TVLA system
Diploma thesis by
Ronald Bieber, [email protected]
Subject provided by
Prof. Dr. Reinhard Wilhelm
Hiermit versichere ich, dass ich diese Arbeit selbständig verfasst habe und keine
Hilfsmittel und Quellen außer den genannten verwendet habe.
Saarbrücken den 23.4.2001
(Ronald Bieber)
Acknowledgements
This thesis marks the end of my studies in computer science. Throughout my college
years my parents have supported me in many ways, and I wish to thank them for
this. During these years I got to know a lot of professors, may it be in courses,
exams, or at work. Some of them have influenced me more than others, so I also
want to thank Prof. Günter Hotz, Prof. Manfred Pinkal, and Prof. Kurt Mehlhorn
(all at Universität des Saarlandes), as well as Amit Jain from Boise State University
at Boise, Idaho.
For this particular work I want to thank Prof. Reinhard Wilhelm, who not only
provided this subject but also supervised this work and who was always available
when I needed his input. Also I want to thank my friends Daniel Bobbert and Peter
Hachenberger and my brother Burkhard for discussing my work with me, which
helped me to improve it even more. And last but not least I want to dedicate this
work to my friend Michael Weber† , who inspired me to always strive for excellence.
Abstract
English
Algorithm explanation visualizes programs for teaching, debugging, optimization, and verification purposes. In this thesis we use shape analysis with 3-valued
Kleene logic and the TVLA implementation of this analysis to analyze programs
with respect to dynamic data structures. Our tool Alexsa features an easy to
use interface for the visualization, with simultaneous code view and heap content
representation. We implement an automatic pseudo code generation for improved
readability, a well-defined algorithm for presenting the visual execution of programs
in an interesting way, smooth transitions between the single states, and a number
of additional tools for verification and debugging of the analyzed programs.
Deutsch
Algorithmenerklärung visualisiert Programme zum Zwecke der Lehre, der Fehlersuche, der Optimierung und der Verifikation. In dieser Arbeit benutzen wir Shape
Analyse mit dreiwertiger Kleene-Logik sowie die TVLA-Implementation dieser Analyse um Programme im Hinblick auf dynamische Datenstrukturen zu untersuchen.
Unser Programm Alexsa bietet eine leicht zu benutzende Schnittstelle für die Visualisierung, bei gleichzeitiger Darstellung der Programmansicht und des HeapZustandes. Wir entwickeln eine automatische Pseudo-Code Generierung für verbesserte Lesbarkeit, einen wohldefinierten Algorithmus für die Präsentation der visuellen Ausführung in einer anschaulichen Art und Weise, weiche Übergänge zwischen den einzelnen Zuständen, sowie eine Anzahl weiterer Hilfsmittel für die Verifikation und Fehlersuche in den untersuchten Programmen.
Contents
1 Introduction
1.1
1
Algorithm explanation . . . . . . . . . . . . . . . . . . . . . . . . . .
1
1.1.1
Manually constructed animations . . . . . . . . . . . . . . . .
1
1.1.2
Automatically constructed animations . . . . . . . . . . . . .
2
1.2
The new idea in Shape Analysis . . . . . . . . . . . . . . . . . . . . .
3
1.3
TVLA – The analysis implementation . . . . . . . . . . . . . . . . . .
5
1.4
The scope of this work . . . . . . . . . . . . . . . . . . . . . . . . . .
6
1.5
Structure of this work . . . . . . . . . . . . . . . . . . . . . . . . . .
6
2 Requirements specification
9
2.1
Cooperation and platform . . . . . . . . . . . . . . . . . . . . . . . .
9
2.2
Code view . . . . . . . . . . . . . . . . . . . . . . . . . . . . . . . . .
10
2.3
Data view . . . . . . . . . . . . . . . . . . . . . . . . . . . . . . . . .
11
2.4
Visual execution . . . . . . . . . . . . . . . . . . . . . . . . . . . . .
11
2.5
Inbetweening graphs . . . . . . . . . . . . . . . . . . . . . . . . . . .
12
2.6
TVLA debugging tools . . . . . . . . . . . . . . . . . . . . . . . . . . .
13
2.7
Example program . . . . . . . . . . . . . . . . . . . . . . . . . . . . .
13
3 Interaction with TVLA
15
3.1
TVP files . . . . . . . . . . . . . . . . . . . . . . . . . . . . . . . . .
15
3.2
TVS files . . . . . . . . . . . . . . . . . . . . . . . . . . . . . . . . .
17
3.3
Shape graphs . . . . . . . . . . . . . . . . . . . . . . . . . . . . . . .
18
3.4
Trace for legal steps . . . . . . . . . . . . . . . . . . . . . . . . . . .
19
3.4.1
Trace function . . . . . . . . . . . . . . . . . . . . . . . . . .
19
3.4.2
Unique IDs for shape graphs . . . . . . . . . . . . . . . . . .
20
3.4.3
Gathering the trace information . . . . . . . . . . . . . . . .
20
3.4.4
Identifying the layouted graphs . . . . . . . . . . . . . . . . .
21
3.4.5
Reading the trace file . . . . . . . . . . . . . . . . . . . . . .
21
3.5
Simplifying the user interface . . . . . . . . . . . . . . . . . . . . . .
23
3.6
Incorporation of changes into TVLA . . . . . . . . . . . . . . . . . . .
24
i
CONTENTS
4 The code view
27
4.1
Problems with TVP . . . . . . . . . . . . . . . . . . . . . . . . . . .
27
4.2
Design decisions
. . . . . . . . . . . . . . . . . . . . . . . . . . . . .
28
4.3
The construction algorithm . . . . . . . . . . . . . . . . . . . . . . .
29
4.3.1
Step 1: Preparing the control flow graph . . . . . . . . . . . .
29
4.3.2
Step 2: Better representation of commands . . . . . . . . . .
29
4.3.3
Step 3: Detecting structures . . . . . . . . . . . . . . . . . . .
30
4.3.4
Simple nodes . . . . . . . . . . . . . . . . . . . . . . . . . . .
31
4.3.5
If-statements . . . . . . . . . . . . . . . . . . . . . . . . . . .
31
4.3.6
Simple if-else-statements . . . . . . . . . . . . . . . . . . . . .
34
4.3.7
General if-else-statements . . . . . . . . . . . . . . . . . . . .
35
4.3.8
While-loops . . . . . . . . . . . . . . . . . . . . . . . . . . . .
35
4.3.9
Do-while-loops . . . . . . . . . . . . . . . . . . . . . . . . . .
36
4.3.10 Step 4: Code view line by line
4.4
. . . . . . . . . . . . . . . . .
37
4.3.11 Step 5: Cleaning up . . . . . . . . . . . . . . . . . . . . . . .
39
Implementation . . . . . . . . . . . . . . . . . . . . . . . . . . . . . .
40
5 Data view
41
5.1
Scaling . . . . . . . . . . . . . . . . . . . . . . . . . . . . . . . . . . .
41
5.2
Inverting . . . . . . . . . . . . . . . . . . . . . . . . . . . . . . . . . .
42
5.3
Miscellaneous features . . . . . . . . . . . . . . . . . . . . . . . . . .
43
5.3.1
Missing arrow heads . . . . . . . . . . . . . . . . . . . . . . .
43
5.3.2
Empty graphs . . . . . . . . . . . . . . . . . . . . . . . . . . .
44
6 Automatic visual execution
6.1
. . . . . . . . . . . . . . . . . . . . . . . . . .
46
6.1.1
Branchings . . . . . . . . . . . . . . . . . . . . . . . . . . . .
46
6.1.2
Cycles . . . . . . . . . . . . . . . . . . . . . . . . . . . . . . .
47
6.1.3
Dead ends . . . . . . . . . . . . . . . . . . . . . . . . . . . . .
47
6.2
Natural explanation . . . . . . . . . . . . . . . . . . . . . . . . . . .
47
6.3
Explanation strategy . . . . . . . . . . . . . . . . . . . . . . . . . . .
48
6.3.1
General search strategy . . . . . . . . . . . . . . . . . . . . .
48
Implementation . . . . . . . . . . . . . . . . . . . . . . . . . . . . . .
50
6.4.1
Precalculated data . . . . . . . . . . . . . . . . . . . . . . . .
50
6.4.2
Iterative implementation of a recursive algorithm . . . . . . .
50
6.4.3
Analyzing branches . . . . . . . . . . . . . . . . . . . . . . . .
54
6.5
Preferences for criteria . . . . . . . . . . . . . . . . . . . . . . . . . .
55
6.6
Remarks on visual execution
58
6.4
The form of the trace
45
. . . . . . . . . . . . . . . . . . . . . .
ii
CONTENTS
7 Inbetweening graphs
59
7.1
Can foresighted graphlayout help? . . . . . . . . . . . . . . . . . . .
59
7.2
Prerequisites . . . . . . . . . . . . . . . . . . . . . . . . . . . . . . .
61
7.3
Implementation . . . . . . . . . . . . . . . . . . . . . . . . . . . . . .
62
7.3.1
Analysis of the transition . . . . . . . . . . . . . . . . . . . .
63
Inbetweening steps . . . . . . . . . . . . . . . . . . . . . . . . . . . .
63
7.4.1
Zooming . . . . . . . . . . . . . . . . . . . . . . . . . . . . . .
64
7.4.2
Execution order . . . . . . . . . . . . . . . . . . . . . . . . . .
64
7.4.3
Deleting . . . . . . . . . . . . . . . . . . . . . . . . . . . . . .
65
7.4.4
Moving . . . . . . . . . . . . . . . . . . . . . . . . . . . . . .
65
7.4.5
Merging and splitting . . . . . . . . . . . . . . . . . . . . . .
66
7.4.6
Creation . . . . . . . . . . . . . . . . . . . . . . . . . . . . . .
67
7.4.7
Renaming/Resizing . . . . . . . . . . . . . . . . . . . . . . . .
68
Customizing the animation . . . . . . . . . . . . . . . . . . . . . . .
68
7.4
7.5
8 Miscellaneous
8.1
71
Debugging tools . . . . . . . . . . . . . . . . . . . . . . . . . . . . . .
71
8.1.1
Plausability checks . . . . . . . . . . . . . . . . . . . . . . . .
71
8.1.2
Definition inspection . . . . . . . . . . . . . . . . . . . . . . .
72
8.2
Additional tools . . . . . . . . . . . . . . . . . . . . . . . . . . . . . .
72
8.3
Preferences . . . . . . . . . . . . . . . . . . . . . . . . . . . . . . . .
72
8.3.1
Animation preferences . . . . . . . . . . . . . . . . . . . . . .
73
8.3.2
Miscellaneous preferences . . . . . . . . . . . . . . . . . . . .
73
8.3.3
Saving preferences . . . . . . . . . . . . . . . . . . . . . . . .
74
9 Conclusion
9.1
75
Future work . . . . . . . . . . . . . . . . . . . . . . . . . . . . . . . .
76
9.1.1
Automatic input generation . . . . . . . . . . . . . . . . . . .
76
9.1.2
Improved graph layout . . . . . . . . . . . . . . . . . . . . . .
77
9.1.3
Tying up the components . . . . . . . . . . . . . . . . . . . .
77
A Other tools
79
A.1 Graphviz’ dot . . . . . . . . . . . . . . . . . . . . . . . . . . . . . . .
79
A.2 JLex & CUP . . . . . . . . . . . . . . . . . . . . . . . . . . . . . . . .
79
A.3 CPreProcessorStream . . . . . . . . . . . . . . . . . . . . . . . . . .
80
B Additional explanations
81
B.1 Understanding shape graphs . . . . . . . . . . . . . . . . . . . . . . .
81
B.2 An example TVP file . . . . . . . . . . . . . . . . . . . . . . . . . . .
82
iii
CONTENTS
C Implementation issues
85
C.1 Alexsa classes . . . . . . . . . . . . . . . . . . . . . . . . . . . . . . .
85
C.2 Changes to TVLA . . . . . . . . . . . . . . . . . . . . . . . . . . . . .
86
C.2.1 Reading the shape graphs . . . . . . . . . . . . . . . . . . . .
86
C.2.2 Enhancing TVLA with a trace function . . . . . . . . . . . . .
87
C.2.3 Introduction of descriptions for three valued structures
. . .
92
C.3 Installing Alexsa . . . . . . . . . . . . . . . . . . . . . . . . . . . . .
92
C.3.1 Required tools . . . . . . . . . . . . . . . . . . . . . . . . . .
92
C.3.2 Installing Alexsa . . . . . . . . . . . . . . . . . . . . . . . . .
93
C.3.3 Launching Alexsa . . . . . . . . . . . . . . . . . . . . . . . . .
94
C.3.4 Known issues . . . . . . . . . . . . . . . . . . . . . . . . . . .
94
iv
Chapter 1
Introduction
In this chapter we want to give a quick overview over the general field of work this
thesis belongs to, over the particular theories behind this work, over the main part
of software Alexsa cooperates with and last but not least a characterization of the
scope of this work.
1.1
Algorithm explanation
The field of algorithm explanation covers a number of important and interesting
topics. Based on the fundamental technique to construct the explanation the various
approaches can be divided up into two major categories:
1.1.1
Manually constructed animations
Probably the first approach in the algorithm explanation were manually constructed
animations. Using animation tools a person with insight on the workings of an
algorithm constructs an animation that, in his view, shows the principles of a given
algorithm. Such animations are often used in teaching, when the teacher1 wants to
visualize the algorithm for his students2 for improved understanding.
The advantage of this approach is its simplicity. The teacher can select from
a range of general purpose tools and can design the animation exactly the way he
wants it. Since there is no direct connection between any piece of code and the animation, the teacher is not bound to the display of a certain set of phenomena, thus
yielding a high degree of freedom in the choice of explained algorithms. However,
there are a number of drawbacks, too.
Repetitive and unnecessary work. The repetitive construction of animations
can become tedious work quickly. General purpose animation tools usually
have no implicit knowledge of invariants in algorithm animation, thus many
basic concepts have to be remodeled often.
Incoherence Different animations for different algorithms may become incoherent
in the way that similar aspects in two algorithms are visualized in different
ways; this is inherent to the manual creation of the animation and is made
1 We will use teacher as a simple term for somebody, who intends to explain a program to
others.
2 Like the term teacher, students will denote people to whom a piece of program is explained.
1
CHAPTER 1. INTRODUCTION
even worse by the possibility that there may be quite some time between
the creation of two animations and that therefore certain ideas the creator
might have had in mind when creating the first animation are forgotten when
designing the next one.
A-priori knowledge It is fundamental for a manually created animation that the
creator already knows how the algorithm works. Even though this is usually
true for the teacher–student relation described above, this unnecessarily limits
the use of algorithm animation to exactly that field of application. Other uses,
like in automatic quality assurance of software still in development, are not
possible.
These drawbacks led to a new approach in algorithm explanation, the automatically constructed animations.
1.1.2
Automatically constructed animations
Automatically constructed animations are generated by dedicated tools that take
some form of program (usually its source code) as input and generate a visualization
or animation of arbitrary aspects of that program.
Apparently this solves all the problems of manually constructed animations as
described above:
Automatic work instead of repetitive tasks As the analyzer3 has some implicit knowledge of the concecpts of algorithms, repetitive work is mostly avoided.
Coherence The analyzer usually has fixed rules how to handle various phenomena.
As long as it correctly detects a certain aspect, the visualization will always
follow the same principles; further animations will follow the same guidelines.
(Almost) no a-priori knowledge Depending on the analyzer the user will not
need to know how the algorithm works to generate an animation.
However, this is not true in all cases; some analyzers require the user to annotate the analyzed program to mark-up “interesting” points in the program,
therefore again requiring knowledge about the algorithm.
Probably the most important improvement through automization is the loss
of the requirement for an understanding of the program analyzed. Even though
this may seem like a minor change given the original use in a teacher–student
environment as above, it opens up a number of new uses for algorithm explanation:
Autodidactic learning An ambitious student could now make his own algorithm
animations; this can be especially useful for virtual learning.
Debugging The program analyzed does not necessarily have to be correctly functioning. In cases where a program compiles and runs, but produces incorrect
results, a graphical representation of the runtime behaviour can be very valuable. Modern graphical debuggers like DDD[Zeller, 2001] use this idea to some
extent.
Verification In the complex field of software verification an automatically generated analysis (the basis for any animation) can yield valuable information
about satisfied invariants.
3 the
software that analyzes a program
2
1.2. THE NEW IDEA IN SHAPE ANALYSIS
Optimization The animation can also reveal sub-optimal coding. Possible cases
may include memory leaks, unused code, improvable parallelized code and so
forth.
Unfortunately, the use of automatic animation construction introduces some
new problems. Most importantly, any automatically generated animation can only
display phenomena the developer envisioned when implementing the analyzer. And
very often the analyzing method refrains from analyzing phenomena that appear to
difficult to model. One such field is the analysis of dynamic data structures. How
we can model those will be answered in the next section.
A number of methods have been developed for automatic program animation.
They can again be subcategorized for a basic property:
Run-time analysis In a run-time analysis the code is analyzed during its actual
execution. This is very desirable for debugging purposes, when a failure in the
implementation is being searched for. Since the execution of most algorithms
is highly dependant on the actual data passed to the algorithm, a run-time
analysis will usually only give an example of how the algorithm works, instead
of demonstrating its principle working.
Run-time analysis is also only partially suitable for verification, as a successful
run of the program on one set of data can not make any statement about
another run on other data.
Static analysis In a static program analysis the code is not actually executed, but
instead its code4 is analyzed. The analyzer will annotate the code with its
analysis results and will try to detect patterns of certain phenomena. Static
analysis is data-independent and can be useful for verification by proving
invariants.
1.2
The new idea in Shape Analysis
Analyzing dynamic data structures like lists and trees in programs can be difficult5 ,
partially due to the virtually unbounded size of these structures. But since the
early eighties a number of algorithms have been developed that can handle these
dynamic structures. Probably the most promising of them perform some form
of shape analysis.6 These algorithms represent heap cells7 by shape nodes, while
summarizing sets of ‘indistinguishable’ nodes into single nodes that are often called
summary nodes[Chase et al., 1990]. These nodes together comprise a shape graph,
which captures properties of the heap at different program points.
In this work we use the shape analysis algorithms as developed by Mooly Sagiv8 , Thomas Reps9 , and Reinhard Wilhelm10 [Sagiv et al., 1998, 1999, 2000, 2001;
Wilhelm and Braune, 2000]. Shape analysis according to Sagiv et. al. defines a
parametric framework for analyzing different properties of heap cells. Instances
4 source
code or machine code, depending on the analyzer
to the analysis of programs with scalar or array variables only
6 See [Chase et al., 1990; Jones and Muchnick, 1981, 1982; Larus and Hilfinger, 1988; Horwitz
et al., 1989; mann and Weinhardt, 1993; Plevyak et al., 1993; Wang, 1994; Sagiv et al., 1998] for
some of these approaches.
7 A heap cell is a block of memory allocated on the heap with some structure. For example, an
element of a list or a tree node can be a heap cell.
8 Department of Computer Science, Tel-Aviv University, Israel
9 Computer Science Department, University of Wisconsin at Madison, USA
10 Fachbereich Informatik, Universität des Saarlandes, Germany
5 compared
3
CHAPTER 1. INTRODUCTION
of the analysis examine the program for invariants that can be expressed by the
currently chosen parameters. The definition of the properties to analyze depends
on the analyzed data, the operations performed by the program, and the desired
invariants.
Shape analysis can be broken down into two main parts: first, the specification of
the instrumentation properties and the effect of programming language statements
on them during execution, and second the generation of a shape analysis instance
for this specification. For the second issue a prototype exists – TVLA. See the next
section for details on it.
The specification of the instrumentation properties is done by using predicate
logic. Formulae are used in many ways: to express properties of heap cells (like
being-shared ), to describe the relations between elements (like ‘this cell is reachable
from variable x’), and to describe abstract and concrete semantics of the programming language. Sagiv and his colleagues do not use traditional 2-valued Boolean
logic, but instead 3-valued Kleene logic[Kleene, 1952], which adds a distinct third
‘unknown’ state to the logic. This is very useful for the treatment of summary
nodes, as we often only have partial information about these summary nodes. A
convenient property of Kleene logic is that all operations defined include 2-valued
logic as a subset, that is, as long as only true and false are used, Kleene logic will
act just like traditional 2-valued Boolean logic. This allows to relate the concrete
2-valued world and the abstract 3-valued world.
A commonly used representation for the data generated by a shape analysis are
shape graphs. Because we will deal a lot with these shape graphs throughout this
work, let us take a look at one such shape graph in Figure 1.1.
x
n
s
r[n,s]
n
r[n,s]
n
r[n,s]
r[n,x]
n
n
r[n,s]
r[n,x]
Figure 1.1: A singly linked list with the start pointer s and another pointer x
This shape graph represents a singly linked list with the start pointer s and some
other pointer variable x pointing to some element that is neither one of the first
two nor the last element. The elements of the list are connected by next-pointers
denoted by n in this graph. The dashed nodes are summary nodes, and the labels
‘r[n,...]’ show that those nodes are reachable from some variable by following the
next-pointers n. An in-depth description of this graph and what its various elements
mean can be found in Appendix B.1 – Understanding shape graphs.
Actual data structures are (virtually) unbounded in size, limited only by the
runtime of a program and the physical memory. With the use of summarization in
shape analysis we get shape graphs that are bounded by the size of the program,
which in most cases is much smaller, thus yielding much more compact visualizations.
4
1.3. TVLA – THE ANALYSIS IMPLEMENTATION
1.3
TVLA – The analysis implementation
Developed by Tal Lev-Ami11 and Mooly Sagiv, TVLA (“Three Valued Logic Analysis”)[Lev-Ami and Sagiv, 2000b,a; Lev-Ami et al., 2000] represents an implementation of a shape analysis generator in Java[Gosling et al., 2000].
TVLA uses four different kinds of information distributed on two input files:
A definition of the used predicates. The instrumentation predicates are defined in terms of core predicates assembling all necessary information about
possible program states. The instrumentation predicates define the properties the user is currently interested in; they depend on the desired invariants
that are to be detected by the analysis. Different invariant tests may require
different instrumentation predicates.
This information is stored in one file12 called the TVP file (“Three Valued
Program”).
A definition of the statements The semantics of statements (or, actions, as
they are referred to in TVLA) are defined by sets of predicate update formulae.
They describe how the state before the execution of some given statement
(encoded in values of predicates) is changed by the execution of that statement.
Additionally, actions can also have precondition formulae to model conditional
statements. TVLA will ensure that an action is only executed if the statement’s
preconditions are fulfilled.
The statement definitions are stored in the TVP file, too.
A program described in terms of a directed graph with the program points as
nodes and edges labeled with actions connecting them. The program goes
from one point to another by applying an action. We will refer to this form
of the program as the control flow graph (CFG).
The program is also stored in the TVP file.
A set of initial shape graphs The analysis needs to know how the inital program states look like. Therefore a set of initial shape graphs13 is defined,
declaring, what predicates are preloaded with which values, thus giving an
exact description of the initial states.
The initial shape graphs are stored in a so-called TVS file (“Three valued
structures”).
These input files are usually written manually.
The engine will abstractly execute the provided program using the defined environment and the set of initial shape graphs, producing sets of shape graphs, one
set for every program point.
The sets of shape graphs are handed over to a graph drawing tool that is not
part of the TVLA package. In its current version TVLA uses dot from the GraphViz
package14 [Koutsofios and North]. Dot produces a PostScript-version of the shape
graphs, every graph on an own page in one large file.
11 Department
of Computer Science, Tel-Aviv University, Israel
levels of file inclusion are possible
13 in terms of a definition of the predicates and their initial assignments
14 developed at AT&T and Lucent Bell Labs
12 multiple
5
CHAPTER 1. INTRODUCTION
1.4
The scope of this work
So far no automatic visualization for shape analysis and no user interface for TVLA
exists. This is the reason why most of the main uses of shape analysis as described
in Chapter 1.2 found no application in practical use.
We will therefore develop a visualization for shape analysis that will allow us to
make use of shape analysis’ various applications. We will call the program developed
Alexsa, Algorithm Explanation by Shape Analysis. Alexsa will be able to perform
the following tasks:
Overview on possible configurations15 The software will visualize all possible
configurations at a given program point. In a debugging scenario this can be
used to detect why faulty executions take place. When a program needs to
be verified, this is useful to quickly check whether certain invariants hold in
all possible configurations.
Optimization The graphical display of the heap’s content will make it easier to
spot memory leaks or unnecessary (e.g. unused) pointers.
Automatic visual execution The program analyzed will be executed visually,
that is, it shows the current program point along with a shape graph associated
with it and will then change over to the next program point, adjusting the
shape graph for possible changes along the way. Visual execution is defined
more precisely in Chapter 2.4 – Visual execution.
This diploma thesis will research many aspects in visualization that need to be
considered for any implementation. The results won will then be used to formulate
our implementation of this visualization. This will be rounded up by showing many
pitfalls that need to be avoided. Alexsa, our implementation, will be usable in
conjunction with TVLA and other tools TVLA uses.
1.5
Structure of this work
In the following seven chapters we will give a detailed description of the numerous
aspects of Alexsa. In the last section we sketched the general outline of the fields
we cover from a theoretical point of view.
In the next chapter (Chapter 2 – Requirements specification) we will transfer
these general requirements to specific implementation requirements, thus motivating
the main components of Alexsa and how they will interact. The following six
chapters will then cover one of these main components each.
In Chapter 3 – Interaction with TVLA, page 15 ff. we will see what data Alexsa
needs and where it will get it from.
Chapter 4 – Code view, starting on page 27, will then describe the construction
of our own pseudo code for an appropriate code view.
The component to display all the shape graphs will be developed in Chapter 5
– Data view, from page 41.
The visual execution will require a well-motivated explanation strategy. It can
be found in Chapter 6 – Automatic visual execution, which starts on page 45.
The visual execution is completed in Chapter 7 – Inbetweening (page 59 ff.),
which describes our implementation of inbetweening shape graphs when performing
the visual execution.
6
1.5. STRUCTURE OF THIS WORK
On page 71 our Chapter 8 – Miscellaneous starts. It contains everything about
additional debugging functions, the export of data from Alexsa, and the various
preferences.
All this is summed up from page 75 on in Chapter 9 – Conclusion, where we
also give an outlook of possible future work in this field.
The reader may freely jump to any chapter of particular interest to him, we will
try to keep the various topics as independent as possible, giving cross references
where needed.
7
CHAPTER 1. INTRODUCTION
8
Chapter 2
Requirements specification
Shape analysis was originally developed for the analysis of dynamically allocated
structures. However, it was shown that shape analysis can be used for quite different
applications, too. For example, Nielson, Nielson, and Sagiv show in [Nielson et al.,
2000] how shape analysis can be used to analyze Mobile Ambients[Cardelli and
Gordon, 1998]. We cannot expect to develop a simple and intuitive user interface
that provides an interpreted view of the results in all possible fields of application.
The solution is to reduce the number of possible applications in order to produce
an interface that is much better suited for the fields it covers.
We therefore choose the field shape analysis, and hence TVLA, were originally
developed for: The analysis of source codes with respect to dynamically allocated
structures. By making this restriction we are awarded with the option to be a lot
more specific in the user interface, for example with a code view of the program
analyzed or simply by choosing terms in the interface that correspond well to the
field of application.
We characterize the main uses of Alexsa as follows:
• Debugging and verification of software
• Explaining algorithms
• Debugging TVLA input files
2.1
Cooperation and platform
We need to pay respect to some external requirements when determining which
programs Alexsa needs to cooperate with and on which platform or programming
language it should be implemented.
• Alexsa is a visualization tool for shape analysis. As such it should work
together with TVLA, the only implemented analysis using shape analysis so
far.
• As a visualization tool it will require a graphical user interface in order to
show the user the various shape graphs in an appropriate way.
9
CHAPTER 2. REQUIREMENTS SPECIFICATION
• We don’t know anything about the specific environments Alexsa will be used
in, therefore we should not use tools or APIs1 that limit us further in the
choice of an environment for Alexsa. Our program should be as platform
independent as possible.
These points suggest that we use Java 2[Gosling et al., 2000] as our programming
language along with its API.2 Java is available on many platforms and comes with
the necessary API to develop a graphical user interface using standard controls as
well as individual drawing of our own components.
2.2
Code view
It is crucial for algorithm explanation to see some representation of the algorithm
explained. TVLA can in fact give us a representation of the analyzed program.3
Unfortunately, as TVLA’s proprietary input language declares programs as directed
graphs, the automatically generated output is also a directed graph of arbitrary
shape and it is thus very hard to understand the program’s structure quickly. See
figure 2.1 for an example.
n_5
free(elem)
n_1
x != null
n_2
x == null
exit
elem->n = null
elem = x
n_3
x = x->n
n_4
Figure 2.1: A program that erases a singly linked list. Graph generated by TVLA/dot
Ever since higher programming languages became common use, most algorithms
were described using some form of source code, very often not even using an actual
programming language but some form of pseudo code. Examples for pseudo code
can be found throughout [Cormen et al., 1990]. This pseudo code uses common
syntactic and semantic principles of higher imperative programming languages4
1 An application programming interface consists of a number of libraries or classes (depending on
the programming language) and supports the development of applications using standard elements,
like windows, buttons, lists, etc.
2 Java 2 introduces some new classes and methods to the Java API, and is not yet available
on all platforms Java runs on. However, as TVLA also requires Java 2, our choice poses no further
limitation.
3 When called with the debugging flag -d, TVLA will add a number of debugging shape graphs
to the output, including a representation of the program as the very first graph.
4 For convenience we will from now on use the term programming languages for denoting imperative programming languages.
10
2.3. DATA VIEW
like C, Pascal, Java, or even later varieties of Basic to form source code that,
though not necessarily identical with the exact syntax of any given programming
language, can be easily understood by any programmer with experience in any
higher programming language.
A main reason why this is possible is because all modern programming languages
share basic concepts like variable declarations, function calls, if-else-statemens, and
while, do-while, and for-loops. On the source code level of simple algorithms the
differences are mostly of syntactic nature.
We will expect Alexsa to provide a code view of the analyzed program. Since
there is no source code in the TVLA input, Alexsa will have to construct the pseudo
code itself and display it accordingly. All aspects pertaining to the code view can
be found in Chapter 4 – Code view, starting on page 27.
2.3
Data view
The code view is only one aspect of the visualization. The second part is the
presentation of the effects the program has on its data. We will call this presentation
the Data view.
In shape analysis the current state of the heap is visualized through shape
graphs. Accordingly, TVLA’s output is a list of descriptions for graphs. These
descriptions are fed into a graph layout tool5 and are then written out in PostScriptformat. The actual presentation of the results (when printed) is a number of pages,
subdivided by pages with the name of a program point followed by pages with all
possible shape graphs for that very point in an arbitrary, uncommented order.
To provide a maximum flexibility in conjunction with TVLA, we will use the
graphs generated by dot for our visualization. Since TVLA can be used for other
applications than dynamic data structure analysis, we will not try to interpret the
generated data ourselves. This leaves open the option to easily extend Alexsa for
new uses of shape analysis and TVLA.
It should be noted that this decision poses no contradiction to the decision to
use a self-developed code view. While TVLA’s problem description was abstracted
from shape analyis’ core use, its output still comes in the form of shape graphs, just
like originally envisioned in shape analysis.
Another reason for not using a specialized graph layout is that there is still
ongoing debate on the way various properties of data structures visualized by shape
graphs are to be displayed best. We will not try to model some parts of shape graph
drawing as long as no definite answers have been given on the majority of aspects.
More on the data view can be found in Chapter 5, starting on page 41.
2.4
Visual execution
So far we only have a code view and a data view. Together with some user interface
commands we could already use Alexsa to show us all possible shape graphs for
any given program point. Without further additions we could therefore already use
our program for debugging and verification of programs and for debugging of TVLA
input files.
5 namely
GraphViz’ dot
11
CHAPTER 2. REQUIREMENTS SPECIFICATION
But we still don’t have enough for Alexsa’s main use: Algorithm explanation.
For this we need one more thing: a component for the visual execution of a program.
Reinhard Wilhelm and Beatrix Braune describe in [Wilhelm and Braune, 2000]
visual execution as follows:
The algorithm, more precisely its implementation as a program, is
explained by executing the program visually. This in contrast with concrete execution, the normal mode of executing a program on some input,
and abstract execution or interpretation, performed to statically analyze
a program.
[...]
Visual execution displays abstract states. An abstract state as consists of the program point to visit next, the currently regarded shape
graph, and non-structural information about program variables or heap
cells, e.g. relative sizes. Visual program execution should only do legal
steps. These are steps corresponding to possible steps in the concrete
execution of the program. Thus, a transition from abstract state as1 to
abstract state as2 is legal, if a transition from concrete state cs1 to cs2
exists, where cs1 is represented by as1 and cs2 by as2 . Among others,
it should observe the successor relation between shape graphs. Illegal
steps would confuse the viewer.
Running the annotated program visually means traversing the program computing and displaying abstract states. There are in general
several sources of non-determinism caused by the loss of information by
the static analysis. Conditions in the program may not be evaluable
given only abstract states. All successor statements have to be executed
in this case. Another source is that the actual shape graph may have
several successor shape graphs. A depth first search strategy will be used
to exhaust the possibilities.
Given the description above, Alexsa needs to implement the following functions:
A method to display abstract states The code view and the data view need
to be connected in a simple and intuitive way.
Determination of the successor function Since only legal steps are to be executed, we need to find some way to determine, which shape graphs result
from which others. See Chapter 3 for details.
Search strategy for exhaustive display of all paths Since shape analyis’ results may include non-determinism we need to find some usable strategy for
traversing all abstract states in a way that is understandable by the user. See
Chapter 6.3 – Explanation strategy starting on page 48 for details.
2.5
Inbetweening graphs
Many times during the visual execution of a program one shape graph is exchanged
for another one, representing a change in the heap’s content. If we would only do a
hard switch from one graph to the other, this could confuse the user for a number
of reasons:
1. Changes in the positions of elements of the graph make it hard to trace them
during a transition.
12
2.6. TVLA DEBUGGING TOOLS
2. As the used graph layout tool does not preserve an existing layout between
two graphs, two very similar graphs may have very distinct layouts, thus
destroying the user’s mental map of the data[Misue et al., 1994].
3. The actual semantic change between two graphs is obscured by the hard transitions.
The solution to this will be to make smooth transitions between the two graphs,
including slow movement of nodes and edges. This method is usually referred to
as inbetweening, as new graphs are calculated whose layout is “in between” the
layout of the source and target graphs. More on this can be found in Chapter 7 –
Inbetweening graphs, starting from page 59.
2.6
TVLA debugging tools
The TVLA system uses TVP and TVS files for input, and as there exists no translation from standard programming languages to TVP yet, the TVP files need to
be handwritten. But handwritten programs are error prone.6 Even though most
‘simple’ errors will already be detected by TVLA (by refusing to work on the input),
the user may face the situation where the input is syntactically correct (and thus
analyzed by TVLA), but where a semantic error in the input leads to more or less
obviously faulty results.
In such cases the search for errors within the TVP file(s) can be difficult, and is
even worsened by the possibility of multiple file inclusions, where the user usually
not even sees the whole TVP input at once.
As Alexsa has a graphical user interface and needs to parse the TVP files anyway,
we find it useful to offer some basic tools for visualizing the various parts of the
TVP files. This will include lists of the defined sets, predicates, consistency rules,
and actions.
2.7
Example program
In many places throughout this thesis we will use examples to show the effects of our
ideas. If possible, we will use the same example program, namely DeleteAll.tvp.
Delete All is a program that takes a singly linked list pointed to by x and frees all the
heap cells in it. DeleteAll.tvp is part of the collection of example files distributed
with TVLA. Appendix B.2 on page 82 contains a complete listing of DeleteAll.tvp.
6 Prof.
Günter Hotz on October 19th 1994
13
CHAPTER 2. REQUIREMENTS SPECIFICATION
14
Chapter 3
Interaction with TVLA
As discussed in section 2.1, Alexsa will cooperate with TVLA, thus providing a user
interface for the generated data. TVLA itself does not have any graphical user interface, it is used as a commandline tool, and all necessary input is passed on to it
in the form of multiple input files whose names are given as parameters to TVLA.
TVLA then writes its results to a file (in the form of a suitable input for GraphViz’
dot), then calling dot in order to create a set of layouted graphs in PostScript file
format.1
It is our goal to interfere as little as possible with TVLA’s inner workings, as we
have already seen that it can be used for other purposes, too, and thus incorporating
TVLA into another (our) program might render it useless for those other purposes.
We will therefore simply use TVLA’s input and output files.
This is also motivated by another argument: The goal of Alexsa is to explain algorithms. Such explanations may be performed many times on the same algorithm,
but as the analysis of such an algorithm doesn’t change between two animations,
there is no need to recompute the complete analysis for every animation. By separating the analysis and the visualization, we only need to run the analysis once.
This way we can avoid to spend unnecessary time at the very moment we want to
show an animation.
3.1
TVP files
As described in Chapter 1.3, the TVP files contain both the program being analyzed
as well as the definition of the language used in the program. A complete definition
of the TVP file format can be found in [Lev-Ami and Sagiv, 2000a]. As we want
to create a code view of the program analyzed, we will have to read the TVP file.
Appendix B.2 on page 82 contains an example for a TVP file, our example program
DeleteAll.tvp.
A TVP file consists of three or four main parts – declarations, action definitions,
a control flow graph and an optional list of control flow graph nodes to be displayed;
if the last part is omitted, all nodes are displayed.2
In the declaraton section sets, core and instrumentation predicates, and consistency rules can be defined. These declarations can then be used in the second
1 See Chapter 3.3 – Shape graphs, where we describe how and why we change the final output
from PostScript to another format.
2 In all cases when Alexsa is used on TVLA results, the omittance of this last part is strongly
advised. If only the data for some nodes is printed, no visual execution is possible.
15
CHAPTER 3. INTERACTION WITH TVLA
section, where the actions (comparable to the instructions of a programming language) are described in terms of their effects on the predicates. The control flow
graph finally is a representation of the program to be analyzed. Its nodes are arbitrary labels and the directed edges connecting the nodes carry the names of actions
declared above.
Within Alexsa we need the TVP file mainly for the creation of the code view.
As we will see in Chapter 4 (page 27), it will not be enough to only read the control
flow graph; the actions are needed, too. Also, we established the requirement to
supply some debugging functionality for TVP files, and therefore we will read the
entire TVP file, parsing its complete structure.
Reading and parsing input files is a job often encountered in software development, and the theories behind it are well understood [Aho et al., 1986]. For
most non-trivial input parsing the development of own parsing methods would be a
reinvention of the wheel. For many years now standard tools for the generation of
scanners and parsers exist, and using them is a standard method; we will make no
difference in this and use such tools for reading the various input files. The tools
used by us are JLex and CUP [Appendix A.2], which are Java-versions of the popular
flex and bison tools.3
CUP supports and recommends the use of dedicated classes for the various parts
of a hierarchical file. We therefore create a total of 21 classes to hold the various
parts of a TVP file. For better structure, all these classes are located within the
alexsa.data.tvp package.4 The central class for the TVP file is alexsa.data.tvp.Program. All other classes will be contained directly or indirectly as members within
Program. We will also add other data to Program coming from other input files
as we go. See the next sections for details on this. In the end, Program will also
contain a number of member functions for combining the data in a way appropriate
to Alexsa.
It remains that the part of major interest to us within the TVP file is the control
flow graph, or just CFG, as we will refer to it from now on. In the TVP file the
graph is described as a vector of directed edges, each edge containing the label of
its source and target node and the name of the action associated with this edge,
including all necessary parameters for this action. For example, an edge like this
n 1 Copy V ar L(x, elem) n 2
would state that we can get from program point n 1 to program point n 2 by
applying the action Copy V ar L. When consulting the definition for Copy V ar L,
we will find that with the two parameters x and elem passed, the effective result
will be that the value of elem will be copied into the variable x.
Within Alexsa the CFG will be represented by a vector of CfgEdges, each edge
containing two member CfgNodes. The two classes CfgEdge and CfgNode are derived from the more general classes alexsa.data.Edge and alexsa.data.Node. We will
see other derivations of Edge and Node in the next sections.
One more point about the TVP files should be noted. As described, the files
contain the definition of all used actions along with the actual program. It can be
3 Some authors like Wilhelm and Maurer [Wilhelm and Maurer, 1997] recommend to split the
lexical analysis itself into two steps, the actual scanner and a second component called the screener
as introduced by DeRemer [DeRemer, 1974]. The screener will be responsible for taking the simple
tokens generated by the scanner and identify a given set of keywords in them. However, in Alexsa
we do not perform this splitting, as our scanner can easily perform the screening, too. Furthermore,
we do not expect the input formats to be changed much in the future, plus our combination of
JLex and CUP works nicely close together, without other intermediate levels.
4 See Appendix C.1 for a complete list of all of Alexsa’s packages and classes.
16
3.2. TVS FILES
expected that these action definitions are not unique to all files, but that indeed
many TVP files will share the same action definitions. It would therefore be highly
redundant to include the definitions with every single program. Therefore TVLA offers the use of file inclusion exactly like in C or C++. This way multiple programs
can be linked with a single set of files containing more general declarations. The preprocessing functionality needed for this was not actually implemented within TVLA,
but instead by the use of the class CPreProcessorStream by IBM AlphaWorks.5 To
facilitate an identical behaviour regarding file inclusion, Alexsa uses the very same
component. As the TVLA examples also use file inclusion along a search path (via
the $TVLA HOME environment variable), this search path also needs to be passed
to Alexsa as a parameter in order to use the TVP files in the same way as in TVLA.
3.2
TVS files
The TVP file defines a program and its environment, but it does not say anything
about the initial data, which in our case describes the initial heap’s content. To
specify this information TVLA uses a second input file in a format called TVS (three
valued structure). Within this file the truth assignments for the various predicates
are specified in a way such that they describe the initial data to be worked with.
As an example see the following file SLL.tvs. It contains the declaration of two
initial structures, one describing a singly linked list of length greater than one, the
other one a singly linked list with exactly one element; both lists are pointed to by
the variable x.
//
%d
%n
%p
}
//
%d
%n
%p
SLL with 2 or more elements
= {"List of length > 1"}
= {u, u0}
= {
sm = {u:1/2}
n = {u->u:1/2, u0->u:1/2}
x = {u0}
r[n,x] = {u, u0}
SLL with one element
= { "List of length 1 " }
= {u0}
= {
x = {u0}
r[n,x] = {u0}
}
Even though we don’t need to understand the syntax and semantics of TVS files
in full right now, we still want to give the reader a brief introduction. A TVS file
contains an arbitrary number of structures. Every structure is characterized by a
definition of the heap cells in it (u and u0 in the first, u0 in the second structure)
and a set of truth assignments for the various predicates with respect to the heap
cells (in 3-valued Kleene logic). Predicates can be unary (describing properties of
heap cells) or binary (describing relations between heap cells).
In general we wouldn’t need to read this initial data, as TVLA provides us sufficient results to work with. However, there is one point within Alexsa where we not
5 See
Appendix A.3 for details on this component.
17
CHAPTER 3. INTERACTION WITH TVLA
only need the TVS file, but for which we will also need to extend TVLA’s original use
of it. In Chapter 6 – Automatic visual execution we describe how we construct a
visual execution of the analyzed program. Such an execution needs to start at some
starting point, but a TVS file can contain more than one structure. The choice
between the two initial structures should be left to the user, but in order to make
a decision the user will need some information about the structures. Alexsa will
therefore summarize the structures, but it can only do this in a very general way.
A much better approach would be to have a precise and easy to understand
textual description for every structure, and the most reasonable place to put such
information is along with the described structures. However, the original TVS
format as described in [Lev-Ami and Sagiv, 2000a] does not contain an option
for such a description. We therefore extend the TVS format to hold an optional
comment describing the semantics of a structure. The TVS file above already
contains these comments in the lines starting with %d (d for description). These
comments are optional, but we strongly advise the use of them in all TVS files for
improved clarity.
As the %d-directive was not contained in the original TVS format, TVLA does
not recognize it. We therefore extend TVLA’s TVS import filter to recognize (and
simply ignore) the comments. See Appendix C.2.3 for details on this.
It should be noted that there is another way to facilitate obtaining information
about the structures. As we can see in our example file above, the author included
comments about the structures declared. We could have read these comments, using
them instead of the newly introduced directives. But there are important reasons
not to do this. Not only is the positioning of these comments in no way regulated
(making it hard to find the appropriate comment for some structure), but also the
comments could have been used for other than descriptive purposes. Imagine just
for example an author experimenting with multiple structures, outcommenting some
of them. Using such comments would only provide some text that is not connected
with some other structure in any way. Therefore this option is highly fault-prone,
and we will not use it.
Even though we are only interested in the descriptions for the structures, we
will still read the whole TVS file. Future versions of Alexsa may use the TVS files
in other ways than envisioned now, and we will thus improve the extendability of
Alexsa.
For file reading and parsing we will again use JLex and CUP, just like for the TVP
files. All classes pertaining to the TVS files are stored in the package alexsa.data.tvs.
The use of the CPreProcessorStream-class is neither needed nor advisable, as TVLA
wouldn’t be able to cope with file inclusion in TVS files.
As announced in the last section, the class alexsa.data.tvp.Program will work as
a collecting place for various information gathered from other files and will therefore
hold a vector of the three-valued structures defined in the TVS file.
3.3
Shape graphs
The main result of TVLA’s analysis is a number of sets of shape graphs6 , one set for
each program point.
6 Shape graphs are known as structures within TVLA, probably as to make clear that TVLA can
be used beyond shape analysis’ original uses.
18
3.4. TRACE FOR LEGAL STEPS
In its original configuration TVLA instructs dot7 to produce PostScript files, with
the shape graphs printed on a dedicated page each. This was fine until now, as the
PostScript format allowed users to view or print the graphs in a very flexible way.
But now, as the graphs are supposed to be displayed by Alexsa, PostScript format
would be too complex, both to read and parse as well as for drawing. For our
purposes it would suffice to have dot calculate the layout and to just print out the
results in a simpler format. Fortunately dot offers this very option, and the format
we want to use is called “plain graph format”. The necessary changes to the TVLA
calling script are listed in Appendix C.2.1.
As with TVP and TVS, we use the JLex/CUP combo again for reading and parsing, but unlike TVS, the graphs are not stored as a vector within the alexsa.data.tvp.Program class, but (for efficiency) first with the trace (see next section) and
later also with the CFG nodes. All classes pertaining to the parsing of the shape
graphs are located within the alexsa.data.graphs package.
3.4
Trace for legal steps
We have now read all of TVLA’s input and output files. We know, what the analyzed program looks like, what the initial data is, and which shape graphs can be
associated with every point in the program. But to perform all the tasks we set out
to do, we will need one more thing: a trace function connecting the shape graphs.
3.4.1
Trace function
As quoted in Chapter 2.4 – Visual execution, the visual execution of a program
is supposed to make only legal steps. A step is legal if the step corresponds to a
possible concrete step in the concrete execution of a program. We will denote such
a legal step by “s1 → s2 legal”.
We need some successor function t for shape graphs, which we will call the
trace-function. We define SG(s) to be the set of shape graphs associated with some
program point s.
We define for some gs1 ∈ SG(s1 ):
e
t(gs1 ) = {gs2 : (∃e ∈ CF G : s1 → s2 ) ∧ (gs2 ∈ SG(s2 )) ∧ (gs1 → gs2 legal)}
Please note that the result of t(g) is a set, as some graphs have one, no, or more than
one legal successors. In most cases, however, the set will only have one element.
The intuitive meaning of the trace function is that we only want to make a
transition from one point and its shape graph to another iff the new shape graph
represents one of the possible resulting shape graphs, and not just any shape graph
from SG(s2 ).
The necessary data for the trace function is neither present within TVLA nor can
it easily be reconstructed within Alexsa. We therefore will have to enhance TVLA
to produce the necessary data. For those readers who are interested in the actual
changes, we refer to Appendix C.2.2, where all changes to TVLA are listed in detail.
Right here we only want to give a general idea of the enhancements.
The first point to be noted is that again we want to interfere as little as possible with other uses of TVLA. Therefore, we introduce a new parameter -trace
<tracefilename> to TVLA. Only if this parameter is given, TVLA will write trace
7 See
Appendix A.1 for details on dot.
19
CHAPTER 3. INTERACTION WITH TVLA
data. Appropriate additions were made to the parameter handling section and to
the help function.
3.4.2
Unique IDs for shape graphs
Close examination of TVLA’s source code reveals that a number of other things need
to be changed, too. First of all, all shape graphs8 need to be identifiable beyond
the execution time of the analysis. Until now, all graphs are either identified by
their memory address or compared for isomorphic shape, but no actual identification takes place. We therefore add an ID-variable to every structure. This ID is
guaranteed to be unique by setting it to a new value only within the constructor of
a structure, using a static variable as a global ID counter.
Lev-Ami developed TVLA in a way that allows an easy change of strategies for
the various aspects of the analysis. He therefore allowed for multiple implementations for various parts of the software, selecting the one actually used by constants
and runtime-parameters. The different implementations were grouped in packages
with names roughly describing the intended feature of some implementation (naive,
advanced, etc.). Together with object oriented inheritance, any TVLA developer can
experiment with different new approaches in the analysis.
One effect of this approach is that some things can be implemented multiple
times at different places. For example, there is not only the class tvla.Structure,
but also tvla.compressed.CompressedStructure and tvla.naive.NaiveStructure. In all
these classes we ensure that all constructors also call the constructor of the super
class tvla.Structure.
Now all shape graphs can be uniquely identified. But having this information
present within TVLA is of course not enough – it needs to be written to some file
for Alexsa to read in. The name of this file is already at hand – it was given as a
parameter to TVLA. To keep the trace function as separated as possible from the rest
of TVLA, we store all code for the I/O in an extra class called tvla.Tracer. Tracer
was written using static variables and methods only. This way we do not need to
pass references to a Tracer -object to all the places where calls to methods within
Tracer need to be made. And since TVLA only handles one input file per execution,
we need not fear for mixups between different analyses.
The first job of the Tracer class will be to print out the IDs of the shape graphs
generated from the structures declared in the TVS file. This way Alexsa will later
be able to identify the shape graphs to start with. The actual file format of the
trace file will be presented in Figure 3.1.
3.4.3
Gathering the trace information
The next thing to do is to gather the trace information. Again, minimal interference
is paramount. Instead of gathering some status information during the analysis,
passing it from step to step, and then finally handing it all to Tracer, we introduce
a number of dedicated notification methods in Tracer, so that all information can
be passed to Tracer where it appears. Tracer itself will take care to collect the info
and print it when complete.
Most of the information needed can be collected within tvla.Engine and tvla.IntraProcEngine. The name of the current program point and the currently analyzed shape graph are transmitted to Tracer, as well as the name of the next point,
the name of the action performed, and the list of newly generated shape graphs.
8 structures
in TVLA
20
3.4. TRACE FOR LEGAL STEPS
At one point we needed to extend TVLA a little bit more: During the analysis TVLA compares every newly generated structure with all previously present
structures at a given location. If it finds the new structure to be isomorphic to
another structure, it will discard it, as it would otherwise just perform some partial
analyses a second time. For TVLA, this is both a matter of efficiency as well as
termination of the analysis.
Alexsa on the other side is extremely interested in this kind of information as it
indicates some form of cycle which will play a special role in the visual execution.
Therefore in case of such a discard, Tracer is notified, passing it the old and isomorphic structure.9 This takes place during the process of joining 10 and currently
the only join implementation within TVLA is tvla.advanced.AdvancedJoin, which is
thus exactly where our enhancement was placed.
3.4.4
Identifying the layouted graphs
After all the trace information has been printed we only need one more thing: we
need to be able to link all our IDs to the layouted shape graphs. One possible
approach would be to “smuggle” the IDs into the actual graphs in a way such that
they would “survive” the layout process. But as we have no detailed understanding
of dot, we don’t want to pass data to a program that doesn’t need it, just to extract
it later.
Instead we use our trace-file again. When TVLA stores the shape graphs for dot
to layout, we also print the IDs of these shape graphs in our trace file in the same
order. This way we can later make a simple one-to-one assignment to reconstruct
the IDs. This is also the reason why we will store the shape graphs in Alexsa not
with the Program-object itself, but with its trace, as this will be the place where
the graphs can be identified first.
3.4.5
Reading the trace file
Reading the trace file is a simple process. As the structure of the trace file is
sufficiently trivial, we do not use JLex and CUP for parsing. In this case the implementation of the parser by hand was no more complex than writing according
specifications, and unlike CUP, our own implementation is also a bit faster and memory efficient due to its simplicity. The grammar for trace files can be found in Figure
3.1, an example for such a file in Figure 3.2.
::= initial shape *trace step *location *
trace file
initial shape ::= initial: id \n
::= transition: state ->state, action: id ->id \n
trace step
| redundancy: state ->state, action: id ->id \n
id
::= [0-9]*
state
::= "[ˆ”]*"
action
::= "[ˆ”]*"
location
::= location: state \n shape id *
shape id
::= shape: id \n
Figure 3.1: The grammar for trace files generated by TVLA
9 Passing
10 Joining
the new structure wouldn’t make sense, as it will never be printed later on.
is a function internal to TVLA and is of no further relevance for us.
21
CHAPTER 3. INTERACTION WITH TVLA
initial: 1
initial: 2
transition: "n_1"
transition: "n_1"
transition: "n_2"
transition: "n_2"
transition: "n_3"
transition: "n_3"
transition: "n_3"
transition: "n_4"
transition: "n_4"
transition: "n_4"
transition: "n_5"
redundancy: "n_5"
redundancy: "n_5"
transition: "n_1"
location: n_1
shape: 1
shape: 2
shape: 29
location: n_2
shape: 6
shape: 8
location: n_3
shape: 10
shape: 12
location: n_4
shape: 17
shape: 19
shape: 21
location: n_5
shape: 23
shape: 25
shape: 27
location: exit
shape: 35
->
->
->
->
->
->
->
->
->
->
->
->
->
->
"n_2", "x != null": 1 -> 6
"n_2", "x != null": 2 -> 8
"n_3", "elem = x": 8 -> 10
"n_3", "elem = x": 6 -> 12
"n_4", "x = x->n": 12 -> 17
"n_4", "x = x->n": 12 -> 19
"n_4", "x = x->n": 10 -> 21
"n_5", "elem->n = null": 19 -> 23
"n_5", "elem->n = null": 17 -> 25
"n_5", "elem->n = null": 21 -> 27
"n_1", "free(elem) ": 27 -> 29
"n_1", "free(elem) ": 25 -> 2
"n_1", "free(elem) ": 23 -> 1
"exit", "x == null": 29 -> 35
Figure 3.2: The trace file for our example program DeleteAll.tvp
One quickly sees that some of the advantages of the trace file format are its
simple line-by-line structure and its good human readability.
Please note that the keyword redundancy has been selected such that it reflects
its function in TVLA, and not such that it denotes its interpretation in Alexsa.
In TVLA such a redundancy means that a structure like the one currently derived
already exists and that therefore further computations on the new structure would
be redundant, thus abandoning the new structure. Even though right now Alexsa
is the only software using the trace function, we felt that we should implement this
enhancement such that the used terms reflect their use within TVLA, as it might be
usable for other purposes, too. The interpretation of redundancies as cycles will be
left to Alexsa.
The trace describes again a graph. For our example file DeleteAll.tvp the
graph looks like in Figure 3.3. The nodes have been grouped into rows corresponding
to the program points.
22
3.5. SIMPLIFYING THE USER INTERFACE
n_1
1
2
n_2
6
8
n_3
12
10
n_4
19
17
21
n_5
23
25
27
exit
29
35
Figure 3.3: The trace graph for DeleteAll.tvp
3.5
Simplifying the user interface
At this point it makes sense to introduce an improvement in the user interface. We
have seen that Alexsa will need to read four different files for the visualization, the
two TVLA input files x.tvp and x.tvs, as well as the generated files x.graph and
x.trace. All these files are obligatory for Alexsa. Instead of requiring the user to
specify four different files, Alexsa will try to automatically find corresponding files.
When the user selects the file x.tvp to be opened, Alexsa will also load the files
x.trace, x.graph, and, if present, x.tvs.
Making the assumption to find corresponding .trace and .graph files is relative
safe, as the (modified) TVLA-shellscript instructs TVLA to generate exactly these two
files. As for the TVS file, things are different. A file called x.tvs may exist, but
it doesn’t have to. If it exists, it will be automatically opened, too. But the user
might have chosen to have a differently named TVS file. This can make absolute
sense, as a number of different programs might be analyzed with the same initial
data, which will then only need to be stored once. Therefore, if Alexsa cannot find
a corresponding TVS file, it will open a second file selection dialog querying the
user for the TVS file. Still, one or two file selections are still an improvement over
four file selections.
Another improvement has been made in the file selection dialog. If a user stores
a number of programs in the same directory, the total number of files can become
quite overwhelming (see Figure 3.4 for a view of a TVLA example directory). This is
an unsatisfying situation. But with the help of a file filter we can make life easier
for the user.
The file filter decides for every file or directory within the current directory
whether it should be displayed or not. In our case, we implement a filter that will
only accept two kinds of items: Directories (for navigation) and TVP files if and
only if there are corresponding .trace and .graph files for the specific TVP file. The
23
CHAPTER 3. INTERACTION WITH TVLA
Figure 3.4: Content of a directory with analyzed TVLA-examples
.trace and .graph files will not be displayed. This leads to a much more compact
view of the directories, as only files that could be read will be displayed. See Figure
3.5 for Alexsa’s file selection dialog for the very same directory as in Figure 3.4.
The choice of the TVP file as representative for the whole set of necessary input
files is well motivated as the TVP file contains the actual program analyzed. All
other files only contain information about that program of some kind or other.
Figure 3.5: Open file dialog with filtered file names
3.6
Incorporation of changes into TVLA
When developing Alexsa we worked with a version of TVLA from July 2000. All our
changes to TVLA were discussed with and transferred to the current maintainers of
24
3.6. INCORPORATION OF CHANGES INTO TVLA
TVLA. TVLA is currently maintained by Roman Manevich, [email protected].
More details on current versions of TVLA can be found online.11
A few days before this thesis was completed, a new version of TVLA was released
(version 0.9.1), which tried to incorporate our changes. Unfortunately, the release
was still a beta version, and some parts of our enhancements were still missing,
effectively keeping Alexsa to work together with that version. However, improved
versions of TVLA that will fully incorporate our changes can be expected in the near
future.
11 http://www.math.tau.ac.il/∼rumster/TVLA/
25
CHAPTER 3. INTERACTION WITH TVLA
26
Chapter 4
The code view
The code view is the visualization of the analyzed program. Because the program’s
representation in TVP format is hard to read, we will reconstruct a better readable
form of pseudo code from it, which will then be displayed instead. We will develop
a reconstruction algorithm for the pseudo code generation and will show which
common control structures can be detected by it.
4.1
Problems with TVP
The analyzed program is stored in the TVP file in the form of a textual description of a control flow graph. As already shown in Chapter 2.2 – Code view, the
automatically layouted control flow graphs are not enough for sufficient clarity and
intuitive understanding.1
In most textbooks and among many teachers it is very common to use some form
of pseudo code or even actual source code to explain algorithms[Cormen et al., 1990].
We will choose this way, too. Does TVLA already provide us such a pseudo code?
In some way, yes. Take a look at the definition of the control flow graph in our
example TVP file, DeleteAll.tvp:2
n_1 Is_Null_Var(x) exit
n_1 Is_Not_Null_Var(x) n_2
n_2 Copy_Var_L(elem, x) n_3
n_3 Get_Next_L(x, x) n_4
n_4 Set_Next_Null_L(elem) n_5
n_5 Free_L(elem) n_1
For details on the general structure and syntax of TVP files please see Chapter
3.1 – TVP files on page 15. Even though the reader may already decipher the
semantics of this code, it is not very well suited for a human reader for a number
of reasons:
1 See
Figure 2.1 on page 10.
example has been modified from the version that comes with TVLA by removing the
comments. Even though the comments might clarify some points, this behaviour can not be
guaranteed. Comments could have other meanings, too, like for example outcommenting pieces
of code. As we wouldn’t be able to rely on this information in Alexsa, we cannot use it at all.
Therefore our example here shows the information as it is available to Alexsa.
2 The
27
CHAPTER 4. THE CODE VIEW
• The representation refers to the previously defined action names in the form
of function calls, which is very uncommon for any kind of code.
• The program point labels bear some implicit semantics without ever defining
this meaning. For example, the target of the first edge, exit, hints for the end
of the algorithm, but to verify this we would still have to check for ‘exit’ not
to appear anywhere else as a source point label. This might be the case for a
two stage algorithm, where ‘exit’ only marks the exit of phase one.
• The reader needs to compare target and source point labels often to follow
the structure. Only by a comparison we can see that the target of the last
edge takes us back to the point we started at.
• Some actions’ semantics can not be determined without consulting the actions’ definition. What variable is copied into the other one when calling
Copy Var L(a, b)?
• Branches in the CFG are unnecessarily complex, two edges with two different
actions are needed to resemble a simple branch.
• No visualization helps the reader in distinguishing conditional statements and
loops.
These arguments suggest to display the code in a more human readable format;
our own code view is thus well motivated.
4.2
Design decisions
Now that we have decided to develop our own code view we need to make some
further decisions guiding the visualization. The first thing we should establish is,
whether we want to use the syntax of some existing programming language or some
form of pseudo code.
There are a number of reasons against using some concrete syntax:
• TVP files are handwritten. Assuming some specific programming language
would be against TVLA’s universal usability.
• As we will see later in this chapter, we will combine own syntactical elements
with others provided by the author of the TVP file. We cannot make any
statement about the syntax used by the TVP author.
• We expect tools for automatically generating TVP files from various languages
to be developed in the future. Using some specific syntax would again compromise the universal usability of TVLA.
• Most teachers use pseudo code to symbolize source code.
All this suggests to use pseudo code in our visualization, which we will therefore
do.
We will have to set up some other general guidelines for our code view. In
reaction to TVP’s shortcomings described above, we will strive to improve the code
view in a number of aspects:
• If possible, we will not use action names but instead a more meaningful representation of the action executed.
28
4.3. THE CONSTRUCTION ALGORITHM
• We will keep the program point labels for cross-reference with the TVP files.
However, point labels will only appear if they actually have outgoing edges
associated with them. In our example above, exit will not be shown but
instead be visualized implicitly through the structure of the code.
• Whenever the target of an edge is simply the next line, the reference to the
target will be omitted. This makes for a dramatic reduction in target labels, as
proceeding to the next line of code is a standard behaviour in most programs.
• Depending on well written actions, the representation of the actions will
be much clearer on the semantics than the action names. In our example
Copy Var L(a, b) our representation will simply be a = b.
• When branches in the CFG will occur, we will try to model them using standard programming control structures like if and while. To do this, we will
have to make assumptions and verify them. We will set the principle to make
safe assumptions, thus risking not to detect some structures, but instead having a safe fallback state to rely on. We will see more detailed examples of
cases where we cannot reconstruct control structures safely.
• Along the last argument, loops will be visualized much better through their
usual control structure with appropriate syntax formatting.
Having set these guidelines, we will now proceed to describe the actual steps taken
to construct the code view.
4.3
4.3.1
The construction algorithm
Step 1: Preparing the control flow graph
After the TVP file was read, the control flow graph is constructed from the lines describing it. This graph will later be transformed by replacing some of the nodes with
more complex nodes resembling programming language structures like if-statements
or while-loops. These complex nodes will not be interconnected with their inner
components (e.g., the if-branch in an if-statement) by the standard in- and outgoing edges of a node, but by special, semantic-bearing member variables that will
correctly resemble the member’s function.
We start the reconstruction by applying a standard depth-first search (DFS)
[Cormen et al., 1990] to the unmodified CFG to classify the edges for tree-, forward-,
cross-, and back-edges. We will need this information later when detecting the
structures. See Figure 4.1 for an example for the classification of edges in our
example program.
4.3.2
Step 2: Better representation of commands
When we start the algorithm, our CFG-edges only contain references to their source
and target node and a string with the name of an action along with their parameters.
To get a more meaningful label for our edges, every edge can also carry some ‘code’text. In our second step all these code-texts are set by evaluating every edge’s
associated title-expression. As the title definition within the referenced action is not
simply a plain string but a concatenation of strings and predicate names referring
to the action’s parameters, we can construct actual pieces of code using the title
29
CHAPTER 4. THE CODE VIEW
tree edge
n_1
back edge
exit
tree edge
n_2
tree edge
n_3
tree edge
n_4
tree edge
n_5
Figure 4.1: CFG for DeleteAll.tvp after the first step of reconstruction
definition, the action’s parameter list and the actual parameters used in this very
edge.
Take for example the following excerpt from the action’s definition along with
some line from a TVP file:
%action Copy_Var_L(x1, x2) {
%t x1 + " = " + x2
[...]
}
n_2 Copy_Var_L(elem, x) n_3
Identifying the parameters by their order and by their identity between action
parameter list and title expression, we can reconstruct the code to be elem = x.
Our code view will use a combination of the evaluated title expressions and our
own syntactical additions. While our own additions happen to be correct C-style
code, we can not make such claims about the title expressions from the TVP file;
the author of the TVP file is in no way restricted in his use of an arbitrary syntax.
This is why we can only state that we use pseudo code, even though it might happen
to be correct C syntax.
4.3.3
Step 3: Detecting structures
The structure detection is implemented as a widely modified DFS which uses the
edge classifications from the first DFS run. Even though there is no start node
explicitly declared in the TVP file, we let our search start at the source node of the
30
4.3. THE CONSTRUCTION ALGORITHM
edge that is declared first in the TVP file.3 Our algorithm will traverse the CFG,
checking every node whether it models some control structure.
4.3.4
Simple nodes
In the case that we cannot find any structure being modeled by some node, we
continue like in a normal DFS and proceed with all nodes that are targets of outgoing
edges; no special action needs to be taken for such ‘simple’ nodes. Simple nodes are
very common, they model simple statements like assignments or calculations.4
Of course, as with any DFS, we make sure not to traverse nodes previously
encountered in our search. This standard behaviour will later be enhanced in case
we find some structures.
4.3.5
If-statements
Probably the most simple control construction present in basically all higher programming languages (and most low-level languages, too) is the conditional statement, where depending on the truth evaluation of some expression the program
execution continues at one of two possible locations.
In TVP, such a statement is modeled by two edges. Take the following example
of a TVP representation for a program line like if (x == null) { } (without an
else branch):
n_1
n_1
n_2
n_3
Is_Null_Var(x) n_2
Is_Not_Null_Var(x) n_3
Some_Action(x) n_3
Some_Other_Action() exit
There are a number of points to be noted here:
• TVP does not allow for direct negation in the CFG declaration. The Not in
the second line is not generic but actually references a completely different
action than line n 1.
• Nothing in one of the two lines hints for an exclusive or between the two
lines. For all that we know, they could just as well (using different actions
and parameters) be part of some other construction like “if a == b goto n 2,
else if a == c goto n 3, else if a == d goto n 4.
• Even if we had detected this to be some form of if-else-statement, we wouldn’t
know which edge to see as the ‘if-branch’ and which one as the ‘else-branch’.
The first thing we do is to break down the general form of a conditional statement into three subcases, the first to be the if-statement like in the case above,
where either the if-branch or nothing is executed before arriving at some joining
node (n 3 in the example above).
We establish some conditions that need to hold whenever we want to detect an
if-statement.
3 Apparently TVLA makes the very same ‘assumption’, which suggests that there is at least some
semantics implicit in the order of the CFG edges in the TVP file.
4 Even though shape analysis is not concerned with calculations on actual data, there will often
be some form of placeholder in the CFG to show where some calculation in the original program
takes place.
31
CHAPTER 4. THE CODE VIEW
1. We need to have a node that contains exactly two outgoing edges.
2. The two edges need to bear actions that resemble an exclusive-or decision.
3. One of the two edges can be declared as the inner edge. This edge will later
be seen as resembling the if-branch.
These first three conditions will be used for other structures, too. We will call
a node fulfilling these three prerequisites a conditional node.
4. The target node of the outer edge can be reached from the target node of the
inner edge.
Other requirements may later be established to ensure that these requirements
do not conflict with other structures we try to detect. Namely, some node that may
qualify as a conditional node may be the loop condition of a while loop. In such a
case we will treat it as a (more complex) while loop.
Some of these requirements are very easy to verify, but for some we need to
perform some more extensive checking.
Checking for exclusive-or between two edges
To check requirement two we need to make sure that the actions associated with
these two edges resemble an exclusive-or decision. To check this, we first make sure
that both actions contain preconditions only and do not modify the data in any way
when applied. The second and more important step is to test for logical negation.
We do this by syntactically comparing the precondition of action 1 to the negation
of the preconditions of action 2. This of course requires two things: A compare
function for formulae and a negate-operation.5
Both operations are implemented within the alexsa.data.tvp.Formula class. In
our implementation a formula can contain arbitrary subformulae. Our invertmethod pays respect to this by calling invert() recursively on subformulae when
needed. The negation follows simple and well understood syntactic rules using the
guideline to carry the negation further inside the formula. For example, a formula
a ∨ b with a and b again being formulae is negated as ¬a ∧ ¬b instead of ¬(a ∨ b).
This will simplify our comparison of two formulae later. Whenever a formula does
not contain any further subformulae, its data is negated as needed. For example,
when a formula contains a Kleene value, this value is negated according to Kleene’s
rules for negation on three-valued data.
The result of our negation is supposed to be a representation of the negated
formula that should be very much like the way a human writer would write a
formula with the same logical meaning. This way we expect the negated formula
to be syntactically identical to the supposedly negated formula in the other action.
We check this by applying a syntactical comparison of the two formulae that again
recurses on subformulae when needed.
This procedure makes some assumptions about the formulae and their structures. It should be noted again that even if we fail to recognize some structure, we
5 Tests with example programs from TVLA suggested to adopt another strategy here in addition
to the strict checks. As shape analysis in general and TVLA in particular do not bother with data
values, all places where data comparison is involved can not be modeled fully. In the TVLA examples
we often find constructions, where a conditional statement is used with two empty actions bearing
no actual preconditions or code at all. We found it useful to allow such empty actions to be
recognized as antagonistic, too. However, this behaviour can be turned off in Alexsa.
32
4.3. THE CONSTRUCTION ALGORITHM
will always have a fallback state where we have a code line similar to the one in the
TVP file but with a code representation instead of an action name, thus already
being an improvement over the TVP format.
Inner edges
Having checked for negation we also need to declare one edge to be the inner edge.
This is done using the linear order of CFG edges in the TVP file. In the case when
our two edges a and b are written on consecutive lines in the TVP file, the inner
edge will be the one leading to the first line following a and b (if there is any such
line). If a and b do not appear consecutively in the file, the inner edge will be the
edge appearing first in the file, given that it really leads to the next line in the file
(verified simply by checking the node labels).
In our example above, the very first line will be called the inner edge, as it leads
to the line n 2 immediately following the first two lines. If the two lines’ positions
were exchanged, the then second line would have been the inner edge.
For the second case see the following example:
n_1
n_2
n_3
n_1
Is_Not_Null_Var(x) n_2
Some_Action(x, y) n_3
Some_Other_Action(x, z) n_1
Is_Null_Var(x) exit
Here the writer tried to emphasize the loop-character of his construction by
writing the exit-clause of his while loop after the loop.6 Here again the very first
line will be called the inner edge, as it appears first in the file and leads to its
immediate successor.
Having checked all these preconditions we successfully detect an if-statement in
our example. When this occurs, the node n 1 is replaced by a new node of type
alexsa.gui.codeview.IfStatement. Within the new node its two member variables
if branch and next after if branch are set to contain references to the inner and
outer edge, respectively.
Unlike with simple nodes, our further search in the CFG is now modified slightly
from the standard DFS behaviour. While before we continued with the outgoing
edges in any order, we now first proceed with the if-branch. This way we emphasize
the hierarchical structure of our new CFG by first exploring the inner branch. Also,
we don’t want the analysis to find any overlapping structures like a while loop that
extends from inside the if-branch to somewhere beyond the end of the branch. To
prevent the search to continue beyond the limits of the if-branch, we temporarily
mark the target of the else-branch as already visited, if this wasn’t already the case.
Once our reconstruction returns from the if-branch, we will unmark the else-branch
if we marked it before and continue the reconstruction there. This behaviour will
also be used for our other detected structures in an appropriately augmented way.
Having done all this we have successfully detected and modeled our first structure. We will continue by describing the other structures detected by Alexsa, using
some of the checks introduced here.
6 This construction will later be detected as a while-loop, but as the other detection routines
make use of the same checks, namely the determination of the inner edge here, this example is
valid for this as well as for other cases, too.
33
CHAPTER 4. THE CODE VIEW
4.3.6
Simple if-else-statements
The if-statement as described above only covers constructions where only one part
of the code is executed on a conditional base, that is, where the conditional statement did not have an else-branch. Detecting a general form of an if-else-statement
however is non-trivial. The reason for this lies in the manual construction of the
TVP files. There is nothing that prevents the author of the file to use constructions that can not be modeled by any of the usual programming constructs. Also,
we don’t want to make claims about some structures when there wasn’t really the
intention to have some part of the program resemble this kind of structure (see
Figure 4.2 for an example of a confusing control flow graph). We therefore find
it appropriate to limit ourselves to detecting structures of some level of simplicity
only.
Figure 4.2: A chaotic control flow graph.
In the case of an if-else-statement we call the simple cases we model here simple
if-else-statements, modeled by the class alexsa.gui.codeview.SimpleIfElseStatement.
We establish the following preconditions for a simple if-else-statement to be
fulfilled:
• The node in question is a conditional node.
• Unlike with the if-statement, we require now that the two branches both
traverse only untraversed, non-complex7 nodes with exactly one incoming and
one outgoing edge until they reach a common node with exactly two incoming
edges, the joining point after the two branches.
• And also again, other requirements may later be established to ensure that
these requirements do not conflict with other structures we try to detect.
In the follwing example node n 1 fulfills all these requirements:
n_1
n_2
n_3
n_1
n_4
n_5
Is_Null_Var(x) n_2
Some_Action(y) n_3
Some_More_Action(z) n_5
Is_Not_Null_Var(x) n_4
Some_Action(x) n_5
Some_Binary_Action(x, y) exit
7 Complex
nodes are all nodes resembling any of the structures we detected.
34
4.3. THE CONSTRUCTION ALGORITHM
Therefore n 1 is replaced by a SimpleIfElseStatement-node n. Within n, the
member variables if branch, else branch and joining point are set to the appropriate
values. As with the if-statement, we continue in our reconstruction in a defined
order: First, the if-branch is reconstructed, followed then by the else-branch before
finally proceeding with the joining point which we again marked as traversed before.
4.3.7
General if-else-statements
In all cases where a conditional statement neither has an if-branch only, nor fulfills
our simplicity-requirements for a simple if-else-statement, we will call the case a
general if-else-statement. This is for example the case for if-else-statements with
nested constructions of arbitrary complexity.
Such general if-else-statements will later be displayed in the following form:
n_1: if (expression)
goto a;
else
goto b;
Again, we have an extra class to replace such a node, namely alexsa.gui.codeview.GeneralIfElseStatement.
4.3.8
While-loops
All our previous examples involved some form of if-statement. But such statements
are not only used to model simple branches but also to be part of the representation
for loops of some form. One such loop is the while-loop. Unlike in the syntax of
normal higher programming languages, we will not have the luxury of some explicit
end-marker for such a loop. Instead we will need to detect the actual extend of the
loop using some other methods.
As a while loop places the condition at the beginning of the loop, we will detect
a while loop as soon as we encounter the beginning (and not when we reach its end).
We establish the following requirements for a node n to be regarded as representing
a while-loop:
1. n is a conditional node.
2. There is exactly one edge classified as a back-edge entering n; this edge is
supposed to be the jump back to the loop’s condition after one cycle.
3. The source of that back-edge is reachable from n.
4. If all of the above conditions hold, we will treat the node in question as
representing a while-loop, even though it would also resemble an if-statement.
We therefore add the requirement for an if-statement that it must not also
resemble a while-loop.
The DeleteAll-example given at the start of this chapter on page 27 contains a
while-loop satisfying all these requirements.
Such a node n 1 is then replaced by an object of type alexsa.gui.codeview.WhileLoop, with its member variable while condition and goto on exit set to the inner
edge and the target of the outer edge, respectively.
35
CHAPTER 4. THE CODE VIEW
The reconstruction is performed on the inside of the loop, protecting the exit of
the loop like before by marking it. The construction ends by proceeding with the
node pointed to by goto on exit.
4.3.9
Do-while-loops
Do-while-loops, where the loop condition is placed at the end of the loop and therefore the loop’s body is executed at least once, are a little bit harder to detect.
Unlike with any of the other structures detected so far, the node with the
conditional statement appears at the end of the structure. We therefore have the
option to detect a do-while-loop when we encounter its start (which, again, is not
marked specially in any way in the CFG), or to wait until we encounter the loop
condition.
When implementing the detection we find that it is simpler to detect the dowhile-loop when reaching the loop condition, as we can then handle all complex
structures together whenever we encounter a node having a conditional statement;
otherwise we would have to check for such conditional statement more often, and
often unnecessarily.
We establish these conditions for the node n with the conditional statement for
it to be a representation of a do-while-loop:
1. n is a conditional node.
2. No back-egdes enter n.
3. There is exactly one back-edge leaving n, leading to a node from which n can
be reached.
4. If all of the above conditions hold, we will treat the node in question as
representing a do-while-loop, even though it would also resemble a general
if-else-statement. We therefore add the requirement for an general-if-elsestatement that it must not also resemble a do-while-loop.
The following CFG declaration contains such a construction:
n_1
n_2
n_3
n_3
Some_Action() n_2
Some_Other_Action() n_3
Is_Null_Var(x) exit
Is_Not_Null_Var(x) n_1
If n represents the conditional statement of a do-while-loop, we not only replace
n by a node of type alexsa.gui.codeview.DoWhileLoop, but also change all references
to the node the loop starts at to point to the loop itself. This way we ensure that
we will later find the do-while-loop at the right time for the generation of the actual
pseudo code.
When we have successfully detected the do-while-loop, we have already reconstructed the whole loop’s body. Our search will therefore continue with the one
node that is reachable from the loop’s condition and does not represent the start of
the loop. In our example above, this would be the node labeled ‘exit’.
36
4.3. THE CONSTRUCTION ALGORITHM
4.3.10
Step 4: Code view line by line
After step 3 we have detected all higher constructions we want to handle so far;
future implementations of Alexsa might try to detect even more complex constructions like functions, but for now we will settle with the level reached. This is also
supported by the fact that the current version of TVLA only handles intraprocedural
analysis[Lev-Ami et al., 2000], we therefore do not limit ourselves beyond the level
supported by our analysis.
So far we still only have a (modified) control flow graph. To get a code view
as desired we now need to linearize the graph, printing the graph line by line in an
appropriate way, including appropriate indentions for improved clarity.
We therefore perform another modified depth-first search. This time, we will
create lines of code for every node encountered.
As described above, all nodes that were not classified as some complex structure are still standard CfgNode-instances. Such simple nodes are transformed to
pseudo code in a straightforward way. For every outgoing edge8 a line of code is
added with the name of the node as a label, the previously generated code as a
command sequence, a closing ‘;’ like in many higher languages, and finally target
of the edge is appended in the form goto <node>;. For now, we will not bother
about unnecessary goto-statements; they will be taken care of in the last step. The
level of indention is given as a parameter to the reconstruction function and will
not be changed for a simple node.
After all edges are printed, the code generation is called subsequently on the
targets of all outgoing edges.
In this process a complex node may be encountered. In such a case a specialized
routine within the node is used that will produce a pseudo code appropriate to that
particular type of node; also, the order of subsequent code construction calls can be
decided freely by the various complex nodes. We will now give a brief description of
how the various nodes construct their code, rounding it up by the code generated
from the examples used during the detection step.
If-statement
The first line is labeled with the old node’s name. The code starts with the string
‘if (’ followed by the code-component of the edge that was found to be the inner
edge, finally rounded up by a ‘) {’. Then the code construction is called on the
node reached first by the if-branch, passing an increased indention level to it.9 As
during the detection of structures we again make sure that the code construction of
the if-branch does stop at the end of the branch by marking the target of the other
branch as already visited. This concept will be the same for all other constructs,
too, so we will not explicitly mention it further.
When the code construction returns from the if-branch, a line just containing
a ‘}’ with the original indention depth is added before code construction continues
with the target of the next after if branch-edge.10
8 A simple node can have more than one outgoing edge. This can be the case when the node
models a structure not recognized by Alexsa. In such cases the order, in which the outgoing edges
are handled, is arbitrary.
9 The indention level is simply an integer counting the indention level starting at zero in steps of
one. The actual indention is later produced by the repeated concatenation of an indention string.
The default for this string is four spaces, but it can be changed to any other string through the
use of Alexsa’s preferences.
10 In this and the following examples the superfluous goto-statements have already been removed
37
CHAPTER 4. THE CODE VIEW
n_1: if (x == null) {
n_2:
someAction(x);
}
n_3: someOtherAction();
Simple if-else-statement
Like with the if-statement, the first line will be ‘<label>: if (<code>) {’, followed
by the indented code for the if-branch. When code construction returns from the
if-branch, the line ‘} else {’ is added, followed by the indented code construction of
the else-branch. And when this call returns, too, we can add a lone ‘}’ and continue
with the goto on exit-node.
n_1: if (x == null) {
n_2:
someAction(y);
n_3:
someMoreAction(z);
} else {
n_4:
someAction(x);
}
n_5: someBinaryAction(x, y);
General if-else-statement
As already shown during the detection step, the code for a general if-else-statement
will be very straightforward:
n_1: if (expression)
goto a;
else
goto b;
While-loop
The while loop is a bit more interesting again. The first line is started with the
conditional node’s label, followed by a ‘while (’ and the code for the edge leading
into the loop’s body, closed by a ‘) {’. Then the indented loop body is generated,
closing the loop with a lone, unindented ‘}’:
n_1: while (x != null) {
n_2:
elem = x;
n_3:
x = x->n;
n_4:
elem->n = null;
n_5:
free(elem);
}
for clarity. Also, we can usually expect the other commands (someAction...) to be replaced by a
more meaningful representation of their function.
38
4.3. THE CONSTRUCTION ALGORITHM
Do-while-loop
The do-while-loop starts directly with a lone, unlabeled ‘do {’ that is unindented
relative to its surrounding code. Since this line is not actually contained in the
CFG declaration, we don’t want to give it a label, not even the one of the loop’s
condition, as we don’t want this artificial line of code to be confused with a jump’s
target from any other line.
The loop’s start is then followed by the indented lines for the loop body before
finally printing the loop’s end by a line of the form ‘<label>: } while(<code>);’
with the appropriate conditional code for the jump back to the start.
do {
n_1:
someAction();
n_2:
someOtherAction();
n_3: } while(x != null);
4.3.11
Step 5: Cleaning up
As mentioned before, we didn’t bother much about unnecessary goto-statements in
simple lines, but this will be taken care of during this last step.
Having a linear order on all our lines now, we run through them once. Every line
with a goto-statement is checked. In the most simple case, the goto refers directly
to the next line, and in this case the goto is removed immediately.
But we can also detect some more cases. During the code generation we have
annotated some of our generated lines with a ‘detour’-marker. This means, lines
like the one with the closing curly brace at the end of while-loop contain a reference
to the line the execution of the program will continue at when reaching this line (in
this case this will be the line containing the while-statement). Such detour markers
are followed until a line without such a marker is reached. If this line has the label
referenced by the currently examined goto-statement, it can be eliminated too.
The last case of superfluous gotos is when the last line of code contains a jump
to some node without any outgoing edges (like the exit-node in our examples). Such
a node is always a final program point, which is where we would arrive anyway when
proceeding further. Such goto statements can therefore be eliminated, too.
This concludes the pseudo code generation. We now have a neat list of lines
of code, with labels where needed, appropriate code whenever possible, reasonable
indention levels, and without unnecessary goto-statements. The component used
to display this code will only have to print the lines one by one now, no further
analysis will be involved. For an example of what the code view for our example
program DeleteAll.tvp looks like, please see Figure 4.3.
Figure 4.3: Screenshot of the code view for our example program DeleteAll.tvp.
39
CHAPTER 4. THE CODE VIEW
4.4
Implementation
The code reconstruction takes place in the class alexsa.gui.codeview.CodeView and
the other classes of the alexsa.gui.codeview -package mentioned above. The CodeView class is also the class responsible for actual on-screen painting and will furthermore provide some functions for hightlighting one or more lines of code and for
receiving and interpreting mouse clicks. The use of these funtions will be described
in the following chapters Data view and Visual execution (starting on page 45). The
implementation of these functions is completely straightforward and will therefore
not be discussed here.
40
Chapter 5
Data view
The data view is the component that displays all the shape graphs. Together with
the code view developed in the previous chapter it forms the main part of Alexsa’s
user interface. This chapter is later complemented by Chapter 7 starting on page
59.
As established in our requirements, we will continue to use dot as our graph
layout tool. The layouted graphs are read according to Chapter 3.3 – Reading
shape graphs. Displaying these shape graphs will be the responsibility of the class
alexsa.gui.GraphView. The simple approach for the data view would be to take
all the coordinates provided by dot and treat them as screen coordinates, painting
every edge and node at the exact location given. However, there are a number of
pitfalls in the layout that we need to correct for adequate visualization. The rest of
this chapter will be devoted to describing these pitfalls and their solutions.
5.1
Scaling
The layout tool dot provides its graph layouts in a coordinate system that is well
suited for printing. All coordinates are given as inches from the lower left corner
of some sheet, with a precision of 1/1000th inch. We therefore need to perform
some scaling on all graphs to bring them to a user-friendly size. Fortunately we are
supported in this by Java 2’s Graphics2D-package, which allows to specify affine
transformations to be applied to all graphical operations performed on a component.
Therefore whenever a new shape graph is to be displayed by the data view, we
will calculate a suitable transformation. But what is a suitable transformation in
our case? We have two basic options to choose from:
Scaling with a fixed factor The first option would be to determine a fixed scaling factor once and for all. As dot uses roughly constant space for the nodes1
and their spacing, we would be awarded with a view where the various graphs
are all displayed with equally sized elements, thus easing the orientation for
the user.
But there are drawbacks to this approach, too. Larger graphs may be too
large to fit in the screen space, thus requiring scrolling on the side of the user
for him to see the entire data. Smaller graphs on the other hand may not
1 dot
extends the nodes when the node’s label requires it.
41
CHAPTER 5. DATA VIEW
use all the space available, thus showing the data smaller than needed and
wasting screen space at the same time.
We could try to determine some sort of “well-chosen” scaling factor to use,
based on heuristics and rules of thumb. But there are other aspects we would
miss out. How large is the user’s screen? How big is the program’s window?
The more factors we try to consider, the more we see that we need a more
flexible way to scale the graphs for the screen.
Scaling for available space The solution to scrolling and waste of screen space
is to scale the graphs to fit the space available. Whenever a new graph is to
be displayed, the size of the graph and the size of the window are combined to
determine a scale factor such that the graph uses the maximum space within
the window without clipping off any parts of it.
As the minimum bounding rectangle of the graph may not be of the same
width/height-ratio than the one of the window, we need to take into account
that the graph may either fill the window for its complete width, or height,
or both. The factor f will thus be defined simply as:
f = min
width(window) height(window)
,
width(graph)
height(graph)
This simple calculation also allows for another major advantage: the user can
easily influence the display simply by changing the size of Alexsa’s window.
This is a simple example for user control as suggested by interface design
guidelines like the Macintosh Human Interface Guidelines[at Apple Computers, 1993].
Using affine transformations it is also a simple process to translate the graph’s
coordinates in such a way that the graph is always centered within the data view
component. This makes for a more pleasant view than aligning the graph with some
border of the component.
5.2
Inverting
As we mentioned before, dot lays out the graph in a PostScript-oriented way with
the lower left corner being the origin for the coordinate system. Screen coordinates
on the other hand are always used with the origin at the upper left, with increasing
y-coordinates indicating a lower position on the screen.
The simple solution that appears immediately would be to use our already
present affine transformation again to mirror the graph along the x-axis to compensate for this such that the graphs look alike on screen and paper.
This, however, is not possible in our case. The transformations we can associate
with components apply to every drawing operations made, including text drawing.
Thus, if we incorporated our mirroring into the general transformation, all node
and edge labels would be displayed upside-down, which is obviously not desirable.
Therefore we precompute the flipping by changing all coordinates in the graph
layout to be subtracted from the maximum y-coordinate in the graph.
42
5.3. MISCELLANEOUS FEATURES
5.3
Miscellaneous features
There are some more things that we need to pay attention to when drawing our
graphs. We feel that these features should be listed here for completeness.
5.3.1
Missing arrow heads
The plain graph format used by dot provides detailed layout data for the positioning
of nodes and edges, describing edges as Bezier spline curves which can easily be
modeled by the Java 2 Graphics2D API. However, one thing is missing in the edge
data: The arrow heads.
As the shape graphs are directed graphs, we need to be able to tell the direction
of every edge. But when using the splines described by dot, the edge starts correctly
at the rim of a node, but then ends a little bit apart from the target node, leaving
just enough free space to draw an adequate arrow head. Interestingly enough, the
arrow heads are all drawn correctly when using PostScript as dot’s output format.
When drawing the arrow heads, the start of the head (where the head connects
with the edge) is easily determined by the end of the edge. The head’s point on
the other hand should be at the intersection of the target node’s rim and the line
connecting the edge’s end and the node’s center. For target nodes of rectangular
shape this is a simple process: determine the incoming angle, use the angle to detect
the side the head points at, use the angle again to calculate the exact location of
the intersection point on that side.
For nodes of elliptic shape however this is a little bit more tricky. It happens
that the distance between the edge’s end and the node’s rim is not constant. We
therefore need to determine either an adequate length for the arrow or, even better,
the exact location of the arrow’s head point on the rim.
What we need is a formula that gives us the position of a point on the ellipsis’
rim where a ray starting at the center of the ellipsis at a given angle intersects it.
However, most polar coordinate formulae for ellipsises are described in respect to
the focus points of an ellipsis. But using an augmented formula from Meyers großer
Rechenduden[rec, 1961] we can establish the following formula for the intersection
point p. Let ellipsis e be an axis-aligned ellipsis with the horizontal radius a, vertical
radius h, the center m = (mx , my ) and the angle α between the center—arrow line
and the x-axis:
c=
b2
1−
a2 −b2
a2 cos(α)2
c is the distance from m to p.
p(x, y) = (mx + c cos(α), my + c sin(α))
Having this point p we can now draw the arrows nicely. We choose to use solid
filled heads for solid drawn edge’s (symbolizing a Kleene-value of 1 or true) and
empty heads but with a solid drawn head’s rim for dashed or dotted edges (which
symbolize a Kleene-value of 1/2 or maybe). In the latter case we did not choose to
draw the rim dashed, too, as especially with the low-resolution of a screen this did
not make for a very clear view. Besides, the two kind of arrow heads are already
clearly distinguishable using our way.
Another problem crept up during the determination of the arrow heads. In some
rare cases dot describes a directed edge not from the source node to the target node
43
CHAPTER 5. DATA VIEW
but instead in opposite order. There is the presumption that this may be the case
only when the edge is going upwards in the display, but without knowledge of dot’s
inner workings this remains a presumption. However, to use the right end of the
edge for our arrow head calculation we implemented a check for correct orientation
of the edge, inverting it if necessary.
All calculations about the arrow heads are computed only once when the shape
graphs are read.
5.3.2
Empty graphs
In shape analysis, and thus in TVLA and Alexsa, the situation can arise where at
some program point an empty shape graph can be associated with the point. In
our analysis of heap behaviour of programs this symbolizes the situation where no
heap cells are allocated at all. As variables are only displayed when pointing to
some allocated cell, there are no variables to be seen, either. Therefore the whole
data view would be empty.
To give the user some notification of this special situation, we display a simple
message stating “(Empty graph)” in the data view. This way the user can be sure
that he didn’t end up with some fault in the program, but that this state is actually
intended. This feature could be compared to messages like “This page intentionally
left blank” in some technical manuals.
44
Chapter 6
Automatic visual execution
In the last two chapters we have developed the two main user interface components,
the code view and the data view. Those two together are already a very useful tool
for viewing the results of TVLA. Along with some standard user interface methods,
like selecting single points, the user can easily see all the possible heap configurations
at a specific program point. As the user can see the code and the heap at the same
time, this is already a major improvement over the previous situation, where the
user needed to make his own connections between the awkward TVP format and a
stack of printed shape graphs.
But all this is still just the static display of data. Let us now dynamic elements
to our program, as already defined in Chapter 2.4 on page 11.The automatic visual
execution we are going to develop here will not only allow for verification and
debugging, but also for our master goal of algorithm explanation.
This visual execution will allow Alexsa to be used for guided as well as selfguided teaching. The strategy will present the algorithm in a way that is supposed
to model the way a human teacher would present an algorithm. We will develop in
the this chapter how we can describe such a “natural” explanation.
In Chapter 2 – Requirements specification we have already established a number
of requirements for the visual execution. We want to repeat them here briefly,
commenting on what parts we have already developed so far.
A method to display abstract states An abstract state is the combination of
a program point (the program’s execution being at some line of code) and a
heap configuration, symbolized through a shape graph.
When we select some line in our code view (either manually or automatically
during visual execution), the line will be highlighted and one of the shape
graphs associated with this point will be shown in the data view. We see this
as a very simple and intuitive visualization of an abstract state. No further
textual or graphical elements are needed to hint the linkage between the two
components.
Determination of the successor function In Chapter 3.4 — Trace for legal
steps starting on page 19 we have described our implementation of a trace
function into TVLA and how we transfer it into Alexsa. This trace function
will allow us to determine any number of abstract successor states for any
given abstract state.
45
CHAPTER 6. AUTOMATIC VISUAL EXECUTION
6.1
The form of the trace
The trace function can be seen as a collection of directed, possibly cyclic graphs.
The number of graphs is bounded by the number of initial input structures, that is,
the number of structures in the TVS file. The number of graphs can be less than
the number of structures if a structure isomorphic to another input structure occurs
during the abstract execution in the analysis. All graphs will have a dedicated root
corresponding to one of the input structures.
The edges of the trace graph will be called transitions. The nodes they connect
will be shape graphs. In shape analysis an abstract state and a shape graph are not
the same thing1 , but as two isomorphic shape graphs associated with two different
program points are realized through two distinct objects in TVLA as well as in Alexsa,
we can take shape graphs as well-defined placeholders for abstract states. When
needed, we can always get the program point some shape graph is associated with,
constructing an abstract state on the fly.
There will be three things of particular interest in these graphs: branchings,
cycles, and dead ends.
6.1.1
Branchings
A branching occurs whenever multiple new abstract states can follow from a given
abstract state. Usually the semantics of such a branching are such that multiple
shape graphs can result from the previous one when applying some action. A very
common case is setting a pointer to some node within a summarized node. In such
a case the analysis needs to make a number of branches, one for every possible
successing abstract configuration of the heap. Take the following example, where
the pointer x advances into the tail of a singly linked list:
1:
x
r[n, x]
n
r[n, x]
2 a:
n
2 b:
n
n
x
r[n, x]
x
r[n, x]
n
r[n, x]
n
Figure 6.1: When the pointer x advances via n into the summary node, the summary
node is either decided to have contained only one heap cell (2a) or is split into a
newly materialized heap cell and another summary node (2b).
1A
shape graph together with a program point comprises an abstract state.
46
6.2. NATURAL EXPLANATION
One important general rule should be noted about branchings: They don’t
necessarily occur at the same point where there is a branching in the control flow
graph (like an if-statement). Furthermore, in most cases they will only occur at
points, where there is no branching at all in the CFG. The reason for this is that at
a branching the execution branches depending on the data. But when we know what
the data is, we know exactly where to go next. Instead, branchings in the trace
take place when there are multiple options due to shape analysis’ summarization
techniques, like in the next-pointer example above.
As there is no direct connection between the structure of the CFG and the
structure of the trace graphs, we can not use any results of the analysis made for
the code view, like the detection of while-loops and if-statements.
6.1.2
Cycles
Like in any graph, cycles in the trace are paths in the graph that return to the
same node. Cycles will occur often in our analyses, as they hint for loops which are
common to most non-trivial algorithms.
We will need to detect cycles and handle them in an appropriate way. The
handling of cycles will probably be connected to the handling of branchings, as we
can expect some form of branching to appear within a cycle, as the cycle would
otherwise be a neverending path of execution.
6.1.3
Dead ends
During our execution we may end up at a dead end. This can mean that we
have completed our explanation, or that we only have finished showing one path of
execution, while others remain unexplained. We will need to detect both situations
and act on them appropriately.
6.2
Natural explanation
As established in our requirements, we want to present the program in an “interesting” way, that is, a way that is close to how a human teacher explains a program.2
Therefore we should establish some principles that we expect to be common
in the explanation strategies of most human teachers. We will call an automated
strategy following these principles a natural explanation.
Summarize irrelevant information Often the data an algorithm operates on
can be quite large, but an explanation of the algorithm might not need to pay
respect to the whole amount of data but only to some subset of it. A teacher
will then usually summarize the irrelevant data, either by telling the students
to ignore it or, even better, by choosing a data view that shows the irrelevant
or omitted data in a much summarized way, like with the “...”-dots.
Consecutive explanation When an abstract state as2 follows directly from a
state as1 without any further branching in state as1 , we expect as2 to be
2 We assume that human teachers actually do present programs in a way that is interesting for
the students.
47
CHAPTER 6. AUTOMATIC VISUAL EXECUTION
shown directly after as1 . This requirement roughly says that we are not supposed to “jump around” needlessly in our explanation. This may appear trivial, but we will use this requirement in our next section for the determination
of the general search strategy (Section 6.3.1).
From general cases to special cases Most algorithms spend their main time
with the handling of a few general cases. These general cases form the base
of the algorithm. We expect a majority of teachers to explain the “normal”
behaviour first.
Special cases, like exception handling or even the standard termination of an
algorithm are usually explained later.
Iterate loops Loops are a central element of many algorithms. A very common
technique to explain their effect is to show their behaviour on some iteration,
then repeating the process to show the repetitive pattern at work there until
the principles have become clear.
Exhaustive explanation Even though there may be some execution paths in a
program that are less likely to occur, a good teacher should nonetheless show
all possibilities. This may include a complete rerun from the start of the
program or just some part of it, like when some special case is treated in some
subroutine.
6.3
Explanation strategy
With the principles of natural explanation in mind we will now develop our explanation strategy. The first principle of natural explanation is already implicit in
the summarization strategy of shape analysis. Nodes bearing identical information
(having the same assignments for all core and instumentation predicates) are automatically summarized into summary nodes, leaving nodes of particular interest
automatically untouched and thus in the user’s focus. We therefore don’t need to
bother further about the first principle.
In order to explain the algorithm according to the established principles we will
need a method to linearize the trace graph into a list of abstract states. With this
list at hand, the visual execution can then simply present the program points and
shapes in a well-defined order.
6.3.1
General search strategy
Two general search strategies for directed graphs can immediately be considered
here: breadth-first-search (BFS) and depth-first-search (DFS). Which of the two
strategies is suited better for our purposes?
The emphasis of a BFS lies on the exploration of a graph uniformly from the
distinguished source. Nodes are discovered in the order of their distance from
the root. The BFS exhaustively searches the whole graph, thus fulfilling our last
requirement for natural explanation. Unfortunately, it is much less adequate in
respect to our second principle, the consecutive explanation. With a BFS we can
not guarantee any more that two abstract states as1 and as2 following directly from
one another trivially are shown in appropriate order. Take the example of a simple
branch in the trace graph from Figure 6.2.
The order the BFS will discover the nodes in will be [as0 , as1 , as3 , as2 , as4 ] or
[as0 , as3 , as1 , as4 , as4 ]. In any case, we will jump from one path of execution to
48
6.3. EXPLANATION STRATEGY
as0
as1
as3
as2
as4
Figure 6.2: A simple trace with a branching.
another and back, which is obviously unnecessary and confusing for the user. This
effect is inherent to the basic principles of a BFS, and we will thus not be able to
use this search strategy.
In a depth-first-search on the other hand the emphasis lies on quickly descending
deep into the graph, exploring single paths first before returning and exploring other
paths. In our example against BFS, the DFS will discover the nodes in the order
[as0 , as1 , as2 , as3 , as4 ] or [as0 , as3 , as4 , as1 , as2 ]. This fulfills our second principle
nicely. But what about the other principles? Will we be able to fulfill them with a
DFS, too?
From general to special cases
A program can only contain multiple cases, if it also contains multiple branches.
Without any branchings, there exists only one case, the case of a straight execution
path. We can only detect cases and decide between them when we are at a branching
of some kind. In a normal DFS there is no explicit order defined in which the
different branches are to be visited, but introducing such an order will not harm
a DFS’s general characteristics. We therefore state that we will establish a welldefined order in which we will visit the branches of a node. This order will need to
be defined in a way such that it fulfills our principle sufficiently. The actual order
will be defined later on, but we expect that such an enhancement of DFS is possible
and thus will allow DFS to continue to serve as our general search strategy.
Iterating loops
In a DFS every node is only visited once. Besides matters of efficiency this also guarantees for the overall termination of the search. Does this constitute a contradiction
to our principle? Not necessarily.
In a DFS entering a loop is prohibited by not visiting an already encountered
node again. If the old node was encountered, but we are still in the process of
visiting its children, we call the cycle-closing edge a back edge. This edge will not
be travelled. But what would happen, if we did travel it? As the DFS (along with
our previously introduced order in branches) is deterministic, we will eventually
arrive again at the very same back edge, thus entering an infinite loop.
To allow travelling the loop completely without entering an infinite loop, we
introduce a counter for every edge counting the number of times this edge has
been travelled. Together with some constant maximum number for the number of
49
CHAPTER 6. AUTOMATIC VISUAL EXECUTION
passes, this will allow us to travel the loop a definite number of times before finally
refraining from further iterations.
Even though this modification of DFS changes some of the basic characteristics
of the search, all our desired properties will remain unharmed. As a matter of
fact, only those that we needed to dispense of anyway were changed, namely the
restriction to only visit every node once.
Exhaustive search
Just like the BFS the DFS also provides an exhaustive search of all nodes in a
graph. Whenever the search gets stuck at some point, the algorithm will backtrace
to some previously encountered node that still has untravelled outgoing edges. If
no such node can be found, the search has visited every node and can therefore
terminate. Our modifications introduced above do not harm this principle.
6.4
Implementation
In this section we will describe in an abstract way the implementation of our search
strategy. Namely, our enhancements of a DFS introduced above need to be worked
out more detailed before we can call our strategy to be well-defined.
6.4.1
Precalculated data
The result of our search will be a list of shape graphs3 in an order suitable for the
desired algorithm explanation; we will call such a list an animation. An animation may contain the same shape graph multiple times, and there will be multiple
animations, one for each initial shape graph.
All animations are precalculated when the analyzed program is loaded. This
has the advantage that we can use the animation data for more occasions than
just a normal start-to-end presentation. Having the animation data at hand at all
times will also enable the user to explore the data more freely. For example, by
clicking on a line in the code view he will be presented with some arbitrary shape
graph associated with this line of code in the data view. The user can examine
that particular shape graph or switch over to one of the other shape graphs for
that point. Alexsa will keep track in which animation that particular point/shape
graph combination appears first. If the user wants to proceed to the next point,
the program will be able to perform a legal transition from one abstract state to
the next (or previous). Therefore the user is not limited to see the whole animation
but can also examine certain subcases more closely and more easily.
This intuitive feature would require a high amount of calculation if done onthe-fly, but is a rather simple search if operating on precalculated data.
6.4.2
Iterative implementation of a recursive algorithm
The depth-first-search as defined in [Cormen et al., 1990] has an elegant recursive
implementation. However, we introduced some extensions to the original algorithm
which will require us to use an iterative approach, mainly due to some manipulation
of the stack for handling cycles.
3 More specifically, as we need to store some additional information, the list will contain Steps,
which are basically wrappers for shape graphs holding some extra data.
50
6.4. IMPLEMENTATION
Our search algorithm4 in pseudo code:5
stack.push( initial shape );
list.add( initial shape );
next := getNextShape();
while (next = null) {
list.add(next);
next := getNextShape();
}
As we can see, shape graphs are delivered one by one by the getNextShape()function, which will use an own stack for keeping track of its history. New graphs are
added to our result list. Let us proceed with the definition of the getNextShape()function:
ShapeGraph getNextShape() {
i := stack. size − 1;
Transition t := getStepFrom(stack[i ]);
while ((i ≥ 0) ∧ (t = null)) {
i := i − 1;
t := getStepFrom(stack[i ]);
}
if ( t = null) {
// handle cycles ; see next piece of pseudo code,
// which is to be inserted here
stack.push(t.target );
t .passes := t .passes + 1;
return t.target;
} else
return null;
}
Cycles
As mentioned in the comment above, the getNextShape()-function also performs
some part of the handling of cycles, namely ensuring that some transitions (the
ones within the loop) may be travelled more than once by resetting their passescounters. The following code will be inserted there:
if ( t .type = back edge) {
loop start := stack.indexOf(t.target );
if ( loop start ≥ 0) {
loop end := i ;
// last cycle : don’t reset complete loop
4 The actual code is within the classes alexsa.data.animation.Animation, alexsa.data.animation.Analysis and alexsa.data.animation.Transition.
5 Conventions for pseudo code:
We use actual Java-indices for objects like arrays and stacks. An array with three elements will
have them stored at the indices 0, 1 and 2. In a stack index 0 denotes the element first pushed
onto the stack, while elements with higher indices were added later.
Our pseudo code will be similar to the actual source code; some statements may be omitted if they
are not crucial to the algorithm; for improved readability standard mathematical symbols will be
used instead of their source-code 7-bit-representations.
51
CHAPTER 6. AUTOMATIC VISUAL EXECUTION
if ( t .passes = (maximum number of cycles − 1))
while ((loop end ≥ 0) ∧
(¬ hasValidStepExcept(t, stack[loop end])))
{
loop end := loop end − 1;
}
// Reset passes−counters to zero
for ( j := loop start ; j < loop end; j++)
transitionBetween(stack[j ], stack[ j + 1]). passes := 0;
stack. size := loop start ;
}
}
During the first iterations, we reset the passes-counters of all transitions in this
cycle. Note that the back edge closing the cycle will not be reset to zero, but
instead gets incremented. Validity of edges will depend on their type and number
of traversions.
In the last cycle the strategy changes: we don’t want to execute the loop completely again but instead leave it at some branching within the loop with yet untravelled edges, if such a branching exists. In most cases we will be able to find such
a branching, as otherwise our loop would constitute an infinite loop, a construction
rather uncommon for (correct) algorithms.
To find this branching we traverse the CFG back up the loop to find a node that
has still some valid outgoing edges. The restriction hasValidStepExcept(t...)
ensures that we don’t identify the last node in the cycle as an exit, as the very
edge closing the cycle is (right now) still valid. However, if this last node does have
another outgoing valid edge besides t, we will happily use it.
The algorithm works correctly even if there is no such exit within the cycle. In
such a case no edges will be reset, and the execution will continue at some node
found through backtracking.
Selection of transitions
So far, we have the framework of our iterative algorithm. What’s missing is the
selection of valid steps from a given node. In the original DFS this is a simple
and straightforward process, as simply all outgoing edges of a node are checked in
arbitrary order whether their targets have already been visited, proceeding there if
that is not the case.
Within our search however not only the order of edges visited will be a key
factor but also the dynamic evaluation of legal targets. We therefore define the
function getStepFrom(Node) as follows:
Transition getStepFrom(ShapeGraph g) {
options := new Vector;
if (g.outDegree() > 0) {
for ( i := 0; i < g.outDegree(); i++) {
Transition t := g.getOutEdge(i);
if ( t . valid ())
options.add(t);
}
}
if (options. size = 0)
return null;
52
6.4. IMPLEMENTATION
if (options. size = 1)
return options[0];
In the first part of our selection function we collect all valid transitions leaving the particular node. A transition is valid if it has either not been traversed
( transition .passes == 0), or if it is a back edge and has been traversed less than
the maximum number of cycles specified in the preferences. If we don’t find any
valid edges, we return null, indicating to getNextShape(), that there is no valid
transition from this very shape graph. If we have found exactly one valid transition,
it will be returned.
But if we have multiple valid transitions, we need to make a well-motivated
choice which one to travel next. This is done in the next section:
for ( i := 0; i < options. size ; i++)
options[ i ]. analysis := new Analysis(options[i]);
i := 0;
Transition t := null;
while ((t = null) ∧
( i < Preferences.order.length) ∧
( options. size > 1))
{
criterion := Preferences.order[ i ];
if (someMatchCriteria(criterion, options)) {
if (allMatchCriteria( criterion , options))
t := singleBestTransition ( criterion , options );
else {
removeNonMatchingTransitions(criterion, options);
t := singleBestTransition ( criterion , options );
}
}
i := i + 1;
}
First, we analyze every branch. This analysis is performed by an object of the
class alexsa.data.animation.Analysis. We will see later how this analysis is done.
For now we will only keep in mind that the analysis assigns quantities to a number
of defined features of the kind number of branchings or depth or others of the like.
Next, we enter a loop which will sieve the options until we have either selected
a single transition or until we run out of sieving options. This sieving is done by
comparing the analysis of all options against some criteria. The order in which these
criteria are checked is defined in the preferences and we will discuss a well-motivated
order for them in the next subsection.
In the sieving process we first check whether there are any options at all that
qualify for the current criterion. If no options qualify, we can not make any judgement based on this criterion and will thus continue with the next one. But if there
are qualified options, we can maybe find some ‘best’ option or at least reduce the
number of options. If all options fulfill the criterion, we try to find one option that
fulfills the criterion best in a quantitive way. The quantitive properties regarding
the various criteria have been established by the analysis, too. If there is a single
transition with a best quality, we will be done. In the case where some options fulfill
the criterion and others don’t, we filter out those that don’t fulfill the criterion and
try to identify a best option again.
53
CHAPTER 6. AUTOMATIC VISUAL EXECUTION
This process continues with criteria of lesser and lesser relevance until we either
find a best option or run out of criteria.
if (( t = null) ∧ (options.size() = 1))
t := options [0];
if (( t = null) ∧ (options.size > 1))
t := (Transition)options[random(0, options.size − 1)];
return t;
}
If we have only one option left, we return it. If more than one option is left, we
have no further way to prefer one option over another and simply choose a random
one as a fallback case.
6.4.3
Analyzing branches
In the previous section we have only outlined the analysis of branches very roughly.
We now want to describe how and for what properties we analyze a branch.
The analysis performs a partial DFS on the node in question. Partial, because it
will use the results of a previous classification of edges in order to travel only some
of the edges in this subgraph. Also, the analysis of a node is dynamic in the sense
that the result of the analysis will depend on the current state of the animation, as
it will only travel edges that are valid at the time of the analysis. Validity of edges
has been defined in the previous section.
The analysis will count the occurences of several phenomena encountered during
its search. These phenomena will be:
• Tree edges
• Cross edges
• Forward edges
• Branchings
• Internal cycles
• External cycles
The first three are obvious: they describe three of the four types of edges that
can be found in a graph traversed by a DFS. Branchings are simple, too: this will
simply be the number of nodes encountered that have more than one successor. The
last two are refined representations for the number of back edges in the subgraph.
The distinction between an internal and an external cycle will be whether the target
of the back edge is within (internal) or outside of the subgraph (external). When
we motivate our preferences for the different criteria this will come in handy.
The analysis is performed recursively by the method Analysis.analyze:
void analyze(Node s) {
count := s.outDegree;
if (count > 1)
branches := branches + 1;
for ( i := 0; i < count; i++) {
Transition t := s .getOutEdge(i);
if ( t . valid ) {
54
6.5. PREFERENCES FOR CRITERIA
}
}
}
switch (t.type) {
case cross edge:
cross edges++;
case forward edge:
forward edges++;
case tree edge:
tree edges++;
analyze(t. target );
case back edge:
if ( internal (t))
internal cycles ++;
else
external cycles ++;
}
As we can see, the only edges we actually follow are tree edges. This way we
make sure that we do not attribute qualities to this node that are not inherent to
this node but rather some other nodes in completely different parts of the trace
graph. Also, as defined above, we will only follow valid edges, which is ensured by
the check if ( t . valid ).
6.5
Preferences for criteria
The algorithm for selecting branches and the analysis of branches are the tools, but
we need some well-motivated constraints to bring them to life in a way such that
these methods actually select branches for visual execution in a way that complies
with our principles of natural explanation introduced at the start of this chapter.
With our algorithm we have already sketched the general behaviour of the selection: when encountering a branching, the two branches are analyzed for a number of
qualities, which are then compared in some predefined order of relevance. All that
remains to do therefore is to establish this order. This is done in the preferences.6
In our principles of natural explanation we defined one principle to be “From
general cases to special cases”. Our preferences will be set such that they model
this principle.
In most non-trivial algorithms loops play a central role, as they allow the processing of arbitrary sized data, and this is especially true for algorithms analyzed
by shape analysis, as we can expect arbitrarily sized data structures when dealing
with dynamic data structures. As loops are so important, we can expect loops to
constitute some form of “standard behaviour” in the execution of the algorithm.
Therefore we will want to prefer the visual execution of loops to other constructions.
This forms our preference of cyles before other constructs shown in Figure 6.3.
In the analysis we made a distinction between internal and external loops. This
makes perfect sense when we imagine, in which situations we are faced with internal
or external loops. Having an external loop means that we are at some point within
a loop, while an internal loop hints for a loop yet to come. It appears that once we
6 The user may elect to change these preferences in order to experiment with different behaviours.
55
CHAPTER 6. AUTOMATIC VISUAL EXECUTION
cycles > other constructs
n_1
1
2
n_2
6
8
n_3
12
10
n_4
19
17
21
n_5
23
25
27
exit
29
35
Figure 6.3: The trace graph for DeleteAll.tvp. Note the cycle between 23 and 1
compared to the straight line of execution from 17 to 35.
have entered a loop, we should continue showing it before we turn to other loops.
Therefore we establish the preference:
external cycles > internal cycles
1
2
3
Figure 6.4: When at point 1, we prefer to continue with the external cycle at 2
instead of the internal cycle starting at 3.
We have now distinguished cycles from other constructions in the program’s
trace. To refine our preferences we will now make further distinctions for these other
constructions. When having the choice of either entering a branch that contains
further branches versus one that contains only a straight line of execution, we will
prefer to travel the branched subgraph first. This way we will present the user
the more complex part first, before entering a possibly trivial case. Imagine for
example an algorithm that starts with a simple check for special cases. Usually
these special cases are then treated by simple, straightforward, subroutines. But
when explaining an algorithm the focus is not the special case but instead the
general, expected behaviour. Therefore our next preference will be:
56
6.5. PREFERENCES FOR CRITERIA
branched subgraphs > straight lines of execution
1
2
3
Figure 6.5: The subgraph under 2 is obviously more complex and interesting than
the one under 3.
When both subgraphs do not contain branchings, we will compare their depth.
Deeper subgraphs again hint for more complexity and are thus considered to be
more interesting. Our next preference will be:
deep graphs > shallow graphs
1
2
3
Figure 6.6: The subgraph under 2 is deeper than the one under 3.
When both subgraphs have the same depth, we take a look at the kind of edges
encountered within the subgraphs. As back edges and tree edges have already been
used to model cycles and depth, we can only use forward edges and cross edges to
make further distinctions here. What should our preference be here?
We try to imagine under which circumstances the two kinds of edges can occur.
A forward edge will often occur when conditional statements are modeled, as in
this case the execution will often merge at some node, with one of the incoming
edges necessarily being classified as a forward edge. Cross edges on the other hand
will only occur rarely when some form of actual goto-statement is modeled, which
is not very common for most algorithm. We prefer to show the “cleaner” condi57
CHAPTER 6. AUTOMATIC VISUAL EXECUTION
tional statement before showing some unpredictable goto. Our last preference will
therefore be:
forward edges > cross edges
1
c
2
t
3
f
4
Figure 6.7: Assuming that the tree edge t leaving 1 has already been travelled, we
will prefer the forward edge f to the cross edge c.
Having in mind our implementation of the selection algorithm, we can combine
all these preferences into a total order of the analyzed qualities of shape graphs.
We define the qualities to be evaluated in this order:
1. External cycles
2. Internal cycles
3. Branchings
4. Number of tree edges (depth)
5. Forward edges
6. Cross edges
In case the reader wonders whether some of the described cases actually occur or
if in those cases a quality of higher preference might have broken the tie, he should
remember that qualities of lower preference are evaluated also if higher qualities
exist but are equal among multiple branches.
6.6
Remarks on visual execution
This concludes our chapter on visual execution. We have successfully motivated
and defined a strategy for exhaustively showing all possible paths in the visual
execution of a program. The strategy found complies with our self-set goals on
natural explanation. Our approach for selecting paths in the visual execution models
some of the characteristics of human teachers, while allowing to be modified easily
in case the strategy is applied to some other field of application where a different
behaviour may be useful.
58
Chapter 7
Inbetweening graphs
In Chapter 2.5 – Inbetweening graphs we discussed that the user will need some
support from us to follow the exchange of two shape graphs.
Instead of an abrupt switch from one graph to the next we will perform some
inbetweening. This means that we will construct a number of intermediate graphs
that form a smooth transition between the graphs. The term ‘inbetweening’ originated from the animated movie industry. During the production of an animation a
number of key frames are drawn which depict the general movement of objects and
individuals in the movie. These key frames are then inbetweened by a number of
filling pictures drawn by specialized animators called inbetweeners. Inbetweening in
general is commonly used in many areas of computer generated images (CGI), and
more complex variants have become popular under the term of morphing.
n
x
r[n, x]
n
r[n, x]
n
Figure 7.1: Variable x points to a new heap cell.
7.1
Can foresighted graphlayout help?
Before we develop our own approach we should take a look at another option that
could be applicable. Stefan Diehl, Andreas Görg and Andreas Kerren have developed foresighted graphlayout[Diehl et al., 2000, 2001], a meta-layout algorithm for
graph animations. Given a number of graphs that are supposed to be animated,
foresighted graphlayout uses its a-priori knowledge to create a meta-graph containing all nodes and edges of all the single graphs together, then calling an arbitrary
static graph layout algorithm to compute the layout of the meta-graph. The animations between the graphs can then easily be performed by simply adding or removing
59
CHAPTER 7. INBETWEENING GRAPHS
nodes and edges at their fixed positions in the meta-graph. This approach is excellent in preserving the mental map[Misue et al., 1994] as nodes don’t change their
position, which is a key problem in graph animation.
Unfortunately, some problems remain that hinder us from using foresighted
graphlayout in Alexsa. The first is the introduction of a new layer between TVLA and
its graph layouter dot. If we want to use foresighted graphlayout, we would need to
seperate the two and create a new application. This new application would read the
dot-input, perform foresighted layout, write appropriate dot-input along with some
supplemental data for later animation and then quit to call dot. Afterwards Alexsa
would read the meta-graph and the supplemental data to perform its animations.
This would make the use of Alexsa more complicated and would alter our general
policy to change TVLA as little as possible. Alternatively we could merge the new
application with Alexsa and add a static graph layout component within Alexsa.
Even though this makes some sense (see Chapter 9 – Conclusion for reasons for
this), we found it to be beyond the scope of this work to implement another graph
layout algorithm.
There is a second problem that keeps us from using foresighted graphlayout.
In our visual execution we show cyclic patterns. But when we analyze the shown
shape graphs in some typical situation we find that the very same shape graph
carries different meanings depending on the iteration the presentation is at. See
Figure 7.2 for an example.
n_1, n_2:
n_3:
x
n_4:
elem
x
r[n, elem]
r[n, x]
r[n, x]
n
r[n, x]
elem
n
n
r[n, elem]
r[n, x]
n
x
r[n, elem]
n
r[n, elem]
r[n, x]
n
n_5:
n_1:
r[n, elem]
r[n, x]
elem
x
x
r[n, elem]
r[n, x]
r[n, x]
n
n
r[n, x]
n
n
n
r[n, x]
Figure 7.2: A full cycle in DeleteAll. Note that the bold drawn heap cell is not
pointed to by x after one cycle.
After one whole cycle we see the very same shape graph like when we started,
and incidentally it not only looks the same but actually represents the very same
60
7.2. PREREQUISITES
data structure. With foresighted layout and its approach to preserving the mental
map, the user would be lulled in the belief that the node pointed to by x actually
is the same node by fixing its position and retracting the nodes formerly pointing
to some successor node to it. If we view the shape graphs only as the completely
abstract representations of a program’s state, this wouldn’t be a problem, as in fact
after one full cycle the abstract state is exactly the same.
The problem is that the user may not see the shape graph as a purely abstract
representation, but instead he or she will very likely combine the abstract view with
own concrete interpretations. In the example above, the user will not only see the
state “singly linked list pointed to by x”, but will also have in mind that the node
pointed to by x is one further down in the list than one cycle pass before, even
though this information is not contained in the abstract representation. We can say
that the user can be expected to construct an own concrete instance of the state
from the sequence of given abstract states.
We should be careful not to destroy this implicitly added concrete information
on the side of the user by giving him or her the impression that the state after one
cycle has not changed at all. But with foresighted layout this case is very likely, as
we can expect the global layout to fix the various nodes on their positions. This
conveys the dynamic change in the data structure.
We will therefore refrain from using foresighted layout and use traditional inbetweening instead. In our example above, the inbetweening will create an animation
that supports the user in noticing the progress x makes in the list.
7.2
Prerequisites
When we want to animate the switch from one graph to the next we need more
detailed information which nodes in the source graph correspond to which nodes in
the target graph. This is easy for those nodes that represent variables: As there is
at most one node labeled with the name of some variable, we can easily construct
our own relation between the set of source variables and the set of target variables.
For heap cells the relation is more complicated. In their standard form heap
cells can only be identified by their label (and possibly by their in- and outgoing
edges), which is not a unique identification as the labels only denote properties of
nodes and are therefore not unique.
Fortunately, TVLA offers a solution for most cases. When called with the -significant flag, meaningful names will be assigned to all (heap-)nodes. These names
are carried across the layout algorithm without change.1 The names are constructed
in the following way:
• The names of nodes in the initial shape graphs are taken from their specification in the TVS file.
• When a source node sn corresponds directly to a target node tn, they will
have the same name.
• Two nodes sn1 and sn2 can be merged into a summary node tn. In such
a case the name of tn will be [sn1 .name, sn2 .name]. See Figure 7.3 for an
example.
1 Please note that a node’s name and its label are two distinct properties of a node. The name
is not part of the graph’s display.
61
CHAPTER 7. INBETWEENING GRAPHS
• In the opposite case, a summary node sn can be split into two nodes tn1 and
tn2 . In such a case tn1 and tn2 will bear the names sn.name.0 and sn.name.1,
respectively. See Figure 7.4 for an example.
a
[a,b]
b
Figure 7.3: Two nodes are merged into one.
a
a.0
a.1
Figure 7.4: A node is split into two.
Using this naming scheme we will be able to track graph elements between
shape graphs, a key requirement for our proposed inbetweening. And since this
information is necessary for our animation, we have included the -significantflag in our already modified TVLA-script as described in Appendix C.2.1.
7.3
Implementation
The actual inbetweening is done by the class alexsa.gui.GraphView, with some support from all the classes in the alexsa.data.morphing-package. Two graphs are inbetweened whenever there exists a transition between them according to the trace
(see Chapter 3.4 – Trace for legal steps). We cannot perform inbetweening when
there isn’t a transition, which can be the case either when we complete a cycle
62
7.4. INBETWEENING STEPS
(redundancy in the trace) or when we made a jump in the visual execution due to
our search strategy. In all other cases an inbetweening will be performed.
7.3.1
Analysis of the transition
To perform an inbetweening between two graphs sg and tg we first2 create an
instance of the class alexsa.data.morphing.Morphing on the transition between the
two graphs, which will perform an analysis and create a number of lists for the
different possible phenomena, namely:
Removal: The node sn is part of sg, but does not appear in any form in tg, neither
merged nor split (see next two cases).
Mergings: The two nodes sn1 and sn2 from sg are merged to form the node tn in
tg; tn is necessarily a summary node.
Splitting: The summary node sn from sg is split into the two nodes tn1 and tn2
in tg. Of the target nodes both, one, or none may be summary nodes.
Moving: The node sn reappears in tg, but at a different position.
Creation: The node tn from tg was not present in sg, nor is it the result of a split
or merge.
Renaming/Resizing: The node sn changes its label and/or size when appearing
in tg.
Merging, splitting, and renaming can happen to heap nodes only, while removal,
creation, and moving can apply to variables, too. We will call any of these possible
phenomena a modification. To perform the analysis, for every node in sg a number
of checks are performed. If sn appears in tg, the target node tn is checked for a
change in label, size or position with respect to sn. If sn does not appear, we check
for two nodes named with the name of sn plus the suffixes ‘.0’ and ‘.1’, respectively.
If such two nodes can be found, we habe identified a split. Otherwise, we check for a
node in tg labeled [sn.name, sn2 .name] or [sn1 .name, sn.name]. If such a node can
be found, we have found a merge; the other source node can be marked as having
been processed.
All nodes that could not be linked to nodes in tg in this search will be removed
during the inbetweening. All nodes in tg not linked to any nodes in sg will be
introduced during the inbetweening.
7.4
Inbetweening steps
The process of transforming one graph into another will be split into a number of
steps, most of them corresponding to some single modification.
2 Actually, the first step will be to create a copy of sg called sg . During the inbetweening we
will make many manipulations on the coordinates in sg, and as we might need sg again later in
its unchanged form, we will work on a copy which we can dispose of afterwards. For convenience
in notation, whenever sg is referenced here, we will actually mean the copy sg without explicitly
stating so.
63
CHAPTER 7. INBETWEENING GRAPHS
7.4.1
Zooming
Depending on the changes between sg and tg, the two graphs may be of different size
(in terms of the dimensions of their layouts). In our data view we have established
the policy that all graphs are supposed to fill the given space optimally. Thus, two
graphs of different size will have a different scaling factor. In this case we need to
adjust the scaling factor at some point in the inbetweening. The right time to do
this depends on the relation of the sizes of the two graphs.
If tg is larger then sg, our modifications will at some point put parts of tg outside
the viewable area. To avoid this, we will adjust the scaling factor prior to any further
modifications. In a pre-defined number of steps sg’s scaling factor is changed into
the scaling factor of tg. Thanks to Java2’s Graphics2D this is a simple process, as
all we need to do is to set a new affine transformation for our data view and initiate
a redraw. From the user’s point of view this scaling factor adjustment looks like
we are zooming out of the graph. At the same time the translation coordinates are
adjusted gradually to adjust them to those of tg. This may result in a data view
of sg that is not centered within the component any more, but this is not only just
a temporary problem, but also allows all further operations to already work on the
screen coordinates designated for tg.
If tg is smaller than sg on the other hand, zooming prior to the other modifications makes no sense. Because sg already fills the data view component optimally,
any zooming for a smaller graph’s scaling factor would mean zooming into the
graph, thus automatically clipping off parts of it. Therefore the zooming in this
case will take place after all other steps.
7.4.2
Execution order
In the transition from one abstract state to another one in shape analysis all alterations of the shape graphs happen instantaneously – no effect happens before or
after some other effect. We are therefore not bound to any specific order in which
to model the different occuring phenomena.
On the other hand we don’t want to let everything happen at once either. The
modifications each carry different semantic meanings, and separating the events
visualizing them will help the user to spot the changes and their semantics easily.
We should therefore think about a well-motivated and well-defined order for the
application of the different cases. Let’s make a few observations on some relations
between the modifications and their practical implications before we combine these
observations to establish the order.
Three of our modifications involve movement of nodes explicitly or implicitly.3
Chances are good that in some cases the target area of a movement was previously
occupied by some other node. Therefore we should try to make as much room for
all the movements before executing them. The removal of nodes and a merge of
nodes frees space, while a split occupies new space and a general movement, though
neutral in total space requirements, might require previously used space. Given
this, we find the following order of modifications well-motivated:
1. Removal of nodes
2. Merging nodes
3 In
a split, the two new target nodes move to different locations, in a merge the two source
nodes are correspondingly moved onto each other.
64
7.4. INBETWEENING STEPS
3. General movements of single nodes
4. Splitting nodes
5. Introduction of new nodes
This order is completely motivated by the effort to reduce possible space conflicts between nodes. One modification remains with unspecified timing: The label
changes and resizing of nodes. It can be observed that these two changes have a
close relation: dot will only change a node’s size if it needs more (or less) space
to accomodate a changed label. But when should we change the labels? Let us
take a look at the semantics here: The labels describe properties of the nodes in
terms of their fulfillment of certain core- and instrumentation-predicates. These
properties are determined by the structure of the shape graph: A node will carry
the property of being reachable from the variable x by the transitive application of
the next-pointer if and only if the shape graph resembles exactly this constellation.
In other words, the labels are a result of the structure, showing the effects of the
modifications, and not being the source of the modifications. This suggests to apply
all relabeling at the very end of the inbetweening, as step number six.
Three more considerations support this solution. First, if we changed the labels
prior to any other modifications, the user would see no motivation for the change in
the labels. Second, if we changed the labels during the other modifications, we would
make it harder for the user to follow the various nodes through the animation. And
finally, even though we have six different possible modifications in our inbetweening,
they present themselves to the user as two larger phases: First, the structure of the
shape graph is altered, then the labels reflect the changes made.
Let us now briefly describe the different modifications in the order they are
applied.
7.4.3
Deleting
The removal of nodes can happen for a number of reasons; the most common cases
in correct programs are a) the freeing of a data structure (in which case the corresponding heap cell node in the shape graph would disappear), and b) the nullifying
of variables, where the null-pointing variable will not be displayed anymore and
therefore vanishes, too.
The straightforward visualization of the removal of an object is turning it gradually invisible, the object vanishes “into thin air”. With our data view this simply
means to change the object’s color in a predefined number of steps from its current
color to the background color (which is white). Along with the removed node, all inand outgoing edges are removed, too. To avoid the tedious treatment of a number
of special cases in following steps, the node and all connected edges are deleted fully
from the graph.4
7.4.4
Moving
In the form used by us moving only means the general case where a node is moved,
but neither merged nor split. Therefore moving does not carry any semantics but
instead is only applied for aesthetic layout reasons (as understood by the layout
algorithm).
4 Another
point where it pays off that we made a copy of the original graph.
65
CHAPTER 7. INBETWEENING GRAPHS
When we move a node, we also want to move all attached edges with it. At this
point we introduce a simplification for efficiency reasons. In the graphs as layouted
by dot we find two kinds of edges: Self-loops that are realized through the use of
Bezier splines and (almost) straight lines for connecting distinct nodes. Probably
for matters of generality dot uses Bezier splines for the straight lines, too. The
resulting lines are almost (but not exactly) like straight lines connecting two nodes
on a direct path between the two node’s centers, starting at the node’s rims. The
graphical difference between a straight line according to dot and a ‘real’ straight
line is minimal.
Because straight lines can be drawn much more efficiently than Bezier splines,
and beause we may have to draw a lot of lines a lot of times when we move nodes,
we choose to use straight lines during the movement of nodes. To do so, our first
step will be to erase (paint white) all edges connected to all moving nodes. Then
we redraw them using the simple straight lines.
Then the actual moving takes place. As we know the source and target position
from the source and target graph, respectively, we can easily compute a predefined
number of intermediate positions. All moving nodes will be moved at the same time.
When the nodes have reached their target positions, again all edges are erased one
last time and then repainted using the final Bezier spline curves from tg. All this
erasing and redrawing will not be perceived by the user because it is done in an
offscreen-buffer; the user will only see the movement animation in a number of
predefined steps.
7.4.5
Merging and splitting
Merging is one of the two more complicated animation operations, as it affects more
than one node at the same time. While during moving we could simply move along
all edges, we now have to watch out for some special cases. Lets take a look at the
possible cases (Figure 7.5):
a
b
a
i
o
c
c
d
p
k
e
i
f
g
h
e
m
q
j
k
l
m
n
Figure 7.5: All possible cases for edges during a merge.
We will need to pay special attention to those edges that connect the two merged
nodes with each other. These edges (f and g in Figure 7.5) will need to be removed
during the merge.
The merging is done in a number of phases:
66
7.4. INBETWEENING STEPS
• To make the merging as simple as possible, we first remove all edges that do
not exist after the merging anymore (b, d, h, j, l, and n). This way, the user
will have to follow as little objects as possible during the animation. Removal
of edges is similar to the removal of nodes (see above).
• Like with the simple moving, we will use simple straight edges. Therefore
we again start with erasing all complex Bezier splines and replace them with
straight lines.
• The two nodes are moved onto each other at the location of their common
successor in the target graph. In every movement step we check, whether they
already overlap; as soon as overlapping happens, all internal edges (f and g)
are not drawn anymore.
• When movement is complete, we exchange the straight lines for Bezier splines
again.
• Edges that are newly attached to the merged node (o, p, and q) are introduced
similar to the creation of nodes (see below).
Splitting a node into two new nodes is very similar to merging, but of course
in reversed order. The single steps in the splitting process are almost identical to
those in merging, but here the (newly created) internal edges among the two nodes
are drawn as soon as the two nodes do not overlap any more. See Figure 7.6 for all
cases that can occur during a split.
a
b
c
a
m
d
f
d
n
e
g
h
i
g
b
o
p
q
r
e
s
h
t
Figure 7.6: All possible cases for edges during a split.
7.4.6
Creation
The creation of nodes is similar to the removal of nodes. It can occur whenever new
data structures are allocated or when a previously null-pointing (and thus invisible)
variable gets set to point to some data structure.
Analogous to the removal, the creation of variables is visualized by the stepby-step introduction of the nodes and all its attached edges from invisibility to
full visibility. The technique is again the gradual change of painting color from
background color to the object’s intended color.
67
CHAPTER 7. INBETWEENING GRAPHS
7.4.7
Renaming/Resizing
The last step in the inbetweening is the adjustment of labels and node sizes. In this
step all nodes and edges remain at their positions, which makes this step very easy
for the user to follow. Lets examine the two handled phenomena.
The relabeling of nodes does not offer a simple and intuitive approach for inbetweening as an alternative to simply exchanging one label for another. No special
mutli-step process needs to be introduced to facilitate the visualization.
Resizing a node is a simple graphical operation. Because the node will stay
in place during resizal, the user can not get confused about this as the mental
map remains fixed. Our whole motivation for inbetweening was the avoidance of
confusion, not the animation of objects just for the sake of it. This leads to the
conclusion that an extra animation in which the nodes gradually grow or shrink
would be unnecessary. The reader is reminded that the whole inbetweening is just
the visualization of one step in the (possibly very long) visual execution. Therefore
we are well advised to avoid unnecessary animations.
Following these two arguments we can see that renaming and resizing both don’t
need dedicated animations. In our implementation this is reflected by concluding
the whole inbetweening by simply redrawing the whole graph in its final layout as
provided by the layout of tg, only followed in some cases by zooming in for the new,
smaller size of tg compared to sg.
7.5
Customizing the animation
In our algorithm developed so far we find a number of operations that involve
an animation in a number of steps. This opens two new general questions: How
many steps should be used to perform the animation, and how fast should they be
displayed? These are questions that can only be judged by general rules of thumb –
there are no “correct” answers, just guesses that seem to work in field application.
In the implementation, every part that involves an animation is build in the
same way:
for ( i := 0; i < MAX LOOP COUNTER; i++) {
time := systemTime(); // in milliseconds
some animation operation(i);
while (systemTime() < time + TIMING CONST) ;
}
The result is that each loop will show a defined number of animation steps, each
step running no faster than some timing constant. We expect the animation to be
run on a computer that will in general be able to execute the animation operation
in a time shorter than the timing constant. This way, the whole animation will
always execute in a constant time. If the computer is faster, the animation will not
speed up to a level too fast for viewing, and if the computer is slower, no animation
steps will be omitted.
There are six basic distinct operations: zooming, deleting, creating, moving,
merging, and splitting. All operations can get different values for the number of
steps and their timing. Alexsa has some default values for each of these settings.
Without giving details on the actual values we want to describe briefly some of the
ideas behind the default values. Zooming has only a few steps with a relatively long
timing. This was done with respect to slower computers. Each zoom step requires
68
7.5. CUSTOMIZING THE ANIMATION
a complete redraw of the whole shape graph, which can be critical on older systems.
Removing and creating have the same parameters, and their timing is very short.
The process of fading an object in or out is a simple visual effect that can also be
drawn quickly. It is easy for the user to follow an in-place fading of some object.
Moving, merging and splitting on the other hand have longer timings. This was
done mainly because it is more difficult to follow moving objects than to realize
a change on a stationery object. The reader is reminded of side effects in node
movement: Associated edges may change their positions and thus often their angles
towards various nodes, making for a more complex effect than fading.
All paramters are defined centrally in the preferences. They can be changed in
the preferences dialogs as described in Chapter 8.3 on page 72. For convenience
another variable is introduced there: A master variable for timing. This master
variable is a general “speed throttle” and resembles a factor by which all single
timings are multiplied. Using this single variable, all animation steps can be sped
up or slowed down easily. A higher value slows down, a lower value speeds up.
Possible values are positive integers. Zero is a possible value possible, but should
only be used if all animations are supposed to run at maximum system-dependant
speed (which in general is not advisable).
69
CHAPTER 7. INBETWEENING GRAPHS
70
Chapter 8
Miscellaneous
In this chapter we want to discuss a number of smaller features in Alexsa that
didn’t fit into any of the other chapters. We will talk about debugging tools, export
functions, and user preferences.
8.1
Debugging tools
Working with TVP and TVS files can sometimes be cumbersome. We therefore
add some functionality to Alexsa that is supposed to enable the user to get a better
overview over the input files he is working with.
8.1.1
Plausability checks
When parsing the various input files, Alexsa can sometimes detect errors in these
files. While some of them may already have been reported by TVLA (like syntax
errors in TVP or TVS files), other, semantic, errors go undetected. Here is a list of
the problems that can be detected:
Isolated nodes The CFG defined in the TVP file is supposed to define a connected
graph. If a node has no incoming or outgoing edges, it is isolated and thus
either not a part of the main CFG1 , or it represents a trivial TVP program.
This is an error and will be reported as such.
Unconnected control flow subgraphs A subset of the nodes used in the CFG
may comprise a subgraph not connected to the main CFG. This situation is
very similar to isolated nodes (which are just a special case of unconnected
control flow subgraphs) and will again be reported as an error. It should be
noted that this error is triggered by the fact that some nodes in the CFG
can not be reached from the start node. Therefore this error is also found if
there are only edges between the faulty subgraph and the main part pointing
towards the main part.2
Multiple final nodes TVP programs often use some program point labeled exit
or something similar to represent the end of the program. The use of multiple
1 The
main CFG is the part of the control flow graph that includes the start node.
a matter of fact, the version of our example program DeleteAll contained such an error in
its version from June 2000.
2 As
71
CHAPTER 8. MISCELLANEOUS
of these nodes is possible and valid, but as there is usually no practical need
to do so, an occurence of more than one final node may hint for an error.
Therefore a non-critical warning is issued.
8.1.2
Definition inspection
Writing multiple TVP files can quickly become repetitive work, as many programs
share commonly used commands. To help the user, TVLA and Alexsa allow file import through C’s #include directives. But although this helps a lot for minimizing
writing work, it opens up some new problems when it comes to debugging the TVP
files. Finding the very file some possibly faulty action is described in is sometimes
hard, as imported files can again import other files, even from other directories.
To help this, Alexsa allows to view a number of declarations from the currently
loaded files and all their imported files in a comfortable way. Using menu commands,
the user can see all sets, core and instrumentation predicates, and consistency rules,
respectively. Every such command opens a window displaying all of the desired
definitions.
As there can be a lot of actions, displaying all of them might be too much to
display them on a single screen. Also, finding a particular action could be difficult.
Therefore, viewing actions is a two step process. First, we present a menu to the
user that lists all available actions. When he selects one of them, the complete
definition of that action is shown.
8.2
Additional tools
Alexsa can export two kinds of data (both in the File-Export-menu):
• The code view
Users may find it useful to save the code view as generated by Alexsa to use
it in conjunction with other tools, or just for documentation purposes.
When exporting the code view the user can specify the name of an arbitrary
file. That file will then receive all the text as displayed in the codeview. For
improved usability the user can also experiment with the indention string (see
the next section to find out how). While for screen display a block of spaces
is usually fine, the user may want to use tab-characters instead if he wants to
print the code view later.
• The visual execution
Even though Alexsa includes the automatic animation of a program according
to the principles of natural explanation described in Chapter 6 – Automatic
visual execution, it might be desirable to use the linearized order of shape
graphs together with other animation tools. For such cases the animation can
be exported, too. The target file will receive a list of the shape graph IDs.
8.3
Preferences
Alexsa can be configured at runtime by a number of options. All options are available through the use of two preference dialogs which can be found in the Options
menu.
72
8.3. PREFERENCES
8.3.1
Animation preferences
The program animation can be modified in a number of ways that can be roughly
broken down into two main groups: Options pertaining to the order shape graphs
are shown in the visual execution, and options that control the timing of the inbetweening. Both groups of options are found in the dialog Animation preferences
(Figure 8.1).
Figure 8.1: The dialog for the animation preferences.
In the upper half the user can specify, how many iterations are to be performed
for every cycle detected; the default value is 3 iterations. The second part of the
visual execution preferences is the priority in which the various phenomena are
handled. A well-defined default priority is described in Chapter 6.5 – Preferences for
criteria on page 55. The user is encouraged to experiment with different priorities
to see their effect on the order of execution in the visual execution.
In the lower half the inbetweening can be controlled by a number of parameters.
For the different actions performed in the inbetweening, the number of steps to show
can be specified, as well as the delay in milliseconds before the next step. To allow
for an easy change in the overall speed of the animation, a master speed factor can
be used as well. All single delay times will be multiplied by the master speed factor.
Therefore a smaller value for the MSF will result in a faster animation.
8.3.2
Miscellaneous preferences
The second configuration dialog contains options for the code view and an option
for the system behaviour when opening files. See Figure 8.2.
Indention In the code view the structure of a program is visualized (among other
methods) by the indention of enclosed blocks of code, like the body of a whileloop or the if-branch of a conditional statement. The default is to indent
every block by the horizontal space of four whitespaces. But some users may
want to use a different magintude of indention, like two or eight spaces.3 For
3 Many
programming editors contain options for this to reflect such desires.
73
CHAPTER 8. MISCELLANEOUS
Figure 8.2: Preferences for the code view and other program settings.
maximum flexibility we allow for an arbitrary string to be specified for one
level of indention. This enables even more exotic indentions like a series of
dots (....) or a simplified arrow (–>).
There is another good reason to change the indention string: While a predefined number of spaces will be fine for screen display, the user may wish to
use the generated code view in other programs or include it in some printed
documented. In such cases, an indention using tab-characters will often be
useful. Tab-characters can be entered in the options dialog by writing \t.
Summarize ”unknown” branches As mentioned in Chapter 5 – on page 32,
we offer the option to not only treat statements modeling an exclusive-or as
candidates for conditional statements, but also pairs of “empty” statements, as
they are often used to model conditional statements that cannot be expressed
in TVP. This behaviour has shown good results in practical appliance, but
can be turned off for strict correctness.
Startup path When the user wants to open a new file, Alexsa will present him
the directory specified as startup path. Relative pathnames are possible.
8.3.3
Saving preferences
When a user wants to experiment with different settings for the various options in
the dialogs described above, it might be undesirable to use the changed values as
new permanent default values, as it might be hard to remember what the original
values were. Therefore changed values are discarded when Alexsa is quit. If the user
wants some new settings to become permanent default values, he or she can achieve
this by selecting Save preferences from the Options-menu. This way Alexsa will
write all preferences to the file named Alexsa.prefs. When Alexsa is launched, it
reads this file to restore all values.
The file Alexa.prefs is a text file containing a set of variable-value pairs. The
file can be viewed and edited with any text editor, and its format is documented
within the file itself. Even though all options are available through the option
dialogs, some users may find it useful to be able to manipulate the preferences
through direct editing of the preferences file.
To restore the initial default preferences, the file Alexsa.prefs can be deleted or
moved to a different location. When Alexsa starts the next time, it will initialize the
variables with hard-wired default values. The user can then select Save preferences
again to create a fresh Alexsa.prefs with the original default values.
74
Chapter 9
Conclusion
We have successfully motivated and developed the tool Alexsa for the visualization
of shape analysis results.
Figure 9.1: A screenshot of Alexsa, showing an abstract state of an analyzed program.
Our program cooperates with the existing shape analysis generator implementation TVLA, modifying it only slightly where needed. Future versions of TVLA will
include our enhancements.
The code view developed by us improves the readability of the analyzed program
significantly through a number of modifications, namely the use of title expressions
instead of action names, the detection and display of control structures, and the
elimination of unnecessary goto-statements.
The data view allows to conveniently browse through all abstract states. No
external PostScript viewer or printer is necessary. All shape graphs can easily be
75
CHAPTER 9. CONCLUSION
associated with the program points they belong to. When changing from one shape
graph to another one1 , a smooth inbetweening is performed to help the user in
tracing the various elements of the shape graphs as they are transformed. The
timing for these animations can be influenced by the user’s preferences.
Alexsa implements a well-motivated strategy for the visual execution of programs. The strategy, which we named natural explanation, models many aspects of
the way human teachers explain programs. A carefully chosen default behaviour for
the strategy is defined, but still the user has the option to experiment with modified
preferences.
Additionally, a number of bonus features allow for the improved debugging
and inspection of the analysis’ input files. Data that was genuinely generated by
Alexsa (the code view and the sequence of states from the visual execution) can be
exported.
We conclude that Alexsa is a fully implemented tool for the visualization of
shape analysis results. The software fulfills all of the requirements and even adds
a number of helpful functions for daily use. Along the way a number of general
observations were made that resulted in strategies of general interest beyond their
use within Alexsa.
9.1
Future work
During our work we found some issues that need to be addressed, but that were
beyond the scope of this work. As we see it, two topics should be covered in the
implementation of software around shape analysis in the future: Automatic input
generation and improved graph layout.
9.1.1
Automatic input generation
So far all input for TVLA is handwritten. This is tedious and error prone work.
Also, debugging software may only be of partial effectiveness, as an error from a
faulty program may disappear when the developer rewrites the program in TVP.
The manual creation of TVP and TVS files will let many users refrain from using
TVLA and Alexsa in daily use.
The answer to this problem is the automatic creation of TVP and TVS files
from the user’s source code in one of a number of supported languages. As we see
it, such a ‘compiler’ would have to fulfill a number of requirements:
• Support of standard languages like C(++), Java, Pascal, etc.
• Translation of commands into TVP actions.
• A library of standard TVS scenarios that can then be augmented for the
current situation.
• Comfortable ways for the user to parametrize his key interest in the code.
The final requirements will depend on the focus of the implementation, may it
be day-by-day use or theoretic completeness.
1 The
abstract state for the new graph must be a legal successor of the old state.
76
9.1. FUTURE WORK
9.1.2
Improved graph layout
The use of dot is an easy way to get good graphs quickly. However, some deficiencies
go along with it. As dot has no knowledge about the sequences of shape graphs,
it can not optimize the layout for animations; every graph is layout by optimizing
the layout locally. It would be an improvement for the visual execution if layout
changes between subsequent graphs could be minimized.
Also, the current graph layouts do not model the semantics of the graphs optimally. As shape analysis develops further, it might become desirable to have a
specialized graph layout algorithm that is able to produce layouts that convey implicit information about the displayed structures. As an example think of a layout
where a singly linked list is always displayed horizontally with pointer variables
pointing into it from above or below. Or imagine a tree view where the relation
between the data in the nodes can be expressed by a different shape or size of shape
nodes. Manually constructed examples for such layouts can be found throughout
[Wilhelm and Braune, 2000].
9.1.3
Tying up the components
When the input generator and the specialized graph layout exist, new possibilities
are opened up. By closely integrating all the components (input generator, TVLA,
graph layouter, and Alexsa) a number of benefits can be imagined:
• More information could be passed from one component to the next, thus
exchanging some assumptions for hard data, while allowing more sophisticated
detail knowledge.
• Some components could be replaced by even better solutions. For example,
there wouldn’t be the need for a pseudo code generation if we could use the
actual source code in the first place.
• The consistent presentation of the various parts could make the use more
attractive.
All this suggests that even though we have made good progress with this work,
there are still a number of issues to be addressed before products for the daily use
by a general audience can be constructed.
77
CHAPTER 9. CONCLUSION
78
Appendix A
Other tools
Alexsa was written entirely in Java but relies not only on TVLA. In this appendix we
want to introduce briefly all other tools that were either used for the implementation
or that are needed for the execution.
A.1
Graphviz’ dot
Dot[Koutsofios and North] is part of the larger Graphviz suite, which in turn is an
open-source graph drawing software developed at AT&T labs. The whole Graphvizpackage can be downloaded for free.1
Dot is a command-line tool for drawing directed graphs. It reads attributed
graph text files and writes fully layouted graphs either as graph files or in some
graphics language like PostScript. The layout algorithm is based on the work of
Warfield[Warfield, 1977], Carpano[Carpano, 1980], and Sugiyama[Sugiyama et al.,
1981]. The actual algorithm used is described in another paper[Gansner et al., 1993]
by the authors of dot and others.
TVLA uses dot to layout the generated graphs, and thus Alexsa reads and uses
these graphs.
A.2
JLex & CUP
The implementation of scanners and parsers for reading input files is a tedious and
repetitive work for any developer. To help this, a number of tools exist to automatically generate parsers and scanners from some form of definition of the desired file
format. For many years, lex[Lesk and Schmidt, 1990] and yacc[Johnson and Sethi,
1990] (or their nowadays more commonly used successors flex[Paxson, 1995] and
bison[Donnelly and Stallman]) have been an important aid in the development of
software written in C. Flex, the scanner generator, and bison, the parser generator,
work together to produce complete input filters for software, and as both are rarely
used alone, the term flex/bison is a standard in file processing.
As flex and bison generate C-code, they are both not usable for software development in Java. However, Elliot Berk and Scott Hudson developed versions in and
for Java, called JLex[Berk and Ananian, 1997] and CUP[Hudson, 1999], respectively.
1 http://www.research.att.com/sw/tools/graphviz/
79
APPENDIX A. OTHER TOOLS
Using a definition syntax very close to the one used by flex and bison, software
developers can now easily produce complete file filters for Java programs.
In Alexsa, all files in TVP, TVS, and plain graph format are parsed by scanners
and parsers generated by JLex and CUP. See Chapter 3 – Interaction with TVLA
for details.
A.3
CPreProcessorStream
In TVLA the TVP files containing the program to analyze may import other files
using the standard C #include directive. This is made possible by using the
CPreProcessor-stream classes developed by Thomas Hyldgaard Hansen at IBM Alphaworks[Hansen]. To be as compatible as possible with TVLA, Alexsa uses the very
same C preprocessor.
The CPreProcessor classes can be downloaded for free from the IBM Alphaworks
homepage2 , however, their usage is restricted to non-commercial use. Due to the
Alphaworks license, the CPreProcessorStream will not be bundled with any version
of Alexsa (nor TVLA).
2 http://www.alphaworks.ibm.com/
80
Appendix B
Additional explanations
B.1
Understanding shape graphs
Shape graphs are annotated graphs describing the heap content at some program
point. They contain visual representations of variables, single or summarized heap
cells, and annotations describing properties of various elements of the graph.
Even though shape graphs are easily understandable we want to give an in-depth
description of a shape graph to avoid any misunderstandings. Take the following
shape graph:
x
n
s
r[n,s]
n
r[n,s]
n
r[n,s]
r[n,x]
n
n
r[n,s]
r[n,x]
Figure B.1: A singly linked list with the start pointer s and another pointer x
We see several elements: The two variables s and x are easily identifiable by
their rectangular boxes. The ovals represent one or more heap cells. From left to
right we see:
1. Solid drawn oval labeled “r[n, s]”. As the variable has an incoming arrow
from s, we see that this is the very heap cell the pointer variable s points
to. The label states that this node can be reached (r) from s by applying the
n−predicate (next-pointer in the structure) for an arbitrary number of times
(in this case: Zero times).
We read this as “Can be reached from s by n”.
2. Dashed oval labeled “r[n, s]”. This is a summary node, representing one or
more heap cells. All the summarized nodes share the same properties, namely,
reachable from s by n.
We see an incoming, dashed edge from node 1 to this node labeled n. This
is the edge representing the next-pointer in node 1. As this next pointer can
only point to exactly one of the possibly many nodes represented by node 2
it is drawn dashed, as to symbolize that it doesn’t point to all but to just one
81
APPENDIX B. ADDITIONAL EXPLANATIONS
node.
There is a self-loop on node 2 labeled n, too. This represents all the nextpointers leading from one to the next node within this summarized node.
Basically it is this very edge that shows us that the summarized nodes are
connected via the n−predicate.
There is also an outgoing dashed edge labeled n. Just like the edge from node
1 to node 2, this one is also dashed to show that not all heap cells are pointing
forward.
3. Solid oval labeled “r[n, s], r[n, x]”. Having understood the previous nodes this
one is fairly straightforward: As variable x points to this node, it is not only
reachable from s but also from x, which clearly shows in its label. As this
node has therefore properties different from all the nodes represented by node
2, is was not summarized into node 2. As a general rule of thumb we can say
that all nodes pointed to directly by variables are single, solid drawn nodes.
4. Dashed oval labeled “r[n, s], r[n, x]”. Again, this node is a straightforward
derivation of what we have seen before. The node is a summarized representation of one or more nodes, all reachable by s and x. Since there is no further
outgoing non-loop edge, there will be no other nodes connected to this one
except for those already summarized.
Summarizing all this we can easily see what this shape graph represents: A
singly linked list of arbitrary nodes, connected via their n−pointer, with the start
pointer s and some other pointer x pointing to some element of the list that is
neither one of the first two nor the last element of the list. The length of the list is
unknown, thus giving us a necessary level of abstraction, summarizing many cases
to a general scenario. Depending on the program analyzed, other shape graphs may
or may not describe the special cases where x points to one of the first two or last
two nodes, or where the list has a length of less than four, possibly even including
the special case of an empty list.
Shape graphs like this one will be used throughout the whole visualization, they
form the basic method of depicting the state of a program.
B.2
An example TVP file
Throughout this work we use the DeleteAll-program as an example program for
various aspects of Alexsa. Here we give the complete DeleteAll.tvp file. The file
has been modified from the version that comes with the TVLA distribution in a way
such that all included files have already been merged into this single file. The original
DeleteAll.tvp-file contains mainly only the actual control flow graph, which can
be found in the very last section (after the last line with a double percent). In a
second step all actions that were not actually used in this control flow graph were
removed, so that this example contains exactly the defintions of the actions used.
/* A Tvp program for the delete_all function from elem_lib.c */
/***********************************************************/
/*********************** Sets ******************************/
%s PVar {x, elem}
/**********************************************/
/*************** Core Predicates *************/
82
B.2. AN EXAMPLE TVP FILE
foreach (z in PVar) {
%p z(v_1) unique box
}
/**********************************************/
/*************** Core Predicates *************/
%p n(v_1, v_2) function
/***********************************************************/
/****************** Instrumentation Predicates *************/
%i is[n](v) =
E(v_1, v_2) ( v_1 != v_2 & n(v_1, v) & n(v_2, v))
foreach (z in PVar) {
%i r[n,z](v) = E(v_1) (z(v_1) & n*(v_1, v))
}
%i c[n](v) = n+(v, v)
%%
%action Is_Not_Null_Var(x1) {
%t x1 + " != null"
%f { x1(v) }
%p E(v) x1(v)
}
%action Is_Null_Var(x1) {
%t x1 + " == null"
%f { x1(v) }
%p !(E(v) x1(v))
}
/****************************************/
/**************** Actions **************/
%action Copy_Var_L(x1, x2) {
%t x1 + " = " + x2
%f { x2(v) }
{
x1(v) = x2(v)
r[n,x1](v) = r[n,x2](v)
}
}
%action Free_L(x1) {
%t "free(" + x1 + ") "
%f { x1(v) }
%message (E(v, v1) x1(v) & n(v, v1)) ->
"Internal Error! assume that " + x1 + "->" + n + "==NULL"
%retain !x1(v)
}
%action Get_Next_L(x1, x2) {
%t x1 + " = " + x2 + "->" + n
%f { E(v_1) x2(v_1) & n(v_1, v) }
%message (!E(v) x2(v)) -> "an illegal dereference to\n" +
n + " component of " + x2 + "\n"
83
APPENDIX B. ADDITIONAL EXPLANATIONS
{
x1(v) = E(v_1) x2(v_1) & n(v_1, v)
r[n,x1](v) = r[n,x2](v) & (c[n](v) | !x2(v))
}
}
%action Set_Next_Null_L(x1) {
%t x1 + "->" + n + " = null"
%f { x1(v) }
%message (!E(v) x1(v)) -> "an illegal dereference to\n" +
n + " component of " + x1 + "\n"
{
n(v_1, v_2) = n(v_1, v_2) & !x1(v_1)
is[n](v) = is[n](v) & (!(E(v_1) x1(v_1) & n(v_1, v)) |
E(v_1, v_2) v_1 != v_2 &
(n(v_1, v) & !x1(v_1)) &
(n(v_2, v) & !x1(v_2)))
r[n,x1](v) = x1(v)
foreach(z in PVar-{x1}) {
r[n,z](v) = (c[n](v) & r[n,x1](v) ?
z(v) | E(v_1) z(v_1) &
TC (v_1, v) (v_3, v_4) (n(v_3, v_4) & !x1(v_3))
:
r[n,z](v) & ! (E(v_1) r[n,z](v_1) & x1(v_1) &
r[n,x1](v) & !x1(v)))
}
c[n](v) = c[n](v) &
! (E( v_1) x1(v_1) & c[n](v_1) & r[n,x1](v))
}
}
%%
/***************** code *******************************/
/* while( x!=NULL) { */
n_1 Is_Null_Var(x) exit
n_1 Is_Not_Null_Var(x) n_2
/* elem = x; */
n_2 Copy_Var_L(elem, x) n_3
/* x = x->next; */
n_3 Get_Next_L(x, x) n_4
/* free(elem); */
n_4 Set_Next_Null_L(elem) n_5
n_5 Free_L(elem) n_1
/* } */
84
Appendix C
Implementation issues
This appendix contains several general implementational issues for completeness,
including a list of all classes and a complete list of changes made to TVLA.
C.1
Alexsa classes
In addition to the pieces of source code quoted where needed throughout this work,
we want to give a complete list of classes of Alexsa here, as this can give the reader
a rough understanding of Alexsa’s internal structure. The complete Alexsa source
code can be downloaded from the author’s homepage.1
All classes belonging to Alexsa have been put into the package alexsa or various
subpackages of it.
List of all packges and classes in the alexsa-hierarchy:
Analysis
Animation
Trace
Transition
alexsa:
Alexsa
Debug
Preferences
TvpTraceGraphFileFilter
TvsFileFilter
WaitTimer
data
event
gui
alexsa.data.graphs:
Attributes
EdgeLabel
GraphEdge
GraphLoader
GraphNode
GraphParser generated by CUP
GraphScanner generated by JLex
GraphSymbols generated by CUP
ShapeGraph
alexsa.data:
Edge
FileFormatException
Node
Tools
animation
graphs
morphing
tvp
tvs
alexsa.data.morphing:
AbstractMorph
Merge
Morphing
Move
MultiMorph
alexsa.data.animation:
1 http://www.ronaldbieber.de/Publications/DA/
85
APPENDIX C. IMPLEMENTATION ISSUES
TvsParser generated by CUP
TvsScanner generated by JLex
TvsSymbols generated by CUP
Rename
Split
alexsa.data.tvp:
Action
CfgEdge
CfgNode
ConsistencyRule
CorePredicate
Declaration
FileElement
Flags
ForEach
Formula
InstrumentationPredicate
Iterator
Kleene
Message
NewFormula
Predicate
Program
ProgramLoader
ReportMessage
SetDeclaration
SetExpression
TvpParser generated by CUP
TvpScanner generated by JLex
TvpSymbols generated by CUP
Update
alexsa.data.tvs:
NodePair
PredicateAssignment
Structure
TvsLoader
TvsNode
C.2
alexsa.event:
GraphEvent
GraphListener
alexsa.gui:
AlexsaWindow
GraphView
Statusbar
codeview
menus
dialogs
alexsa.gui.codeview:
CodeView
ComplexNode
DisplayLine
DoWhileLoop
GeneralIfElseStatement
IfStatement
SimpleIfElseStatement
WhileLoop
alexsa.gui.menus:
Commands
FMenu
FMenuBar
FMenuItem
InvisibleMenuBar
MenuCommander
StandardMenuBar
alexsa.gui.dialogs:
AnimationPrefsDialog
CodeViewPrefsDialog
Changes to TVLA
As discussed in Chapter 3 – TVLA Interaction, page 15, we made some enhancements to TVLA itself. These changes are supposed to be incorporated into an upcoming new release of TVLA, but as this hasn’t happened yet, we want to give a
complete list of all modifications made to TVLA.
C.2.1
Reading the shape graphs
In the shell script that subsequently calls TVLA itself and the dot graph layouter, we
added an option to generate trace files and changed the output format of dot from
PostScript to plain graph format. See Chapter 3.3 – Shape graphs on page 18 for
our reasons to change the output format. Also, TVLA will now generate meaningful
node names as instructed by the -significant-flag, see Chapter 7.2 on page 61 for
the motivation.
86
C.2. CHANGES TO TVLA
It should be noted that even when all other modifications have been incorporated
into TVLA, this shell script may still need to be modified by our user, as these
modifications change TVLA’s environment.
The complete script now reads:
#!/bin/sh
java -classpath $TVLA_HOME/tvla.jar -mx96m tvla.Runner $* \\
-path ".;$TVLA_HOME" -trace $1.trace -significant > $1.dt
dot -Tplain -o$1.graph < $1.dt
Similar changes need to be made to TVLA.BAT if used under Microsoft Windows.
C.2.2
Enhancing TVLA with a trace function
tvla/Engine.java: (2 changes)
• At the start of apply():
if (Tracer.doTrace()) {
Tracer.setShapeA(structure.local id );
Tracer.setAction(action. toString ());
}
• At the end of apply(), 2 indention levels above the return statement:
if (Tracer.doTrace())
Tracer.setShapeB(result. local id );
tvla/IntraProcEngine.java: (8 changes)
• In dump(), after if (! location .messages.isEmpty()) {
if (Tracer.doTrace())
Tracer. println (”messages for: ” + location. label );
• ... after dumpStream.println(structure.toDot(message.toString()));
if (Tracer.doTrace())
Tracer. println (”message: ” + structure. local id );
• ... after dumpStream.println(”digraph location [...]” );
if (Tracer.doTrace())
Tracer. println (”location : ” + location . label );
• ... after Structure structure = (Structure) res .next();
if (Tracer.doTrace())
Tracer. println (”shape: ” + structure. local id );
87
APPENDIX C. IMPLEMENTATION ISSUES
• In evaluate() after Structure s = (Structure) i .next();
if (Tracer.doTrace())
Tracer. println (” initial : ” + s. local id );
• ... after Structure structure = (Structure) structureIt .next();
if (Tracer.doTrace()) {
Tracer.print ();
Tracer.setStateA(location. label );
Tracer.setStateB(target );
}
• ... before System.err.println (””);
if (Tracer.doTrace())
Tracer.print ();
• ... at the very end of evaluate()
if (Tracer.doTrace())
Tracer. close ();
tvla/Runner.java: (2 changes)
• In usage() we added an explanation for the new -trace parameter:
”[− significant ] [−noautomatic] [−rotate] ” +
”[−trace <tracefilename>] ” +
”[−action [f ][ c]pu[c ][ b]] [−log logfile ]” );
• In parseArgs() we added the recognition of the -trace-flag:
} else if (args[ i ]. equals(”−trace”)) {
i++;
tvla .Tracer. init (args[ i ]);
tvla/Structure.java: (1 change)
At the very start of the class we added everything we need within a structure
for our trace:
/∗∗ Every structure is supposed to carry a unique identifier .
This is used to enable Alexsa to trace , which structures follow
from which other structures.∗/
/∗∗ global id holds a counter, which is incremented with
every new instance.∗/
public static int global id = 0;
/∗∗ local id holds the id of this single structure ∗/
public int local id ;
88
C.2. CHANGES TO TVLA
/∗∗ createUniqueID() returns a unique id (by incrementing
global id and returning it ).∗/
public int createUniqueID() { return global id++; }
public Structure() {
local id = createUniqueID();
}
tvla/advanced/AdvancedJoin.java: (2 changes)
• At the beginning of join ():
Structure isomorphic structure = null;
• In join () the lines
if (isomorphic()) {
found = true;
isomorphic structure = old;
}
replace the line
found = found || isomorphic();
tvla/compressed/CompressedStructure.java: (1 change)
At the start of CompressedStructure():
super();
tvla/naive/NaiveStructure.java: (1 change)
At the start of NaiveStructure():
super();
tvla/Tracer.java: (completely new)
package tvla;
/∗∗ This class is an extension of TVLA, implementing some functions
needed for tracing the various generated structures so that they
can later be displayed appropriately by Alexsa.
Written by Ronald Bieber, [email protected]−sb.de
Last changed: 11/26/2000
∗/
import java.io.∗;
import java.util.Vector;
public class Tracer {
89
APPENDIX C. IMPLEMENTATION ISSUES
// the name of the trace output file , usually something.trace
public static String
traceFileName = null;
// the actual writer object of the above named file
private static PrintWriter
traceFile = null;
// the following information will be set succesively
private static String
state a = null,
state b = null,
action = null;
private static int
shape a = −1;
private static Vector
shapes b = new Vector(4);
// reset the Tracer after some output has been done
public static void reset() {
state a = state b = action = null;
shape a = −1;
shapes b.removeAllElements();
}
// set the according information
public static void setStateA(String s) {
state a = s;
}
public static void setStateB(String s) {
state b = s;
}
public static void setAction(String s) {
action = s;
}
public static void setShapeA(int i) {
shape a = i;
}
// note that these can be multiple target structures
public static void setShapeB(int i) {
shapes b.addElement(new TargetShape(i));
}
// special information if some structure already existed
public static void setCycle(int i) {
((TargetShape)shapes b.lastElement()).cycle = true;
((TargetShape)shapes b.lastElement()).shape = i;
}
// the standard print−routine for the trace .
public static void print() {
if ( state a == null || state b == null || action == null) {
90
C.2. CHANGES TO TVLA
reset ();
return;
}
for (int i = 0; i < shapes b.size (); i++) {
TargetShape ts = (TargetShape)shapes b.elementAt(i);
if ( ts . cycle)
print(”redundancy: \””);
else
print(” transition : \”” );
println ( state a + ”\” −> \”” + state b +”\”, \”” + action +
”\”: ” + shape a + ” −> ” + ts.shape);
}
reset ();
}
// called
// a) by print()
// b) manually for things like initial shapes
public static void print(String s) {
if ( traceFile == null)
open();
if ( traceFile == null)
return;
traceFile . print(s );
}
public static void println(String s) {
print(s );
print(”\n”);
}
public static void open() {
if (traceFileName != null)
try {
traceFile = new PrintWriter(
new BufferedWriter(
new FileWriter(traceFileName)));
} catch (IOException e) {
System.err.println (e.getMessage());
}
}
public static void close() {
if ( traceFile != null)
traceFile . close ();
}
public static void init(String s) {
traceFileName = s;
}
// do we need to write trace output?
91
APPENDIX C. IMPLEMENTATION ISSUES
}
C.2.3
public static boolean doTrace() {
return traceFileName != null;
}
Introduction of descriptions for three valued structures
tvla/TVS/TVS.cup: (2 changes)
The TVS parser was enhanced to recognize (or, more specifically, ignore) the
textual description of a structure
• In the terminal declaration section:
terminal DESCRIPTION;
terminal String STRING;
• The grammar for structure now reads:
structure ::=
{: structure = parser.base.copy (); :} nodes iota
|
{: structure = parser.base.copy (); :}
DESCRIPTION ASSIGN LCBR STRING RCBR nodes iota
;
tvla/TVS/TVS.lex: (1 change)
Somewhere in the last section:
<YYINITIAL>”%d” {return new Symbol(sym.DESCRIPTION); }
C.3
Installing Alexsa
Alexsa is included on CD-Rom with the printed version of this paper. Alternatively
it can be downloaded from the author’s homepage.2 The installation instructions
here can also be found in the file INSTALL which comes with the distribution.
C.3.1
Required tools
If you only want to run Alexsa you will need:
• Java 1.2 JRE or higher
• CPreProcessorStream
To enable file inclusion on input files, Alexsa needs the CPreProcessorStream
class written at IBM Alphaworks. The CPreProcessorStream can be downloaded for free at http://www.alphaworks.ibm.com/, however, its license restricts all use in non-commercial fields.
CPreProcessorStream is not included with this distribution.
2 http://www.ronaldbieber.de/Publications/DA/
92
C.3. INSTALLING ALEXSA
If you also want to recompile Alexsa, you will also need
• Java 1.2 JDK or higher
Some tools are needed as well, but have already been included in this distribution:
• JLex (installed in tools/JLex/)
This is a Java-version of the popular lex/flex tool. JLex can be downloaded
for free from http://www.cs.princeton.edu/∼appel/modern/java/JLex/
JLex will only be needed for a clean compile, it is not needed at runtime.
• CUP (installed in tools/CUP/)
This is a Java-version of the popular yacc/bison tool. CUP can be downloaded
for free from http://www.cs.princeton.edu/∼appel/modern/java/CUP/
Unlike JLex, CUP will also be needed at runtime.
• TVLA (example files in tvla examples/)
TVLA is the analysis engine that produces the data that Alexsa will then
visualize. TVLA can be downloaded from http://www.math.tau.ac.il/∼tla/
For convenience, a number of fully processed example files has been included
with Alexsa (in the tvla examples/-directory). Those users that only want
to try Alexsa without working on their own analyses will not need to install
TVLA (nor follow the rest of the instructions on TVLA).
If you are installing TVLA, please make sure to follow all installation information there. You will also need to download and install the Graphviz package,
more information about that can be found in the TVLA docs.
Make sure to set the TVLA HOME environment variable correctly (without
trailing ’/’), Alexsa will use this variable, too.
Depending on the version of TVLA, you will have to change some parts of it.
Details on this can be found in appendix C of the diploma thesis accompanying
Alexsa or in the textfile TVLA CHANGES. You will need to get the source code
of TVLA to perform these changes.
C.3.2
Installing Alexsa
After you have unpacked Alexsa into some directory and have downloaded and
installed the CPreProcessorStream, some more things need to be done.
• In the Makefile, you will need to specify, where the CPreProcessorStream is
installed. We suggest an installation within the tools/-directory.
• When you type
make
all necessary files will be compiled. Alternatively, you can also use a
make clean
first, this will erase all class files and the generated java files.
This distribution already includes compiled class files of all Alexsa-, JLex-, and
CUP-classes. Running the makefile is still necessary to generate the Start-script.
93
APPENDIX C. IMPLEMENTATION ISSUES
C.3.3
Launching Alexsa
• type
make
or
Start (if make has been executed before)
to launch Alexsa. The Start script is generated by the makefile and contains
all necessary classpath settings if the makefile was modified correctly.
• Remember to have a number of input files at hand. As noted above, some
example files are already included with Alexsa. If you want to create your
own files, you will need to run TVLA (with the modifications described in
TVLA CHANGES applied).
• When opening a file you will often be asked for a .tvs-file to use. If you are
working with the above mentioned TVLA example files, SLL.tvs is the correct
choice.
C.3.4
Known issues
On many systems the default Java installation produces a number of error messages
when started (something about the font zapf-dingbats missing). To get rid of these
messages you can edit the file (JAVA HOME)/jre/lib/font.properties, erasing or
outcommenting all lines with a ’zapf-dingbats’ in it.
In some cases Java has problems with the display set to a 16-bit depth. In such
cases, please change the depth to 8 or 24 bit.
When installing Alexsa on a remote system, the X display connection can often
not be established. It is usually the best idea to install Alexsa locally.
94
Index
Actions, 5
Algorithm explanation, 1
Analysis
Run-Time, 3
Static, 3
Automatic traversion, 11
Export
Code view, 72
Visual execution, 72
Foresighted layout, 59
General if-else-statements
Code reconstruction, 38
Structure detection, 35
Graphviz, 5, 79
Branchings, 46
Code reconstruction, 37
Do-while-loops, 39
General if-else-statements, 38
If-statements, 37
Simple if-else-statements, 38
While-loops, 38
Code view, 10, 27
Cleaning up, 39
Construction algorithm, 29
Export, 72
Control flow graph, 5
CPreProcessorStream, 80
CUP, 79
Cycles, 47
If-statements
Code reconstruction, 37
Structure detection, 31
Inbetweening, 59
Creation, 67
Deleting, 65
Execution order, 64
Introduction, 12
Merging and splitting, 66
Moving, 65
Preferences, 68
Renaming/Resizing, 68
Zooming, 64
Inner edges, 33
Data view, 11, 41
Scaling, 41
Dead ends, 47
Debugging tools, 71
DeleteAll
Annotated CFG, 30
CFG definition, 27
Code view, 39
Complete TVP source, 82
Introduction, 13
One full cycle, 60
Trace file, 22
Trace graph, 23
TVLA’s CFG, 10
Do-while-loops
Code reconstruction, 39
Structure detection, 36
dot, 5, 79
JLex, 79
Kleene logic, 4
Missing arrow heads, 43
Natural explanation, 47
Pseudo code, 10
Scaling, 41
Search strategy, 48
Shape analysis
Introduction, 3
Shape graphs
Details, 81
Example, 4
Import from TVLA, 18
Unique IDs, 20
Simple if-else-statements
Empty graphs, 44
Exclusive-or, 32
Explanation, natural, 47
95
INDEX
Code reconstruction, 38
Structure detection, 34
Structure detection
Do-while-loops, 36
General if-else-statements, 35
If-statements, 31
Simple if-else-statements, 34
While-loops, 35
Trace files
Example, 22
Grammar, 21
Trace function, 19
Traversion, automatic, 11
TVP files, 15
TVS files, 17
Enhancement, 18
Example, 17
Visual execution, 11, 45
Criteria, 53
Criteria preferences, 55, 58
Definition, 12
Export, 72
Introduction, 6
Search algorithm, 51
While-loops
Code reconstruction, 38
Structure detection, 35
96
List of Figures
1.1
Singly linked list with two pointers . . . . . . . . . . . . . . . . . . .
4
2.1
DeleteAll.tvp (TVLA) . . . . . . . . . . . . . . . . . . . . . . . . . .
10
3.1
Trace file grammar . . . . . . . . . . . . . . . . . . . . . . . . . . . .
21
3.2
Trace file for DeleteAll.tvp . . . . . . . . . . . . . . . . . . . . . .
22
3.3
DeleteAll trace graph . . . . . . . . . . . . . . . . . . . . . . . . . . .
23
3.4
Masses of input files . . . . . . . . . . . . . . . . . . . . . . . . . . .
24
3.5
Open file dialog . . . . . . . . . . . . . . . . . . . . . . . . . . . . . .
24
4.1
DeleteAll after first DFS . . . . . . . . . . . . . . . . . . . . . . . . .
30
4.2
A chaotic CFG . . . . . . . . . . . . . . . . . . . . . . . . . . . . . .
34
4.3
Code view for DeleteAll.tvp . . . . . . . . . . . . . . . . . . . . . .
39
6.1
Branchings in the trace . . . . . . . . . . . . . . . . . . . . . . . . .
46
6.2
BFS versus DFS . . . . . . . . . . . . . . . . . . . . . . . . . . . . .
49
6.3
DeleteAll trace graph . . . . . . . . . . . . . . . . . . . . . . . . . . .
56
6.4
External vs internal cycles . . . . . . . . . . . . . . . . . . . . . . . .
56
6.5
Complex strcutures vs simple subgraphs . . . . . . . . . . . . . . . .
57
6.6
Deep vs shallow . . . . . . . . . . . . . . . . . . . . . . . . . . . . . .
57
6.7
Forward edges vs cross edges . . . . . . . . . . . . . . . . . . . . . .
58
7.1
A simple inbetweening . . . . . . . . . . . . . . . . . . . . . . . . . .
59
7.2
DeleteAll: One cycle . . . . . . . . . . . . . . . . . . . . . . . . . . .
60
7.3
Node naming during a merge . . . . . . . . . . . . . . . . . . . . . .
62
7.4
Node naming during a split . . . . . . . . . . . . . . . . . . . . . . .
62
7.5
Possible edges during a merge . . . . . . . . . . . . . . . . . . . . . .
66
7.6
Possible edges during a split . . . . . . . . . . . . . . . . . . . . . . .
67
8.1
Animation preferences . . . . . . . . . . . . . . . . . . . . . . . . . .
73
8.2
Miscellaneous preferences . . . . . . . . . . . . . . . . . . . . . . . .
74
9.1
Screenshot of Alexsa . . . . . . . . . . . . . . . . . . . . . . . . . . .
75
B.1 Singly linked list with two pointers . . . . . . . . . . . . . . . . . . .
81
97
LIST OF FIGURES
98
Bibliography
Meyers Großer Rechenduden. Dudenverlag, Bibliographisches Institut, Mannheim,
Germany, 1961.
Alfred V. Aho, Ravi Sethi, and Jeffrey D. Ullman. Compilers – Principles, Techniques, and Tools. Addison-Wesley, 1986. ISBN 0-201-10088-6.
Staff at Apple Computers. Macintosh Human Interface Guidelines. Apple Computers Inc., 1993.
Elliot Joel Berk and C. Scott Ananian. JLex: A lexical analyzer generator for Java,
1997.
Luca Cardelli and Andrew D. Gordon. Mobile ambients. LNCS, 1378:140–155,
1998.
Marie-Jose Carpano. Automatic display of hierarchical graphs for computer aided
decision analysis. IEEE Transactions of Software Engineering, 12(4):538–546,
April 1980.
David R. Chase, Mark N. Wegman, and F. Kenneth Zadeck. Analysis of pointers
and structures. In SIGPLAN Conference on Programming Language Design and
Implementation, pages 296–310, New York, NY, 1990. ACM Press.
Thomas H. Cormen, Charles E. Leiserson, and Ronald L. Rivest. Introduction to
Algorithms. The MIT electrical engineering and computer science series. MIT
Press, 1990. ISBN 0-262-03141-8.
Frank L. DeRemer. Lexical analysis. In Friedrich Ludwig Bauer and Jürgen Eickel,
editors, Compiler Construction – An Advanced Course, pages 109–120. Springer
Verlag, 1974.
Stefan Diehl, Carsten Görg, and Andreas Kerren. Foresighted Graphlayout. Technical Report A02/00, FR 6.2 Informatik, Universität des Saarlandes, 66041
Saarbrücken, Germany, 2000.
Stephan Diehl, Carsten Görg, and Andreas Kerren. Preserving the mental map
using foresighted layout. In Proceedings of Joint Eurographics - IEEE TCVG
Symposium on Visualization, VisSym 2001, Ascona, Switzerland, 2001.
Charles Donnelly and Richard Stallman. The Bison Reference Manual.
Emden R. Gansner, Eleftherios Koutsofios, Stephen C. North, and Kiem-Phong
Vo. A technique for drawing directed graphs. IEEE Transactions of Software
Engineering, 19(3):214–230, May 1993.
James Gosling, Bill Joy, Guy Steele, and Gilad Bracha. The Java Language
Specification. Addison-Wesley, 2nd edition, 2000. ISBN 0201310082. URL
java.sun.com/docs/books/jls/.
99
BIBLIOGRAPHY
Thomas Hyldgaard Hansen. CPreProcessorStream.
Susan Horwitz, Phil Pfeiffer, and Thomas Reps. Dependence analysis for pointer
variables. In SIGPLAN Conference on Programming Language Design and Implementation, pages 28–40, New York, NY, 1989. ACM Press.
Scott E. Hudson. CUP LALR Parser Generator for Java – User Manual, 1999.
URL www.cs.princeton.edu/∼appel/modern/java/CUP/manual.html.
Stephen C. Johnson and Ravi Sethi. Yacc: A parser generator. In UNIX Research
System: Programmer’s Manual, volume 2. Holt Rinehard & Winston, New York,
tenth edition, 1990.
Neil D. Jones and Steven S. Muchnick. Flow analysis and optimization of Lisplike structures. In Steven S. Muchnick and Neil D. Jones, editors, Program Flow
Analysis: Theory and Applications, chapter 4, pages 102–131. Prentice-Hall, Englewood Cliffs, NJ, 1981.
Neil D. Jones and Steven S. Muchnick. A flexible approach to interprocedural data
flow analysis and programs with recursive data structures. In Symposium on
Principles of Programming Languages, pages 66–74, New York, NY, 1982. ACM
Press.
Stepen C. Kleene. Introduction to Metamathematics. North-Holland, 1952. ISBN
0-7204-21039.
Eleftherios Koutsofios and Stephen C. North. Drawing graphs with dot. URL
www.research.att.com/sw/tools/graphviz/dotguide.pdf.
James R. Larus and Paul N. Hilfinger. Detecting conflicts between structure accesses. In SIGPLAN Conference of Programming Language Design and Implementation, pages 21–34, New York, NY, 1988. ACM Press.
Michael Lesk and Eric Schmidt. Lex – lexical analyzer generator. In UNIX Research
System: Programmer’s Manual, volume 2. Holt Rinehard & Winston, New York,
tenth edition, 1990.
Tal Lev-Ami, Thomas Reps, Mooly Sagiv, and Reinhard Wilhelm. Putting
static analysis to work for verification: A case study. August 2000. URL
www.math.tau.ac.il/∼tla/issta00.ps.
Tal Lev-Ami and Mooly Sagiv. TVLA: A Framework for Kleene Logic Based Static
Analysis, May 2000a. URL www.math.tau.ac.il/∼tla/. Documentation contained within the TVLA-package.
Tal Lev-Ami and Mooly Sagiv. TVLA: A system for implementing static analyses. In Static Analysis Symposium 2000 Proceedings, January 2000b. URL
www.math.tau.ac.il/∼tla/sas00.ps.
Uwe Aßmann and Markus Weinhardt. Interprocedural heap analysis for parallelizing
imperative programs. In W. K. Giloi, S. Jähnichen, and B. D. Shriver, editors,
Programming Models for Massively Parallel Computers, pages 74–82. IEEE Press,
Washington, DC, September 1993.
Kazuo Misue, Peter Eades, Wei Lai, and Kozo Sugiyama. Layout adjustment and
the mental map. Technical Report ISIS-RR-94-6E, Fujitsu Institute for Social
Information Science, May 1994.
100
BIBLIOGRAPHY
Flemming Nielson, Hanne Riis Nielson, and Mooly Sagiv. A kleene analysis of
mobile ambients. In European Symposium On Programming Proceedings, Berlin,
2000, March 2000.
Vern Paxson. Flex, Version 2.5. A fast scanner generator, 1995.
John Plevyak, Andrew A. Chien, and Vijay Karamcheti. Analysis of dynamic data
structures for efficient parallel execution. Lecture Notes in Computer Science,
768:37–57, August 1993.
Mooly Sagiv, Thomas Reps, and Reinhard Wilhelm. Solving shape-analysis problems in languages with destructive updating. Transactions on Programming Languages and Systems, 20(1):1–50, January 1998.
Mooly Sagiv, Thomas Reps, and Reinhard Wilhelm. Parametric shape analysis via
3-valued logic. In Conference Record of the Twenty-Sixth ACM Symposium on
Principles of Programming Languages, pages 105–118, New York, NY, January
1999. ACM. (San Antonio, TX, Jan. 20-22, 1999).
Mooly Sagiv, Thomas Reps, and Reinhard Wilhelm. Shape analysis. In CC 2000 –
9th International Conference on Compiler Construction Proceedings, March 2000.
URL www.cs.wisc.edu/wpis/papers/cc2000.ps.
Mooly Sagiv, Thomas Reps, and Reinhard Wilhelm. Parametric shape analysis
via 3-valued logic. ACM Transaction on Programming Languages and Systems
(TOPLAS), 2001.
Kozo Sugiyama, Shojiro Tagawa, and Mitsuhiko Toda. Methods for visual understanding of hierarchical system structures. IEEE Transactions on Systems, Man,
and Cybernetics, 11(2):109–125, February 1981.
Edward Y.-B. Wang. Analysis of Recursive Types in an Imperative Language. Phd
thesis, University of California, Berkeley, CA, 1994.
John Warfield. Crossing theory and hierarchy mapping. IEEE Transactions on
Systems, Man, and Cybernetics, 7(7):505–523, July 1977.
Reinhard Wilhelm and Beatrix Braune. Focusing in algorithm explanation. IEEE
Transactions on Visualization and Computer Graphics, 6(1), January/March
2000.
Reinhard Wilhelm and Dieter Maurer. Übersetzerbau. Theorie, Konstruktion,
Generierung. Springer Verlag, 2nd edition, 1997. ISBN 3540616926.
Andreas Zeller. Datenstrukturen visualisieren und animieren mit DDD. Informatik
– Forschung und Entwicklung, March 2001.
101