1
User Manual
Revision Date: 11/2/2015
ComProbe High Speed UART User Manual
Copyright © 2000-2015 Frontline Test Equipment, Inc.
FTS, Frontline, Frontline Test System, ComProbe Protocol Analysis System and ComProbe are registered
trademarks of Frontline Test Equipment, Inc.
The Bluetooth SIG, Inc. owns the Bluetooth® word mark and logos, and any use of such marks by Frontline is under
license. All other trademarks and registered trademarks are property of their respective owners.
-i-
ComProbe High Speed UART User Manual
Contents
Chapter 1 ComProbe Hardware & Software
1
1.1 What is in this manual
2
1.2 Computer Minimum System Requirements
2
1.3 Software Installation
2
1.3.1 From CD:
2
1.3.2 From Download:
3
Chapter 2 Getting Started
4
2.1 HSU Hardware
4
2.1.1 Connect the ComProbe HSU to the Device Under Test
4
2.1.2 Hardware Settings
6
2.2 Data Capture Methods
6
2.2.1 Opening ComProbe Data Capture Method
6
2.2.2 ComProbe High Speed Serial Sniffing Data Capture Method
8
2.3 Control Window
9
2.3.1 Control Window Toolbar
10
2.3.2 Configuration Information on the Control Window
11
2.3.3 Status Information on the Control Window
11
2.3.4 Frame Information on the Control Window
11
2.3.5 Control Window Menus
12
2.3.6 Minimizing Windows
15
Chapter 3 Configuration Settings
16
3.1 HSU Configuration - Datasource
16
3.2 Decoder Parameters
18
3.2.1 Decoder Parameter Templates
20
3.2.1.1 Select and Apply a Decoder Template
20
3.2.1.2 Adding a New or Saving an Existing Template
21
3.2.1.3 Deleting a Template
21
3.2.2 L2CAP Decoder Parameters
22
3.2.2.1 About L2CAP Decoder Parameters
22
3.2.2.2 L2CAP Override Decode Information
23
- ii -
ComProbe High Speed UART User Manual
3.2.3 RFCOMM Decoder Parameters
24
3.2.3.1 About RFCOMM Decoder Parameters
24
3.2.3.2 RFCOMM Missing Decode Information
25
3.2.3.3 RFCOMM Override Decode Information
26
Chapter 4 Capturing and Analyzing Data
28
4.1 Capture Data
28
4.1.1 Capturing Data to Disk - General Procedure
28
4.1.2 Combining BPA 600, 802.11, and HSU with ProbeSync
30
4.1.3 HSU Start Capture
32
4.1.3.1 HSU Capture with ProbeSync
32
4.2 Protocol Stacks
33
4.2.1 Protocol Stack Wizard
33
4.2.2 Creating and Removing a Custom Stack
34
4.2.3 Reframing
35
4.2.4 Unframing
36
4.2.5 How the Analyzer Auto-traverses the Protocol Stack
36
4.2.6 Providing Context For Decoding When Frame Information Is Missing
37
4.3 Analyzing Byte Level Data
38
4.3.1 Event Display
38
4.3.2 The Event Display Toolbar
39
4.3.3 Opening Multiple Event Display Windows
40
4.3.4 Calculating CRCs or FCSs
40
4.3.5 Calculating Delta Times and Data Rates
41
4.3.6 Switching Between Live Update and Review Mode
41
4.3.7 Data Formats and Symbols
42
4.3.7.1 Switching Between Viewing All Events and Viewing Data Events
42
4.3.7.2 Switching Between Hex, Decimal, Octal or Binary
42
4.3.7.3 Switching Between ASCII, EBCDIC, and Baudot
43
4.3.7.4 Selecting Mixed Channel/Sides
43
4.3.7.5 List of all Event Symbols
44
4.3.7.6 Font Size
46
- iii -
ComProbe High Speed UART User Manual
4.4 Analyzing Protocol Decodes
46
4.4.1 Frame Display Window
46
4.4.1.1 Frame Display Toolbar
49
4.4.1.2 Frame Display Status Bar
52
4.4.1.3 Hiding and Revealing Protocol Layers in the Frame Display
52
4.4.1.4 Physical vs. Logical Byte Display
53
4.4.1.5 Sorting Frames
53
4.4.1.6 Frame Display - Find
53
4.4.1.7 Synchronizing the Event and Frame Displays
55
4.4.1.8 Working with Multiple Frame Displays
56
4.4.1.9 Working with Panes on Frame Display
56
4.4.1.10 Frame Display - Byte Export
56
4.4.1.11 Panes in the Frame Display
58
4.4.1.11.1 Summary Pane
58
4.4.1.11.2 Customizing Fields in the Summary Pane
61
4.4.1.11.3 Frame Symbols in the Summary Pane
62
4.4.1.11.4 Decode Pane
62
4.4.1.11.5 Radix or Hexadecimal Pane
63
4.4.1.11.6 Character Pane
63
4.4.1.11.7 Binary Pane
64
4.4.1.11.8 Event Pane
64
4.4.1.11.9 Change Text Highlight Color
64
4.4.1.12 Protocol Layer Colors
65
4.4.1.12.1 Data Byte Color Notation
65
4.4.1.12.2 Changing Protocol Layer Colors
65
4.4.1.13 Filtering
65
4.4.1.13.1 Display Filters
66
4.4.1.13.1.5 Defining Node and Conversation Filters
71
4.4.1.13.1.6 The Difference Between Deleting and Hiding Display Filters
71
4.4.1.13.1.7 Editing Filters
73
4.4.1.13.2 Connection Filtering
75
- iv -
ComProbe High Speed UART User Manual
4.4.1.13.2.1 Creating a Connection Filter
75
4.4.1.13.2.2 Connection Filter Display
78
4.4.1.13.3 Protocol Filtering from the Frame Display
80
4.4.1.13.3.1 Quick Filtering on a Protocol Layer
80
4.4.1.13.3.2 Easy Protocol Filtering
81
4.4.2 About The Message Sequence Chart (MSC)
81
4.4.2.1 Message Sequence Chart - Search
86
4.4.2.2 Message Sequence Chart - Go To Frame
87
4.4.2.3 Message Sequence Chart - First Error Frame
88
4.4.2.4 Message Sequence Chart - Printing
88
4.5 Analyzing Control Signal Changes - Real Time
90
4.5.1 Breakout Box Window
90
4.5.1.1 Ring Indicator
92
4.5.2 Reading the Breakout Box Window
92
4.5.3 The Breakout Box Toolbar
92
4.5.4 Selecting Breakout Box Options
93
4.5.4.1 Performance Notes
93
4.6 Viewing Historical Signal Changes
94
4.6.1 Signal Display Window
94
4.6.2 Signal Display Toolbar
95
4.6.3 Reading the Signal Display
96
4.6.4 Selecting Signal Display Options
97
4.7 Statistics
98
4.7.1 Statistics Window
98
4.7.2 Session, Resettable and Capture File Tabs
100
4.7.3 Copying Statistics To The Clipboard
101
4.7.4 Graphs
101
4.7.4.1 Statistics Errors Graphs
101
4.7.4.2 Printing Error Graphs
102
Chapter 5 Navigating and Searching the Data
103
5.1 Find
103
-v-
ComProbe High Speed UART User Manual
5.1.1 Searching within Decodes
104
5.1.2 Searching by Pattern
106
5.1.3 Searching by Time
108
5.1.4 Using Go To
110
5.1.5 Searching for Special Events
111
5.1.6 Searching by Signal
112
5.1.7 Searching for Data Errors
115
5.1.8 Find - Bookmarks
117
5.1.9 Changing Where the Search Lands
118
5.1.10 Subtleties of Timestamp Searching
119
5.2 Bookmarks
119
5.2.1 Adding, Modifying or Deleting a Bookmark
119
5.2.2 Displaying All and Moving Between Bookmarks
120
Chapter 6 Saving and Importing Data
122
6.1 Saving Your Data
122
6.1.1 Saving the Entire Capture File
122
6.1.2 Saving the Entire Capture File with Save Selection
123
6.1.3 Saving a Portion of a Capture File
124
6.2 Adding Comments to a Capture File
124
6.3 Confirm Capture File (CFA) Changes
125
6.4 Loading and Importing a Capture File
125
6.4.1 Loading a Capture File
125
6.4.2 Importing Capture Files
126
6.5 Printing
126
6.5.1 Printing from the Frame Display/HTML Export
126
6.5.2 Printing from the Event Display
129
6.6 Exporting
130
6.6.1 Frame Display Export
130
6.6.2 Exporting a File with Event Display Export
130
6.6.2.1 Export Filter Out
133
6.6.2.2 Exporting Baudot
133
- vi -
ComProbe High Speed UART User Manual
Chapter 7 General Information
134
7.1 System Settings and Progam Options
134
7.1.1 System Settings
134
7.1.1.1 System Settings - Disabled/Enabled Options
136
7.1.1.2 Advanced System Options
136
7.1.1.3 Selecting Start Up Options
137
7.1.2 Changing Default File Locations
138
7.1.3 Side Names
140
7.1.4 Timestamping
141
7.1.4.1 Timestamping Options
141
7.1.4.2 Enabling/Disabling Timestamp
142
7.1.4.3 Changing the Timestamp Resolution
142
7.1.4.4 Switching Between Relative and Absolute Time
143
7.1.4.5 Displaying Fractions of a Second
144
7.2 Technical Information
144
7.2.1 Performance Notes
144
7.2.2 BTSnoop File Format
145
7.2.3 Ring Indicator
147
7.2.4 Progress Bars
148
7.2.5 Event Numbering
148
7.2.6 Useful Character Tables
148
7.2.6.1 ASCII Codes
148
7.2.6.2 Baudot Codes
149
7.2.6.3 EBCDIC Codes
149
7.2.6.4 Communication Control Characters
149
7.2.7 The Frontline Serial Driver
151
7.2.8 DecoderScript Overview
151
7.2.9 Bluetooth low energy ATT Decoder Handle Mapping
152
7.3 Contacting Technical Support
153
Appendicies
154
Appendix A: Application Notes
156
- vii -
ComProbe High Speed UART User Manual
A.1 Bluetooth Virtual Sniffing
158
A.1.1 Introduction
158
A.1.2 Why HCI Sniffing and Virtual Sniffing are Useful
158
A.1.3 Bluetooth Sniffing History
159
A.1.4 Virtual Sniffing—What is it?
159
A.1.5 The Convenience and Reliability of Virtual Sniffing
160
A.1.6 How Virtual Sniffing Works
160
A.1.7 Virtual Sniffing and Bluetooth Stack Vendors
160
A.1.8 Case Studies: Virtual Sniffing and Bluetooth Mobile Phone Makers
161
A.1.9 Virtual Sniffing and You
161
A.2 ComProbe Automation Server: Why use it?
164
A.2.1 Automation Server Topology
165
A.2.2 Writing Automation Script
165
A.2.3 Running Automation Server Script
167
A.2.4 Saving Automation Captured Data
170
A.2.5 Keeping Track of Events
172
A.2.6 Automation Can Save Time and Money
172
List of Figures
Figure 2.1 - HSU Hardware Settings
6
Figure 2.2 - Desktop Folder Link
7
Figure 2.3 - ComProbe Analyzer Control Window
9
Figure 3.1 - Select Set Initial Decoder Parameters... from Control window
19
Figure 3.2 - Tabs for each decoder requiring parameters.
19
Figure 3.3 - Set Subsequent Decoder Parameters... from Control window
20
Figure 3.4 - Example: Set Subsequent Decode for Frame #52, RFCOMM
20
Figure 3.5 - L2CAP Decoder parameters tab
22
Figure 3.6 - Parameters Added to Decoder
23
Figure 3.7 - RFCOMM parameters tab
24
Figure 3.8 - Parameters Added to Decoder
25
- viii -
ComProbe High Speed UART User Manual
Figure 3.9 - Set Subsequent Decoder Parameters selection list
27
Figure 4.1 - Packet Transfer Dialog
29
Figure 4.2 - Incorrect ProbeSync Hardware Connection Error
31
Figure 4.3 - Incorrect ProbeSync Hardware Connection Message In Datasource Status
31
Figure 4.4 - ProbeSync Synchronizing Device Status Message
31
Figure 4.5 - ProbeSync Synchronized Device Status Message
31
Figure 4.6 - Incorrect ProbeSync Hardware Connection Message In Datasource Status
33
Figure 4.7 - ProbeSync Synchronizing Device Status Message
33
Figure 4.8 - ProbeSync Synchronized Device Status Message
33
Figure 4.9 - Format Menu
42
Figure 4.10 - Header labels, right click
43
Figure 4.11 - Data display right click menu
43
Figure 4.12 - Event Display Options menu
46
Figure 4.13 - Event Display Font Size Selection
46
Figure 4.14 - Frame Display with all panes active
47
Figure 4.15 - Frame Display Find text entry field
53
Figure 4.16 - Search/Find Dialog
54
Figure 4.17 - Frame Display File menu, Byte Export
57
Figure 4.18 - Byte Export dialog
57
Figure 4.19 - Save As dialog
58
Figure 4.20 - Sample Exported Frames Text File
58
Figure 4.21 - Example Protocol Tags
59
Figure 4.22 - Summary pane (right) with Tooltip on Column 5 (Tran ID)
60
Figure 4.23 - Frame Display Protocol Layer Color Selector
65
Figure 4.24 - Example: Set Conditions Self Configuring Based on Protocol Selection
67
Figure 4.25 - Example: Set Conditions Self Configuring Based on Frame Range
68
Figure 4.26 - Two Filter Conditions Added with an AND Operator
70
Figure 4.27 - Save Named Filter Condition Dialog
70
Figure 4.28 - Using Named Filters Section of Quick Filters to Show/Hide Filters
73
Figure 4.29 - Set Condition Dialog in Advanced View
74
Figure 4.30 - Rename Filters Dialog
75
- ix -
ComProbe High Speed UART User Manual
Figure 4.31 - Connection Filter from the Frame Display Menu
76
Figure 4.32 - Connection Filter from the Frame Display Toolbar right-click
76
Figure 4.33 - Connection Filter from the Frame Display Pane right-click
77
Figure 4.34 - Connection Filter from frame selection right-click
78
Figure 4.35 - Front Display: Filtered on Access Address 0x8e89bed6
79
Figure 4.36 - Unfiltered: Capture File with Classic, low energy, and 802.11
80
Figure 4.37 - Connection Filter selecting All 802.11 frames, front
80
Figure 4.38 - Frame Display Quick Filtering and Hiding Protocols Dialog
81
Figure 4.39 - Message Sequence Chart Window
82
Figure 4.40 - Classic and LE tabs
83
Figure 4.41 - Frame# and Time Display, inside red box.
84
Figure 4.42 - MSC Synchronization with Frame Display
84
Figure 4.43 - Control and Signaling Frames Summay
85
Figure 4.44 - Packet Layers Shown in Different Colors
85
Figure 4.45 - Right-Click in Ctrl Summary to Display Show in MSC
85
Figure 4.46 - MSC View of Selected Packet from Ctrl Summary
86
Figure 4.47 - Return to Text View Using Right-Click Menu
86
Figure 4.48 - Highlighted First Search Result
87
Figure 4.49 - Message Sequence Chart Print Preview
89
Figure 4.50 - Print Preview Toolbar
89
Figure 4.51 - ComProbe USB Breakout Box Display
91
Figure 4.52 - ComProbe HSU Breakout Box Display
91
Figure 4.53 - USB Signal Display Window
95
Figure 4.54 - HSU Signal Display Window
95
Figure 4.55 - HSU Signal Display Options
97
Figure 4.56 - HSU Statistics Window
98
Figure 4.57 - HSU Edit Menu for Copying
101
Figure 5.1 - Find Dialog
103
Figure 5.2 - Find Decode Tab Search for String
104
Figure 5.3 - Find Decode Tab Side Restriction
105
Figure 5.4 - Find Pattern Tab
107
-x-
ComProbe High Speed UART User Manual
Figure 5.5 - Find Pattern Tab Side Restrictions
107
Figure 5.6 - Find by Time tab
108
Figure 5.7 - Find Go To tab
110
Figure 5.8 - Find Special Events tab
112
Figure 5.9 - Find Signal tab.
113
Figure 5.10 - Find Error tab.
115
Figure 5.11 - Find Bookmark tab.
118
Figure 5.12 - Bookmarked Frame (3) in the Frame Display
119
Figure 5.13 - Find Window Bookmark tab Used to Move Around With Bookmarks
121
Figure 6.1 - Windows Save dialog
123
Figure 6.2 - Frame Display Print Dialog
127
Figure 6.3 - Frame Display Print Preview Dialog
128
Figure 6.4 - Event Display Print Dialog
130
Figure 6.5 - Event Display Export Example: .csv file.
131
Figure 6.6 - Example: .csv Event Display Export, Excel spreadsheet
133
Figure 7.1 - System Settings Single File Mode
135
Figure 7.2 - Advanced System Options dialog 137
Figure 7.3 - Start Up Options dialog
138
Figure 7.4 - File Locations dialog
139
Figure 7.5 - File Locations Browse dialog
139
Figure 7.6 - Example: Side Names Where "Slave" and "Master" are current
141
- xi -
Chapter 1 ComProbe Hardware & Software
Frontline Test Equipment ComProbe family of protocol analyzers work with the following technologies.
l
Classic Bluetooth®
l
Bluetooth low energy
l
Dual Mode Bluetooth (simultaneous Classic and low energy)
l
Bluetooth Coexistence with 802.11
l
Bluetooth HCI (USB, SD, High Speed UART)
l
NFC
l
802.11 (Wi-Fi)
l
SD
l
USB
l
HSU (High Speed UART)
The ComProbe hardware interfaces with your computer that is running our robust software engine called the
ComProbe Protocol Analysis System or ComProbe software. Whether you are sniffing the air or connecting
directly to the chip Frontline analyzers use the same powerful ComProbe software to help you test, troubleshoot,
and debug communications faster.
ComProbe software is an easy to use and powerful protocol analysis platform. Simply use the appropriate
ComProbe hardware or write your own proprietary code to pump communication streams directly into the
ComProbe software where they are decoded, decrypted, and analyzed. Within the ComProbe software you see
packets, frames, events, coexistence, binary, hex, radix, statistics, errors, and much more.
This manual is a user guide that takes you from connecting and setting up the hardware through all of the
ComProbe software functions for your ComProbe hardware. Should you have any questions contact the Frontline
Technical Support Team.
-1-
ComProbe High Speed UART User Manual
Chapter 1 ComProbe Hardware & Software
1.1 What is in this manual
The ComProbe User Manual comprises the following seven chapters. The chapters are organized in the sequence
you would normally follow to capture and analyze data: set up, configure, capture, analyze, save. You can read
them from beginning to end to gain a complete understanding of how to use the ComProbe hardware and
software or you can skip around if you only need a refresher on a particular topic. Use the Contents, Index, and
Glossary to find the location of particular topics.
l
l
l
l
l
l
l
Chapter 1 ComProbe Hardware and Software. This chapter will describe the minimum computer
requirements and how to install the software.
Chapter 2 Getting Started. Here we describe how to set up and connect the hardware, and how to apply
power. This chapter also describes how to start the ComProbe software in Data Capture Methods. You will be
introduced to the Control window that is the primary operating dialog in the ComProbe software.
Chapter 3 Configuration Settings. The software and hardware is configured to capture data. Configuration
settings may vary for a particular ComProbe analyzer depending on the technology and network being sniffed.
There are topics on configuring protocol decoders used to disassemble packets into frames and events.
Chapter 4 Capturing and Analyzing Data. This Chapter describes how to start a capture session and how to
observe the captured packets, frames, layers and events.
Chapter 5 Navigating and Searching the Data. Here you will find how to move through the data and how to
isolate the data to specific events, often used for troubleshooting device design problems.
Chapter 6 Saving and Importing Data. When a live capture is completed you may want to save the captured
data for future analysis, or you may want to import a captured data set from another developer or for use in
interoperability testing. This chapter will explain how to do this for various data file formats.
Chapter 7 General Information. This chapter provides advanced system set up and configuration information,
timestamping information, and general reference information such as ASCII, baudot, and EBCDIC codes. This
chapter also provides information on how to contact Frontline's Technical Support team should you need
assistance.
1.2 Computer Minimum System Requirements
Frontline supports the following computer systems configurations:
l
Operating System: Windows 7 and 8
l
USB Port: USB 2.0 or USB 3.0 High-Speed
The ComProbe software must operate on a computer with the following minimum characteristics.
l
Processor: Core i5 processor at 2.7 GHz
l
RAM: 4 GB
l
Free Hard Disk Space: 20 GB
1.3 Software Installation
1.3.1 From CD:
Insert the ComProbe installer disc into your DVD drive. Click on the Install CPAS shortcut and follow the
directions.
-2-
Chapter 1 ComProbe Hardware & Software
ComProbe High Speed UART User Manual
1.3.2 From Download:
Download the latest CPAS installer from FTE.com. Once downloaded, double-click the installer and follow the
directions.
-3-
Chapter 2 Getting Started
In this chapter we introduce you to the ComProbe hardware and show how to start the ComProbe analyzer
software and explain the basic software controls and features for conducting the protocol analysis.
2.1 HSU Hardware
The following sections describe the High Speed UART hardware connectors and hardware setup.
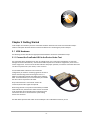
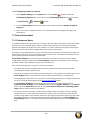
2.1.1 Connect the ComProbe HSU to the Device Under Test
The ComProbe HSU is designed for use with TTL voltage levels, 0 to 5 volts max (exceeding the 5.0 volts max
damages the ComProbe hardware). The ComProbe HSU interprets 0 to 0.8 volts as a logical zero, and 2.0 to 5.0
volts as a logical one. To ensure accurate data collection and proper operation, connect the ComProbe HSU to the
TTL side of any transceivers, line drivers, or line receivers.
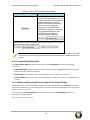
Use the table below to determine the connection
configuration you need for monitoring signals on the source
device. Disconnecting and reconnecting the wires in a
different configuration negates the validity of the following
table. To avoid confusion, we recommend that you maintain
the color code as expressed in this table.
Only "Data Connection" and "Ground" need to be
connected, all the other signals are optional.
When using the HSU in conjunction with ProbeSync enabled
ComProbe devices, the HSU CAT 5 cable must be connected
to the ComProbe device providing the synchronizing clock.
Connect the HSU CAT 5 connector to the synchronizing
device OUT connector.
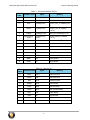
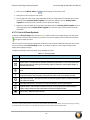
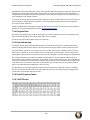
The table below provides information on the ProbeSync CAT 5 cable RG-45 connector pin out.
-4-
ComProbe High Speed UART User Manual
Chapter 2 Getting Started
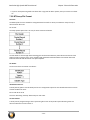
Table 2.1 - HSU with ProbeSync Pin Out
Wire
Label
Label/Wire Color
G
Green
Ground
Ground
G
Green
ProbeSync Ground
ProbeSync Ground (CAT 5)
C
Blue
ProbeSync Clk
CLOCK_OUT_P of Master (CAT
5)
T
Brown
ProbeSync Clk
CLOCK_OUT_N of Master
(CAT 5)
0
Orange
ProbeSync Link
LINK_OUT of Master (CAT 5)
1
White/Orange
stripe
ProbeSync Clk
Select
CLOCK_SELECT of Master
(CAT 5)
2
Red
CH0
Data Connection (TX)
3
Orange
CH1
Data Connection (RX)
4
Yellow
RTS
Request to send
5
Green
CTS
Clear to send
6
Blue
DSR
Data Set Ready
7
Purple
DTR
Data Terminal Ready
8
Black
CD
Carrier Detect
9
Brown
RI
Ring Indicator
Signal
Meaning
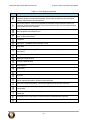
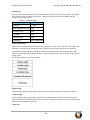
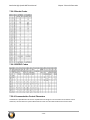
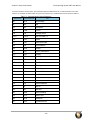
Table 2.2 - HSU Pin Out
Wire
Label
Label Wire Color
0
Black
CH 0
Data Connection
1
Brown
CH 1
Data Connection
2
Red
RTS
Request to Send
3
Orange
CTS
Clear to Send
4
Yellow
DSR
Data Set Ready
5
Green
DTR
Data Terminal Ready
6
Blue
CD
Carrier Detect
7
Violet
RI
Ring Indicator
TRG
White
Not Used
N/A
CLK
Gray
Not Used
N/A
Signal
-5-
Meaning
Chapter 2 Getting Started
ComProbe High Speed UART User Manual
Table 2.2 - HSU Pin Out (Continued)
Wire
Label
Label Wire Color
GND
Black
Signal
Ground
Meaning
Ground
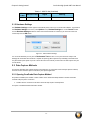
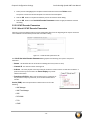
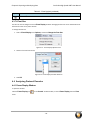
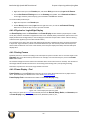
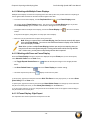
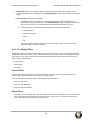
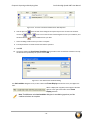
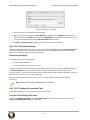
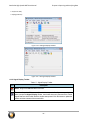
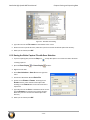
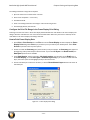
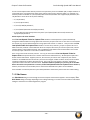
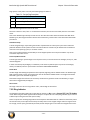
2.1.2 Hardware Settings
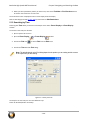
The Hardware Settings window appears automatically the first time you run ComProbe software. To get back to
the Hardware Settings menu later, select Options menu, Hardware Settings the on the Control window.
Use the Hardware Settings window to select which ComProbe HSU to monitor (if you have more than one
connected). Click the OK button.
Figure 2.1 - HSU Hardware Settings
It is recommended that you run your PC Performance Test. The HSU is a very CPU-intensive analyzer and
although the ComProbe HSU hardware is capable of capturing data at speeds of up to 8 Mbps, actual data rates
may be limited by the speed of your PC. The Performance Test will tell you the maximum data capture rate your
PC can handle.
2.2 Data Capture Methods
This section describes how to load Frontline Test Equipment, Inc ComProbe Protocol Analysis System software,
and how to select the data capture method for your specific application.
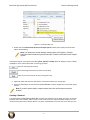
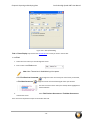
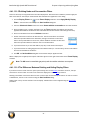
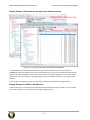
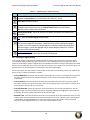
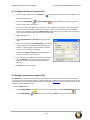
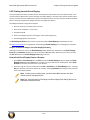
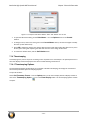
2.2.1 Opening ComProbe Data Capture Method
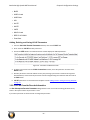
On product installation, the installer creates a folder on the windows desktop labeled "Frontline ComProbe
Protocol Analysis System <version#>".
1. Double-click the "Frontline ComProbe Protocol Analysis System" desktop folder
This opens a standard Windows file folder window.
-6-
ComProbe High Speed UART User Manual
Chapter 2 Getting Started
Figure 2.2 - Desktop Folder Link
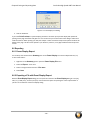
2. Double-click on Frontline ComProbe Protocol Analysis System and the system displays the Select Data
Capture Method dialog.
Note: You can also access this dialog by selecting Start > All Programs > Frontline
ComProbe Protocol Analysis System (Version #) > Frontline ComProbe Protocol Analysis
System
Three buttons appear at the bottom of the dialog; Run, Cancel, and Help. When the dialog first opens, Cancel
and Help are active, and the Run button is inactive (grayed out).
starts the selected protocol stack.
closes the dialog and exits the user back to the desktop.
takes the user to this help file as does pressing the F1 key.
3. Expand the folder and select the data capture method that matches your configuration.
4. Click on the Run button and the ComProbe Control Window will open configured to the selected capture
method.
Note: If you don't need to identify a capture method, then click the Run button to start the
analyzer.
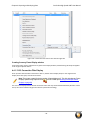
Creating a Shortcut
A checkbox labeled Create Shortcut When Run is located near the bottom of the dialog. This box is un-checked
by default. Select this checkbox, and the system creates a shortcut for the selected method, and places it in the
"Frontline ComProbe Protocol Analysis System <version#>" desktop folder and in the start menu when you click
-7-
Chapter 2 Getting Started
ComProbe High Speed UART User Manual
the Run button. This function allows you the option to create a shortcut icon that can be placed on the desktop. In
the future, simply double-click the shortcut to start the analyzer in the associated protocol.
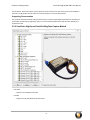
Supporting Documentation
The Frontline ComProbe Protocol Analysis System directory contains supporting documentation for development
(Automation, DecoderScript, application notes), user documentation (Quick Start Guides and User Manual), and
maintenance tools.
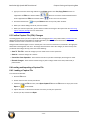
2.2.2 ComProbe High Speed Serial Sniffing Data Capture Method
l
Hardware
o
l
Requires one embedded ComProbe.
HCI-BCS
o
Captures and decodes BlueCord Serial Protocol.
-8-
ComProbe High Speed UART User Manual
l
HCI-H4
o
l
Captures and decodes HCI commands and events over the H5 transport.
HSU
o
l
Captures and decodes HCI commands and events over the H4DS transport.
HCI-H5
o
l
Captures and decodes HCI commands and events over the H4 transport.
HCI-H4DS
o
l
Chapter 2 Getting Started
Captures and decodes commands and events over the HSU Transport.
MWS WCI-2
o
Captures and decodes MWS-Bluetooth® controller command and events between the controller and MWS
chip.
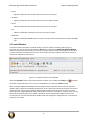
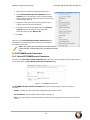
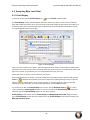
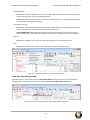
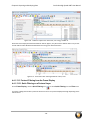
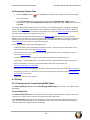
2.3 Control Window
The analyzer displays information in multiple windows, with each window presenting a different type of
information. The Control window opens when the Run button is clicked in the Select Data Capture Method
window. The Control window provides access to each ComProbe analyzer functions and settings as well as a brief
overview of the data in the capture file. Each icon on the toolbar represents a different data analysis function. A
sample Control Window is shown below.
Figure 2.3 - ComProbe Analyzer Control Window
Because the Control window can get lost behind other windows, every window has a Home icon
that brings
the Control window back to the front. Just click on the Home icon to restore the Control window.
When running the Capture File Viewer, the Control window toolbar and menus contain only those selections
needed to open a capture file and display the About box. Once a capture file is opened, the analyzer limits Control
window functions to those that are useful for analyzing data contained in the current file. Because you cannot
capture data while using Capture File Viewer, data capture functions are unavailable. For example, when viewing
Ethernet data, the Signal Display is not available. The title bar of the Control window displays the name of the
currently open file. The status line (below the toolbar) shows the configuration settings that were in use when the
capture file was created.
-9-
Chapter 2 Getting Started
ComProbe High Speed UART User Manual
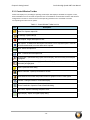
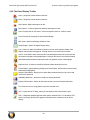
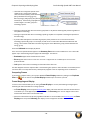
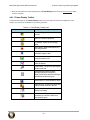
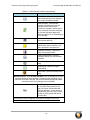
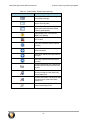
2.3.1 Control Window Toolbar
Toolbar icon displays vary according to operating mode and/or data displayed. Available icons appear in color,
while unavailable icons are not visible. Grayed-out icons are available for the ComProbe hardware and software
configuration in use but are not active until certain operating conditions occur. All toolbar icons have
corresponding menu bar items or options.
Table 2.3 - Control Window Toolbar Icon List
Icon
Description
Open File - Opens a capture file.
I/O Settings - Opens settings
Start Capture - Begins data capture to disk
Stop Capture - Available after data capture has started. Click to stop data capture. Data can
be reviewed and saved, but no new data can be captured.
Save - Saves the capture file.
Clear - Clears or saves the capture file.
Event Display - (framed data only) Opens a Event Display, with the currently selected bytes
highlighted.
Frame Display - (framed data only) Opens a Frame Display, with the frame of the currently
selected bytes highlighted.
Notes - Opens the Notes dialog.
Statistics Window - Opens up the Statistics window.
Open Breakout Box window that provides a real-time graphical view of control signals.
Cascade - Arranges windows in a cascaded display.
Extract Data/Audio - Opens the Extract Data/Audio dialog.
MSC Chart - Opens the Message Sequence Chart
Signal Display - Opens The Signal Display dialog.
- 10 -
ComProbe High Speed UART User Manual
Chapter 2 Getting Started
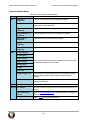
2.3.2 Configuration Information on the Control Window
The Configuration bar (just below the toolbar) displays the hardware configuration and may include I/O settings. It
also provides such things as name of the network card, address information, ports in use, etc.
2.3.3 Status Information on the Control Window
The Status bar located just below the Configuration bar on the Control window provides a quick look at current
activity in the analyzer.
l
l
Capture Status, or Status for Sodera, displays Not Active, Paused or Running and refers to the state of data
capture
o
Not Active means that the analyzer is not currently capturing data.
o
Paused means that data capture has been suspended.
o
Running means that the analyzer is actively capturing data.
% Used
The next item shows how much of the buffer or capture file has been filled. For example, if you are
capturing to disk and have specified a 200 Kb capture file, the bar graph tells you how much of the capture
file has been used. When the graph reaches 100%, capture either stops or the file begins to overwrite the
oldest data, depending on the choices you made in the System Settings.
l
Utilization/Events
The second half of the status bar gives the current utilization and total number of events seen on the
network. This is the total number of events monitored, not the total number of events captured. The
analyzer is always monitoring the circuit, even when data is not actively being captured. These graphs
allow you to keep an eye on what is happening on the circuit, without requiring you to capture data.
2.3.4 Frame Information on the Control Window
Frame Decoder information is located just below the Status bar on the Control window. It displays two pieces of
information.
l
Frame Decoder (233 fps) displays the number of frames per second being decoded. You can toggle this
display on/off with Ctrl-D, but it is available only during a live capture.
l
#132911 displays the total frames decoded.
l
100% displays the percentage of buffer space used.
- 11 -
Chapter 2 Getting Started
ComProbe High Speed UART User Manual
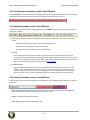
2.3.5 Control Window Menus
The menus appearing on the Control window vary depending on whether the data is being captured live or
whether you are looking at a .cfa file. The following tables describe each menu.
Table 2.4 - Control Window File Menu Selections
Hot
Selection
Description
Key
Mode
Live
Close
Closes Live mode.
Capture
File
Go Live
Returns to Live mode
Reframe
If you need to change the protocol stack used to interpret a
capture file and the framing is different in the new stack, you
need to reframe in order for the protocol decode to be correct. See
Reframing on page 35
Unframe
Removes start-of-frame and end-of-frame markers from your
data. SeeUnframing on page 36
Recreate
Companion File
This option is available when you are working with decoders. If
you change a decoder while working with data, you can recreate
the ".frm file", the companion file to the ".cfa file". Recreating the
".frm file" helps ensure that the decoders will work properly.
Reload Decoders
The plug-ins are reset and received frames are decoded again.
Live &
Capture
File
Open Capture File
Ctrl- Opens a Windows Open file dialog. at the default location
-O
"...\Public Documents\Frontline Test Equipment\My Capture
Files\". Capture files have a .cfa extension.
Save
Ctrl- Saves the current capture or capture file. Opens a Windows
S
Save As dialog at the default location "...\Public
Documents\Frontline Test Equipment\My Capture Files\".
Exit ComProbe
Protocol Analysis
System
Shuts down the ComProbe Protocol Analysis System and all
open system windows.
Recent capture files
A list of recently opened capture files will appear.
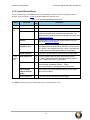
The View menu selections will vary depending on the ComProbe analyzer in use.
- 12 -
ComProbe High Speed UART User Manual
Mode
Live &
Capture
File
Selection
Table 2.5 - Control Window View Menu Selections
Hot key
Description
Event Display
CtrlShift-E
Opens the Event Display window for analyzing byte level
data.
Frame Display
CtrlShift-M
Opens the Frame Display window for analyzing protocol
level data
Statistics
CtrlShift-S
Opens the Statistics Window that shows information about
packet throughput.
Signal Display
CtrlShift-N
Opens the Signal Display window that provides a graphical
display of control signal transitions.
Breakout Box
Ctrl_
Shift-B
Opens the Breakout Box window that provides a real-time
graphical view of control signal changes.
Extract Data Audio...
Notes
Mode
Live
Opens the Data/Audio Extraction dialog for pulling data from
decoded Bluetooth protocols.
Table 2.6 - Control Window Edit Menu Selections
HotSelection
Description
key
Mode
Capture
File
Chapter 2 Getting Started
CtrlOpens the Notes window that allows the user to add
Shift-O comments to a capture file.
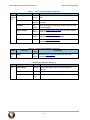
Selection
Control Window Live Menu Selections
Hot-Key
Description
Start Capture
Shift-F5
Begins data capture from the configured wireless
devices.
Stop Capture
F10
Stops data capture from the configured wireless devices.
Clear
ShiftF10
Clears or saves the capture file.
- 13 -
Chapter 2 Getting Started
Mode
Live &
Capture
File
ComProbe High Speed UART User Manual
Table 2.7 - Control Window Options Menu Selections
HotSelection
Description
Key
0 - Classic
Hardware Settings
1 - Bluetooth low energy
0 - Classic
I/O Settings
1 - Bluetooth low energy
System Settings
AltEnter
Opens the System Settings dialog for configuring capture
files.
Directories...
Opens the File Locations dialog where the user can change
the default file locations.
Check for New
Releases at Startup
When this selection is enabled, the program automatically
checks for the latest Frontline protocol analyzer software
releases.
Side Names...
Opens the Side Names dialog used to customize the names
of the slave and master wireless devices.
Protocol Stack...
Opens the Select a Stack dialog where the user defines the
protocol stack they want the analyzer to use when decoding
frames.
Set Initial Decoder
Parameters...
Opens the Set Initial Decoder Parameters window. Each
entry in the window takes effect from the beginning of the
capture onward or until redefined in the Set Subsequent
Decoder Parameters dialog. This selection is not present if no
decoder is loaded that supports this feature.
Set Subsequent
Decoder
Parameters...
Opens the Set Subsequent Decoder Parameters dialog
where the user can override an existing parameter at any
frame in the capture. Each entry takes effect from the
specified frame onward or until redefined in this dialog on a
later frame. This selection is not present if no decoder is
loaded that supports this feature.
Automatically
Request Missing
Decoder Information
When checked, this selection opens a dialog that asking for
missing frame information. When unchecked, the analyzer
decodes each frame until it cannot go further and it stops
decoding. This selection is not present if no decoder is loaded
that supports this feature.
Enable/Disable
Audio Expert
System
When enabled, the Audio Expert System is active, other wise
it is not available. Only available when an Audio Expert
System licensed device is connected.
The Windows menu selection applies only to the Control window and open analysis windows: Frame Display,
Event Display, Message Sequence Chart, Bluetooth Timeline, Bluetooth low energy Timeline, and
Coexistence View. All other windows, such as the datasource, are not affected by these selections.
- 14 -
ComProbe High Speed UART User Manual
Mode
Live &
Capture
File
Mode
Live &
Capture
File
Chapter 2 Getting Started
Table 2.8 - Control Window Windows Menu Selections
Selection
Hot-Key
Description
Cascade
Ctrl-W
Arranges open analysis windows in a cascaded view with
window captions visible.
Close All Views
Closes Open analysis windows.
Minimize Control
Minimizes All
When checked, minimizing the Control window also
minimizes all open analysis windows.
Frame Display and
Event Display
When these windows are open the menu will display these
selections. Clicking on the selection will bring that window to
the front.
Selection
Control Window Help Menu Selections
Hot-Key
Description
Help Topics
Opens the ComProbe Help window.
About ComProbe
Protocol Analysis
System
Provides a pop-up showing the version and release
information, Frontline contact information, and copyright
information.
Support on the Web
Opens a browser to fte.com technical support page.
2.3.6 Minimizing Windows
Windows can be minimized individually or as a group when the Control window is minimized. To minimize
windows as a group:
1. Go to the Window menu on the Control
window.
2. Select Minimize Control Minimizes All. The analyzer puts a check next to the menu item, indicating
that when the Control window is minimized, all windows are minimized.
3. Select the menu item again to deactivate this feature.
4. The windows minimize to the top of the operating system Task Bar.
- 15 -
Chapter 3 Configuration Settings
In this section the ComProbe software is used to configure an analyzer for capturing data .
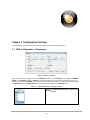
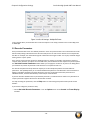
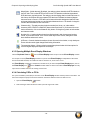
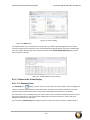
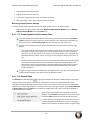
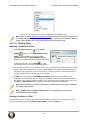
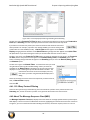
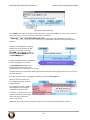
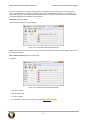
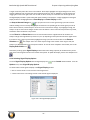
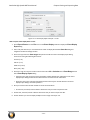
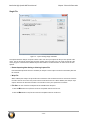
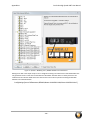
3.1 HSU Configuration - Datasource
Figure 3.1 HSU I/O Settings
There are two groups of settings, one for the Channel 0, and one for the Channel 1. To change the Bit Rate,
Parity, word Length or number of Stop bits, click on the down arrow next to the setting box and choose an
option from the list. For Bit Rate, you can either choose a listed rate or enter a rate. After entering the settings
for Channel 0, click the Copy CH0 button to apply the same settings to the Channel 1 row.
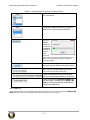
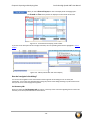
Table 3.2 - ComProbe HSU I/O Settings Controls
Specifies the expected packet parity, or whether to
Ignore the parity.
- 16 -
ComProbe High Speed UART User Manual
Chapter 3 Configuration Settings
Table 3.2 - ComProbe HSU I/O Settings Controls(continued)
The number of data bits in the expected packet. 8
Bits is the default.
The number of data bits held in the mark (logic 1)
condition at the end of the expected packet.
When the
Auto Bit
Rate button
is clicked the
the Auto Bit
Rate dialog
will open
while
ComProbe
HSU hardware attempts to automatically determine
the bit rate. A bar graph will appear to show the
detection progress.
After setting Channel 0, click the Copy Ch0
button will copy the channel 0 settings to channel 1.
When check will change the logical polarity of the
data stream from the device under test.
Displays the maximum bit rate for the computer
that the ComProbe HSU hardware is connected to.
Used in conjunction with Multiple Bit Rates; see
discussion below. Will appear only if Multiple Bit
Rates is checked. Specifies that the bit rates will
change in ascending order.
Click the OK button.
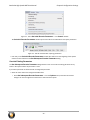
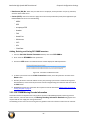
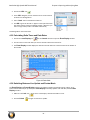
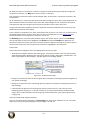
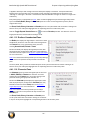
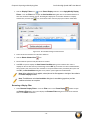
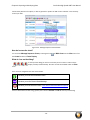
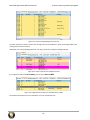
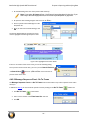
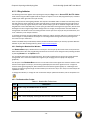
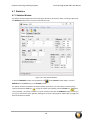
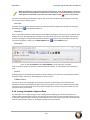
Some implementations call for changing the bit rate mid-stream. If your device does this, click the Multiple Bit
Rates checkbox and you may enter up to three different bit rates, each in sequence:
- 17 -
Chapter 3 Configuration Settings
ComProbe High Speed UART User Manual
Figure 3.3 HSU I/O Settings - Multiple Bit Rates
In the example above, the ComProbe HSU would start capture at 115.2 kbps, and then move to 230.4 kbps, then
to 460.8 kbps.
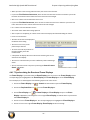
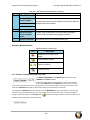
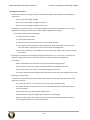
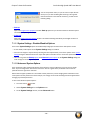
3.2 Decoder Parameters
Some protocol decoders have user-defined parameters. These are protocols where some information cannot be
discovered by looking at the data and must be entered by the user in order for the decoder to correctly decode
the data. For example, such information might be a field where the length is either 3 or 4 bytes, and which length
is being used is a system option.
There may be times when the context for decoding a frame is missing. For example, if the analyzer captures a
response frame but does not capture the command frame, then the decode for the response may be incomplete.
The Set Initial Decoder Parameters window allows you to supply the context for any frame. The dialog allows
you to define any number of parameters and save them in a template for later use
The decoder template function provides the capacity to create multiple templates that contain different
parameters. This capability allows you to maintain individual templates for each Bluetooth® network monitored.
Applying a template containing only those parameters necessary to decode transmissions particular to an
individual network, enhances the efficiency of the analyzer to decode data.
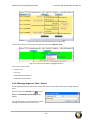
If you have decoders loaded which require decoder parameters, a window with one tab for every decoder that
requires parameters appears the first time the decoder is loaded.
For help on setting the parameters, click the Help button on each tab to get help information specific to that
decoder.
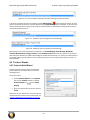
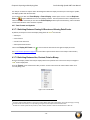
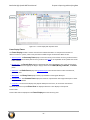
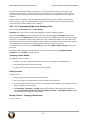
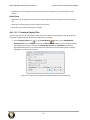
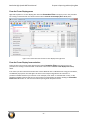
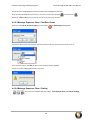
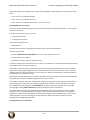
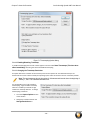
If you need to change the parameters later,
l
Choose Set Initial Decoder Parameters... from the Options menu on the Control and Frame Display
windows.
- 18 -
ComProbe High Speed UART User Manual
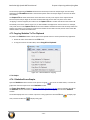
Chapter 3 Configuration Settings
Figure 3.1 - Select Set Initial Decoder Parameters... from Control window
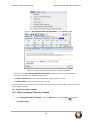
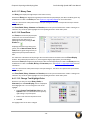
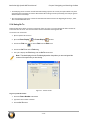
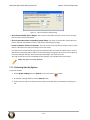
The Set Initial Decoder Parameters window opens with a tab for each decoder that requires parameters.
Figure 3.2 - Tabs for each decoder requiring parameters.
l
Each entry in the Set Initial Decoder Parameters window takes effect from the beginning of the capture
onward or until redefined in the Set Subsequent Decoder Parameters dialog.
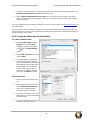
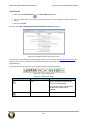
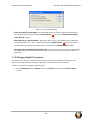
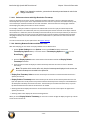
Override Existing Parameters
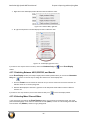
The Set Subsequent Decoder Parameters dialog allows the user to override an existing parameter at any
frame in the capture where the parameter is used.
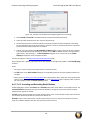
If you have a parameter in effect and wish to change that parameter
l
Select the frame where the change should take effect
l
Select Set Subsequent Decoder Parameters... from the Options menu, and make the needed
changes. You can also right-click on the frame to select the same option.
- 19 -
Chapter 3 Configuration Settings
ComProbe High Speed UART User Manual
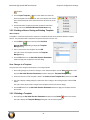
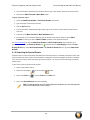
Figure 3.3 - Set Subsequent Decoder Parameters... from Control window
Figure 3.4 - Example: Set Subsequent Decode for Frame #52, RFCOMM
l
Each entry in the Set Subsequent Decoder Parameters dialog takes effect from the specified frame
onward or until redefined in this dialog on a later frame.
l
The Remove Override button will remove the selected decode parameter override.
l
The Remove All button will remove all decoder overrides.
If you do not have decoders loaded that require parameters, the menu item does not appear and you don't need
to worry about this feature.
3.2.1 Decoder Parameter Templates
3.2.1.1 Select and Apply a Decoder Template
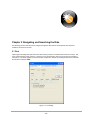
1. Select Set Initial Decoder Parameters... from the Options menu on the Control
the Frame Display
- 20 -
window or
ComProbe High Speed UART User Manual
Chapter 3 Configuration Settings
window.
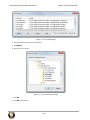
2. Click the Open Template
icon in the toolbar and select the
desired template from the pop up list. The system displays the content
of the selected template in the Initial Connections list at the top of the
dialog
3. Click the OK button to apply the selected template and decoders'
settings and exit the Set Initial Decoder Parameters dialog.
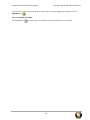
3.2.1.2 Adding a New or Saving an Existing Template
Add a Template
A template is a collection of parameters required to completely decode communications between multiple
devices. This procedure adds a template to the system and saves it for later use:
1. Click the Save
button at the top of the Set Initial
Decoder Parameters dialog to display the Template
Manager dialog.
2. Enter a name for the new template and click OK.
The system saves the template and closes the Template
Manager dialog.
3. Click the OK button on the Set Initial Decoder Parameters
window to apply the template and close the dialog.
Save Changes to a Template
This procedure saves changes to parameters in an existing template.
1. After making changes to parameter settings in a user defined template, click the Save
button at the
top of the Set Initial Decoder Parameters window to display the Template Manager dialog.
2. Ensure that the name of the template is listed in the Name to Save Template As text box and click OK.
3. The system displays a dialog asking for confirmation of the change to the existing template. Click the Yes
button.
The system saves the parameter changes to the template and closes the Save As dialog.
4. Click the OK button on the Set Initial Decoder Parameters window to apply the template and close
the window.
3.2.1.3 Deleting a Template
1. After opening the Set Initial Decoder Parameters window click the Delete
The system displays the Template Manager dialog with a list of saved templates.
- 21 -
button in the toolbar.
Chapter 3 Configuration Settings
ComProbe High Speed UART User Manual
2. Select (click on and highlight) the template marked for deletion and click the Delete button.
The system removes the selected template from the list of saved templates.
3. Click the OK button to complete the deletion process and close the Delete dialog.
4. Click the OK button on the Set Initial Decoder Parameters window to apply the deletion and close
the dialog.
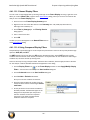
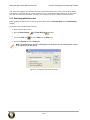
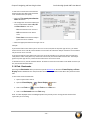
3.2.2 L2CAP Decoder Parameters
3.2.2.1 About L2CAP Decoder Parameters
Each entry in the Set Initial Decoder Parameters dialog takes effect from the beginning of the capture onward or
until redefined in the Set Subsequent Decoder Parameters dialog.
Figure 3.5 - L2CAP Decoder parameters tab
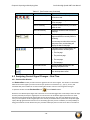
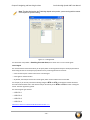
The L2CAP Set Initial Decoder Parameters dialog requires the following user inputs to complete a
Parameter :
l
Stream - This identifies the role of the device initiating the frame (master or slave)
l
Channel ID - The channel number 0 through 78
l
l
Address - This is the physical connection values for the devices. Each link in the net will have an address. A
piconet can have up to seven links. The Frame Display can provide
address information.
Data Source (DS) No. -When only one data source is employed, set
this parameter to 0 (zero), otherwise, set to the desired data source
number.
Carries (PSM) - Select the protocol that L2CAP traverses to from the
following:
l
AMP Manager
l
AMP Test Manager
l
SDP
l
RFCOMM
l
TCS
l
LPMP
- 22 -
ComProbe High Speed UART User Manual
l
BNEP
l
HCRP Control
l
HCRP Data
l
HID
l
AVCTP
l
AVDTP
l
CMTP
l
MCAP Control
l
IEEE P11073 20601
l
-Raw Data-
Chapter 3 Configuration Settings
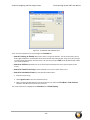
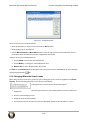
Adding, Deleting, and Saving L2CAP Parameters
1. From the Set Initial Decoder Parameters window, click on the L2CAP tab.
2. Set or select the L2CAP decoder parameters.
3. Click on the ADD button. The Intial Connection window displays the added parameters.
Figure 3.6 - Parameters Added to Decoder
4. To delete a parameter from the Initial Connections window, select the parameter and click on the
Delete button.
5. Decoder parameters cannot be edited. The only way to change a parameter is to delete the original as
described above, and recreate the parameter with the changed settings and selections and then click on
the Add button.
6. L2CAP parameters are saved when the template is saved. Adding a New or Saving an Existing Template
on page 21
3.2.2.2 L2CAP Override Decode Information
The Set Subsequent Decoder Parameters dialog allows the user to override an existing parameter at any
frame in the capture where the parameter is used.
If you have a parameter in effect and wish to change that parameter:
- 23 -
Chapter 3 Configuration Settings
ComProbe High Speed UART User Manual
1. Select the frame where the change should take effect
2. Select Set Subsequent Decoder Parameters from the
Options menu, or by selecting a frame in the frame display
and choosing from the right-click pop-up menu, and make the
needed changes. Refer to
3. Change the L2CAP parameter by selecting from the rule to
change, and click on the listed parameters.
4. If you wish to remove an overridden rule click on Remove
Override button. If you want to remove all decoder
parameter settings click on Remove All.
5. Click OK.
Each entry in the Set Subsequent Decoder Parameters dialog
takes effect from the specified frame onward or until redefined in
this dialog on a later frame.
Note: If the capture has no user defined overrides, then the
system displays a dialog stating that no user defined overrides
exist.
3.2.3 RFCOMM Decoder Parameters
3.2.3.1 About RFCOMM Decoder Parameters
Each entry in the Set Initial Decoder Parameters dialog takes effect from the beginning of the capture onward
or until redefined in the Set Subsequent Decoder Parameters dialog.
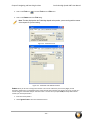
Figure 3.7 - RFCOMM parameters tab
The RFCOMM Set Initial Decoder Parameters tab requires the following user inputs to complete a
parameter:
l
Stream - Identifies the role of the device initiating the frame (master or slave)
l
Server Channel - The Bluetooth® channel number 0 through 78
l
DLCI - This is the Data Link Connection Identifier, and identifies the ongoing connection between a client and
a server
- 24 -
ComProbe High Speed UART User Manual
l
l
Chapter 3 Configuration Settings
Data Source (DS) No.- When only one data source is employed, set this parameter to 0 (zero), otherwise,
set to the desired data source
Carries (UUID) - Select from the list to apply the Universal Unique Identifier (UUID) of the application layer
that RFCOMM traverses to from the following:
o
OBEX
o
SPP
o
encap asyncPPP
o
Headset
o
FAX
o
Hands Free
o
SIM Access
o
VCP
o
UDI
o
-Raw Data-
Adding, Deleting, and Saving RFCOMMParameters
1. From the Set Initial Decoder Parameters window, click on the RFCOMMtab.
2. Set or select the RFCOMMdecoder parameters.
3. Click ont he ADD button. The Intial Connection window displays the added parameters.
Figure 3.8 - Parameters Added to Decoder
4. To delete a parameter from the Initial Connections window, select the parameter and click on the
Delete button.
5. Decoder parameters cannot be edited. The only way to change a parameter is to delete the original as
described above, and recreate the parameter with the changed settings and selections and then click on
the Add button.
6. RFCOMM parameters are saved when the template is saved as described in Adding a New or Saving an
Existing Template on page 21
3.2.3.2 RFCOMM Missing Decode Information
ComProbe software usually determines the protocol carried in an RFCOMM payload by monitoring previous
traffic. However, when this fails to occur, the Missing Decoding Information Detected dialog appears and
requests that the user supply the missing information.
The following are the most common among the many possible reasons for a failure to determine the traversal:
- 25 -
Chapter 3 Configuration Settings
ComProbe High Speed UART User Manual
l
The capture session started after transmission of the vital information
l
The analyzer incorrectly received a frame with the traversal information
l
The communication monitored takes place between two players with implicit information not included in the
transmission
In any case, either view the RFCOMM payload of this frame (and other frames with the same channel) as hex data,
or assist the analyzer by selecting a protocol using this dialog.
Note that you may use the rest of the analyzer without addressing this dialog. Additional information gathered
during the capture session may help you decide how to respond to the request for decoding information.
If you are not sure of the payload carried by the subject frame, look at the raw data shown under data in the
Decode pane in the Frame Display. You may notice something that hints as to the profile in use.
In addition, look at some of the frames following the one in question. The data may not be recognizable to the
analyzer at the current point due to connection setup, but might be discovered later on in the capture.
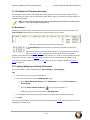
3.2.3.3 RFCOMM Override Decode Information
The Set Subsequent Decoder Parameters dialog allows the user to override an existing parameter at any
frame in the capture where the parameter is used.
If you have a parameter in effect and wish to change that parameter:
1. Select the frame where the change should take effect, and
select Set Subsequent Decoder Parameters from the
Options menu, or by selecting a frame in the frame display
and choosing from the right-click pop-up menu, and make
the needed changes.
2. Change the RFCOMM parameter by selecting from the
Change the Selected Item to Carry drop down list.
3. If you wish to remove an overridden rule click on Remove
Override button. If you want to remove all decoder
parameter settings click on Remove All.
4. Choose the protocol the selected item carries from the
drop-down list, and click OK.
Each entry in the Set Subsequent Decoder Parameters dialog
takes effect from the specified frame onward or until redefined in
this dialog on a later frame.
- 26 -
ComProbe High Speed UART User Manual
Chapter 3 Configuration Settings
Figure 3.9 - Set Subsequent Decoder Parameters selection list
Note: If the capture has no user defined overrides, then the system displays a dialog stating that
no user defined overrides exist.
- 27 -
Chapter 4 Capturing and Analyzing Data
The following sections describe the various ComProbe software functions that capture and display data packets.
4.1 Capture Data
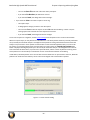
4.1.1 Capturing Data to Disk - General Procedure
Note: Capture is not available in Viewer mode.
1. Click the Start Capture button
to begin capturing to a file. This icon is located on the Control ,
Event Display, and Frame Display windows.
2. Files are placed in My Capture Files by default and have a .cfa extension. Choose Directories from the
Options menu on the Control window to change the default file location.
Note: For the Dashboard, when you capture to series of files, the window displays the data
from the beginning of the first capture, even when a new file in the series is created. This is
because the Dashboard is a "Session Monitor", which means that even if you capture to a
series of files, the data from the first file is always displayed. The display does not refresh
when a new capture file in a series is created.
3. Watch the status bar on the Control window to monitor how full the file is. When the file is full, it begins
to wrap, which means the oldest data will be overwritten by new data.
4. Click the Stop Capture icon
to temporarily stop data capture. Click the Start Capture icon again to
resume capture. Stopping capture means no data will be added to the capture file until capture is
resumed, but the previously captured data remains in the file.
5. To clear captured data, click the Clear icon
l
.
If you select Clear after selecting Stop Capture, a dialog appears asking whether you want to save
the data.
- 28 -
ComProbe High Speed UART User Manual
l
Chapter 4 Capturing and Analyzing Data
o
You can click Save File and enter a file name when prompted .
o
If you choose Do Not Save, all data will be cleared.
o
If you choose Cancel, the dialog closes with no changes.
If you select the Clear icon while a capture is occurring:
o
The capture stops.
o
A dialog appears asking if you want to save the capture
o
You can select Yes and save the capture or select No and close the dialog. In either case, the
existing capture file is cleared and a new capture file is started.
o
If you choose Cancel, the dialog closes with no changes.
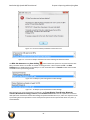
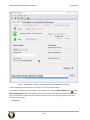
To see how to capture to a single file, choose System Settings from the Options menu on the Control window.
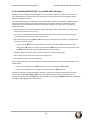
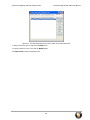
When live capture stops, no new packets are sniffed but there can still be packets that were previously sniffed but
not yet read by the ComProbe analyzer. This happens when packets are being sniffed faster than the ComProbe
analyzer can process them. These packets are stored either on the ComProbe hardware itself or in a file on the
PC. If there are remaining packets to be processed when live capture stops the Transferring Packets dialog
below is displayed showing the packets yet to be read by the ComProbe analyzer. The dialog shows the name of
each ComProbe hardware device, its process id in square brackets, and the number of packets remaining. These
stored packets are read until they’re exhausted or the user clicks the Discard button on the dialog.
Unlike 802.11, Bluetooth packets never come in faster than the datasource can process them. However, Bluetooth
packets must still be stored so that they can be read in chronological order with the 802.11 packets.
Figure 4.1 - Packet Transfer Dialog
- 29 -
Chapter 4 Capturing and Analyzing Data
ComProbe High Speed UART User Manual
4.1.2 Combining BPA 600, 802.11, and HSU with ProbeSync
ProbeSync™ allows multiple ComProbe analyzers to work seamlessly together and to share a common clock.
Clock sharing allows the analyzers to precisely synchronize communications stream and to display resulting
packets in a single shared view.
The ComProbe BPA 600, ComProbe 802.11, and ComProbe HSU analyzers have ProbeSync capability allowing
timestamp synchronization of captured data. Synchronizing the clock for these ComProbe devices used in
combination requires attention to the sequence of hardware connection. It is important to remember the
following key points.
l
l
l
ComProbe devices are connected serially in a daisy-chain fashion. The combined length of all cables in the
chain cannot exceed 1.5 meters (4.5 ft.).
The "master" ComProbe device provides the clock to the other devices. All other ComProbe devices are
"slaves" and received the clock from the "master" device.
On ComProbe devices with an OUT and IN connector, the function of these connectors is dependent on if
they are a "master" or a "slave".
o
"master" device: OUT connector provides the clock to all "slave" devices. IN connector is not used.
o
"slave" device: IN connector receives the clock from the OUT connector of the prior device in the chain.
The OUT connector is just a pass-through connector on a "slave" device.
l
BPA 600 is always the "master" device and the first device in the chain, if being used.
l
HSU is always the last "slave" device in the chain, if being used.
l
HSU maximum capture data rate is 6 Mbit/sec.
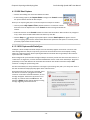
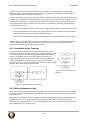
Connecting ComProbe BPA 600, ComProbe 802.11, and ComProbe HSU devices in ProbeSync takes place in the
following steps.
1. Connect the ComProbe BPA 600 OUT connector to the ComProbe 802.11 IN connector.
2. Connect the ComProbe HSU Cat 5 cable to the ComProbe 802.11 OUT connector.
Each device datasource is setup individually to sniff their respective link. Should the hardware be connected
incorrectly, that is IN to IN or OUT to OUT, an error message will appear. Follow the instructions in error
message. To continue click on the OK button. The ComProbe device datasource Status window will also display a
warning message suggesting information sources.
- 30 -
ComProbe High Speed UART User Manual
Chapter 4 Capturing and Analyzing Data
Figure 4.2 - Incorrect ProbeSync Hardware Connection Error
Figure 4.3 - Incorrect ProbeSync Hardware Connection Message In Datasource Status
The BPA 600 datasource dialog Start Sniffing
button initiates the capture for all connected ComProbe
802.11 and HSU devices. On the 802.11 and HSU receiving the clock—cable connected to IN— the Start
Sniffing button is disabled when using ProbeSync. In each ComProbe device's Control window status window
will announce the synchronizing function.
Figure 4.4 - ProbeSync Synchronizing Device Status Message
Figure 4.5 - ProbeSync Synchronized Device Status Message
Data captured in the synchronized device will appear in the Frame Display, Event Display, Bluetooth
Timeline, Bluetooth low energy Timeline, and Coexistence View. Data saved as a capture file will include
data captured on each devices. Within these dialogs the packets identified as link 1, 2, and 3 were captured on the
synchronizing device that provides the clock. Those packets captured on the synchronized device carry link 4, 5,
and 6 identifiers.
- 31 -
Chapter 4 Capturing and Analyzing Data
ComProbe High Speed UART User Manual
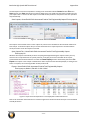
4.1.3 HSU Start Capture
l
l
Click the Start Sniffing icon on the HSU datasource toolbar.
As data is being captured, the Capture Status message in the Control window indicates
the synchronization status of the HSU analyzer.
When you are capturing data, there are several important concepts to consider.
l
l
l
Files are placed in My Capture Files by default and have a .cfa extension. Choose
Directories from the Options menu on the Control window to change the default file
location.
Watch the status bar on the Control window to monitor how full the file is. When the file is full, it begins to
wrap , which means the oldest data will be overwritten by new data.
Click the Stop icon
to temporarily stop data capture. Click the Start Capture icon again to resume
capture. Stopping capture means no data will be added to the capture file until capture is resumed, but the
previously captured date remains in the file.
4.1.3.1 HSU Capture with ProbeSync
ProbeSync™ allows multiple ComProbe analyzers to work seamlessly together and to share a common clock.
Clock sharing allows the analyzers to precisely synchronize communications stream and to display resulting
packets in a single shared view. When capturing data with the ComProbe HSU using ProbeSync the maximum
capture data rate is 6 Mbit/sec.
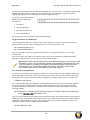
When configured for synchronization through ProbeSync one device provides the clock to the other device in a
"master-slave" arrangement, not to be confused with Bluetooth® device master-slave relationships. The clock is
provided by a CAT 5 cable between the ComProbe HSU hardware with another ComProbe analyzer OUT
connector—sending the synchronizing clock.
The HSU with ProbeSync is always the device receiving the synchronizing clock, that is, it is always the "slave" in
the chain and thus will always physically appear at the end of the chain.
Should the hardware be incorrectly connected , that is
the HSU CAT 5 connector is plugged into to an IN
connector on the other ComProbe hardware, an error
message will appear. Follow the instructions in error
message. To continue click on the OK button. The
datasource Status window will also display a warning
message suggesting information sources.
- 32 -
ComProbe High Speed UART User Manual
Chapter 4 Capturing and Analyzing Data
Figure 4.6 - Incorrect ProbeSync Hardware Connection Message In Datasource Status
In the device providing the clock, the datasource dialog Start Sniffing
button initiates the capture for both
devices. On the HSU receives the clock the datasource dialog Start Sniffing button is disabled . In the ComProbe
device providing the synchronizing clock, that device's status window in the Datasource dialog will announce the
synchronizing function of each.
Figure 4.7 - ProbeSync Synchronizing Device Status Message
Figure 4.8 - ProbeSync Synchronized Device Status Message
Data captured in the synchronized device will appear in the Frame Display, Event Display, Bluetooth
Timeline, Bluetooth low energy Timeline, and Coexistence View. Data saved as a capture file will include
data captured on both devices. Within these dialogs the packets identified as link 1, 2, and 3 were captured on the
synchronizing device that provides the clock. Those packets captured on the synchronized device carry link 4, 5,
and 6 identifiers.
4.2 Protocol Stacks
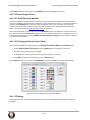
4.2.1 Protocol Stack Wizard
The Protocol Stack wizard is where you define the
protocol stack you want the analyzer to use when
decoding frames.
To start the wizard:
1. Choose Protocol Stack from the Options
menu on the Control window or click the
Protocol Stack icon
on the Frame
Display.
2. Select a protocol stack from the list, and click
Finish.
Most stacks are pre-defined here. If you have special
requirements and need to set up a custom stack, see
Creating and Removing a Custom Stack on page 34.
- 33 -
Chapter 4 Capturing and Analyzing Data
ComProbe High Speed UART User Manual
1. If you select a custom stack (i.e. one that was defined by a user and not included with the analyzer), the
Remove Selected Item From List button becomes active.
2. Click the Remove Selected Item From Listbutton to remove the stack from the list. You cannot
remove stacks provided with the analyzer. If you remove a custom stack, you need to define it again in
order to get it back.
If you are changing the protocol stack for a capture file, you may need to reframe. See Reframing on page 35 for
more information.
You cannot select a stack or change an existing one for a capture file loaded into the Capture File Viewer (the
Capture File Viewer is used only for viewing capture files and cannot capture data). Protocol Stack changes can
only be made from a live session.
4.2.2 Creating and Removing a Custom Stack
To create a custom stack:
1. Choose Protocol Stack from the
Options menu on the Control
window or click the Protocol Stack
icon
on the Frame Display
toolbar.
2. Select Build Your Own from the list
and click Next.
3. The system displays an information
screen that may help you decide if
you need to define your own custom
stack. Defining a custom stack means
that the analyzer uses the stack for
every frame. Frames that do not
conform to the stack are decoded
incorrectly. Click Next to continue.
Select Protocols
1. Select a protocol from the list on the
left.
2. Click the right arrow button to move it
to the Protocol Decode Stack box
on the right, or double-click the
protocol to move it to the right.
3. To remove a protocol from the stack,
double-click it or select it and click the
left arrow button.
4. If you need to change the order of the
protocols in the stack, select the
- 34 -
ComProbe High Speed UART User Manual
Chapter 4 Capturing and Analyzing Data
protocol you want to move, and click on the Move Up and Move Down buttons until the protocol is in
the correct position.
5. The lowest layer protocol is at the top of the list, with higher layer protocols listed underneath.
Auto-traversal (Have the analyzer Determine Higher Layers)
If you need to define just a few layers of the protocol stack, and the remaining layers can be determined based on
the lower layers:
1. Click the All additional stack layers can be determined automatically button.
2. If your protocol stack is complete and there are no additional layers, click the There are no additional
stack layers button.
3. If you select this option, the analyzer uses the stack you defined for every frame. Frames that do use this
stack are decoded incorrectly.
Save the Stack
1. Click the Add To Predefined List button.
2. Give the stack a name, and click Add.
In the future, the stack appears in the Protocol Stack List on the first screen of the Protocol Stack wizard.
Remove a Stack
1. Select it in the first screen and click Remove Selected Item From List.
2. If you remove the stack, you must to recreate it if you need to use it again.
Note: If you do not save your custom stack, it does appear in the predefined list, but applies to the
frames in the current session. However, it is discarded at the end of the session.
4.2.3 Reframing
If you need to change the protocol stack used to interpret a capture file and the framing is different in the new
stack, you need to reframe in order for the protocol decode to be correct. You can also use Reframe to frame
unframed data. The original capture file is not altered during this process.
Note: You cannot reframe from the Capture File Viewer (accessed by selecting Capture File
Viewer or Load Capture File to start the software and used only for viewing capture files).
To reframe your data, load your capture file, select a protocol stack, and then select Reframe from the File
menu on the Control window. Reframe is only available if the frame recognizer used to capture the data is
different from the current frame recognizer.
In addition to choosing to Reframe, you can also be prompted to Reframe by the Protocol Stack Wizard.
1. Load your capture file by choosing Open from the File menu on the Control window, and select the file
to load.
- 35 -
Chapter 4 Capturing and Analyzing Data
ComProbe High Speed UART User Manual
2. Select the protocol stack by choosing Protocol Stack from the Options menu on the Control window,
select the desired stack and click Finish.
3. If you selected a protocol stack that includes a frame recognizer different from the one used to capture
your data, the Protocol Stack Wizard asks you if you want to reframe your data. Choose Yes.
4. The analyzer adds frame markers to your data, puts the framed data into a new file, and opens the new
file. The original capture file is not altered.
See Unframing on page 36 for instructions on removing framing from data.
4.2.4 Unframing
This function removes start-of-frame and end-of-frame markers from your data. The original capture file is not
altered during this process. You cannot unframe from the Capture File Viewer (accessed by selecting Capture File
Viewer or Load Capture File to start the software and used only for viewing capture files).
To manually unframe your data:
1. Select Unframe from the File menu on the Control window. Unframe is only available if a protocol
stack was used to capture the data and there is currently no protocol stack selected.
In addition to choosing to Unframe, you can also be prompted to Unframe by the Protocol Stack Wizard.
1. Load your capture file by choosing Open from the File menu on the Control window.
2. Select the file to load.
3. Choose Protocol Stack from the Options menu on the Control window
4. Select None from the list
5. Click Finish. The Protocol Stack Wizard asks you if you want to unframe your data and put it into a new
file.
6. Choose Yes.
The system removes the frame markers from your data, puts the unframed data into a new file, and opens the
new file. The original capture file is not altered.
See Reframing on page 35 for instructions on framing unframed data.
4.2.5 How the Analyzer Auto-traverses the Protocol Stack
In the course of doing service discovery, devices ask for and receive a Protocol Descriptor List defining which
protocol stacks the device supports. It also includes information on which PSM to use in L2CAP, or the channel
number for RFCOMM, or the port number for TCP or UDP. The description below talks about how the analyzer
auto-traverses from L2CAP using a dynamically assigned PSM, but the principle is the same for RFCOMM channel
numbers and TCP/UDP port numbers.
The analyzer looks for SDP Service Attribute Responses or Service Search Attribute Responses carrying protocol
descriptor lists. If the analyzer sees L2CAP listed with a PSM, it stores the PSM and the UUID for the next protocol
in the list.
After the SDP session is over, the analyzer looks at the PSM in the L2CAP Connect frames that follow. If the PSM
matches one the analyzer has stored, the analyzer stores the source channel ID and destination channel ID, and
- 36 -
ComProbe High Speed UART User Manual
Chapter 4 Capturing and Analyzing Data
associates those channel IDs with the PSM and UUID for the next protocol. Thereafter, when the analyzer sees
L2CAP frames using those channel IDs, it can look them up in its table and know what the next protocol is.
In order for the analyzer to be able to auto-traverse using a dynamically assigned PSM, it has to have seen the SDP
session giving the Protocol Descriptor Lists, and the subsequent L2CAP connection using the PSM and identifying
the source and channel IDs. If the analyzer misses any of this process, it is not able to auto-traverse. It stops
decoding at the L2CAP layer.
For L2CAP frames carrying a known PSM (0x0001 for SDP, for example, or 0x0003 for RFCOMM), the analyzer
looks for Connect frames and stores the PSM along with the associated source and destination channel IDs. In this
case the analyzer does not need to see the SDP process, but does need to see the L2CAP connection process,
giving the source and destination channel IDs.
4.2.6 Providing Context For Decoding When Frame Information Is Missing
There may be times when you need to provide information to the analyzer because the context for decoding a
frame is missing. For example, if the analyzer captured a response frame, but did not capture the command frame
indicating the command.
The analyzer provides a way for you to supply the context for any frame, provided the decoder supports it. (The
decoder writer has to include support for this feature in the decoder, so not all decoders support it. Note that not
all decoders require this feature.)
If the decoder supports user-provided context, three items are active on the Options menu of the Control
window and the Frame Display window. These items are Set Initial Decoder Parameters, Automatically
Request Missing Decoding Information, and Set Subsequent Decoder Parameters. (These items are
not present if no decoder is loaded that supports this feature.)
Set Initial Decoder Parameters is used to provide required information to decoders that is not context
dependent but instead tends to be system options for the protocol.
Choose Set Initial Decoder Parameters in order to provide initial context to the analyzer for a decoder. A
dialog appears that shows the data for which you can provide information.
If you need to change this information for a particular frame :
1. Right-click on the frame in the Frame Display window
2. Choose Provide <context name>.
Alternatively, you can choose Set Subsequent Decoder Parameter from the Options menu.
3. This option brings up a dialog showing all the places where context data was overridden.
4. If you know that information is missing, you can't provide it, and you don't want to see dialogs asking for it,
un-check Automatically Request Missing Decoding Information.
5. When unchecked, the analyzer doesn't bother you with dialogs asking for frame information that you don't
have. In this situation, the analyzer decodes each frame until it cannot go further and then simply stop
decoding.
- 37 -
Chapter 4 Capturing and Analyzing Data
ComProbe High Speed UART User Manual
4.3 Analyzing Byte Level Data
4.3.1 Event Display
To open this window click the Event Display icon
on the Control window toolbar.
The Event Display window provides detailed information about every captured event. Events include data
bytes, data related information such as start-of-frame and end-of-frame flags, and the analyzer information, such
as when the data capture was paused. Data bytes are displayed in hex on the left side of the window, with the
corresponding ASCII character on the right.
Figure 4.1 Event Display
Click on an event to find out more about it. The three status lines at the bottom of the window are updated with
information such as the time the event occurred (for data bytes, the time the byte was captured), the value of the
byte in hex, decimal, octal, and binary, any errors associated with the byte, and more.
Events with errors are shown in red to make them easy to spot.
When capturing data live, the analyzer continually updates the Event Display as data is captured. Make sure the
Lock icon
is displayed on the toolbar to prevent the display from updating (Clicking on the icon again will
unlock the display). While locked, you can review your data, run searches, determine delta time intervals
between bytes, and check CRCs. To resume updating the display, click the Lock icon again.
You can have more than one Event Display open at a time. Click the Duplicate View icon
to create a
second, independent Event Display window. You can lock one copy of the Event Display and analyze your
data, while the second Event Display updates as new data is captured.
Event Display is synchronized with the Frame Display and Mesage Sequence Chart dialogs. Selecting a
byte in Event Display will also select the related frame in the Frame Display and the related message in the
Message Sequence Chart.
- 38 -
ComProbe High Speed UART User Manual
Chapter 4 Capturing and Analyzing Data
4.3.2 The Event Display Toolbar
Home – Brings the Control window to the front.
Home – Brings the Control window to the front.
Start Capture - Begins data capture to disk.
Stop Capture - Closes a capture file and stops data capture to disk.
Save - Prompts user for a file name. If the user supplies a name, a .cfa file is saved.
Clear- Discards the temporary file and clears the display.
MSC Chart - Opens the Message Sequence Chart
Signal Display - Opens The Signal Display dialog.
Lock - In the Lock state, the window is locked so you can review a portion of data. Data
capture continues in the background. Clicking on the Lock icon unlocks the window.
Unlock - In the Unlock state, the screen fills in the data captured since the screen lock and
moves down to display incoming data again. Clicking on the Unlock icon locks the window.
Open Breakout Box window that provides a real-time graphical view of control signals.
Duplicate View - Creates a second Event Display window identical to the first.
Frame Display - (framed data only) Brings up a Frame Display, with the frame of the currently
selected bytes highlighted.
Display Capture Notes - Brings up the Capture Notes window where you can view or add
notes to the capture file.
Add/Modify Bookmark - Add a new or modify an existing bookmark.
Display All Bookmarks - Shows all bookmarks and lets you move between bookmarks.
Find - Search for errors, string patterns, special events and more.
Go To - Opens the Go To dialog, where you can specify which event number to go to.
CRC - Change the algorithm and seed value used to calculate CRCs. To calculate a CRC,
select a byte range, and the CRC appears in the status lines at the bottom of the Event
Display.
- 39 -
Chapter 4 Capturing and Analyzing Data
ComProbe High Speed UART User Manual
Mixed Sides - (Serial data only) By default, the analyzer shows data with the DTE side above
the DCE side. This is called DTE over DCE format. DTE data has a white background and
DCE data has a gray background. The analyzer can also display data in mixed side format. In
this format, the analyzer does not separate DTE data from DCE data but shows all data on
the same line as it comes in. DTE data is still shown with a white background and DCE data
with a gray background so that you can distinguish between the two. The benefit of using this
format is that more data fits onto one screen.
Character Only - The analyzer shows both the number (hex, binary, etc.) data and the
character (ASCII, EBCDIC or BAUDOT) data on the same screen. If you do not wish to see
the hex characters, click on the Character Only button. Click again to go back to both number
and character mode.
Number Only - Controls whether the analyzer displays data in both character and number
format, or just number format. Click once to show only numeric values, and again to show
both character and numeric values.
All Events - Controls whether the analyzer shows all events in the window, or only data bytes.
Events include control signal changes and framing information.
Timestamping Options – Brings up the timestamping options window which has options for
customizing the display and capture of timestamps.
4.3.3 Opening Multiple Event Display Windows
Click the Duplicate View icon
from the Event Display toolbar to open a second Event Display window.
You can open as many Event Display windows as you like. Each Event Display is independent of the others
and can show different data, use a different radix or character set, or be frozen or live.
The Event Display windows are numbered in the title bar. If you have multiple Event Displays open, click on
the Event Display icon
on the Control window toolbar to show a list of all the Event Displays currently
open. Select a window from the list to bring it to the front.
4.3.4 Calculating CRCs or FCSs
The cyclic redundancy check (CRC) is a function on the Event Display window used to produce a checksum. The
frame check sequence (FCS) are the extra checksum characters added to a frame to detect errors.
1. Open the Event Display
window.
2. Click and drag to select the data for which you want to generate a CRC.
- 40 -
ComProbe High Speed UART User Manual
3. Click on the CRC icon
Chapter 4 Capturing and Analyzing Data
.
4. In the CRC dialog box, click on the down arrow to show the list
of choices for CRC algorithms..
5. Enter a Seed value in hexadecimal if desired.
6. Click OK to generate the CRC. It appears in the byte information
lines at the bottom of the Event Display window. Whenever you
select a range of data, a CRC is calculated automatically.
Calculating CRC for interwoven data
4.3.5 Calculating Delta Times and Data Rates
1. Click on the Event Display icon
on the Control window to open the Event Display window.
2. Use the mouse to select the data you want to calculate a delta time and rate for.
3. The Event Display window displays the delta time and the data rate in the status lines at the bottom of
the window.
Figure 4.2 Delta fields
4.3.6 Switching Between Live Update and Review Mode
The Event Display and Frame Display windows can update to display new data during live capture, or be
frozen to allow data analysis. By default, the Event Display continually updates with new data, and the Frame
Display is locked.
1. Make sure the Lock icon
2. Click the Unlock
is active so the display is locked and unable to scroll.
icon again to resume live update.
- 41 -
Chapter 4 Capturing and Analyzing Data
ComProbe High Speed UART User Manual
The analyzer continues to capture data in the background while the display is locked. Upon resuming live update,
the display updates with the latest data.
You can have more than one Event Display or Frame Display window open at a time. Click the Duplicate
View icon
to open additional Event or Frame Display windows. The lock/resume function is independent on
each window. This means that you can have two Event Display windows open simultaneously, and one window
can be locked while the other continues to update.
4.3.7 Data Formats and Symbols
4.3.7.1 Switching Between Viewing All Events and Viewing Data Events
By default, the analyzer on the Event Display dialog shows all events1 that include:
l
Data bytes
l
Start-of-frame
l
End-of-frame characters
l
Data Captured Was Paused.
Click on the Display All Events icon
to remove the non-data events. Click again to display all events.
See List of all Event Symbols on page 44 for a list of all the special events shown in the analyzer and what they
mean.
4.3.7.2 Switching Between Hex, Decimal, Octal or Binary
On the Event Display window the analyzer displays data in Hex by default. There are several ways to change the
radix2 used to display data.
Go to the Format menu and select the radix you want. A check mark next to the radix indicates which set is
currently being used.
Figure 4.9 - Format Menu
1An event is anything that happens on the circuit or which affects data capture. Data bytes, control signal changes, and long
and short breaks are all events, as are I/O Settings changes and Data Capture Paused and Resumed.
2The base of a number system. Binary is base 2, octal is base 8, decimal is base 10 and hexadecimal is base 16.
- 42 -
ComProbe High Speed UART User Manual
Chapter 4 Capturing and Analyzing Data
1. Right-click on the data display header labels and choose a different radix.
Figure 4.10 - Header labels, right click
2. Or right-click anywhere in the data display and select a different radix.
Figure 4.11 - Data display right click menu
If you want to see only the numerical values, click on the Numbers Only icon
on the Event Display
toolbar.
4.3.7.3 Switching Between ASCII, EBCDIC, and Baudot
On the Event Display window, the analyzer displays data in ASCII by default when you click on the Characters
Only icon
. There are several ways to change the character set used to display data.
1. Go to the Format menu and select the character set you want. A check mark next to the character set
indicates which set is currently being used.
2. With the data displayed in characters, right-click on the data panel header label to choose a different
character set.
If you want to see only characters, click on the Characters Only icon
on the Event Display toolbar.
4.3.7.4 Selecting Mixed Channel/Sides
If you want to get more data on the Event Display window, you can switch to mixed sides mode. This mode
puts all the data together on the same line. Data from one side (Slave ) is shown on a white background and data
from the other side ( Master )is shown on a gray background.
- 43 -
Chapter 4 Capturing and Analyzing Data
1. Click once on the Mixed Sides icon
ComProbe High Speed UART User Manual
to put the display in mixed sides mode.
2. Click again to return to side over side mode.
3. You can right click in the center of the data display window to change between mixed and side over side
modes by selecting Display Sides Together. A check mark is displayed. Click on Display Sides
Together to remove the check mark and return to side-by-side display.
4. Right click in the sides panel on the right of the data display and select Display Sides Together. A check
mark is displayed. Click on Display Sides Together to remove the check mark and return to side-byside display.
4.3.7.5 List of all Event Symbols
By default, the Event Display shows all eventsevents1, which includes control signal changes, start and end of
frame characters and flow control changes. If you want to see only the data bytes, click on the All Events button
. Click again to display all events.
Click on a symbol, and the analyzer displays the symbol name and sometimes additional information in the status
lines at the bottom of the Event Display window. For example, clicking on a control signal change symbol
displays which signal(s) changed.
In addition to data bytes, the events shown are (in alphabetical order):
Table 4.3 - Event Symbols
Symbol
Event
Abort
Broken Frame - The frame did not end when the analyzer expected it to. This occurs most often
with protocols where the framing is indicated by a specific character, control signal change, or
other data related event.
Buffer Overflow - Indicates a buffer overflow error. A buffer overflow always causes a broken
frame.
Control Signal Change - One or more control signals changed state. Click on the symbol, and
the analyzer displays which signal(s) changed at the bottom of the Event Display window.
Data Capture Paused - The Pause icon was clicked, pausing data capture. No data is recorded
while capture is paused.
Data Capture Resumed - The Pause icon was clicked again, resuming data capture.
Dropped Frames - Some number of frames were lost. Click on the symbol, and the analyzer
displays many frames were lost at the bottom of the Event Display window.
End of Frame - Marks the end of a frame.
1An event is anything that happens on the circuit or which affects data capture. Data bytes, control signal changes, and long
and short breaks are all events, as are I/O Settings changes and Data Capture Paused and Resumed.
- 44 -
ComProbe High Speed UART User Manual
Chapter 4 Capturing and Analyzing Data
Table 4.3 - Event Symbols (continued)
Symbol
Event
Flow Control Active - An event occurred which caused flow control to become active (i.e.
caused the analyzer to stop transmitting data) Events which activate flow control are signal
changes or the receipt of an XON character.
Flow Control Inactive - An event occurred which caused flow control to become inactive (i.e.
caused the analyzer to transmit data). Events which deactivate flow control are signal changes
or the receipt of an XOFF character.
Frame Recognizer Change - A lowest layer protocol was selected or removed here, causing the
frame recognizer to be turned off or on.
I/O Settings Change - A change was made in the I/O Settings window which altered the baud,
parity, or other circuit setting.
Long Break
Low Power - The battery in the ComProbe® is low.
Short Break
SPY Event (SPY Mode only) - SPY events are commands sent by the application being spied on
to the UART.
Start of Frame - Marks the start of a frame.
Begin Sync Character Strip
End Sync Character Strip
Sync Dropped
Sync Found
Sync Hunt Entered
Sync Lost
Test Device Stopped Responding - The analyzer lost contact with the ComProbe for some
reason, often because there is no power to the ComProbe.
Test Device Began Responding - The analyzer regained contact with the ComProbe.
Timestamping Disabled - Timestamping was turned off. Events following this event are not
timestamped. Timestamping Enabled - Timestamping was turned on. Events following this event have
timestamps.
Truncated Frame- A frame that is not the same size as indicated within its protocol.
Underrun Error
- 45 -
Chapter 4 Capturing and Analyzing Data
ComProbe High Speed UART User Manual
Table 4.3 - Event Symbols (continued)
Symbol
Event
Unknown Event
4.3.7.6 Font Size
The font size can be changed on several Event Display windows. Changing the font size on one window does not
affect the font size on any other window.
To change the font size:
1. Click on Event Display menu Options, and select Change the Font Size.
Figure 4.12 - Event Display Options menu
2. Choose a font size from the list.
Figure 4.13 - Event Display Font Size Selection
3. Click OK.
4.4 Analyzing Protocol Decodes
4.4.1 Frame Display Window
To open this window
Click the Frame Display icon
on the Control window toolbar, or select Frame Display from the View
menu.
- 46 -
ComProbe High Speed UART User Manual
Chapter 4 Capturing and Analyzing Data
Figure 4.14 - Frame Display with all panes active
Frame Display Panes
The Frame Display window is used to view all frame related information. It is composed of a number of
different sections or "panes", where each pane shows a different type of information about a frame.
l
l
l
l
l
l
Summary Pane - The Summary Pane displays a one line summary of each frame for every protocol found in
the data, and can be sorted by field for every protocol. Click here for an explanation of the symbols next to the
frame numbers.
Decode Pane - The Decode Pane displays a detailed decode of the highlighted frame. Fields selected in the
Decode Pane have the appropriate bit(s) or byte(s) selected in the Radix, Binary, Character , and Event
panes
Radix Pane - The Radix Pane displays the logical data bytes in the selected frame in either hexadecimal,
decimal or octal.
Binary Pane - The Binary Pane displays a binary representation of the logical data bytes.
Character Pane - The Character Pane displays the character representation of the logical data bytes in either
ASCII, EBCDIC or Baudot.
Event Pane - The Event Pane displays the physical data bytes in the frame, as received on the network.
By default, all panes except the Event Pane are displayed when the Frame Display is first opened.
Protocol Tabs
Protocol filter tabs are displayed in the Frame Display above the Summary pane.
- 47 -
Chapter 4 Capturing and Analyzing Data
l
l
l
l
ComProbe High Speed UART User Manual
These tabs are arranged in separate colorcoded groups. These groups and their
colors are General (white), Classic Bluetooth
(blue), Bluetooth low energy (green),
802.11 (orange), USB (purple), NFC (brown)
and SD (teal). The General group applies to
all technologies. The other groups are
technology-specific.
Clicking on a protocol filter tab in the General group filters in all packets containing that protocol regardless of
each packet’s technology.
Clicking on a protocol filter tab in a technology-specific group filters in all packets containing that protocol on
that technology.
A protocol filter tab appears in the General group only if the protocol occurs in more than one of the
technology-specific tab groups. For example, if L2CAP occurs in both Classic Bluetooth and Bluetooth low
energy , there will be L2CAP tabs in the General group, the Classic Bluetooth group, and the Bluetooth low
energy group.
Select the Unfiltered tab to display all packets.
There are several special tabs that appear in the Summary Pane when certain conditions are met. These tabs
appear only in the General group and apply to all technologies. The tabs are:
l
l
l
Bookmarks appear when a bookmark is first seen.
Errors appear when an error is first seen. An error is a physical error in a data byte or an error in the
protocol decode.
Info appears when a frame containing an Information field is first seen.
The tabs disappear when the capture buffer is cleared during live capture or when decoders are reloaded, even if
one of the tabs is currently selected. They subsequently reappear as the corresponding events are detected.
Comparing Frames
If you need to compare frames, you can open additional Frame Display windows by clicking on the Duplicate
View icon
. You can have as many Frame Display windows open at a time as you wish.
Frame Wrapping and Display
In order to assure that the data you are seeing in Frame Display are current, the following messages appear
describing the state of the data as it is being captured.
l
l
All Frame Display panes except the Summary pane display "No frame selected" when the selected frame is
in the buffer (i.e. not wrapped out) but not accessible in the Summary pane. This can happen when a tab is
selected that doesn’t filter in the selected frame.
When the selected frame wraps out (regardless of whether it was accessible in the Summary pane) all Frame
Display panes except the Summary pane display "Frame wrapped out of buffer".
- 48 -
ComProbe High Speed UART User Manual
l
Chapter 4 Capturing and Analyzing Data
When the selected frame is still being captured, all Frame Display panes except the Summary pane display
"Frame incomplete".
4.4.1.1 Frame Display Toolbar
The buttons that appear in the Frame Display window vary according to the particular configuration of the
analyzer. For controls not available the icons will be grayed-out.
Table 4.4 - Frame Display Toolbar Icons
Icon
Description
Control – Brings the Control window to
the front.
Open File - Opens a capture file.
I/O Settings - Opens the I/O Settings
dialog.
Start Capture - Begins data capture to a
user designated file.
Stop Capture - Closes a capture file and
stops data capture to disk.
Save - Save the currently selected bytes
or the entire buffer to file.
Clear- Discards the temporary file and
clears the display.
Event Display – Brings the Event Display
window to the front.
Show Message Sequence Chart Message Sequence Chart (MSC)
displays information about the messages
passed between protocol layers.
Show Statistics - Opens Statistics dialog
Duplicate View - Creates a second Frame
Display window identical to the first.
Apply/Modify Display Filters - Opens the
Display Filter dialog.
Quick Protocol Filter - brings up a dialog
box where you can filter or hide one or
more protocol layers.
- 49 -
Chapter 4 Capturing and Analyzing Data
ComProbe High Speed UART User Manual
Table 4.4 - Frame Display Toolbar Icons(continued)
Icon
Description
Protocol Stack - brings up the Protocol
Stack Wizard where you can change the
stack used to decode framed data
Reload Decoders - When Reload
Decoders is clicked, the plug-ins are
reset and received frames are redecoded. For example, If the first frame
occurs more than 10 minutes in the past,
the 10-minute utilization graph stays
blank until a frame from 10 minutes ago or
less is decoded.
Find - Search for errors, string patterns,
special events and more.
Display Capture Notes - Brings up the
Capture Notes window where you can
view or add notes to the capture file.
Add/Modify Bookmark - Add a new or
modify an existing bookmark.
Display All Bookmarks - Shows all
bookmarks and lets you move between
bookmarks.
Extract Data - Opens the Extract Data
dialog.
Signal Display - Opens The Signal
Display dialog.
Breakout Box - Opens the Breakout Box
dialog.
Reload Decoders - When Reload Decoders is clicked, the plug-ins are reset
and received frames are re-decoded. For example, If the first frame occurs
more than 10 minutes in the past, the 10-minute utilization graph stays blank
until a frame from 10 minutes ago or less is decoded.
Filter: Text giving the filter currently in
use. If no filter is being used, the text
reads "All Frames" which means that
nothing is filtered out. To see the text of
the entire filter, place the cursor over the
text and a ToolTip pops up with the full
text of the filter.
The following icons all change how the panes are arranged on the Frame
Display. Additional layouts are listed in the View menu.
- 50 -
ComProbe High Speed UART User Manual
Chapter 4 Capturing and Analyzing Data
Table 4.4 - Frame Display Toolbar Icons(continued)
Icon
Description
Show Default Panes - Returns the panes
to their default settings.
Show Only Summary Pane - Displays
only the Summary pane.
Shall All Panes Except Event Pane Makes the Decode pane taller and the
Summary pane narrower.
Toggle Display Lock - Prevents the
display from updating.
Go To Frame
First Frame - Moves to the first frame in
the buffer.
Previous Frame - Moves to the previous
frame in the buffer.
Next Frame - Moves to the next frame in
the buffer.
Last Frame - Moves to the last frame in
the buffer.
Find on Frame Display only searches the
Decode Pane for a value you enter in the
text box.
Find Previous Occurrence - Moves to the
previous occurrence of the value in the
Frame Display Find.
Find Next Occurrence - Moves to the next
occurrence of the value in the Frame
Display Find.
Cancel Current Search - Stops the
current Frame Display Find.
- 51 -
Chapter 4 Capturing and Analyzing Data
ComProbe High Speed UART User Manual
Table 4.4 - Frame Display Toolbar Icons(continued)
Icon
Description
Summary Drop Down Box: Lists all the
protocols found in the data in the file. This
box does not list all the protocol decoders
available to the analyzer, merely the
protocols found in the data. Selecting a
protocol from the list changes the
Summary pane to display summary
information for that protocol. When a low
energy predefined Named Filter (like
Nulls and Polls) is selected, the
Summary drop-down is disabled.
Text with Protocol Stack: To the right of the Summary Layer box is some text
giving the protocol stack currently in use.
Note: If the frames are sorted in other than ascending frame number order, the order of the frames
in the buffer is the sorted order. Therefore the last frame in the buffer may not have the last frame
number.
4.4.1.2 Frame Display Status Bar
The Frame Display Status bar appears at the bottom of the Frame Display. It contains the following
information:
l
l
l
Frame #s Selected: Displays the frame number or numbers of selected (highlighted) frames, and the total
number of selected frames in parentheses
Total Frames: The total number of frames in the capture buffer or capture file in real-time
Frames Filtered In: The total number of frames displayed in the filtered results from user applied filters in
real-time
4.4.1.3 Hiding and Revealing Protocol Layers in the Frame Display
Hiding protocol layers refers to the ability to prevent a layer from being displayed on the Decode pane. Hidden
layers remain hidden for every frame where the layer is present, and can be revealed again at any time. You can
hide as many layers as you wish.
Note: Hiding from the Frame Display affects only the data shown in the Frame Display and not any
information in any other window.
There are two ways to hide a layer.
- 52 -
ComProbe High Speed UART User Manual
Chapter 4 Capturing and Analyzing Data
1. Right-click on the layer in the Decode pane, and choose Hide [protocol name] Layer In All Frames.
2. Click the Set Protocol Filtering button on the Summary pane toolbar. In the Protocols to Hide box
on the right, check the protocol layer(s) you want hidden. Click OK when finished.
To reveal a hidden protocol layer:
1. Right-click anywhere in the Decode pane
2. Choose Show [protocol name] Layer from the right-click menu, or click the Set Protocol Filtering
button and un-check the layer or layers you want revealed.
4.4.1.4 Physical vs. Logical Byte Display
The Event Display window and Event Pane in the Frame Display window show the physical bytes. In other
words, they show the actual data as it appeared on the circuit. The Radix, Binary and Character panes in the Frame
Display window show the logical data, or the resulting byte values after escape codes or other character altering
codes have been applied (a process called transformation).
As an example, bytes with a value of less than 0x20 (the 0x indicates a hexadecimal value) cannot be transmitted
in Async PPP. To get around this, a 0x7d is transmitted before the byte. The 0x7d says to take the next byte and
subtract 0x20 to obtain the true value. In this situation, the Event pane displays 0x7d 0x23, while the Radix pane
displays 0x03.
4.4.1.5 Sorting Frames
By default, frames are sorted in ascending numerical sequence by frame number. Click on a column header in the
Summary pane to sort the frames by that column. For example, to sort the frames by size, click on the Frame
Size column header.
An embossed triangle next to the header name indicates which column the frames are sorted by. The direction of
the triangle indicates whether the frames are in ascending or descending order, with up being ascending.
Note that it may take some time to sort large numbers of frames.
4.4.1.6 Frame Display - Find
Frame Display has a simple Find function that you can use to search the Decode Pane for any alpha numeric
value. This functionality is in addition to the more robust Search/Find dialog.
Frame Display Find is located below the toolbar on the Frame Display dialog.
Figure 4.15 - Frame Display Find text entry field
Where the more powerful Search/Find functionality searches the Decode, Binary, Radix, and Character panes
on Frame Display using TImestamps, Special Events, Bookmarks, Patterns, etc.,
- 53 -
Chapter 4 Capturing and Analyzing Data
ComProbe High Speed UART User Manual
Figure 4.16 - Search/Find Dialog
Find on Frame Display only searches the Decode Pane for a value you enter in the text box.
To use Find:
1. Select the frame where you want to begin the search.
2. Enter a value in the Find text box.
Note: Note: The text box is disabled during a live capture.
3.
Select Find Previous Occurrence
or Find Next Occurrence
to begin the search on frames prior to the frame you selected,
to begin the search on frames following the frame you selected.
The next occurrence of the value (if it is found) will be highlighted in
the Decode Pane.
4.
Select Find Previous Occurrence or Find Next Occurrence to
continue the search.
There are several important concepts to remember with Find.
- 54 -
ComProbe High Speed UART User Manual
l
l
l
l
Chapter 4 Capturing and Analyzing Data
When you enter a search string and select Enter, the search moves forward.
If you select Find Previous Occurrence, when the search reaches the first frame it will then cycle to the
last frame and continue until it reaches the frame where the search began.
Shift + F3 is a shortcut for Find Previous Occurrence.
If you select Find Next Occurrence, when the search reaches the last frame it will then cycle to the first
frame and continue until it reaches the frame where the search began.
l
F3 is a shortcut for Find Next Occurrence.
l
You cannot search while data is being captured.
l
After a capture is completed, you cannot search until Frame Display has finished decoding the frames.
l
Find is not case sensitive.
l
l
l
l
l
l
The status of the search is displayed at
the bottom of the dialog.
The search occurs only on the
protocol layer selected.
To search across all the protocols on
the Frame Display, select the
Unfiltered tab.
A drop-down list displays the search values entered during the current
session of Frame Display.
The search is cancelled when you select a different protocol tab during a
search.
You can cancel the search at any time by selecting the Cancel Current
Search
button.
4.4.1.7 Synchronizing the Event and Frame Displays
The Frame Display is synchronized with the Event Display. Click on a frame in the Frame Display and the
corresponding bytes is highlighted in the Event Display. Each Frame Display has its own Event Display.
As an example, here's what happens if the following sequence of events occurs.
1. Click on the Frame Display icon
in Control window toolbar to open the Frame Display.
2. Click on the Duplicate View icon
to create Frame Display #2.
3. Click on Event Display icon
in Frame Display #2. Event Display #2 opens. This Event
Display is labeled #2, even though there is no original Event Display, to indicate that it is synchronized
with Frame Display #2.
4. Click on a frame in Frame Display #2. The corresponding bytes are highlighted in Event Display #2.
5. Click on a frame in the original Frame Display. Event Display #2 does not change.
- 55 -
Chapter 4 Capturing and Analyzing Data
ComProbe High Speed UART User Manual
4.4.1.8 Working with Multiple Frame Displays
Multiple Frame Displays are useful for comparing two frames side by side. They are also useful for comparing all
frames against a filtered subset or two filtered subsets against each other.
l
To create a second Frame Display, click the Duplicate View icon
on the Frame Display toolbar.
This creates another Frame Display window. You can have as many Frame Displays open as you wish.
Each Frame Display is given a number in the title bar to distinguish it from the others.
l
To navigate between multiple Frame Displays, click on the Frame Display icon
in the Control window
toolbar.
A drop-down list appears, listing all the currently open Frame Displays.
l
Select the one you want from the list and it comes to the front.
Note: When you create a filter in one Frame Display, that filter does not automatically appear
in the other Frame Display. You must use the Hide/Reveal feature to display a filter created in
one Frame Display in another.
Note: When you have multiple Frame Display windows open and you are capturing data, you
may receive an error message declaring that "Filtering cannot be done while receiving data this
fast." If this occurs, you may have to stop filtering until the data is captured.
4.4.1.9 Working with Panes on Frame Display
When the Frame Display first opens, all panes are displayed except the Event pane (To view all the panes,
select Show All Panes from the View menu).
l
The Toggle Expand Decode Pane icon
makes the decode pane longer to view lengthy decodes
better.
l
The Show Default Panes icon
l
The Show only Summary Pane icon
returns the Frame Display to its default settings.
displays on the Summary Pane.
To close a pane, right-click on the pane and select Hide This Pane from the pop-up menu, or de-select Show
[Pane Name] from the View menu.
To open a pane, right-click on the any pane and select Show Hidden Panes from the pop-up menu and select
the pane from the fly-out menu, or select Show [Pane Name] from the View menu.
To re-size a pane, place the cursor over the pane border until a double-arrow cursor appears. Click and drag on
the pane border to re-size the pane.
4.4.1.10 Frame Display - Byte Export
The captured frames can be exported as raw bytes to a text file.
- 56 -
ComProbe High Speed UART User Manual
Chapter 4 Capturing and Analyzing Data
1. From the Frame Display File menu select Byte Export....
Figure 4.17 - Frame Display File menu, Byte Export
2. From the Byte Export window specify the frames to export.
l
l
All Frames exports all filtered-in frames including those scrolled off the Summary pane. Filtered-in
frames are dependent on the selected Filter tab above the Summary pane. Filtered-out frames are
not exported.
Selected Frames export is the same as All Frames export except that only frames selected in the
Summary pane will be exported.
Figure 4.18 - Byte Export dialog
Click the OK button to save the export. Clicking the Cancel button will exit Byte Export.
3. The Save As dialog will open. Select a directory location and enter a file name for the exported frames
file.
- 57 -
Chapter 4 Capturing and Analyzing Data
ComProbe High Speed UART User Manual
Figure 4.19 - Save As dialog
Click on the Save button.
The exported frames are in a text file that can be opened in any standard text editing application. The header
shows the export type, the capture file name, the selected filter tab, and the number of frames. The body shows
the frame number, the timestamp in the same format shown in the Frame Display Summary pane, and the
frame contents as raw bytes.
Figure 4.20 - Sample Exported Frames Text File
4.4.1.11 Panes in the Frame Display
4.4.1.11.1 Summary Pane
The Summary pane
displays a one-line summary of every frame in a capture buffer or file, including frame
number, timestamp, length and basic protocol information. The protocol information included for each frame
depends on the protocol selected in the summary layer box (located directly below the main toolbar).
On a two-channel circuit, the background color of the one-line summary indicates whether the frame came from
the DTE or the DCE device. Frames with a white background come from the DTE device, frames with a gray
background come from the DCE device.
The ComProbe USB Summary pane in displays a one-line summary of every transaction in a capture buffer or
- 58 -
ComProbe High Speed UART User Manual
Chapter 4 Capturing and Analyzing Data
file. Whenever there is a transaction it is shown on a single line instead of showing the separate messages that
comprise the transaction. The Msg column in that case says “Transaction”.
Each message in a transaction contains a packet identifier (PID). All of the PIDs in a transaction are shown in the
transaction line.
All "IN" transactions (i.e. transactions that contain an IN token message) are shown with a purple background. All
other transactions and all non-transactions are shown with a white background. "IN" transactions have special
coloring because that is the only place where the primary data flow is from a device to the Host.
The protocol information included for each frame depends on the protocol selected in the summary layer box
(located directly below the main toolbar).
Frame numbers in red indicate errors, either physical (byte-level) or frame errors. If the error is a frame error in
the displayed protocol layer, the bytes where the error occurred is displayed in red. The Decode Pane gives
precise information as to the type of error and where it occurred.
The Summary pane is synchronized with the other panes in this window. Click on a frame in the Summary
pane, and the bytes for that frame is highlighted in the Event pane while the Decode pane displays the full
decode for that frame. Any other panes which are being viewed are updated accordingly. If you use one pane to
select a subset of the frame, then only that subset of the frame is highlighted in the other panes.
Protocol Tabs
Protocol filter tabs are displayed in the Frame Display above the Summary pane.
l
These tabs are arranged in separate color-coded groups. These groups and their colors are General (white),
Classic Bluetooth® (blue), Bluetooth low energy (green), 802.11 (orange), USB (purple), and SD (brown). The
General group applies to all technologies. The other groups are technology-specific.
Figure 4.21 - Example Protocol Tags
l
l
l
Clicking on a protocol filter tab in the General group filters in all packets containing that protocol regardless of
each packet’s technology.
Clicking on a protocol filter tab in a technology-specific group filters in all packets containing that protocol on
that technology.
A protocol filter tab appears in the General group only if the protocol occurs in more than one of the
technology-specific tab groups. For example, if L2CAP occurs in both Classic Bluetooth and Bluetooth low
energy , there will be L2CAP tabs in the General group, the Classic Bluetooth group, and the Bluetooth low
energy group.
Select the Unfiltered tab to display all packets.
There are several special tabs that appear in the Summary pane when certain conditions are met. These tabs
appear only in the General group and apply to all technologies. The tabs are:
- 59 -
Chapter 4 Capturing and Analyzing Data
l
l
l
ComProbe High Speed UART User Manual
Bookmarks appear when a bookmark is first seen.
Errors appear when an error is first seen. An error is a physical error in a data byte or an error in the
protocol decode.
Info appears when a frame containing an Information field is first seen.
The tabs disappear when the capture buffer is cleared during live capture or when decoders are reloaded, even if
one of the tabs is currently selected. They subsequently reappear as the corresponding events are detected.
The tabs disappear when the capture buffer is cleared during live capture or when decoders are reloaded, even if
one of the tabs is currently selected. They subsequently reappear as the corresponding events are detected.
Use the navigation icons, keyboard or mouse to move through the frames. The icons
the first and last frames in the buffer, respectively. Use the Go To icon
and
move you to
to move to a specific frame number.
Placing the mouse pointer on a summary pane header with truncated text displays a tooltip showing the full
header text.
Figure 4.22 - Summary pane (right) with Tooltip on Column 5 (Tran ID)
Sides in Bluetooth low energy
A Bluetooth low energy data connection consists of connection events, which are a series of transmissions on the
same channel. In each connection event the master transmits first, then the slave, and then the devices take turns
until the connection event is finished.
When the data connection is encrypted and the packets are successfully decrypted, the sniffer can determine
exactly who sent which packet (only non-empty, encrypted packets – empty packets are never encrypted). These
packets are labeled either ‘M’ for master or ‘S’ for slave.
When the data connection is unencrypted or when encrypted packets are not successfully decrypted by the
sniffer, the sniffer cannot distinguish the two devices’ (master and slave) packets by their content, just by the
packet timing. In those cases we label each device as side ‘1’ or ‘2’, not as master or slave. In each connection
event, packets sent by the device which transmitted first in the connection event are labeled ‘1’, and packets sent
by the device which transmitted second are labeled ‘2’.
If no packets in the connection event are missed by the sniffer, the device labeled ‘1’ is the master and the device
labeled ‘2’ is the slave. However, if we do not capture the very first packet in a connection event (i.e. the packet
sent by the master) but do capture the packet sent by the slave, we label the slave as side ‘1’ since it is the first
device we heard in the connection event. Because there is potential clock drift since the last connection event,
- 60 -
ComProbe High Speed UART User Manual
Chapter 4 Capturing and Analyzing Data
we cannot use the absolute timing to correct this error; there would still be cases where we get it wrong.
Therefore we always assign ‘1’ to the first packet in a connection event. So even though it is rare, there are
connection events where packets sent by the slave device are labeled ‘1’ and packets sent by the master are
labeled ‘2’.
Finally, in a noisy environment it is also possible that the sniffer does not capture packets in the middle of a
connection event. If this occurs and the sniffer cannot determine the side for the remaining packets in that
connection event, the side is labeled ‘U’ for “unknown”.
4.4.1.11.2 Customizing Fields in the Summary Pane
You can modify the Summary Pane in Frame Display.
Summary pane columns can be reordered by dragging any column to a different position.
Fields from the Decode pane can be added to the summary pane by dragging any Decodepane field to the
desired location in the summary pane header. If the new field is from a different layer than the summary pane a
plus sign (+) is prepended to the field name and the layer name is added in parentheses. The same field can be
added more than once if desired, thus making it possible to put the same field at the front and back (for example)
of a long header line so that the field is visible regardless of where the header is scrolled to.
An added field can be removed from the Summary pane by selecting Remove New Column from the rightclick menu.
The default column layout (both membership and order) can be restored by selecting Restore Default
Columns from the Format or right-click menus.
Changing Column Widths
To change the width of a column:
1. Place the cursor over the right column divider until the cursor changes to a solid double arrow.
2. Click and drag the divider to the desired width.
3. To auto-size the columns, double-click on the column dividers.
Hiding Columns
To hide a column:
1. Drag the right divider of the column all the way to the left.
2. The cursor changes to a split double arrow when a hidden column is present.
3. To show the hidden column, place the cursor over the divider until it changes to a split double arrow, then
click and drag the cursor to the right.
4. The Frame Size, Timestamp, and Delta columns can be hidden by right-clicking on the header and
selecting Show Frame Size Column, Show Timestamp Column, or Show Delta Column. Follow
the same procedure to display the columns again.
Moving Columns - Changing Column Order
To move a column :
- 61 -
Chapter 4 Capturing and Analyzing Data
ComProbe High Speed UART User Manual
1. Click and hold on the column header
2. Drag the mouse over the header row.
3. A small white triangle indicates where the column is moved to.
4. When the triangle is in the desired location, release the mouse.
Restoring Default Column Settings
To restore columns to their default locations, their default widths, and show any hidden columns
1. Right-click on any column header and choose Restore Default Column Widths, or select Restore
Default Column Widths from the Format menu.
4.4.1.11.3 Frame Symbols in the Summary Pane
A green dot means the frame was decoded successfully, and the protocol listed in the Summary
Layer drop-down box exists in the frame. No dot means the frame was decoded successfully, but
the protocol listed in the Summary Layer drop-down box does not exist in the frame.
A green circle means the frame was not fully decoded. There are several reasons why this might
happen.
l
l
One reason is that the frame compiler hasn't caught up to that frame yet. It takes some time for
the analyzer to compile and decode frames. Frame compilation also has a lower priority than
other tasks, such as capturing data. If the analyzer is busy capturing data, frame compilation may
fall behind. When the analyzer catches up, the green circle changes to either a green dot or no
dot.
Another reason is if some data in the frame is context dependent and we don't have the context.
An example is a compressed header where the first frame gives the complete header, and
subsequent frames just give information on what has changed. If the analyzer does not capture
the first frame with the complete header, it cannot decode subsequent frames with partial
header information.
A magenta triangle indicates that a bookmark is associated with this frame. Any comments associated
with the bookmark appear in the column next to the bookmark symbol.
4.4.1.11.4 Decode Pane
The Decode pane (aka detail pane)
is a post-process display that provides a detailed decode of each frame
transaction (sometimes referred to as a frame). The decode is presented in a layered format that can be
expanded and collapsed depending on which layer or layers you are most interested in. Click on the plus sign to
expand a layer. The plus sign changes to a minus sign. Click on the minus sign to collapse a layer. Select Show All
or Show Layers from the Format menu to expand or collapse all the layers. Layers retain their expanded or
collapsed state between frames.
Protocol layers can be hidden, preventing them from being
displayed on the Decode pane. Right-click on any protocol layer
and choose Hide [protocol name] from the right-click menu.
In a USB transaction, all messages that comprise the transaction
are shown together in the detail pane. The color coding that is
applied to layers when the detail pane displays a single message
- 62 -
ComProbe High Speed UART User Manual
Chapter 4 Capturing and Analyzing Data
is applied to both layers and messages when the detail pane displays a transaction. To keep the distinction
between layers and messages clear, each header of each message in the detail pane ends with the word
“Message” or “Messages”. The latter is used because data and handshake messages are shown as a single colorcoded entry
Each protocol layer is represented by a color, which is used to highlight the bytes that belong to that protocol
layer in the Event, Radix, Binary and Character panes. The colors are not assigned to a protocol, but are
assigned to the layer.
The Event, Radix, Binary, Character and Decode panes are all synchronized with one another. Clicking on an
element in any one of the panes highlights the corresponding element in all the other panes.
Click the Toggle Expand Decode Pane icon
to make the Decode pane taller. This allows for more of a
lengthy decode to be viewed without needing to scroll.
4.4.1.11.5 Radix or Hexadecimal Pane
The Radix pane displays the logical bytes in the frame in either
hexadecimal, decimal or octal. The radix can be changed from
the Format menu, or by right-clicking on the pane and
choosing Hexadecimal, Decimal or Octal.
Because the Radix pane displays the logical bytes rather than
the physical bytes, the data in the Radix pane may be different
from that in the Event pane. See Physical vs. Logical Byte Display
for more information.
Colors are used to show which protocol layer each byte belongs
to. The colors correspond to the layers listed in the Decode
pane.
The Event, Radix, Binary, Character and Decode panes are all synchronized with one another. Clicking on an
element in any one of the panes highlights the corresponding element in all the other panes.
4.4.1.11.6 Character Pane
The Character pane represents the logical bytes in the frame
in ASCII, EBCDIC or Baudot. The character set can be
changed from the Format menu, or by right-clicking on the
pane and choosing the appropriate character set.
Because the Character pane displays the logical bytes rather
than the physical bytes, the data in the Character pane may
be different from that in the Event pane. See Physical vs.
Logical Byte Display for more information.
Colors are used to show which protocol layer each byte
belongs to. The colors correspond to the layers listed in the
Decode pane.
The Event, Radix, Binary, Character and Decode panes
are all synchronized with one another. Clicking on an element
in any one of the panes highlights the corresponding element in all the other panes.
- 63 -
Chapter 4 Capturing and Analyzing Data
ComProbe High Speed UART User Manual
4.4.1.11.7 Binary Pane
The Binary pane displays the logical bytes in the frame in binary.
Because the Binary pane displays the logical bytes rather than the physical bytes, the data in the Binary pane may
be different from that in the Event pane. See Physical vs. Logical Byte Display for more information.
Colors are used to show which protocol layer each byte belongs to. The colors correspond to the layers listed in
the Decode pane.
The Event, Radix, Binary, Character and Decode panes are all synchronized with one another. Clicking on an
element in any one of the panes highlights the corresponding element in all the other panes.
4.4.1.11.8 Event Pane
The Event pane shows the physical bytes
in the frame. You can choose between
displaying only the data events or
displaying all events by clicking the All
Events icon
.
Displaying all events means that special
events, such as Start of Frame, End of
Frame and any signal change events, are
displayed as special symbols within the
data.
The status lines at the bottom of the pane give the same information as the status lines in the Event Display
window. This includes physical data errors, control signal changes (if appropriate), and timestamps.
Because the Event pane displays the physical bytes rather than the logical bytes, the data in the Event pane may
be different from that in the Radix, Binary and Character panes. See Physical vs. Logical Byte Display for more
information.
Colors are used to show which protocol layer each byte belongs to. The colors correspond to the layers listed in
the Decode pane.
The Event, Radix, Binary, Character and Decode panes are all synchronized with one another. Clicking on an
element in any one of the panes highlights the corresponding element in all the other panes.
4.4.1.11.9 Change Text Highlight Color
Whenever you select text in the Binary, Radix, or
Character panes in Frame Display, the text is displayed
with a highlight color. You can change the color of the
highlight.
1. Select Change Text Highlight Color from the
Options menu. You can also access the option by
right clicking in any of the panes.
2. Select a color from the drop-down menu.
3. Click OK.
The highlight color for the text is changed.
- 64 -
ComProbe High Speed UART User Manual
Chapter 4 Capturing and Analyzing Data
Select Cancel to discard any selection. Select Defaults to return the highlight color to blue.
4.4.1.12 Protocol Layer Colors
4.4.1.12.1 Data Byte Color Notation
The color of the data in the panes specifies which layer of the protocol stack the data is from. All data from the
first layer is bright blue, the data from the second layer is green, the third layer is pink, etc. The protocol name for
each layer in the Decode pane is in the same color. Note that the colors refer to the layer, not to a specific
protocol. In some situations, a protocol may be in two different colors in two different frames, depending on
where it is in the stack. You can change the default colors for each layer.
Red is reserved for bytes or frames with errors. In the Summary pane, frame numbers in red mean there is an
error in the frame. Also, the Errors tab is displayed in red. This could be a physical error in a data byte or an error
in the protocol decode. Bytes in red in the Radix, Character, Binary and Event panes mean there is a physical
error associated with the byte.
4.4.1.12.2 Changing Protocol Layer Colors
You can differentiate different protocol layers in the Decode, Event, Radix, Binary and Character panes.
1. Choose Select Protocol Layer Colors from the Options menu to change the colors used.
The colors for the different layers is displayed.
2. To change a color, click on the arrow next to each layer and select a new color.
3. Select OK to accept the color change and return to Frame Display.
Select Cancel to discard any selection. Select Defaults to return the highlight colors to the default settings.
Figure 4.23 - Frame Display Protocol Layer Color Selector
4.4.1.13 Filtering
Filtering allows the user to control the display which capture frames are displayed. Filters fall into two general
categories:
- 65 -
Chapter 4 Capturing and Analyzing Data
ComProbe High Speed UART User Manual
1. Display filters allow a user to look at a subset of captured data without affecting the capture content.
Frames matching the filter criteria appear in the Frame Display; frames not matching the criteria will not
appear.
2. Connection filters Two options are available.
a. A Bluetooth connection: Displays only the frames associated with a Classic Bluetooth link or a
Bluetooth low energy access address. A new Frame Display will open showing only the protocol
tabs, frames, summary, and events associated with that particular Bluetooth connection.
b. A specific wireless or wired technology. Displays all of the frames associated with:
l
Classic Bluetooth
l
Bluetooth low energy
l
802.11
l
HCI
A new Frame Display will open showing only the protocol tabs, frames, summary and events
associated with the selected technology.
4.4.1.13.1 Display Filters
A display filter looks at frames that have already been captured. It looks at every frame in the capture buffer and
displays those that match the filter criteria. Frames that do not match the filter criteria are not displayed. Display
filters allow a user to look at a subset of captured data without affecting the capture content. There are three
general classes of display filters:
l
Protocol Filters
l
Named Filters
l
Quick Filter
Protocol Filters
Protocol filters test for the existence of a specific single layer. The system creates a protocol filter for each
decoder that is loaded if that layer is encountered in a capture session.
There are also three special purpose filters that are treated as protocol filters:
l
All Frames with Errors
l
All Frames with Bookmarks
l
All Special Information Nodes
Named Filters
l
Named filters test for anything other than simple single layer existence. Named filters can be constructed that
test for the existence of multiple layers, field values in layers, frame sizes, etc., as well as combinations of
those things. Named filters are persistent across sessions.
- 66 -
ComProbe High Speed UART User Manual
l
Chapter 4 Capturing and Analyzing Data
Named filters are user-defined. User-defined filters persist in a template file. User defined filters can be
deleted.
Quick Filters
l
Quick Filters are combinations of Protocol Filters and/or Named Filters that are displayed on the Quick Filter
tab.
l
Quick Filters cannot be saved and do not persist across sessions.
l
Quick Filters are created on the Quick Filter Dialog.
4.4.1.13.1.1 Creating a Display Filter
There are two steps to using a display filter. Define the filter conditions, and then apply the filter to the data set.
The system combines both filter definition and application in one dialog.
1. Click the Display Filters icon
on the Frame Display
window or select Apply/Modify
Display Filters from the Filter menu to open the Set Condition dialog box. The Set Condition dialog is
self configuring which means that when you Select each frame under Conditions the following
displayed fields depend on your selection. With each subsequent selection the dialog fields will change
depending on you selection in that field.
Figure 4.24 - Example: Set Conditions Self Configuring Based on Protocol Selection
- 67 -
Chapter 4 Capturing and Analyzing Data
ComProbe High Speed UART User Manual
Figure 4.25 - Example: Set Conditions Self Configuring Based on Frame Range
2. Select Include or Exclude to add filtered data or keep out filtered data respectively.
3. Select the initial condition for the filter from the drop-down list.
4. Set the parameters for the selected condition in the fields provided. The fields that appear in the dialog
box are dependent upon the previous selection. Continue to enter the requested parameters in the fields
provided until the condition statement is complete.
5. Click OK. The system displays the Save Named Condition dialog. Provide a name for the filter condition
or accept the default name provided by the system and click OK. Prohibited characters are left bracket '[',
right bracket ']' and equal sign '='. The Set Condition dialog box closes, creates a tab on the Frame
Display with the filter name, and applies the filter.
The filter also appears in the Quick Filtering and Hiding Protocols dialog.
When a display filter is applied, a description of the filter appears to the right of the toolbar in the Frame Display
windows.
Notes:
l
l
l
The system requires naming and saving of all filters created by the user.
The OK button on the Set Condition dialog box is unavailable (grayed out) until the condition selections are
complete.
When you have multiple Frame Display windows with a display filter or filters, those filter do not automatically
appear in other Frame Display windows. You must use the Hide/Reveal feature to display a filter created in
one Frame Display in different Frame Display window.
4.4.1.13.1.2 Including and Excluding Radio Buttons
All filter dialog boxes contain an Include and an Exclude radio button. These buttons are mutually exclusive. The
Include/Exclude selection becomes part of the filter definition, and appears as part of the filter description
displayed to the right of the Toolbar.
Include: A filter constructed with the "Include" button selected, returns a data set that includes frames that meet
the conditions defined by the filter and omits frames that do not.
Exclude: A filter constructed with the "Exclude" button selected, returns a data set that excludes frames that
meet the conditions defined by the filter and consists of frames that do not.
- 68 -
ComProbe High Speed UART User Manual
Chapter 4 Capturing and Analyzing Data
4.4.1.13.1.3 Named Display Filters
You can create a unique display filter by selecting a data type on the Frame Display and using a right click menu.
When you create a Name Filter, it appears in the Quick Filtering dialog, where you can use it do customize the
data you see in the Frame Display panes.
1. Select a frame in the Frame Display Summary Pane.
2. Right click in the one of the data columns in the Summary Pane: CRC, NESN, DS, Packet Success,
Ethertype, Source Address, etc.
3. Select Filter in (data type) = . The Filtering Results
dialog appears.
4. Enter a name for the filter
5. Select OK.
The filter you just created appears in the Named Filters section
of the Quick Filtering dialog.
4.4.1.13.1.4 Using Compound Display Filters
Compound filters use boolean logic to create complex and precise filters. There are three primary Boolean logic
operators: AND, OR, and NOT.
The AND operator narrows the filter, the OR operator broadens the filter, and the NOT operator excludes
conditions from the filtered results. Include parentheses in a compound filter to nest condition sets within larger
condition sets, and force the filter-processing order.
There are two steps to using a compound filter. Define the filter conditions, and then apply the filter to the data
set. The analyzer combines both filter definition and application in one dialog.
1. Click the Display Filters icon
on the Frame Display window or select Apply/Modify Display
Filters… from the filter menu to open the Set Condition dialog box.
2. Click the Advanced button on the Set Condition dialog box.
3. Select Include or Exclude radio button.
Now you can set the conditions for the filter.
4. Select the initial condition for the filter from the
combo box at the bottom of the dialog for Select
each frame.
5. Set the parameters for the selected condition in
the fields provided. The fields that appear in the
dialog box are dependent upon the previous
selection. Continue to enter the requested
parameters in the fields provided until the
conditions statement is complete.
- 69 -
Chapter 4 Capturing and Analyzing Data
ComProbe High Speed UART User Manual
Figure 4.26 - Two Filter Conditions Added with an AND Operator
6. Click the plus icon
Use the up
on the left side of the dialog box and repeat steps 4 and 5 for the next condition.
and down
the delete button
arrow icons on the left side of the dialog box to order your conditions, and
to delete conditions from your filter.
7. Continue adding conditions until your filter is complete.
8. Include parentheses as needed and set the boolean operators.
9. Click OK.
10. The system displays the Save Named Condition dialog. Provide a name for the filter condition or accept
the default name provided by the system and click OK.
Figure 4.27 - Save Named Filter Condition Dialog
The Set Condition dialog box closes, creates a tab on the Frame Display with the filter name, and applies the
filter.
When a display filter is applied, a description of the filter
appears to the right of the toolbar in the Frame
Display windows.
Note: The OK button on the Set Condition dialog box is unavailable (grayed out) until the
condition selections are complete.
- 70 -
ComProbe High Speed UART User Manual
Chapter 4 Capturing and Analyzing Data
4.4.1.13.1.5 Defining Node and Conversation Filters
There are two steps to using Node and Conversation display filter. Define the filter conditions, and then apply the
filter to the data set. The analyzer combines both filter definition and application in one dialog.
1. Click the Display Filters icon
on the Frame Display window or select Apply/Modify Display
Filters… from the filter menu to open the Set Condition dialog box.
2. From the Select each frame combo box choose frames with the conversation as the initial condition.
3. Select an address type—IP, MAC, TCP/UDB—from the Typecombo box (The address type selection
populates both Address combo boxes with node address in the data set that match the type selection).
4. Select a node address from the first Address combo box.
5. Choose a direction arrow from the direction box . The left arrow filters on all frames
where the top node address is the destination, the right arrow filters on all frames
where the top node address is the source, and the double arrow filters on all frames
where the top node address is either the source or the destination.
6. If you want to filter on just one node address, skip step 7 and continue with step 8.
7. If you want to filter on traffic going between two address nodes (i.e. a conversation), select a node address
from the second Address combo box..
8. Click OK. The Set Condition dialog box closes and the analyzer applies the filter.
When a display filter is applied, a description of the filter appears to the right of the toolbar in the Frame Display
windows.
Note: The OK button is unavailable (grayed out) until the condition selections are complete.
4.4.1.13.1.6 The Difference Between Deleting and Hiding Display Filters
If you wish to remove a filter from the system permanently, then use the Delete procedure. However, if all you
want to do is remove a filter as a means to un-clutter the display, then use the Hide procedure.
Deleting a saved filter removes the filter from the current session and all subsequent sessions. In order to retrieve
a deleted filter, the user must recreate it using the Set Conditions dialog.
Hiding a filter merely removes the filter from the display. A hidden filter can be reapplied using the Show/Hide
procedure.
- 71 -
Chapter 4 Capturing and Analyzing Data
ComProbe High Speed UART User Manual
Deleting Saved Display Filters
1. Select Delete Display Filters from the Filter
menu in the Frame Display
window to
open the Delete Named Condition dialog.
The system displays the Delete Named
Condition dialog with a list of all user defined
filters.
2. Select the filter to be deleted from the list.
3. Click the Delete button.
4. Click OK. The Delete Named Condition
dialog box closes and the system deletes the
filter.
Hiding and Revealing Display Filters
If a display filter is showing the following steps will hide
that filter but will not delete it.
1. Select Hide/Show Display
Filters… from the Filter menu on the
Frame Display
window to open
the Hide/Show Filters dialog. The
system displays the Hide/Show
Filters dialog with a list of all user
defined filters.
2. Select the filter to be hidden from the
combo box.
3. Click the Hide button. The Hide button is only showing if the selected filter is currently showing in the
Frame Display.
4. Click OK. The Hide/Show Filters dialog box closes, and the system hides the filter and removes the filter
tab from the Frame Display.
If a display filter is hidden the following steps will reveal that filter in the Frame Display.
1. Select Hide/Show Display Filters… from the Filter menu in the Frame Display
window to
open the Hide/Show Filters dialog. The system displays the Hide/Show Filters dialog with a list of all
user defined filters.
2. Select the filter to be revealed from the combo box.
3. Click the Show button.
4. Click OK. The Hide/Show Filters dialog box closes and the system reveals the filter in the Frame
Display.
You can also open the Quick Filter dialog and check the box next to the hidden filter to show or hide a display
filter.
- 72 -
ComProbe High Speed UART User Manual
Chapter 4 Capturing and Analyzing Data
Figure 4.28 - Using Named Filters Section of Quick Filters to Show/Hide Filters
Note: When you have multiple Frame Display windows with a display filter or filters, those filter do
not automatically appear in other Frame Display windows. You must use the Hide/Show dialog to
display a filter created in one Frame Display in different Frame Display window.
4.4.1.13.1.7 Editing Filters
Modifying a Condition in a Filter
1. Click the Display Filters icon
Display
on the Frame
window or select Apply/Modify Display
Filters… from the Filter menu to open the Set
Condition dialog box. The Set Condition dialog box
displays the current filter definition at the top of the dialog.
To display another filter, click the Open
icon, and
select the filter from the pop-up list of all the saved filters.
2. Edit the desired parameter of the condition: Because the required fields for a condition statement depend
upon previously selected parameters, the Set Condition dialog box may display additional fields that were
not present in the original filter. In the event this occurs, continue to enter the requested parameters in
the fields provided until the condition statement is complete.
3. Click OK. The system displays the Save Named Condition dialog. Ensure that the filter name is
displayed in the text box at the top of the dialog, and click OK. If you choose to create an additional filter,
then provide a new name for the filter condition or accept the default name provided by the system and
click OK.) The Set Condition dialog box closes, and the system applies the modified filter.
Note: When a display filter is applied, a description of the filter appears to the right of the toolbar in
the Frame Display windows.
Note: The OK button on the Set Condition dialog box is unavailable (grayed out) until the
condition selections are complete.
Deleting a Condition in a Filter
If a display filter has two or more conditions you can delete conditions. If there is only one condition set in the
filter you must delete the filter using Delete Display Filters… from the Filters menu.
- 73 -
Chapter 4 Capturing and Analyzing Data
1. Click the Display Filters icon
ComProbe High Speed UART User Manual
on the Frame Display window or select Apply/Modify Display
Filters… from the Filter menu to open the Set Condition dialog box. Click on the Advanced button to
show the condition in Boolean format. The dialog box displays the current filter definition. To display
another filter, click the Open
icon, and select the filter from the pop-up list of all the saved filters.
Figure 4.29 - Set Condition Dialog in Advanced View
2. Select the desired condition from the filter definition.
3. Click the Delete Selected Line
icon.
4. Edit the Boolean operators and parentheses as needed.
5. Click OK. The system displays the Save Named Condition dialog. Ensure that the filter name is
displayed in the text box at the top of the dialog, and click OK. (If you choose to create an additional filter,
then provide a new name for the filter condition or accept the default name provided by the system and
click OK.) The Set Condition dialog box closes, and the system applies the modified filter.
Note: When a display filter is applied, a description of the filter appears to the right of the toolbar in
the Frame Display windows.
Note: The OK button on the Set Condition dialog box is unavailable (grayed out) until the
condition selections are complete.
Renaming a Display Filter
1. Select Rename Display Filters… from the Filter menu in the Frame Display
window to open
the Rename Filter dialog. The system displays the Rename Filter dialog with a list of all user defined
filters in the Filters combo box.
- 74 -
ComProbe High Speed UART User Manual
Chapter 4 Capturing and Analyzing Data
Figure 4.30 - Rename Filters Dialog
2. Select the filter to be renamed from the combo box.
3. Enter a new name for the filter in the New Name box. Optionally click the Apply button and the new
name will appear in the Filters combo box and the New Name box will empty. This option allows you to
rename several filters without closing the Rename Filter dialog each time.
4. Click OK. The Rename Filter dialog box closes and the system renames the filter.
4.4.1.13.2 Connection Filtering
Connection Filtering allows the user to view a subset of the total available packets within the Frame Display. The
subset can include data from a single Bluetooth connection, or all of the BR/EDR packets, all of the low energy
packets, all of the 802.11 packets, or all of the HCI packets.
Bluetooth Applicability
A connection (device pair) is identified by
1. A Link for Classic Bluetooth,
2. An Access Address for Bluetooth low energy.
The link ID is a number that the ComProbe software assigns to identify a pair of devices in a BR/EDR connection. In
the Frame Display details pane, the Baseband layer contains the link ID field if the field’s value is not 0.
An Access Address is contained in every Bluetooth low energy packet. The Access Address identifies a connection
between a slave and a master or an advertising packet.
Connection filtering displays only the frames, protocols, summary, details, and events for the selected
connections.
Note: Connection Filters are not persistent across sessions.
4.4.1.13.2.1 Creating a Connection Filter
In the Frame Display there are four ways to create a connection filter.
From the Frame Display Filter menu
Click on the Frame Display Filter menu Connection Filter selection. From the drop down menu, select
Classic or Bluetooth low energy. The options are
- 75 -
Chapter 4 Capturing and Analyzing Data
l
l
l
Classic Bluetooth:
o
All will filter in all Classic Bluetooth frames. You are in effect filtering out any Bluetooth low energy frames
and are selecting to filter in all the Classic Bluetooth links.
o
Links displays all the master-slave links. You can select only one link to filter in. The selected link will filter
in only the frames associated with that link.
Bluetooth low energy:
o
All will filter in all Bluetooth low energy frames. You are in effect filtering out any Classic Bluetooth frames
and are selecting to filter in all Bluetooth low energy access addresses.
o
Access Addresses displays all the low energy slave device's access address. You can select only one
access address to filter. The selected link will filter in only the frames associated with that access address.
802.11:
o
l
ComProbe High Speed UART User Manual
All will filter in all 802.11 frames. You are in effect filtering out any other technology frames.
HCI:
o
All will filter in all HCI frames. You are in effect filtering out any other technology frames.
Figure 4.31 - Connection Filter from the Frame Display Menu
From the Frame Display toolbar
Right-click anywhere in the toolbar and select Connection Filter from the pop-up menu. The procedure for
creating a connection filter are identical as described in From the Frame Display Filter menu, above.
Figure 4.32 - Connection Filter from the Frame Display Toolbar right-click
- 76 -
ComProbe High Speed UART User Manual
Chapter 4 Capturing and Analyzing Data
From the Frame Display panes
Right-click anywhere in a Frame Display pane and select Connection Filter in the pop-up menu. The procedure
for creating a connection filter are identical as described in From the Frame Display Filter menu, above.
Figure 4.33 - Connection Filter from the Frame Display Pane right-click
From the Frame Display frame selection
Select a frame in the summary pane. Right-click and select Connection Filter in the pop-up menu. The
procedure for creating a connection filter are identical as described in From the Frame Display Filter menu,
above.
If the frame you have selected is associated with a Classic Bluetooth link or a Bluetooth low energy access address,
an additional pop-up menu item will appear as shown in the example image below. This selection is a
predetermined filter based on your selection. In the example, frame "6471" is associated with "Link 4", so the
predetermined filter assumes that you may want create a connection filter for that link. Clicking on Connection
Filter Link = 4 will filter in "Link 4" frames without opening all the drop-down menus.
- 77 -
Chapter 4 Capturing and Analyzing Data
ComProbe High Speed UART User Manual
Figure 4.34 - Connection Filter from frame selection right-click
Creating from any Frame Display window
A Connection Filter can be created from any open Frame Display window, and the filtering will always be applied
to the original captured data set.
4.4.1.13.2.2 Connection Filter Display
Once you have selected which connections to filter in, another Frame Display will open. The original Frame
Display will remain open, and can be minimized.
Note: The system currently limits the number of frame displays to 5. This limit includes any Frame
Displays opened using Duplicate View
from the Toolbar (see Working with Multiple Frame
Displays on page 56)
The new Frame Display with the filtered connection frames will only contain the data defined by the filter criteria.
That is, the criteria could be a single link or data for a particular technology.
- 78 -
ComProbe High Speed UART User Manual
Chapter 4 Capturing and Analyzing Data
Display Example 1: Bluetooth low energy Access Address selected
Figure 4.35 - Front Display: Filtered on Access Address 0x8e89bed6
In the figure above is an example Bluetooth low energy data set connection filtered on Access Address =
0x8e89bed6. The Frame Display in the front is the filtered data set. One way to note the difference between the
original and the filtered display is to observe the Protocol Tabs. In the filtered display there are four low energy
protocol tabs as compared to nine in the original display. This access address connection is not using five of the
protocols.
From any open Frame display the user can set another Connection Filter based on the original data set.
Display Example 2: All 802.11 data filtered in
In this example, there is a capture file with Classic Bluetooth, Bluetooth low energy, and 802.11. To view just the
802.11 data set, 802.11 = All is selected from the right-click pop up menu.
- 79 -
Chapter 4 Capturing and Analyzing Data
ComProbe High Speed UART User Manual
Figure 4.36 - Unfiltered: Capture File with Classic, low energy, and 802.11
When the Frame Display with the filtered 802.11 data set appears, only the Protocol Tabs for 802.11 are present
and the tabs for Classic Bluetooth and Bluetooth low energy have been filtered out.
Figure 4.37 - Connection Filter selecting All 802.11 frames, front
4.4.1.13.3 Protocol Filtering from the Frame Display
4.4.1.13.3.1 Quick Filtering on a Protocol Layer
On the Frame Display , click the Quick Filtering icon
or select Quick Filtering from the Filter menu.
This opens a dialog that lists all the protocols discovered so far. The protocols displayed change depending on the
data received.
- 80 -
ComProbe High Speed UART User Manual
Chapter 4 Capturing and Analyzing Data
Figure 4.38 - Frame Display Quick Filtering and Hiding Protocols Dialog
The box on the left is Protocols To Filter In. When you select the checkbox for a protocol in the Protocols to
Filter In, the Summary pane will only display those frames that contain data from that protocol.
If you filter on more than one protocol, the result are all frames that contain at least one of
those protocols. For example, if you filter on IP and IPX NetBIOS, you receive all frames that
contain either IP or IPX NetBIOS (or both). A Quick Filter tab then appears on the Frame
Display. Changing the filter definition on the Quick Filter dialog changes the filter applied on the Quick Filter
tab. Quick filters are persistent during the session, but are discarded when the session is closed.
The box in the center is the Protocols To Hide. When you select the checkbox for a protocol in the Protocols
To Hide, data for that protocol will not appear in the Decode, Binary, Radix, and Character panes. The
frames containing that type data will still appear in the Summary pane, but not in the Decode, Binary, Radix,
and Character panes.
The box on the right is the Named Filters. It contains filters that you create
using the Named Filter and Set Condition dialogs. When you select the
checkbox for the Name Filters, a tab appears on the Summary Pane that
displays the frame containing the specific data identified in the filter. The
named Filter tab remains on the Frame Display Summary
Pane unless you hide it using the Hide/Show Display Filters
dialog.
Check the small box next to the name of each protocol you want to filter in,
hide, or Named Filter to display.
Then click OK
4.4.1.13.3.2 Easy Protocol Filtering
There are two types of easy protocol filtering. The first method lets you filter on the protocol shown in the
Summary pane, and the second lets you filter on any protocol discovered on the network so far.
4.4.2 About The Message Sequence Chart (MSC)
The Message Sequence Chart (MSC) displays information about the messages passed between protocol layers.
MSC displays a concise overview of a Blutetooth connection, highlighting the essential elements fo the connection.
At a glance, you can see the flow of the data including role switches, connection requests, and errors. You can
- 81 -
Chapter 4 Capturing and Analyzing Data
ComProbe High Speed UART User Manual
look at all the packets int he capture, or filter by protocol or profile. the MSC is color coded for a clear and easy
view of your data.
Figure 4.39 - Message Sequence Chart Window
How do I access the chart?
You access the Message Sequence Chart by selecting the icon
or MSC Chart from the View menu from
the Control window or Frame Display.
What do I see on the dialog?
At the top of the dialog you see four icons that you use to zoom in and out of the
display vertically and horizontally. The same controls are available under the View
menu.
There are three navigation icons also on the toolbar.
This takes you to the first Information Frame.
This takes you to first Protocol State Message.
This takes you to the first Error Frame. Click here to learn more about this option.
If there is both Classic and low energy packets, there will be a Classic and LE tab at the top of the dialog.
- 82 -
ComProbe High Speed UART User Manual
Chapter 4 Capturing and Analyzing Data
Figure 4.40 - Classic and LE tabs
If the Classic tab is selected, you will see Classic protocols. If you select the LE tab, you will see LE Protocols. If
there is only Classic or only LE, the Classic and LE tabs will not appear.
Also along the top of the dialog are a series of
protocol tabs. The tabs will vary depending on the
protocols.
Clicking on a tab displays the messaging
between the master and slave for that
protocol. For example, if you select
RFCOMM, you will see the messaging
between the RFCOMM{M} Master, and
the RFCOMM{S} Slave.
The Non-Message Summary tab displays all
the non-message items in the data.
The Ctrl Summary tab displays the
signaling packets for all layers in one
window in the order in which they are received.
The information in the colored boxes displays general information about the messaging. The same is true for each
one of the protocols.
If you want to see the all the messaging in one dialog, you select the All Layers tab.
When you move the mouse over
the message description you see an
expanded tool tip.
If you position the cursor outside of
the message box, the tool tip will
only display for a few seconds.
If, however, you position the cursor
within the tool tip box, the message
will remain until you move the
cursor out of the box.
Additionally, If you right click on a message description, you will see the select Show all Layers button.
- 83 -
Chapter 4 Capturing and Analyzing Data
ComProbe High Speed UART User Manual
When you select Show all Layers, the chart will display all the messaging layers.
The Frame# and Time of the packets are displayed on the left side of the chart.
Figure 4.41 - Frame# and Time Display, inside red box.
If you click on the description of the message interaction, the corresponding information is highlighted in Frame
Display.
Figure 4.42 - MSC Synchronization with Frame Display
How do I navigate in the dialog?
You can use the navigation arrows at the bottom and the right side of the dialog to move vertically and
horizontally. You can also click and hold while moving the pointer within dialog that brings up a directional arrow
that you can use to move left/right and up/down.
Ctrl Summary tab
When you select the Ctrl Summary tab you will see a summary of the control and signaling frames in the order
that they are received/transmitted from and to devices.
- 84 -
ComProbe High Speed UART User Manual
Chapter 4 Capturing and Analyzing Data
Figure 4.43 - Control and Signaling Frames Summay
The frame numbered is shown, whether the message comes from the Master or Slave, the message Address, the
message itself, and the timestamp.
Additionally, the control/signaling packets for each layer are shown in a different background color.
Figure 4.44 - Packet Layers Shown in Different Colors
If you right click within the Ctrl Summary, you can select Show in MSC.
Figure 4.45 - Right-Click in Ctrl Summary to Display Show in MSC
The window then displays the same information, but in the normal MSC view.
- 85 -
Chapter 4 Capturing and Analyzing Data
ComProbe High Speed UART User Manual
Figure 4.46 - MSC View of Selected Packet from Ctrl Summary
You can return to the text version by using a right click and selecting Show in Text.
Figure 4.47 - Return to Text View Using Right-Click Menu
You can also choose to show:
l
Frame # only
l
Time only
l
Show both Frame# and Time
l
Hide both Frame# and Time
4.4.2.1 Message Sequence Chart - Search
The Message Sequence Chart has a Search function that makes it easy to find a specific type message within the
layers.
When you select the 1) Search icon
or 2) use
F3 key, the Select layer and message dialog
appears.
From this dialog you can search for specific protocol
messages or search for the first error frame.
- 86 -
ComProbe High Speed UART User Manual
Chapter 4 Capturing and Analyzing Data
1. On the MSC dialog select one of the protocol tabs at the top.
Note: If you select All Layers in Step 1, the Protocol Layers drop-down list is active. If you
select any of the other single protocols, the Protocol Layers drop-down is grayed out.
2. Or Open the Search dialog using the Search icon or the F3 key.
3. Select a specific Protocol Message from the
drop-down list.
4. Once you select the Protocol Message, click
OK
The Search dialog disappears and the first search
result is highlight in the Message Sequence Chart.
Figure 4.48 - Highlighted First Search Result
If there is no instance of the search value, you see this following dialog.
Once you have set the search value, you can 1) use the Search Previous
and Search Next
buttons or 2) F2 and F4 to move to the next or
previous frame in the chart.
4.4.2.2 Message Sequence Chart - Go To Frame
The Message Sequence Chart has a Go To Frame function that makes it easy to find a specific frame within
the layers.
In addition to Search, you can also locate specific frames by clicking on the Go To Frame
1. Click Go To Frame
in the toolbar.
2. Enter a frame number in the Enter frame No.: text box.
3. Click OK.
- 87 -
toolbar icon.
Chapter 4 Capturing and Analyzing Data
ComProbe High Speed UART User Manual
The Go To Frame dialog disappears and the selected frame is highlighted in the chart.
Once you have identified the frame in Go To, you can 1) use the Search Previous
and Search Next
buttons or 2) F2 and F4 keys to move to the next or previous frame in the chart.
4.4.2.3 Message Sequence Chart - First Error Frame
When you select Go to first error frame from the toolbar
, the Select layer dialog appears.
You have to select a layer from the drop down list to choose what layer you want to search for the error.
Once you select a layer, then OK, the first error for that layer will be displayed.
If no error is found, a dialog will announce that event.
4.4.2.4 Message Sequence Chart - Printing
There are three standard MSC print buttons. Print Preview, Print, and Cancel Printing.
- 88 -
ComProbe High Speed UART User Manual
Chapter 4 Capturing and Analyzing Data
Print Preview
1. When you select Print Preview
, the Print Setup dialog appears.
2. You next need to select your printer from the drop-down list, set printer properties, and format the print
output..
3. Then you select OK.
After you select OK, the Message Sequence Chart Print Preview dialog appears.
Figure 4.49 - Message Sequence Chart Print Preview
The information in the dialog will vary depending on the layer that is selected in the Message Sequence Chart, the
properties of the printer you select, and the amount of data in the layer (which will correspond to the number of
pages displayed).
You control what you see and when to print using the toolbar at the top of the dialog.
Figure 4.50 - Print Preview Toolbar
Table 4.5 - Print Preview Icons
Name
Icon
Description
Prints all the pages to the printer you
select in Print Setup dialog.
Print
When you select Print, you will output
the data that is currently being
displayed.
Cancel Printing
Cancels the current printing.
- 89 -
Chapter 4 Capturing and Analyzing Data
Icon
ComProbe High Speed UART User Manual
Table 4.5 - Print Preview Icons (Continued)
Name
Description
Zoom In Horizontially
Expands the data horizontally so it can
be easier to read.
Zoom Out Horizontally
Squeezes the data together so that more
fits on one page.
Zoom In Vertically
Expands the data vertically so it can be
easier to read.
Zoom Out Vertically
Squeezes the data so that more fits on
one page.
Current Page
The current page text box displays the
page number this is currently shown in
the dialog.
You can enter a number in the text box,
then press Enter, and the dialog will
display the data for that page.
If the data requires multiple pages, the
navigation buttons will take you to:
Page navigation
l
The first page
l
The previous page
l
The next page
l
The last page
Close Print Preview
Closes the dialog and returns to the
Message Sequence Chart
Select Font Size
Allows selection of the print font size
from the drop-down control.
4.5 Analyzing Control Signal Changes - Real Time
4.5.1 Breakout Box Window
The Breakout Box window provides a real-time graphical view of control signals. The window is customizable
based on the control signals you wish to view and your preference of indicators (+/-, 1/0, T/F, arrows, and
simulated LEDs). Also included are counters showing the number of times a control signal has changed.
To open this window click the Breakout Box icon
on the Control window.
Whenever an enabled input changes state it will issue an event and be tagged with a timestamp of when the input
was interpreted by the analyzer. Digital inputs can not exceed a rate of 30 MHz. Digital inputs that occur faster
than that are not guaranteed to be interpreted correctly by the analyzer. Also, only one digital input event may
occur per active packet. All other digital input events can only be handled after the packet has completed. Digital
inputs, although guaranteed to have the correct timestamp given the previous conditions, have the possibility of
being presented out of order because they are provided randomly by the user and have no direct correlation to
- 90 -
ComProbe High Speed UART User Manual
Chapter 4 Capturing and Analyzing Data
the bus. It is important to note that the digital inputs are susceptible to cross-talk if they are not being actively
driven. A situation like this could occur if a digital input has been enabled, but has not been tied to a signal. Any
other nearby signal (i.e., other digital inputs or outputs) could cause the input to activate. It is recommended that
all undriven digital inputs be disabled or tied to ground.
USB: Name - Pin 1, 2, 3, and 4
ComProbe USB monitors four control signals.
Figure 4.51 - ComProbe USB Breakout Box Display
Digital inputs provide a means for users to insert events into the data stream. There are four digital inputs that can
be enabled individually.
HSU: Frontline monitors six RS-232 control signals
DTE Signals
Figure 4.52 - ComProbe HSU Breakout Box Display
l
CTS - Clear To Send
l
DSR - Data Set Ready
l
CD - Carrier Detect
l
RI - Ring Indicator (see the special note on capturing Ring Indicator changes)
- 91 -
Chapter 4 Capturing and Analyzing Data
ComProbe High Speed UART User Manual
4.5.1.1 Ring Indicator
The following information applies when operating the analyzer in Spy mode or Source DTE, No FTS Cables
mode. When using the cables supplied with the analyzer to capture or source data, Ring Indicator (RI) is routed to
a different pin which generates interrupts normally.
There is a special case involving Ring Indicator and computers with 8250 UARTs or UARTs from that family where
the state of RI may not be captured accurately. Normally when a control signal changes state from high to low or
low to high, an interrupt is generated by the UART, and the analyzer goes to see what has changed and record it.
Ring Indicator works a little differently. An interrupt is generated when RI changes from high to low, but not when
RI changes from low to high. If Ring Indicator changes from low to high, the analyzer does not know that RI has
changed state until another event occurs that generates an interrupt. This is simply the way the UART works, and
is not a deficiency in the analyzer software.
To minimize the chance of missing a Ring Indicator change, the analyzer polls the UART every millisecond to see if
RI has changed. It is still possible for the analyzer to miss a Ring Indicator change if RI and only RI changes state
more than once per millisecond.
UARTs in the 8250 family include 8250s, 16450s, 16550s and 16550 variants. If you have any questions about the
behavior of your UART and Ring Indicator, please contact technical support.
4.5.2 Reading the Breakout Box Window
The Breakout Box display is divided into three main parts. The first part (to the far left of the screen) shows the
abbreviated name of the control signal being monitored. These names can be changed in the I/O Settings window
by selecting Names from the Options menu.
The second part shows the control signal counters. The counters show how many times each control signal has
changed state. This is useful in situations when signals may be changing state too rapidly to be displayed
graphically.
The third part of the Breakout Box shows the current states of the control signals. The indicators show the state
that the control signal is currently in, and the line graph displays the state of the signal over time. A single line
means that the signal is logically off, while a double line means that the signal is logically on. A half-height "tick"
means that a signal has gone through one full transition (from off to on to off, or vice versa) since the analyzer last
updated the screen.
To change the indicators, or change the rate at which the analyzer updates the window, click on the Options icon
.
4.5.3 The Breakout Box Toolbar
Table 4.6 - Breakout Box Toolbar Icons
Icon
Description
Home - brings the Control window to the front.
Reset - resets the Breakout Box window.
Lock - Locks the display. Clicking on the Lock icon, unlocks the window.
- 92 -
ComProbe High Speed UART User Manual
Chapter 4 Capturing and Analyzing Data
Table 4.6 - Breakout Box Toolbar Icons(continued)
Icon
Description
Unlock - In the Unlock state, the screen fills in the data captured since the screen lock and
moves down to display incoming data again. Clicking on the Unlock icon, locks the window.
Options - Brings up the Breakout Box Options window. This window allows you to change
the window refresh rate and choose which control signals to display.
4.5.4 Selecting Breakout Box Options
To access Options click the Options icon
on the Breakout Box toolbar or choose Breakout Box
options under the Options menu.
Display Signal - This box shows which control signals the analyzer monitors.
l
l
A check mark next to a control signal name indicates that the breakout box displays the status of that
control signal.
To prevent the analyzer from displaying the status of a signal, un-check the box next to it.
Window Refresh Rate - The refresh rate is the rate at which the analyzer updates the window.
l
l
By default, the analyzer refreshes the display once every 1,000 milliseconds (one second.)
To change the rate, highlight the number in the box and enter a new number. See Performance Notes for
information on how Window Refresh Rate can affect performance.
Indicators - You can choose what type of indicators the analyzer uses.
l
l
l
The default indicators are a green "+" sign to show a logically high state, and a red "-" sign to show a
logically low state.
To change the indicators, click on the down arrow and choose a pair of indicators from the list.
As a reminder, the analyzer gives the definition of the indicators in the top part of the Breakout Box
window.
4.5.4.1 Performance Notes
As a software-based product, the speed of your computer’s processor affects the analyzer’s performance. Buffer
overflow errors are an indicator that the analyzer is unable to keep up with the data. The information below
describes what happens to the data as it arrives, what the error means, and how various aspects of the analyzer
affect performance. Also included are suggestions on how to improve performance.
The analyzer's driver takes data from the driver and counts each byte as they are put into the driver’s buffer. The
analyzer's driver tells the user interface that data is ready to be processed. The analyzer takes the data from the
driver’s buffer and puts the data into the capture buffer.
Driver Buffer Overflows occur when the user interface does not retrieve frames from the driver quickly
enough. Buffer overflows are indicated in the Event Display window by a plus sign within a circle. Clicking on
the buffer overflow symbol displays how many frames have been lost.
There are several things that you can do to try and solve this problem.
- 93 -
Chapter 4 Capturing and Analyzing Data
l
l
l
l
l
l
ComProbe High Speed UART User Manual
Use capture filters to filter out data you don't need to see. Capture filters reduce the amount of data
processed by the analyzer. (Ethernet Only)
Close all other programs that are doing work while the analyzer is running. Refrain from doing searches in the
Event Display window or other processor intensive activities while the analyzer is capturing data.
Timestamping takes up processor time, primarily not in timestamping the data, but in writing the timestamp to
the file. Try turning off timestamping from the Timestamping Options window.
For Driver Buffer Overflows, change the size of the driver buffer. This value is changed from the
Advanced System Settings. Go to the Control window and choose System Settings from the Options
menu. Click on the Advanced button. Find the value Driver Receive Buffer Size in Operating System
Pages. Take the number listed there and double it.
The analyzer’s number one priority is capturing data; updating windows is secondary. However, updating
windows still takes a certain amount of processor time, and may cause the analyzer to lose data while the
window is being updated. Some windows require more processing time than others because the information
being displayed in them is constantly changing. Refrain from displaying data live in the Event Display and
Frame Display windows. The analyzer can capture data with no windows other than the Control window
open.
If you are still experiencing buffer overflows after trying all of the above options, then you need to use a faster
PC.
4.6 Viewing Historical Signal Changes
4.6.1 Signal Display Window
The Signal Display window provides a graphical view of control signal transitions that you can manipulate. You
can zoom in to view the state of control signals for a range of events, or zoom out to view control signal changes
over the course of an entire capture session.
To open this window click the Signal Display icon
on the Control window toolbar, or choose Signal
Display from the Window menu.
The Signal Display window does not provide a real-time view of control signal changes. It is intended to be
used as a post-process review screen. Use the Breakout Box window to view real-time control signal changes.
Note that if you bring up the Signal Display window while data is being captured, the window shows you the
state of the control signals at the time the window was opened. This is called a "snapshot" because it is a picture of
the buffer at the time the Signal Display was opened. To update the display to reflect the current state of the
buffer, use the New Snapshot icon
.
When you open Signal Display you will see a set of codes.
For all High Speed Serial Sniffing options you will see six control signals. These include:
l
RTS(Request to Send DCE Signal)
l
CTS (Clear to Send)
l
DSR (Data Set Ready
l
DTR (Data Terminal Ready)
- 94 -
ComProbe High Speed UART User Manual
l
CD (Carrier Data)
l
RI (Ring Indicator)
Chapter 4 Capturing and Analyzing Data
Figure 4.53 - USB Signal Display Window
Figure 4.54 - HSU Signal Display Window
4.6.2 Signal Display Toolbar
Table 4.7 - Signal Display Toolbar
Icon
Description
Home - brings the Control window to the front.
Take New Snapshot - Takes a new "picture" of the capture buffer. If you are capturing data
when you open the Signal Display window, the window shows only the state of the control
signals that were in the buffer when the window was opened. Click this button to update the
window with the contents of the current buffer.
- 95 -
Chapter 4 Capturing and Analyzing Data
ComProbe High Speed UART User Manual
Table 4.7 - Signal Display Toolbar (continued)
Icon
Description
Zoom In - "Zooms in" on the signal display. How much you zoom in is determined by your
selection in the Signals menu. You can zoom in by a factor of 2, 4, or 8.
Zoom Out - Reverse of Zoom In.
Zoom to Selection - Zooms to show only the region highlighted on the screen. If the
highlighted area contains few events, the Signal Display window may also display
additional events in order to fill up the screen.
Display Entire Buffer - Zooms all the way out to display the contents of the entire buffer in
the window.
Find - Opens the Control Signal change window.
Snap to Nearest Change - Moves the cursor to the nearest signal change whenever you
click on the line graphics in the window. Find the line for the control signal whose changes
you want to see. Click on that line, and the analyzer moves to the nearest signal change for
that control signal. You can also highlight a range, and the analyzer snaps to the 2 nearest
changes on either side of the range.
Timestamping Options - Opens the Timestamping Options window, where you can change
the timestamping resolution and how timestamps are displayed.
4.6.3 Reading the Signal Display
Control signal changes are displayed in a graphical format. On the left side of the screen is a list of the signals
currently being displayed, and to the right of each name is a line displaying the state of the signal over time. A
single line means that the signal was logically off, while a double line means that the signal was logically on. Dotted
lines are used for signals that were not present at the time of capture. For example, if you are monitoring a circuit
that does not use CD, that line appears as a dotted line in the control signal display.
The four information lines at the bottom of the window tell you what events are being shown in the window, and
where you are in relation to the buffer as a whole.
l
l
l
l
Current Snapshot: The first line tells you what event numbers are in the current snapshot, the total number
of events, and the amount of time that passed between the first event in the snapshot and the last event
(called Delta).
Current Visible: The second line gives the same information about the events that are currently visible in
the window. Because you can zoom in and out, often the events being shown in the window are not the same
as the number of events in the current snapshot.
Currently Selected: The third line gives the same information for the currently selected events. You can
highlight a range of events by clicking at any point on the graphical display and dragging the mouse to the left
or the right. The third line shows information for the selected range.
Selected Time: The fourth and last line shows the exact timestamps of the first and last bytes in the currently
selected range. Note that this does not tell you the timestamp for the entire snapshot or the events displayed
in the window, just the highlighted events. The raw timestamp value is the number of 100-nanosecond
intervals since the beginning of January 1, 1601. This is standard Windows time.
- 96 -
ComProbe High Speed UART User Manual
Chapter 4 Capturing and Analyzing Data
A single mouse click places the cursor in the window. The analyzer highlights all six signal changes in one color,
and uses a different color to specify the control signal line clicked on. You can highlight a range by clicking and
dragging the mouse to the right or left. You can also use the arrow keys to move the cursor to the right or left.
The Signal Display window is synchronized with other windows in the analyzer. A range highlighted in the Signal
Display window is also highlighted in the Event Display and Frame Display windows.
The Snap to Nearest Change icon
lets you place the cursor on the signal change you want to look at
without needing to click on exactly the right spot. Find the line corresponding to the control signal you want to
look at. Click on the line, and the analyzer moves the cursor to the nearest change. If you highlight a range, the
analyzer "snaps to" the nearest changes on either side. This feature is active when the Snap To button is pressed,
and inactive when the button is not pressed.
Use the Zoom In and Zoom Out buttons to increase and decrease the magnification of the window. The
analyzer changes the magnification by a factor of 2, 4 or 8, depending on the option selected in the Signals menu.
If you want to see a range in greater detail, highlight the range you want to view and click on the Zoom to
Selection icon
. The analyzer zooms in to show only that range in the window. If the range is small, the
analyzer may add additional events to fill up the window. To view the entire snapshot in the window, click on the
Display Entire Buffer icon
.
Note that if you bring up the Signal Display window while data is being captured, the window shows you the
state of the control signals at the time the window was opened. To update the display, use the New Snapshot icon
.
4.6.4 Selecting Signal Display Options
To access Signal Display Options Click the Signal Display icon
on the Control window toolbar. From the
Options menu, select Signal Display Options.
To choose which control signals to display in the Signal Display window:
l
Click on a box to check or un-check it the control signal name.
l
A check mark next to a control signal name means that the signal is displayed.
Figure 4.55 - HSU Signal Display Options
- 97 -
Chapter 4 Capturing and Analyzing Data
ComProbe High Speed UART User Manual
4.7 Statistics
4.7.1 Statistics Window
The Statistics window supplies basic information about the data on the network. When reviewing a capture file,
the Statistics window shows a summary of the data in the file.
Figure 4.56 - HSU Statistics Window
To open the Statistics window, click the Statistics icon
on the Control window toolbar, or choose
Statistics from the View menu on the Control window.
The analyzer monitors the network and collects statistics all the time, even when data is not actively being
captured. Activate the Lock icon
to stop the window from updating. Click the Unlock icon
again to
resume updating. The analyzer continues to monitor network traffic while the Statistics window is locked, so
you may see the numbers jump right after updating has resumed, reflecting all the statistics that were gathered
while the window was locked.
- 98 -
ComProbe High Speed UART User Manual
Chapter 4 Capturing and Analyzing Data
Statistics Window Menus
Menu
Edit
View
Selection
Table 4.8 - HSU Statistics Window Menus
Description
Copy All To
Clipboard
Copies all collected statistics to the Windows clipboard.
Notes
Opes the notes dialog for recording comments on a capture file. Only
available when view a capture file.
Copy Utilization To
Clipboard
Copies the channel utilization statistics to the Windows clipboard.
Copy Octets/Sec To
Clipboard
Copies throughput rate statistics to the Windows clipboard.
Copy Data To
Clipboard
Copies data statistics to the Windows clipboard.
Copy Errors To
Clipboard
Copies channel parity and framing errors to the Windows Clipboard.
Copy Buffer To
Clipboard
Copies the current buffer data to the Windows clipboard
Control Window
Event Display
Frame Display
Signal Display
When checked will open the window or Statistics Window bar. When
not checked, the window or bar is closed.
Breakout Box
Toolbar
Status Bar
Graph
Toggle Display Lock
When checked, the displayed statistics will stop updating, although
data is still being captured. Unchecking will resume statistics
updating.
Reset
Available during live capture. Resets all displayed statistics and
restarts the calculations.
Graph Errors...
Opens the Errors HSU window.
Options I/O Settings...
Set Timestamping
Format
Performs the same function as the control Window Options Menu, I/O
Settings
Opens the Timestamping Options window that allows for changing the
resolution of the timestamps.
Change the Font Size Opens a pop-up with font size selections.
- 99 -
Chapter 4 Capturing and Analyzing Data
Menu
ComProbe High Speed UART User Manual
Table 4.8 - HSU Statistics Window Menus (continued)
Selection
Description
Window Close Window
Closes the Statistics Window
ComProbe Protocol
Analysis System
Statistics
Clicking on these selections will change the focus from the Statistics
Window to the selected window.
Errors
Help
Help Topics
Opens the ComProbe Help window.
About ComProbe
Protocol Analysis
System
Provides a pop-up showing the version and release information,
Frontline contact information, and copyright information.
Support on the Web
Opens a browser to fte.com technical support page.
Statistics Window Toolbar
Statistics Window Toolbar Icons
Icon
Description
Changes the focus to the Control
Window
Reset the statistics tables
Display Lock/Unlock
Timestamp Format
4.7.2 Session, Resettable and Capture File Tabs
The Session, Resettable, and Capture File tabs are parts of the
Statistics and Errors windows.
Information about all data collected since the analyzer was started is
shown in the Session tab. The Session tab cannot be reset; in this
sense, it is like the odometer on a car. The odometer on a car shows you all the miles driven since the car was
built, and the Session tab shows you all the data collected since the analyzer was started.
If you think of the Session tab as the odometer, then the Resettable tab is the trip odometer. It can be reset,
and allows you to record statistics for a new "trip". In this way you can effectively start a new session without
having to restart the analyzer. If the Reset button
was pressed during the capture, then the numbers on this
tab differs from the numbers on the Session tab.
- 100 -
ComProbe High Speed UART User Manual
Chapter 4 Capturing and Analyzing Data
The timestamp appearing in Session tab fields is the timestamp of when the analysis began. The timestamp
appearing in the Resettable tab fields is the timestamp either when the analysis began or when the last Reset
was initialted.
The Capture File tab shows information on the data that is currently in the capture. If the capture file had
become full, the analyzer began to overwrite the oldest data and put new data in its place. This is called
"wrapping". If the file wrapped, the numbers on the Capture File tab is smaller than those on the Session tab.
Occasionally some of the statistics read "n/a", for Not Available. This happens for various reasons. For example,
many of the items on the Capture File tab become not available if the buffer becomes full and wraps. When this
happens, the analyzer can no longer provide accurate statistics for the data in the file, because some of the data
that the statistics are based on has been lost.
4.7.3 Copying Statistics To The Clipboard
Any table in the Statistics window can be copied to the clipboard where it can be pasted into any application.
1. Choose the name of the table from the Edit menu.
2. To copy the contents of all the tables, choose Copy All to Clipboard.
Figure 4.57 - HSU Edit Menu for Copying
4.7.4 Graphs
4.7.4.1 Statistics Errors Graphs
Open the Statistics window and click on the picture of a graph
on the Errors table header, or choose the
graph name from the Graph menu on the Statistics window.
The Frame Sizes Graph window has Session, Resettable and Capture File tabs that correspond to the tabs on
the Statistics window. Each tab shows the data that corresponds to the appropriate tab on the Statistics
window.
The window displays the errors in either a pie chart or bar graph format. Click the Pie icon
chart, and click the Bar icon
to display a bar graph.
- 101 -
to display a pie
Chapter 4 Capturing and Analyzing Data
ComProbe High Speed UART User Manual
For the HSU, the analyzer displays one graph for each channel. To view the aggregate of all channels, click the
Aggregate icon
.
4.7.4.2 Printing Error Graphs
Click the Print icon
to print the graph. The analyzer prints exactly what is shown in the window.
- 102 -
Chapter 5 Navigating and Searching the Data
The following sections describe how to navigate through the data and how to find specific data or packet
conditions of interest to the user.
5.1 Find
Capturing and decoding data within the ComProbe analyzer produces a wealth of information for analysis. This
mass of information by itself, however, is just that, a mass of information. There has to be ways to manage the
information. ComProbe software provides a number of different methods for making the data more accessible.
One of these methods is Find.
Figure 5.1 - Find Dialog
- 103 -
ComProbe High Speed UART User Manual
Chapter 5 Navigating and Searching the Data
Find, as the name suggests, is a comprehensive search function that allows users to search for strings or patterns
in the data or in the frame decode. You can search for errors, control signal changes, bookmarks, special events,
time, and more. Once the information is located, you can easily move to every instance of the Find results.
5.1.1 Searching within Decodes
Searching within decodes lets you to do a string search on the data in the Decode Pane of the Frame Display
window.
To access the search within decodes function:
1. Open a capture file to search.
2. Open the Event Display
3. Click on the Find icon
or Frame Display
window.
or choose Find from the Edit menu.
4. Click on the Decode tab of the Find dialog.
Note: The tabs displayed on the Find dialog depend on the product you are running and the content
of the capture file you are viewing.
Figure 5.2 - Find Decode Tab Search for String
- 104 -
Chapter 5 Navigating and Searching the Data
ComProbe High Speed UART User Manual
Figure 5.3 - Find Decode Tab Side Restriction
There are several options for error searching on the Decoder tab.
l
l
Search For String in Decoder allows you to enter a string in the text box. You can use characters, hex or
binary digits, wildcards or a combination of any of the formats when entering your string. Every time you type
in a search string, the analyzer saves the search. The next time you open Find, the drop-down list will contain
your search parameters.
Search for All Errors finds frame errors as well as frames with byte-level errors (such as parity or CRC
errors).
l
Search for Frame Errors Only finds frame specific errors, such as frame check errors.
l
Search for Information Frame only searches information frames.
1. Enter the search string.
2. Check Ignore Case to do a case-insensitive search.
3. When you have specified the time interval you want to use, click on the Find Next or Find Previous
buttons to start the search from the current event.
The result of the search is displayed in the Decode pane in Frame Display.
- 105 -
ComProbe High Speed UART User Manual
Chapter 5 Navigating and Searching the Data
Side Restrictions - Side Restriction means that the analyzer
looks for a pattern coming wholly from the DTE or DCE side. If you
choose to search without regard for data origin, the analyzer looks
for a pattern coming from one or both sides. For example, if you
choose to search for the pattern ABC and you choose to search
without regard for data origin, the analyzer finds all three instances
of ABC shown here.
The first pattern, with the A and the C coming from the DTE device
and the B coming from the DCE is a good example of how using a
side restriction differs from searching without regard to data origin.
While searching without regard for data origin finds all three
patterns, searching using a side restriction never finds the first
pattern, because it does not come wholly from one side or the
other.
If you choose to search for the pattern ABC, and you restrict the
search to just the DTE side, the analyzer finds the following pattern:
In this example, the analyzer finds only the second pattern
(highlighted above) because we restricted the search to just the
DTE side. The first pattern doesn't qualify because it is split between
the DTE and DCE sides, and the third pattern, though whole, comes
from just the DCE side.
If we choose both the DTE and the DCE sides in the above example,
then the analyzer finds the second pattern followed by the third
pattern, but not the first pattern. This is because each side has one
instance in which the whole pattern can be found. The analyzer
completely searches the DTE side first, followed by the DCE side.
Note: Side Restriction is available for pattern and error searching.
1. Select one of the two options.
2. Select DTE, DCE, or both.
3. When you made your selections, click on the Find Next or Find Previous buttons to start the search
from the current event.
The result of the search is displayed in the Decode pane in Frame Display.
5.1.2 Searching by Pattern
Search by Pattern lets you perform a traditional string search. You can combine any of the formats when
entering your string, and your search can include wildcards.
To access the search by pattern function:
1. Open a capture file to search.
2. Open the Event Display
or Frame Display
- 106 -
window.
Chapter 5 Navigating and Searching the Data
3. Click on the Find icon
ComProbe High Speed UART User Manual
or choose Find from the Edit menu.
4. Click on the Pattern tab of the Find dialog.
Note: The tabs displayed on the Find dialog depend on the product you are running and the content
of the capture file you are viewing.
Figure 5.4 - Find Pattern Tab
Figure 5.5 - Find Pattern Tab Side Restrictions
Pattern allows you to enter a string in the text box. You can use characters, hex or binary digits, control
characters, wildcards or a combination of any of the formats when entering your string. Every time you type in a
search string, the ComProbe analyzer saves the search. The next time you open Find, the drop-down list will
contain your search parameters.
1. Enter the search pattern.
2. Check Ignore Case to do a case-insensitive search.
- 107 -
ComProbe High Speed UART User Manual
Chapter 5 Navigating and Searching the Data
3. When you have specified the pattern you want to use, click on the Find Next or Find Previous buttons
to start the search from the current event.
The result of the search is displayed in the in Frame Display and Event Display.
Refer to Searching by Decode on page 104 for information on Side Restrictions
5.1.3 Searching by Time
Searching with Time allows you search on timestamps on the data in Frame Display and Event Display
window.
To access the search by time function:
1. Open a capture file to search.
2. Open the Event Display
3. Click on the Find icon
or Frame Display
window.
or choose Find from the Edit menu.
4. Click on the Time tab of the Find dialog.
Note: The tabs displayed on the Find dialog depend on the product you are running and the content
of the capture file you are viewing.
Figure 5.6 - Find by Time tab
The analyzer can search by time in several different ways.
Search for Absolute/Relative timestamp.
- 108 -
Chapter 5 Navigating and Searching the Data
l
l
ComProbe High Speed UART User Manual
Absolute - An absolute timestamp search means that the analyzer searches for an event at the exact date and
time specified. If no event is found at that time, the analyzer goes to the nearest event either before or after
the selected time, based on the "Go to the timestamp" selection.
Relative - A relative search means that the analyzer begins searching from whatever event you are currently
on, and search for the next event a specific amount of time away.
1. Select Absolute or Relative
2. Select the date and time using the drop-down lists for Month, Year, Day, Hour, Minute, Second,
1/10000000.
Note: Month and Year are not available if you select Relative.
3. When you have specified the time interval you want to use, click on the Go To, Move Forward or Move
Backward buttons to start the search from the current event.
Note: When you select Absolute as Search for, Go To is available. When you select
Relative as Search for, Move Forward or Move Backwardis available.
Go to the timestamp: On or before/ On or after
The analyzer searches for an event that matches the time specified. If no event is found at the time specified, the
analyzer goes to the nearest event either before or after the specified time. Choose whether to have the analyzer
go to the nearest event before the specified time or after the specified time by clicking the appropriate radio
button in the Go to the timestamp box.
If you are searching forward in the buffer, you usually want to choose the On or After option. If you choose the
On or Before option, it may be that the analyzer finishes the search and not move from the current byte, if that
byte happens to be the closest match.
When you select Absolute as Search for, the radio buttons are On or before the specified time or On or
after the specified time. When you select Relative as Search for, the radio buttons are On or before the
specified time relative to the first selected item or On or after the specified time relative to the last
selected item.
1. Select On or before the specified time or On or after the specified time.
2. When you have specified the time interval you want to use, click on the Go To, Move Forward or Move
Backward buttons to start the search from the current event.
When you select Absolute as Search for, Go To is available. When you select Relative as Search for,
Move Forward or Move Backwardis available.
There are a couple of other concepts to understand in respect to searching with timestamps.
l
The analyzer skips some special events that do not have timestamps, such as frame markers. Data events that
do not have timestamps because timestamping was turned off either before or during capture are also
skipped.
- 109 -
ComProbe High Speed UART User Manual
l
l
Chapter 5 Navigating and Searching the Data
Timestamping can be turned on and off while data is being captured. As a result, the capture buffer may have
some data with a timestamp, and some data without. When doing a search by timestamp, the analyzer ignores
all data without a timestamp.
The raw timestamp value is the number of 100-nanosecond intervals since the beginning of January 1, 1601.
This is standard Windows time.
5.1.4 Using Go To
Searching with Go To allows you to go to a particular frame or event, or to move through the data X number of
events or frames at a time. You can move either forward or backwards through the data.
To access the Go To function:
1. Open a capture file to search.
2. Open the Event Display
3. Click on the Find icon
or Frame Display
window.
or choose Find from the Edit menu.
4. Click on the Go To tab of the Find dialog. 5. The system displays the Find dialog with the Go To tab selected.
Note: The tabs displayed on the Find dialog depend on the product you are running and the
content of the capture file you are viewing.
Figure 5.7 - Find Go To tab
To go to a particular frame :
1. Select the Frame Number radio button
2. Type the frame number in the box.
3. Click the Go To button.
- 110 -
Chapter 5 Navigating and Searching the Data
ComProbe High Speed UART User Manual
4. To move forward or backward a set number of frames, type in the number of frames you want to move
5. Then click the Move Forward or Move Back button.
To go to a particular event :
1. Select the Data Event Number or All Events Number radio button.
2. Type the number of the event in the box.
3. Click the Go To button.
4. To move forward or backwards through the data, type in the number of events that you want to move
each time.
5. Then click on the Move Forward or Move Backward button.
6. For example, to move forward 10 events, type the number 10 in the box, and then click on Move
Forward. Each time you click on Move Forward, Frontline moves forward 10 events.
See Event Numbering for why the Data Event Number and All Events Number may be different. As a
general rule, if you have the Show All Events icon
depressed on the Event Display window or Frame
Display Event pane, choose All Events Number. If the Show All Events button is up, choose Data Event
Number.
5.1.5 Searching for Special Events
Frontline inserts or marks events other than data bytes in the data stream. For example, the analyzer inserts startof-frame and end-of-frame markers into framed data, marking where each frame begins and ends. If a hardware
error occurs, the analyzer shows this using a special event marker. You can use Find to locate single or multiple
special events.
To access the search for special events function:
1. Open a capture file to search.
2. Open the Event Display
3. Click on the Find icon
or Frame Display
window.
or choose Find from the Edit menu.
4. Click on the Special Events tab of the Find dialog.
Note: The tabs displayed on the Find dialog depend on the product you are running and the
content of the capture file you are viewing.
- 111 -
ComProbe High Speed UART User Manual
Chapter 5 Navigating and Searching the Data
Figure 5.8 - Find Special Events tab
5. Check the event or events you want to look for in the list of special events. Use Check All or Uncheck
All buttons to make your selections more efficient.
6. Click Find Next and Find Previous to move to the next instance of the event.
Not all special events are relevant to all types of data. For example, control signal changes are relevant only to
serial data and not to Ethernet data.
For a list of all special events and their meanings, see List of all Event Symbols on page 44.
5.1.6 Searching by Signal
Searching with Signal allows you to search for changes in control signal states for one or more control signals. You
can also search for a specific state involving one or more control signals, with the option to ignore those control
signals whose states you don’t care about.
The analyzer takes the current selected byte as its initial condition when running searches that rely on finding
events where control signals changed.
To access the search by time function:
1. Open a capture file to search.
2. Open the Event Display
3. Click on the Find icon
or Frame Display
window.
or choose Find from the Edit menu.
4. Click on the Signal tab of the Find dialog. - 112 -
Chapter 5 Navigating and Searching the Data
ComProbe High Speed UART User Manual
Note: The tabs displayed on the Find dialog depend on the product you are running and the content
of the capture file you are viewing.
Figure 5.9 - Find Signal tab.
You will choose one qualifier—Searching for event where, then choose one or more control signals
Control Signals
The section with the check boxes allows you to specify which control signals the analyzer should pay attention to
when doing the search. The analyzer pays attention to any control signal with a check mark.
l
Click on a box to place a check mark next to a control signal
l
Click again to uncheck the box
l
By default, the analyzer searches all control signals, which means all boxes start out checked.
For example, if you are only interested in finding changes in RTS and CTS, you would check those two boxes
and uncheck all the other boxes. This tells the analyzer to look only at the RTS and CTS lines when running the
search. The other signals are ignored.
The control signals types include:
l
USB - Pin 1
l
USB - Pin 2
l
USB - Pin 3
l
USB - Pin 4
Click here to learn more about the Breakout Box and Pins 1 - 4.
- 113 -
ComProbe High Speed UART User Manual
Chapter 5 Navigating and Searching the Data
Searching for event where:
l
l
The first three options are all fairly similar, and are described together. These options are searching for an
event where:
One or more control signals changed
o
One or more control signals changed from off to on
o
One or more control signals changed from on to off
Searching for an event where one or more signals changed means that the analyzer looks at every control
signal that you checked, and see if any one of those signals changed state at any time.
o
l
o
If you want to look at just one control signal:
n
Check the box for the signal.
n
Uncheck all the other boxes.
n
Choose to search for an event where one or more signals changed.
n
The analyzer notes the state of the selected signal at the point in the buffer where the cursor is,
search the buffer, and stop when it finds an event where RTS changed state.
n
If the end of the buffer is reached before an event is found, the analyzer tells you that no matches
were found.
Searching for events where control signals changed state from off to on, or vice versa, is most useful if the
signals are usually in one state, and you want to search for occasions where they changed state.
For example:
l
o
If DTR is supposed to be on all the time but you suspect that DTR is being dropped
o
Tell the analyzer to look only at DTR by checking the DTR box and unchecking the others
o
Do a search for where one or more control signals changed from on to off.
o
The analyzer would search the DTR signal and stop at the first event where DTR dropped from on to off.
Searching for an Exact State
To search for an exact state means that the analyzer finds events that match exactly the state of the control
signals that you specify.
o
First, choose to search for an event where your choices exactly describe the state.
o
This changes the normal check boxes to a series of radio buttons labeled On, Off and Don’t Care for
each control signal.
o
Choose which state you want each control signal to be in.
o
Choose Don’t Care to have the analyzer ignore the state of a control signal.
o
When you click Find Next, the analyzer searches for an event that exactly matches the conditions
selected, beginning from the currently selected event.
- 114 -
Chapter 5 Navigating and Searching the Data
ComProbe High Speed UART User Manual
o
If the end of the buffer is reached before a match is found, the analyzer asks you if you want to
continue searching from the beginning.
o
If you want to be sure to search the entire buffer, place your cursor on the first event in the buffer.
o
Select one of the four radio buttons to choose the condition that must be met in the search
o
Select one or more of the checkboxes for Pin 1, 2, 3, or 4.
o
Click Find Next to locate the next occurrence of the search criteria or Find Previous to locate an
earlier occurrence of the search criteria.
5.1.7 Searching for Data Errors
The analyzer can search for several types of data errors. Searching for data error sallows you to choose which
errors you want to search for and whether to search the DTE or DCE data or both. Bytes with errors are shown in
red in the Event Display window, making it easy to find errors visually when looking through the data.
To access the search by time function:
1. Open a capture file to search.
2. Open the Event Display
3. Click on the Find icon
or Frame Display
window.
or choose Find from the Edit menu.
4. Click on the Errors tab of the Find dialog.
Note: The tabs displayed on the Find dialog depend on the product you are running and the content
of the capture file you are viewing.
Figure 5.10 - Find Error tab.
Searching for event where
- 115 -
ComProbe High Speed UART User Manual
Chapter 5 Navigating and Searching the Data
The first three options are all fairly similar, and are described together. These options are searching for an event
where:
l
one or more error conditions changed
l
one or more error conditions occurred
l
one or more error conditions were off (i.e. no errors occurred)
Selecting Which Errors to Search
The section with the check boxes allows you to choose which errors the analyzer should look for. Click on a box
to check or un-check it.
If you want to search only for overrun errors
l
check the box if shown
l
un-check the other boxes.
To search for all types of errors
l
check all boxes
The most common search is looking for a few scattered errors in otherwise clean data.
To do this type of search:
l
choose to Search for an event where one or more error conditions occurred
l
choose which errors to look for
l
By default, the analyzer looks for all types of errors.
In contrast, searching for an event where one or more error conditions were off means that the analyzer looks for
an event where the errors were not present.
For example, if you have data that is full of framing errors, and you know that somewhere in your 20 megabyte
capture file the framing got straightened out, you could choose to search for an event where one or more error
conditions were off, and choose to search only for framing. The analyzer searches the file, and finds the point at
which framing errors stopped occurring.
Searching for an event where the error conditions changed means that the analyzer searches the data and stop at
every point where the error condition changed from on to off, or off to on.
For example, if you have data where sometimes the framing is wrong and sometimes right, you would choose to
search framing errors where the error condition changed. This first takes you to the point where the framing
errors stopped occurring. When you click Find Next, the analyzer stops at the point when the errors began
occurring again. Clicking Find Previous will search backwards from the current postion.
The analyzer takes the current selected byte as its initial condition when running searches that rely on finding
events where error conditions changed. The analyzer searches until it finds an event where error conditions
changed or it reaches the end of the buffer, at which point the analyzer tells you that there are no more events
found in the buffer. If you are searching for an exact match, the analyzer asks you if you want to continue
searching from the beginning of the buffer.
Searching for Exact Error Conditions
- 116 -
Chapter 5 Navigating and Searching the Data
ComProbe High Speed UART User Manual
To search for an exact state means that the
analyzer finds events that exactly match the
error conditions that you specify.
l
l
l
Select the This exactly describes the
state radio button.
This changes the normal check boxes to a
series of radio buttons labeled On, Off
and Don’t Care for each error.
o
On means that the error occurred
o
Off means that the error did not
occur
o
Don’t Care means that the analyzer
ignores that error condition.
Select the appropriate state for each type of error.
Example:
If you need to find an event where just an overrun error occurred, but not any other type of error, you would
choose overrun error to be On, and set all other errors to Off. This causes the analyzer to look for an event where
only an overrun error occurred.
If you want to look for events where overrun errors occurred, and other errors may have also occurred but it
really doesn’t matter if they did or not, choose overrun to be On, and set the others to Don’t Care. The analyzer
ignores any other type of error, and find events where overrun errors occurred.
To find the next error, click the Find Next button. To find an error that occurred earlier in the buffer to where you
are, click the Find Previous button.
5.1.8 Find - Bookmarks
Searching with Bookmarks allows you search on specific bookmarks on the data in Frame Display and Event
Display window. Bookmarks are notes/reminders of interest that you attach to the data so they can be accessed
later.
To access the search for bookmarks
1. Open a capture file to search.
2. Open the Event Display
3. Click on the Find icon
or Frame Display
window.
or choose Find from the Edit menu.
4. Click on the Bookmarks tab of the Find dialog.
Note: The tabs displayed on the Find dialog depend on the product you are running and the content of the
capture file you are viewing.
- 117 -
ComProbe High Speed UART User Manual
Chapter 5 Navigating and Searching the Data
Figure 5.11 - Find Bookmark tab.
There are several ways to locate bookmarks.
l
Select the bookmark you want to move to and click the Go To button.
l
Simply double-click on the bookmark.
l
Click the Move Forward and Move Back buttons to move through the frames to the bookmarks shown in
the window. When the bookmark is found it is highlighted in the window.
There are three ways to modify bookmarks:
1. Click on Delete to remove the selected bookmark.
2. Click on Modify... to change the selected Bookmark name.
3. Remove All will delete all bookmarks in the window.
The Find window Bookmark tab will also appear when using functions other than Find such as when clicking on
the Display All Bookmarks
icon.
5.1.9 Changing Where the Search Lands
When doing a search in the analyzer, the byte or bytes matching the search criteria are highlighted in the Event
Display. The first selected byte appears on the third line of the display.
To change the line on which the first selected byte appears:
1.
Open fts.ini (located in the C:\User\Public\Public Documents\Frontline Test
Equipment\)
2. Go to the [CVEventDisplay] section
3. Change the value for SelectionOffset.
4. If you want the selection to land on the top line of the display, change the SelectionOffset to 0 (zero).
- 118 -
Chapter 5 Navigating and Searching the Data
ComProbe High Speed UART User Manual
5.1.10 Subtleties of Timestamp Searching
Timestamping can be turned on and off while data is being captured. As a result, the capture buffer may have
some data with a timestamp, and some data without. When doing a search by timestamp, the analyzer ignores all
data without a timestamp.
Note: The raw timestamp value is the number of 100-nanosecond intervals since the beginning of
January 1, 1601. This is standard Windows time.
5.2 Bookmarks
Bookmarks are electronic sticky notes that you attach to frames of interest so they can be easily found later. In
Frame Display bookmarked frames appear with a magenta triangle icon next to them.
Figure 5.12 - Bookmarked Frame (3) in the Frame Display
In the Event Display bookmarks appear as a dashed line around the start of frame
marker.
Bookmarks are easy to create and maintain, and are a very valuable tool for data analysis.
When you create or modify a bookmark, you have up to 84 characters to explain a
problem, leave yourself a reminder, leave someone else a reminder, etc. Once you create a bookmark it will be
saved with the rest of the data in the .cfa file. When you open a .cfa file, the bookmarks are available to you.
Once you have created a bookmark, you can use the Find function or other navigation methods to locate and
move among them.
5.2.1 Adding, Modifying or Deleting a Bookmark
You can add, modify, or delete a bookmarks from Frame Display and Event Display
Add:
1. Select the frame or event you want to bookmark.
2. There are three ways to access the Add Bookmark dialog.
a. Select Add or Modify Bookmark from the Bookmarks menu on the Frame Display and
Event Display,
b. Select the Add or Modify Bookmark
icon on one of the toolbars, or
c. Right-click on the frame/event and choosing Add Bookmark….
3. In the dialog box, add a comment (up to 84 characters) in the text box to identify the bookmark.
4. Click OK.
Once you create a bookmark it will be saved with the rest of the data in the .cfa file. When you open a .cfa file, the
bookmarks are available to you. - 119 -
ComProbe High Speed UART User Manual
Chapter 5 Navigating and Searching the Data
Modify
1. Select the frame or event with the bookmark to be edited.
2. There are three ways to access the Add/Modfy Bookmark dialog.
a. Select Add or Modify Bookmark from the Bookmarks menu on the Frame Display and
Event Display'
b. Select the Add or Modify Bookmark
icon on one of the toolbars, or
c. Right-click on the frame/event and choosing Modify Bookmark… on the selection.
3. Change the comment in the dialog box
4. Click OK. The edited bookmark will be saved as a part of the .cfa file.
5. You can also select Display All Bookmarks
from the Frame Display and Event Display toolbar
or the Bookmarks menu. the Find window will open on the Bookmark tab. Select the bookmark you
want to modify and click the Modify… button. Change the comment in the dialog box, and click OK.
Delete
1. Select the frame or event with the bookmark to be deleted.
2. There are three ways to access the Add/Modfy Bookmark dialog.
a. Select Add or Modify Bookmark from the Bookmarks menu on the Frame Display and
Event Display,
b. Select the Add or Modify Bookmark
icon on one of the toolbars, or
c. Right-click on the frame/event and choosing Modify Bookmark… on the selection.
3. Click on the Delete button. The bookmark will be deleted.
4. You can also select Display All Bookmarks
from the Frame Display and Event Display toolbar
or the Bookmarks menu. the Find window will open on the Bookmark tab. Select the bookmark you
want to delete and click the Delete button.
5.2.2 Displaying All and Moving Between Bookmarks
There are three ways to move between bookmarks.
1. Press the F2 key to move to the next frame or event with a bookmark.
2. Select Go to Next Bookmark from the Bookmarks menu.
3. Click the Display All Bookmarks icon
. Select the bookmark you want to move to and click the Go To
button, or simply double-click on the bookmark. Click the Move Forward and Move Back buttons to cycle
through the bookmarks.
- 120 -
Chapter 5 Navigating and Searching the Data
ComProbe High Speed UART User Manual
Figure 5.13 - Find Window Bookmark tab Used to Move Around With Bookmarks
To delete a bookmark, select it and click the Delete button.
To modify a bookmark, select it and click the Modify button.
Click Remove All to delete all the bookmarks.
- 121 -
Chapter 6 Saving and Importing Data
6.1 Saving Your Data
You can save all or part of the data that you have captured. You can also load a previously saved capture file, and
save a portion of that file to another file. This feature is useful if someone else needs to see only a portion of the
data in your capture file.
On the Control window toolbar you can set up to capture a single file. Click here to see those settings.
There are two ways to save portions or all of the data collected during a data capture. Click here to see how to
capture data to disk.
6.1.1 Saving the Entire Capture File
This option is only available when you select Single File from the Capture Mode on System Settings. Click
here to learn more about selecting Save options from System Settings.
1. If you are capturing data, click on the Stop Capture
file while it is being captured.
2. Open the Event Display
3. Click the Save
or Frame Display
icon to stop data capture. You cannot save data to
window.
icon, or select Save from the File menu.
- 122 -
ComProbe High Speed UART User Manual
Chapter 6 Saving and Importing Data
Figure 6.1 - Windows Save dialog
4. Type a file name in the File name box at the bottom of the screen.
5. Browse to select a specific directory. Otherwise your file is saved in the default capture file directory.
6. When you are finished, click OK.
6.1.2 Saving the Entire Capture File with Save Selection
1. If you are capturing data, click on the Stop icon
to stop data capture. You cannot save data to file while
it is being captured.
2. Open the Event Display
or Frame Display
window.
3. Right click in the data
4. Select Save Selection or Save As from the right click
menu.
5. Click on the radio button labeled Entire File.
6. Choose to save Events or Frames . Choosing to save
Events saves the entire contents of the capture file.
Choosing to save Frames does not save all events in the
capture file.
7. Type a file name in the As box at the bottom of the screen.
Click the Browse icon to browse to a specific directory.
Otherwise your file is saved in the default capture file
directory.
8. When you are finished, click OK.
- 123 -
Chapter 6 Saving and Importing Data
ComProbe High Speed UART User Manual
6.1.3 Saving a Portion of a Capture File
1. If you are capturing data, click on the Stop icon
to pause data capture. You cannot save data to a file
while it is being captured.
2. Open the Event Display
or Frame Display
window, depending on whether you want to
specify a range in bytes or in frames.
3. Select the portion of the data that you want to save. Click and drag to select data, or click on the first item,
move to the last item and Shift+Click to select the entire range, or use the Shift key with the keyboard
arrows or the navigation icons in the Frame Display toolbar. If the range you want to save is too large to
select, note the numbers of the first and last item in the range.
4. Right click in the data
5. Select Save Selection or Save As from the right click
menu
6. Click on the radio button labeled Selection. If you selected
a range, make sure the starting and ending numbers are
correct. To specify a range, type the numbers of the first
and last items in the range in the boxes.
7. Select either Events or Frames to indicate whether the
numbers are event or frame numbers.
8. Type a file name in the As box at the bottom of the screen.
Click the Browse icon to browse to a specific directory.
Otherwise your file is saved in the default capture file
directory.
9. Click OK when you are finished. 6.2 Adding Comments to a Capture File
The Notes feature allows you to add comments to a CFA file. These comments can be used for many purposes.
For example, you can list the setup used to create the capture file, record why the file is useful to keep, or include
notes to another person detailing which frames to look at and why. (Bookmarks are another useful way to record
information about individual frames.)
To open the Notes window :
1. Click the Show Notes icon
as the Event Display
. This icon is present on the toolbars of the Frame Display
, as well
. Notes can be selected from the Edit menu on one of these windows.
- 124 -
ComProbe High Speed UART User Manual
Chapter 6 Saving and Importing Data
2. Type your comments in the large edit box on the Notes window. The Cut, Copy, Paste features are
supported from Edit menu and the toolbar
when text is selected. Undo and Redo features
are all supported from Edit menu and the toolbar
3. Click the thumbtack icon
at the current cursor location.
to keep the Notes window on top of any other windows.
4. When you're done adding comments, close the window.
5. When you close the capture file, you are asked to confirm the changes to the capture file. See Confirming
Capture File (CFA) Changes for more information.
6.3 Confirm Capture File (CFA) Changes
This dialog appears when you close a capture file after changing the Notes, the protocol stack, or bookmarks. The
dialog lists information that was added or changed and allows you to select which information to save, and
whether to save it to the current file or to a new one.
Changes made to the file appear in a list in the left pane. You can click on each item to see details in the right pane
about what was changed for each item. You simply check the boxes next to the changes you want to keep. Once
you decide what changes to keep, select one of the following:
l
Save To This File – Saves the changes you have made to the current capture file.
l
Save As – Saves the changes to a new file.
l
Cancel the Close Operation – Closes the file and returns you back to the display. No changes are saved.
l
Discard Changes – Closes the file without saving any of the changes made to the notes, bookmarks, or
protocol stack.
6.4 Loading and Importing a Capture File
6.4.1 Loading a Capture File
From the Control Window:
1. Go to the File menu.
2. Choose a file from the recently used file list.
3. If the file is not in the File menu list, select Open Capture File from the File menu or simply click on the
Open icon
on the toolbar.
4. Capture files have a .cfa extension. Browse if necessary to find your capture file.
5. Click on your file, and then click Open.
- 125 -
Chapter 6 Saving and Importing Data
ComProbe High Speed UART User Manual
6.4.2 Importing Capture Files
1. From the Control window
, go to the File menu and select Open Capture File or click on the Open
icon on the toolbar.
2. Left of the File name text box, select from the drop-down list Supported File Types box to All
Importable File Types or All Supported File Types (*.cfa, *.log, *.txt, *.csv, *.cap). Select the file and
click Open.
The analyzer automatically converts the file to the analyzer's format while keeping the original file in its original
format. You can save the file in the analyzer's format, close the file without saving it in the analyzer's format, or
have the analyzer automatically save the file in the analyzer's format (see the System Settings to set this option).
All of these options keep your original file untouched.
When you first open the file, the analyzer brings up the Protocol Stack window and ask you what protocol
decodes, if any, you want to use. You must choose a protocol decode at this point for the analyzer to decode the
data in the file. If you open a file without using any decodes, and decide later that you want to apply a decode,
choose Reframe from the File menu on the Control window.
At present, the analyzer supports the following file types:
l
l
Frontline Serialtest* Async and Serialtest ComProbe® for DOS – requires the .byt for data and the .tim for
timestamps (see note on importing DOS timestamps).
Greenleaf ViewComm* 3.0 for DOS - requires the .byt for data and the .tim for timestamps (see note on
importing DOS timestamps).
l
Frontline Ethertest* for DOS – requires 3 files: filename.cap, filename.ca0 and filename.ca1.
l
Sniffer Type 1 – supports files with the .enc extension. Does not support Sniffer files with a .cap extension.
l
l
l
l
Snoop or Sun Snoop – files with a .cap extension based on RFC 1761. For file format, see
http://www.faqs.org/rfcs/rfc1761.html.
Shomiti Surveyor files in Snoop format – files with a .cap extension. For file format, contact Technical Support.
CATC Merlin - files with a .csv extension. Files must be exported with a specific format. See File Format for
Merlin Files for information.
CATC Chief - files with a .txt extension.
6.5 Printing
6.5.1 Printing from the Frame Display/HTML Export
The Frame Display Print dialog and the Frame Display HTML Export are very similar. This topic discusses
both dialogs.
Frame Display Print
The Frame Display Print feature provides the user with the option to print the capture buffer or the current
selection. The maximum file size, however, that can be exported is 1000 frames.
When Print Preview is selected, the output displays in a browser print preview window, where the user can
select from the standard print options. The output file format is in html, and uses the Microsoft Web Browser
Control print options for background colors and images.
- 126 -
ComProbe High Speed UART User Manual
Chapter 6 Saving and Importing Data
Print Background Colors Using Internet Explorer
1. Open the Tools menu on the browser menu bar
2. Select “Internet Options…” menu entry.
3. Click Advanced tab.
4. Check “Print background colors and images” under the Printing section
5. Click the Apply button, then click OK
Configure the Print File Range in the Frame Display Print Dialog
Selecting more than one frame in the Frame Display window defaults the radio button in the Frame Display Print
dialog to Selection and allows the user to choose the All radio button. When only one frame is selected, the All
radio button in the Frame Display Print dialog is selected.
How to Print Frame Display Data
1. Select Print or Print Preview from the File menu on the Frame Display window to display the Frame
Display Print dialog. Select Print if you just want to print your data to your default printer. Select Print
Preview if you want access to printer options.
2. Choose to include the Summary pane (check the box) in the print output. The Summary pane appears at
the beginning of the printed output in tabular format. If you select All layers in the Detail Section, the
Data Bytes option becomes available.
3. In the Detail Section, choose to exclude—No decode section—the decode from the Detail pane in
the Frame Display, or include All Layers or Selected Layers Only. If you choose to include selected
layers, then select (click on and highlight) the layers from the list box.
4. Click on selected layers in the list to de-select, or click the Reset Selected Layers button to de-select all
selected layers.
Figure 6.2 - Frame Display Print Dialog
- 127 -
Chapter 6 Saving and Importing Data
ComProbe High Speed UART User Manual
5. Select the range of frames to include All or Selection in the Frame Range section of the Frame
Display Print dialog.
Choosing All prints up to 1000 frames from the buffer.
Choosing Selection prints only the frames you select in the Frame Display window.
6. Selecting the Delete File deletes the temporary html file that was used during printing
7. Click the OK button.
Frame Display Print Preview
The Frame Display Print Preview feature provides the user with the option to export the capture buffer to an
.html file. The maximum file size, however, that can be exported is 1000 frames.
If you chose Print Preview, the system displays your data in a browser print preview display with options for
printing such as page orientation and paper size. You can also use your Printer Preferences dialog to make some
of these selections. When printing your data, the analyzer creates an html file and prints the path to the file at the
bottom of the page. This file can be opened in your browser, however, it may appear different than the printed
version.
1. Select Print Preview from the File menu on the Frame Display window to display the Frame Display
Print Preview.
Figure 6.3 - Frame Display Print Preview Dialog
2. From this point the procedure is the same as steps 2 through 5 in "How to Print Frame Display Data" above.
3. Click the OK button, and after a brief wait a browser window will appear.
- 128 -
ComProbe High Speed UART User Manual
Chapter 6 Saving and Importing Data
6.5.2 Printing from the Event Display
The Event Display Print feature provides the user with the option to print either the entire capture buffer or the
current selection. When Print Preview is selected, the output displays in a browser print preview window where
the user can select from the standard print options. The output file format is in html, and uses the Microsoft Web
Browser Control print options for background colors and images (see below).
Print Background Colors Using Internet Explorer
1. Open the Tools menu on the browser menu bar
2. Select “Internet Options…” menu entry.
3. Click Advanced tab.
4. Check “Print background colors and images” under the Printing section
5. Click the Apply button, then click OK
The Event Display Print feature uses the current format of the Event Display as specified by the user.
See About Event Display for an explanation on formatting the Event Display prior to initiating the print feature.
Configure the Print File Range in the Event Display Print dialog
Selecting more than one event in the Event Display window defaults the radio button in the Event Display
Print dialog to Selection and allows the user to choose the All radio button. When only one event is selected ,
the All radio button in the Event Display Print dialog is selected.
How to Print Event Display Data to a Browser
1. Select Print or Print Preview from the File menu on the Event Display window to display the Event
Display Print dialog. Select Print if you just want to print your data to your default printer. Select Print
Preview if you want preview the print in your browser.
2. Select the range of events to include from either All or Selection in the Event Range section . Choosing
All prints all of the events in the capture file or buffer. Choosing Selection prints only the selected events
in the Event Display window.
Note: In order to prevent a Print crash, you cannot select All if there are more than
100,000 events in the capture buffer.
Note: See "Configure the Print File Range in the Event Display Print Dialog" above for an
explanation of these selections
- 129 -
Chapter 6 Saving and Importing Data
ComProbe High Speed UART User Manual
Figure 6.4 - Event Display Print Dialog
3. Click the OK button.
If you chose Print Preview, the system displays your data in a browser print preview display with options for
printing such as page orientation and paper size. You can also use your Printer Preferences dialog to make some
of these selections. When printing your data, the analyzer creates an html file and prints the path to the file at the
bottom of the page. This file can be opened in your browser, however, it may appear different than the printed
version.
6.6 Exporting
6.6.1 Frame Display Export
You can dump the contents of the Summary pane on the Frame Display into a Comma Separated File (.csv).
To access this feature:
1. Right click on the Summary pane or open the Frame Display File menu.
2. Select the Export… menu item.
3. Select a storage location and enter a File name.
4. Select Save.
6.6.2 Exporting a File with Event Display Export
With the Event Display Export dialog you can export the contents of the Event Display dialog as a test (.txt),
CSV (.csv.), HTML (.htm), or Binary File (.bin). You also have the option of exporting the entire capture buffer or
just the current selection of the Event Display dialog.
- 130 -
ComProbe High Speed UART User Manual
Chapter 6 Saving and Importing Data
Figure 6.5 - Event Display Export Example: .csv file.
How to Export Event Display Data to a File
1. Select Export Events from the File menu on the Event Display window to display the Event Display
Export dialog.
2. Enter a file path and name, or click the browser button to display the Windows Save As dialog and
navigate to the desired storage location.
3. Select a file type from the Save as type: drop-down List Menu on the Event Display Export dialog.
Select from among the following file formats:
Text File (*.txt)
CSV File (*.csv)
HTML File (*.html)
Binary File (*.bin)
4. Select the range of events to include in the file from either All or Selection in the Event Range section
of the Event Display Export dialog.
l
l
Selecting more than one event in the Event Display window defaults the radio button in the Event
Display Export dialog to Selection and allows the user to choose the All radio button.
When only one event is selected (something must be selected), the All radio button in the Event
Display Export dialog is selected by default.
5. Next you need to select the Side variable for serial communications.
l
Choose Host, Function\Control or Both to determine how you want to export the data.
5. Choose Host, Function\Control or Both to determine how you want to export the data.
6. Choose whether you want to display multiple events or single events per row.
- 131 -
Chapter 6 Saving and Importing Data
ComProbe High Speed UART User Manual
Events Per Row: You can choose to display Multiple Events Per Row, but this method contains no
timestamps. If you select One Event Per Row, you can display timestamps. multiple events or single
events per row.
Note: The raw timestamp value is the number of 100-nanosecond intervals since the
beginning of January 1, 1601. This is standard Windows time.
.
The timestamp data types displayed in columns for One Event Per Row.
Timestamp
Delta
Event Number
Byte Number
Frame Number
Type
Hex
Dec
Oct
Bin
Side
ASCII | 7-bit ASCII | EBCDIC | Baudot
RTS
CTS
DSR
DTR
CD
RI
UART Overrun
Parity Error
Framing Error
7. If you select .csv as the file type, choose whether you want to hide/display Preambles or Column
Headings in the exported file
8. Click Save. The Event Display Export file is saved to the locations you specified in File name.
- 132 -
ComProbe High Speed UART User Manual
Chapter 6 Saving and Importing Data
Figure 6.6 - Example: .csv Event Display Export, Excel spreadsheet
6.6.2.1 Export Filter Out
You can filter out data you don't want or need in your text file.
(This option is available only for serial data.) In the Filter Out box, choose which side to filter out: the DTE data,
the DCE data or neither side (don't filter any data.) For example, if you choose the radio button for DTE data, the
DTE data would be filtered out of your export file and the file would contain only the DCE data.
You can also filter out Special Events (which is everything that is not a data byte, such as control signal changes and
Set I/O events), Non-printable characters or both. If you choose to filter out Special Events, your export file would
contain only the data bytes. Filtering out the non-printable characters means that your export file would contain
only special events and data bytes classified as printable. In ASCII, printable characters are those with hex values
between $20 and $7e.
6.6.2.2 Exporting Baudot
When exporting Baudot, you need to be able to determine the state of the shift character. In a text export, the
state of the shift bit can be determined by the data in the Character field. When letters is active, the character
field shows letters and vice versa.
- 133 -
Chapter 7 General Information
7.1 System Settings and Progam Options
7.1.1 System Settings
Open the System Settings window by choosing System Settings from the Options menu on the Control
window. To enable a setting, click in the box next to the setting to place a checkmark in the box. To disable a
setting, click in the box to remove the checkmark. When viewing a capture file, settings related to data capture
are grayed out.
- 134 -
ComProbe High Speed UART User Manual
Chapter 7 General Information
Single File
Figure 7.1 - System Settings Single File Mode
This option allows the analyzer to capture data to a file. Each time you capture the file you must provide a file
name. The size of each file cannot larger than the number given in File Size (in K). The name of each file is the
name you give it in the Name box followed by the date and time. The date and time are when the series was
opened.
l
Restart Capturing After Saving or Clearing Capture File
If the Automatically Restart feature is enabled, the analyzer restarts capture to the file immediately after the
file is closed.
l
Wrap File
When enabled, the analyzer wraps the file when it becomes full. The oldest events are moved out of the file
to make room for new events. Any events moved out of the file are lost. When disabled, the analyzer stops
capture when the file becomes full. Either reset the file or close your capture file to continue.
l
File Size: The size of the file will depend of the available hard disk space.
1. Click the Min button to see/set the minimum acceptable value for the file size.
2. Click the Max button to see/set the maximum acceptable value for the file size.
- 135 -
Chapter 7 General Information
ComProbe High Speed UART User Manual
You can accept these values, or you can enter a unique file size.
But if you try to close the dialog after entering a value greater
than the maximum or less than the minimum, you will see the
following dialog. l
Start up
Opens the Program Start up Options window. Start up options let you choose whether to start data capture
immediately on opening the analyzer.
l
Advanced
Opens the Advanced System Options window. The Advanced Settings should only be changed on advice of
technical support.
7.1.1.1 System Settings - Disabled/Enabled Options
Some of the System Settings options are disabled depending upon the status of the data capture session.
l
l
l
As the default, all the options on the System Settings dialog are enabled.
Once the user begins to capture data by selecting the Start Capture button, some of the options on the System
Settings dialog are disabled until the user stops data capture and either saves or erases the captured data.
The user can go into the Startup options and Advanced system options on the System Settings dialog and
make changes to the settings at any time.
7.1.1.2 Advanced System Options
These parameters affect fundamental aspects of the software, and it is unlikely that you ever have to change
them. If you do change them and need to return them to their original values, the default value is listed in
parentheses to the right of the value box.
Most technical support problems are not related to these parameters, and as changing them could have serious
consequences for the performance of the analyzer, we strongly recommend contacting technical support before
changing any of these parameters.
To access the Advanced System Options:
1. Go to the Control
window.
2. Choose System Settings from the Options menu.
3. On the System Settings window, click the Advanced button.
- 136 -
ComProbe High Speed UART User Manual
Chapter 7 General Information
Figure 7.2 - Advanced System Options dialog l
l
l
Driver Receive Buffer Size in Kbytes - This is the size of the buffer used by the driver to store incoming
data. This value is expressed in Kbytes.
Driver Action Queue Size In Operating System Pages - This is the size of the buffer used by the driver
to store data to be transmitted. This value is expressed in operating system pages.
Frame Completion Timeout in Seconds - This is the number of seconds that the analyzer waits to receive
data on a side while in the midst of receiving a frame on that side.
If no data comes in on that side for longer than the specified number of seconds, an "aborted frame" event is
added to the Event Display and the analyzer resumes decoding incoming data. This can occur when capturing
interwoven data (DTE and DCE) and one side stops transmitting in the middle of a frame.
The range for this value is from 0 to 999,999 seconds. Setting it to zero disables the timeout feature.
Note: This option is currently disabled.
7.1.1.3 Selecting Start Up Options
To open this window:
1. Choose System Settings from the Options menu on the Control
window.
2. On the System Settings window, click the Start Up button.
3. Choose one of the options to determine if the analyzer starts data capture immediately on starting up or
not.
- 137 -
Chapter 7 General Information
ComProbe High Speed UART User Manual
Figure 7.3 - Start Up Options dialog
l
Don't start capturing immediately - This is the default setting. The analyzer begins monitoring data but
does not begin capturing data until clicking the Start Capture
icon on the Control, Event Display or
Frame Display windows.
l
Start capturing to a file immediately - When the analyzer starts up, it immediately opens a capture file
and begins data capture to it. This is the equivalent of clicking theStart Capture
icon. The file is given a
name based on the settings for capturing to a file or series of files in the System Settings window.
l
Start capturing immediately to the following file: - Enter a file name in the box below this option. When
the analyzer starts up, it immediately begins data capture to that file. If the file already exists, the data in it is
overwritten.
7.1.2 Changing Default File Locations
The analyzer saves user files in specific locations by default. Capture files are placed in the My Capture Files
directory and configurations are put in My Configurations. These locations are set at installation.
Follow the steps below to change the default locations.
1. Choose Directories from the Options menu on the Control window to open the File Locations
window.
- 138 -
ComProbe High Speed UART User Manual
Chapter 7 General Information
Figure 7.4 - File Locations dialog
2. Select the default location you wish to change.
3. Click Modify.
4. Browse to a new location.
Figure 7.5 - File Locations Browse dialog
5. Click OK.
6. Click OK when finished.
- 139 -
Chapter 7 General Information
ComProbe High Speed UART User Manual
If a user sets the My Decoders directory such that it is up-directory from an installation path, multiple instances of
a personality entry may be detected, which causes a failure when trying to launch Frontline. For example, if an
Frontline product is installed at C:\Users\Public\Public Documents\Frontline Test Equipment\My Decoders\ then
"My Decoders" cannot be set to any of the following:
l
C:\ My Decoders\
l
C:\Users\ My Decoders\
l
C:\Users\\Public\My Decoders\
l
C:\Users\Public\Public Documents\My Decoders\
l
or to any directory that already exists in the path C:\Users\Public\Public Documents\Frontline Test
Equipment\My Decoders\
Default Capture File Folder Checkbox
If the Use Last Opened Folder for Capture Files checkbox is checked, then the system automatically
changes the default location for saving capture files each time you open a file from or save a file to a new location.
For example, let's say the default location for saving capture files is Drive A > Folder A. Now you select the Use
Last Opened Folder for Capture Files checkbox. The next time, however, you open a capture file from a
different location, Folder B > Removable Flash Drive for example. Now when you save the capture file, it will be
saved to Folder B > Removable Flash Drive. Also, all subsequent files will be saved to that location. This remains
true until you open a file from or save a file to a different location.
There is one caveat to this scenario, however. Let's say you have selected Use Last Opened Folder for
Capture Files and opened a file from a location other than the default directory. All subsequent capture files
will be saved to that location. Suppose, however, the next time you want to save a capture file, the new file
location is not available because the directory structure has changed: a folder has been moved, a drive has been
reassigned, a flash drive has been disconnected, etc. In the case of a "lost" directory structure, subsequent
capture files will be saved to the default location. ComProbe software will always try to save a file to the folder
where the last file was opened from or saved to, if Use Last Opened Folder for Capture Files is checked. If,
however, the location is not accessible, files are saved to the default directory that is set at installation.
If the checkbox is unchecked, then the system always defaults to the directory listed in the File Locations dialog.
7.1.3 Side Names
The Side Names dialog is used to change the names of objects and events that appear in various displays. The
Side Names dialog will change depending on the sniffing technology in use at the time the software was loaded.
Changes to the Names are used throughout the program.
- 140 -
ComProbe High Speed UART User Manual
Chapter 7 General Information
Figure 7.6 - Example: Side Names Where "Slave" and "Master" are current
1. To open the Side Names dialog, choose Side Names… from the Options menu on the Control
window.
2. To change a name, click on the name given in the Current Names column, and then click again to modify
the name (a slow double-click).
3. Select OK to initiate the changes. The changes that have been made will not fully take effect for any views
already open. Closing and reopening the views will cause the name change to take effect.
4. To restore the default values, click the Set Defaults button.
7.1.4 Timestamping
Timestamping is the process of precise recording in time of packet arrival. Timestamps is an optional parameter in
the Frame Display and Event Display that can assist in troubleshooting a network link.
7.1.4.1 Timestamping Options
The Timestamping Options window allows you to enable or disable timestamping, and change the resolution of
the timestamps for both capture and display purposes.
To open this window:
Choose Set Timestamp Format… from the Options menu on the Frame Display and Event Display window or
click on the Timestamping Option
icon in the Event Display toolbar. The Timestamping Options window
will open.
- 141 -
Chapter 7 General Information
ComProbe High Speed UART User Manual
Figure 7.1 Timestamping Options dialog
7.1.4.2 Enabling/Disabling Timestamp
To enable timestamping click to make a check appear in the check box Store Timestamps (This time takes
effect immediately). Removing the check will disable timestamping.
7.1.4.3 Changing the Timestamp Resolution
This option affects the resolution of the timestamp stored in the capture file. The default timestamp is 10
milliseconds. This value is determined by the operating system and is the smallest "normal" resolutions possible.
Note: The raw timestamp value is the number of 100-nanosecond intervals since the beginning of
January 1, 1601. This is standard Windows time.
It is also possible to use "high resolution"
timestamping. High resolution timestamp
values are marked by an asterisk as high
resolution in the drop down list. To change
timestamping resolutions:
1. Go to the Capture Options section
of the window.
2. Change the resolution listed in the
Storage Resolution box.
- 142 -
ComProbe High Speed UART User Manual
Chapter 7 General Information
Note: If you change the resolution, you need to exit the analyzer and restart in order for the
change to take effect.
7.1.4.3.1 Performance Issues with High Resolution Timestamp
There are two things to be aware of when using high resolution timestamps. The first is that high resolution
timestamps take up more space in the capture file because more bits are required to store the timestamp. Also,
more timestamps need to be stored than at normal resolutions. The second issue is that using high resolution
timestamping may affect performance on slower machines
For example, if 10 bytes of data are captured in 10 milliseconds at a rate of 1 byte per millisecond, and the
timestamp resolution is 10 milliseconds, then only one timestamp needs to be stored for the 10 bytes of data. If
the resolution is 1 millisecond, then 10 timestamps need to be stored, one for each byte of data. If you have two
capture files, both of the same size, but one was captured using normal resolution timestamping and the other
using high resolution, the normal resolution file has more data events in it, because less room is used to store
timestamps.
You can increase the size of your capture file in the System Settings.
7.1.4.4 Switching Between Relative and Absolute Time
With Timestamping you can choose to employ Relative Time or Absolute time.
1. Choose System Settings from the Options menu on the Control window, and click the
Timestamping Options button, or click the click the Timestamping Options icon
from the
Event Display
window.
2. Go to the Display Options section at the bottom of the window and find the Display Relative
Timestamps checkbox.
3. Check the box to switch the display to relative timestamps. Remove the check to return to absolute
timestamps.
Note: The options in this section affect only how the timestamps are displayed on the screen, not
how the timestamps are recorded in the capture file.
l
l
l
l
Display Raw Timestamp Value shows the timestamp as the total time in hundred nanoseconds from a
specific point in time.
Display Relative Timestamps shows the timestamp as the amount of time that has passed since the first
byte was captured. It works just like a stop watch in that the timestamp for the first byte is 0:00:00.0000 and
all subsequent timestamps increment from there. The timestamp is recorded as the actual time, so you can
flip back and forth between relative and actual time as needed.
Selecting both values displays the total time in nanoseconds from the start of the capture as opposed to a
specific point in time.
Selecting neither value displays the actual chronological time.
When you select Display Relative Timestamp you can set the number of digits to display using the up or down
arrows on the numeric list.
- 143 -
Chapter 7 General Information
ComProbe High Speed UART User Manual
7.1.4.5 Displaying Fractions of a Second
1. Choose System Settings from the Options menu on the Control
window, and click the
Timestamping Options button, or click the click the Timestamping Options icon
the Event Display
or Statistics
from either
window.
2. Go to the Display Options section at the bottom of the window, and find the Number of Digits to
Display box.
3. Click on the arrows to change the number. You can display between 0 and 6 digits to the right of the
decimal point.
7.2 Technical Information
7.2.1 Performance Notes
As a software-based product, the speed of your computer’s processor affects the analyzer’s performance. Buffer
overflow errors are an indicator that the analyzer is unable to keep up with the data. The information below
describes what happens to the data as it arrives, what the error means, and how various aspects of the analyzer
affect performance. Also included are suggestions on how to improve performance.
The analyzer's driver takes data from the driver and counts each byte as they are put into the driver’s buffer. The
analyzer's driver tells the user interface that data is ready to be processed. The analyzer takes the data from the
driver’s buffer and puts the data into the capture buffer.
Driver Buffer Overflows occur when the user interface does not retrieve frames from the driver quickly
enough. Buffer overflows are indicated in the Event Display window by a plus sign within a circle. Clicking on
the buffer overflow symbol displays how many frames have been lost.
There are several things that you can do to try and solve this problem.
l
l
l
l
l
Use capture filters to filter out data you don't need to see. Capture filters reduce the amount of data
processed by the analyzer. (Ethernet Only)
Close all other programs that are doing work while the analyzer is running. Refrain from doing searches in the
Event Display window or other processor intensive activities while the analyzer is capturing data.
Timestamping takes up processor time, primarily not in timestamping the data, but in writing the timestamp to
the file. Try turning off timestamping from the Timestamping Options window.
For Driver Buffer Overflows, change the size of the driver buffer. This value is changed from the
Advanced System Settings. Go to the Control window and choose System Settings from the Options
menu. Click on the Advanced button. Find the value Driver Receive Buffer Size in Operating System
Pages. Take the number listed there and double it.
The analyzer’s number one priority is capturing data; updating windows is secondary. However, updating
windows still takes a certain amount of processor time, and may cause the analyzer to lose data while the
window is being updated. Some windows require more processing time than others because the information
being displayed in them is constantly changing. Refrain from displaying data live in the Event Display and
Frame Display windows. The analyzer can capture data with no windows other than the Control window
open.
- 144 -
ComProbe High Speed UART User Manual
l
Chapter 7 General Information
If you are still experiencing buffer overflows after trying all of the above options, then you need to use a faster
PC.
7.2.2 BTSnoop File Format
Overview
The BTSnoop file format is suitable for storing Bluetooth® HCI traffic. It closely resembles the snoop format, as
documented in RFC 1761.
File Format
The snoop packet capture file is an array of octets structured as follows:
The File Header is a fixed-length field containing general information about the packet file and the format of the
packet records it contains. One or more variable-length Packet Record fields follow the File Header field. Each
Packet Record field holds the data of one captured packet.
File Header
The structure of the File Header is as follows:
Identification Pattern:
A 64-bit (8 octet) pattern used to identify the file as a snoop packet capture file. The Identification Pattern consists
of the 8 hexadecimal octets:
62 74 73 6E 6F 6F 70 00
This is the ASCII string "btsnoop" followed by one null octets.
Version Number:
A 32-bit (4 octet) unsigned integer value representing the version of the packet capture file being used. This
document describes version number 1.
- 145 -
Chapter 7 General Information
ComProbe High Speed UART User Manual
Datalink Type:
A 32-bit (4 octet) field identifying the type of datalink header used in the packet records that follow. The datalink
type codes are listed in the table below. Values 0 - 1000 are reserved, to maximize compatibility with the
RFC1761 snoop version 2 format.
Table 7.2 - Datalink Codes
Datalink Type
Code
Reserved
0 - 1000
Un-encapsulated HCI (H1) 1001
HCI UART (H4)
1002
HCI BSCP
1003
HCI Serial (H5)
1004
Unassigned
1005 - 4294967295
Packet Record Format
Each packet record holds a partial or complete copy of one packet as well as some descriptive information about
that packet. The packet may be truncated in order to limit the amount of data to be stored in the packet file.
Each packet record holds 24 octets of descriptive information about the packet, followed by the packet data,
which is variable-length, and an optional pad field. The descriptive information is structured as six 32-bit (4-octet)
integer values.
The structure of the packet record is as follows:
Original Length
A 32-bit unsigned integer representing the length in octets of the captured packet as received via a network.
Included Length
A 32-bit unsigned integer representing the length of the Packet Data field. This is the number of octets of the
captured packet that are included in this packet record. If the received packet was truncated, the Included Length
field is less than the Original Length field.
Packet Flags
- 146 -
ComProbe High Speed UART User Manual
Chapter 7 General Information
Flags specific to this packet. Currently the following flags are defined:
Bit No.
Table 7.3 - Packet Flag Description
Definition
0
Direction flag 0 = Sent, 1 = Received
1
Command flag 0 = Data, 1 = Command/Event
2 - 31
Reserved
Bit 0 is the least significant bit of the 32-bit word.
Direction is relative to host / DTE. i.e. for Bluetooth controllers, Send is Host->Controller, Receive is Controller>Host.
Note: Some Datalink Types already encode some or all of this information within the Packet Data. With these
Datalink Types, these flags should be treated as informational only, and the value in the Packet Data should take
precedence.
Cumulative Drops
A 32-bit unsigned integer representing the number of packets that were lost by the system that created the
packet file between the first packet record in the file and this one. Packets may be lost because of insufficient
resources in the capturing system, or for other reasons.
Note: some implementations lack the ability to count dropped packets. Those implementations may set the
cumulative drops value to zero.
Timestamp Microseconds
A 64-bit signed integer representing the time of packet arrival, in microseconds since midnight, January 1st, 0 AD
nominal Gregorian.
In order to avoid leap-day ambiguity in calculations, note that an equivalent epoch may be used of midnight,
January 1st 2000 AD, which is represented in this field as 0x00E03AB44A676000.
Packet Data
Variable-length field holding the packet that was captured, beginning with its datalink header. The Datalink Type
field of the file header can be used to determine how to decode the datalink header. The length of the Packet
Data field is given in the Included Length field.
Note that the length of this field in not necessarily rounded to any particular multi-octet boundary, as might
otherwise be suggested by the diagram.
Data Format
All integer values are stored in "big-endian" order, with the high-order bits first.
7.2.3 Ring Indicator
The following information applies when operating the analyzer in Spy mode or Source DTE, No FTS Cables
mode. When using the cables supplied with the analyzer to capture or source data, Ring Indicator (RI) is routed to
a different pin which generates interrupts normally.
There is a special case involving Ring Indicator and computers with 8250 UARTs or UARTs from that family where
the state of RI may not be captured accurately. Normally when a control signal changes state from high to low or
low to high, an interrupt is generated by the UART, and the analyzer goes to see what has changed and record it.
- 147 -
Chapter 7 General Information
ComProbe High Speed UART User Manual
Ring Indicator works a little differently. An interrupt is generated when RI changes from high to low, but not when
RI changes from low to high. If Ring Indicator changes from low to high, the analyzer does not know that RI has
changed state until another event occurs that generates an interrupt. This is simply the way the UART works, and
is not a deficiency in the analyzer software.
To minimize the chance of missing a Ring Indicator change, the analyzer polls the UART every millisecond to see if
RI has changed. It is still possible for the analyzer to miss a Ring Indicator change if RI and only RI changes state
more than once per millisecond.
UARTs in the 8250 family include 8250s, 16450s, 16550s and 16550 variants. If you have any questions about the
behavior of your UART and Ring Indicator, please contact technical support.
7.2.4 Progress Bars
The analyzer uses progress bars to indicate the progress of a number of different processes. Some progress bars
(such as the filtering progress bar) remain visible, while others are hidden.
The title on the progress bar indicates the process underway.
7.2.5 Event Numbering
This section provides information about how events are numbered when they are first captured and how this
affects the display windows in the analyzer. The information in this section applies to frame numbering as well.
When the analyzer captures an event, it gives the event a number. If the event is a data byte event, it receives a
byte number in addition to an event number. There are usually more events than bytes, with the result is that a
byte might be listed as Event 10 of 16 when viewing all events, and Byte 8 of 11 when viewing only the data bytes.
The numbers assigned to events that are wrapped out of the buffer are not reassigned. In other words, when
event number 1 is wrapped out of the buffer, event number 2 is not renumbered to event 1. This means that the
first event in the buffer may be listed as event 11520 of 16334, because events 1-11519 have been wrapped out
of the buffer. Since row numbers refer to the event numbers, they work the same way. In the above example,
the first row would be listed as 2d00 (which is hex for 11520.)
The advantage of not renumbering events is that you can save a portion of a capture file, send it to a colleague,
and tell your colleague to look at a particular event. Since the events are not renumbered, your colleague’s file
use the same event numbers that your file does.
7.2.6 Useful Character Tables
7.2.6.1 ASCII Codes
- 148 -
ComProbe High Speed UART User Manual
Chapter 7 General Information
7.2.6.2 Baudot Codes
7.2.6.3 EBCDIC Codes
7.2.6.4 Communication Control Characters
Listed below in alphabetical order are the expanded text meanings for common ANSI communication control
characters, and two-character system abbreviation for each one. Some abbreviations have forward slash
- 149 -
Chapter 7 General Information
ComProbe High Speed UART User Manual
characters between the two letters. This is to differentiate the abbreviations for a control character from a hex
number. For example, the abbreviation for Form Feed is listed as F/F, to differentiate it from the hex number FF.
Table 7.4 - Communications Control Characters
Abbreviation
Control Character
Text
AK
ACK
Acknowledge
BL
BEL
Bell
BS
BS
Backspace
CN
CAN
Cancel
CR
CR
Carriage Return
D/1-4
DC1-4
Device Control 1-4
D/E
DEL
Delete
DL
DLE
Data Link Escape
EM
EM
End of Medium
EQ
ENQ
Enquiry
ET
EOT
End of Transmission
E/C
ESC
Escape
E/B
ETB
End of Transmission Block
EX
ETX
End of Text
F/F
FF
Form Feed
FS
FS
File Separator
GS
GS
Group Separator
HT
HT
Horizontal Tabulation
LF
LF
Line Feed
NK
NAK
Negative Acknowledge
NU
NUL
Null
RS
RS
Record Separator
SI
SI
Shift In
SO
SO
Shift Out
SH
SOH
Start of Heading
SX
STX
Start of Text
SB
SUB
Substitute
SY
SYN
Synchronous Idle
- 150 -
ComProbe High Speed UART User Manual
Chapter 7 General Information
Table 7.4 - Communications Control Characters(continued)
Abbreviation
Control Character
Text
US
US
Unit Separator
VT
VT
Vertical Tabulation
7.2.7 The Frontline Serial Driver
ComProbe software uses custom versions of the standard Windows serial drivers in order to capture data. These
drivers are usually installed during the routine product installation. However, if you need to install the serial driver
after ComProbe software has already been installed, please refer to the instructions available in the Setup folder
installed under Start | Programs | [Product Name and version #] | Setup | How to Install the FTS Serial Driver.
7.2.8 DecoderScript Overview
The DecoderScript™ Reference Manual and User Guide is delivered with each Frontline ComProbe® Protocol
Analysis System installation package under Developer Tools. The manual is also available on-line at FTE.com.
The main purpose of this manual is to describe DecoderScript™, the language used in writing decoders.
DecoderScript allows you to create new decoders or modify existing decoders to expand the functionality of your
ComProbe protocol analyzer. DecoderScript displays protocol data, checks the values of fields, validates
checksums, converts and combines field values for convenient presentation. Decoders can also be augmented
with custom C++-coded functions, called "methods", to extend data formatting, validation, transformations, and so
on.
A decoder defines field-by-field how a protocol message can be taken apart and displayed. The core of each
"decoder" is a program that defines how the protocol data is broken up into fields and displayed in the Frame
Display window of the analyzer software.
This manual provides instruction on how to create and use custom decoders. When reading the manual for the
first time, we encourage you to read the chapters in sequence. The chapters are organized in such a way to
introduce you to DecoderScript writing step- by- step.
Screenshots of the ComProbe protocol analyzer have been included in the manual to illustrate what you see on
your own screen as you develop decoders. But you should be aware for various reasons, the examples may be
slightly different from the ones that you create. The differences could be the result of configuration differences or
because you are running a newer version of the program. Do not worry if an icon seems to be missing, a font is
different, or even if the entire color scheme appears to have changed. The examples are still valid.
Examples of decoders, methods, and frame recognizers are included in this manual. You can cut and paste from
these examples to create your own decoders.
A quick note here: Usually the pasted code appears the same as the original in your editor. Some editors,
however, change the appearance of the text when it is pasted (something to do with whether it is ASCII or
Unicode text). If you find that the pasted text does not appear the same as the original, you can transfer the code
into a simple text editor like Notepad, save it as an ANSI (ASCII) file, then use it in your decoder.
These files are installed in the FTE directory of the system Common Files directory. The readme file in the root
directory of the protocol analyzer installation contains a complete list of included files. Most files are located in My
Decoders and My Methods.
We will be updating our web site with new and updated utilities, etc, on a regular basis and we urge decoder
writers to check there occasionally.
- 151 -
Chapter 7 General Information
ComProbe High Speed UART User Manual
7.2.9 Bluetooth low energy ATT Decoder Handle Mapping
Low energy device attributes contain a 16-bit address called the attribute handle. Each handle is associated with
an attribute Universally Unique Identifier (UUID) that is 128-bits long. In the attribute database, the handle is
unique while the UUID is not unique.
The ComProbe software detects and stores the relationships (mappings) between handle and UUID during the
GATT discovery process. But sometimes, there is no GATT discovery process because
l
l
l
The discovery has previously taken place and both devices stored the mappings and the discovery will not
repeat at every subsequent connection.
The developer owns both devices in the conversation and chose to ignore discovery because the mappings
are known.
The devices are in development and the code to perform the mappings has not been written yet.
The solution to this problem is to
1. define the mappings in a file and
2. then pre-loading the mapping using the ComProbe software.
Creating handle-UUID mapping file
Create a file named "ATT_Handle_UUID_Preload.ini' in the root directory of "C:\Users\Public\Public
Documents\Frontline Test Equipment\My Decoders\", but the file can be located anywhere.
Assume that you want to create a GATT service starting at handle 1.
Create a section in the ini file called
[Service Base Handles]
A=1
"A" will be your first service. Make the base handle equal to the handle of your service. You can use all upper and
lower case letters so you can have up to 52 service handles.
Next add the following section.
[Advertiser Handles]
; Generic Access Profile (GAP)
A0 = 1800
A1 = 2803
A2 = 2a00
A3 = 2803
A4 = 2a01
A5 = 2803
A6 = 2a04
A few tings of note:
l
In the code above, lines begging with a semi-colon are comments.
l
If you want to change the base handle of the GAP service, change the "1" to some other number.
l
If you want to comment out the entire service, comment out the base handle. If no "A" is defined, the
software will ignore "A1", "A2" and so on.
- 152 -
ComProbe High Speed UART User Manual
Chapter 7 General Information
7.3 Contacting Technical Support
Technical support is available in several ways. The online help system provides answers to many user related
questions. Frontline's website has documentation on common problems, as well as software upgrades and utilities
to use with our products.
On the Web: http://fte.com/support/supportrequest.aspx
Email:
[email protected]
If you need to talk to a technical support representative about your ComProbe HSU product, support is available
between 9 am and 5 pm, U.S. Eastern Time zone, Monday through Friday. Technical support is not available on
U.S. national holidays.
Phone: +1 (434) 984-4500
Fax:
+1 (434) 984-4505
Instructional Videos
Frontline provides a series of videos to assist the user and may answer your questions. These videos can be
accessed at fte.com/support/videos.aspx. On this web page use the Video Filters sidebar to select instructional
videos for your product.
- 153 -
Appendicies
Appendix A: Application Notes
156
- 154 -
ComProbe High Speed UART User Manual
Appendicies
- 155 -
Appendix A: Application Notes
A.1 Bluetooth Virtual Sniffing
158
A.2 ComProbe Automation Server: Why use it?
164
- 156 -
ComProbe High Speed UART User Manual
Appendicies
- 157 -
A.1 Bluetooth Virtual Sniffing
A.1.1 Introduction
The ComProbe software Virtual sniffing function simplifiesBluetooth® development and is easy to use. Frontline’s
Virtual sniffing with Live Import provides the developer with an open interface from any application to ComProbe
software so that data can be analyzed and processed independent of sniffing hardware. Virtual sniffing can also
add value to other Bluetooth development tools such as Bluetooth stack SDKs (Software Development Kits) and
Bluetooth chip development kits.
This white paper discusses:
l
l
Why HCI sniffing and Virtual sniffing are useful.
Bluetooth sniffing history.
l
What is Virtual sniffing?
l
Why Virtual sniffing is convenient and reliable.
l
How Virtual sniffing works.
l
Virtual sniffing and Bluetooth stack vendors.
l
Case studies: Virtual sniffing and Bluetooth mobile phone makers.
l
Virtual sniffing and you. • Where to go for more information.
A.1.2 Why HCI Sniffing and Virtual Sniffing are Useful
Because the Bluetooth protocol stack is very complex, a Bluetooth protocol analyzer is an important part of all
Bluetooth development environments. The typical Bluetooth protocol analyzer “taps” a Bluetooth link by capturing
data over the air. For many Bluetooth developers sniffing the link between a Bluetooth Host CPU and a Bluetooth
Host Controller—also known as HCI-sniffing—is much more useful than air sniffing.
HCI-sniffing provides direct visibility into the commands being sent to a Bluetooth chip and the responses to those
commands. With air sniffing a software engineer working on the host side of a Bluetooth chip has to infer and
often guess at what their software is doing. With HCI-sniffing, the software engineer can see exactly what is going
on. HCI-sniffing often results in faster and easier debugging than air sniffing.
- 158 -
ComProbe High Speed UART User Manual
Appendicies
ComProbe software’s Virtual sniffing feature is a simple and easy way to perform HCI-sniffing. Virtual sniffing is not
limited to just HCI-sniffing, but it is the most common use and this white paper will focus on the HCI-sniffing
application of Virtual sniffing.
It is also important to understand that ComProbe software is a multi-mode product. ComProbe software does
support traditional air sniffing. It also supports serial HCI sniffing (for the H4 (HCI UART), H5 (3-wire UART) , and
BCSP (BlueCore Serial Protocol) protocols), USB HCI (H2) sniffing, SDIO sniffing, and Virtual sniffing. So with
ComProbe software nothing is sacrificed—the product is simply more functional than other Bluetooth protocol
analyzers.
A.1.3 Bluetooth Sniffing History
Frontline has a strong appreciation for the importance of HCI sniffing because of the way we got involved with
Bluetooth. Because of our company history, we are uniquely qualified to offer a multi-mode analyzer that provides
many ways to sniff and supports a wide variety of protocols. This brief Bluetooth sniffing history should help you
understand our approach to Bluetooth protocol analysis.
In the early days of Bluetooth, there were no commercially available Bluetooth protocol analyzers, so developers
built their own debug tools and/or used protocol analyzers that weren’t built for Bluetooth. Many developers built
homegrown HCI analyzers—basically hex dumps and crude traces—because they recognized the need for
visibility into the HCI interface and because it was too difficult to build air sniffers. Several companies developed
air sniffers because they saw a market need and because they realized that they could charge a high price (USD
$25,000 and higher).
Two Bluetooth chip companies, Silicon Wave and Broadcom were using Frontline’s Serialtest® serial analyzer to
capture serial HCI traffic and then they would manually decode the HCI byte stream. This manual decoding was far
too much work and so, independently, Silicon Wave and Broadcom each requested that Frontline produce a serial
HCI Bluetooth analyzer that would have all the features of Serialtest. In response to these requests Frontline
developed SerialBlue®—the world’s first commercially available serial HCI analyzer.
The response to SerialBlue was very positive. When we asked our Bluetooth customers what they wanted next we
quickly learned that there was a need for an affordable air sniffer that provided the same quality as SerialBlue. We
also learned that the ultimate Bluetooth analyzer would be one that sniff air and sniff HCI simultaneously.
As work was progressing on our combination air sniffer and HCI sniffer the functional requirements for Bluetooth
analyzers were changing. It was no longer good enough just to decode the core Bluetooth protocols (LMP, HCI,
L2CAP, RFCOMM, and OBEX). Applications were beginning to be built on top of Bluetooth and therefore
application level protocol decoding was becoming a requirement. For example, people were starting to browse
the Internet using Bluetooth-enabled phones and PDAs therefore a good Bluetooth analyzer would need to
support TCP/IP, HTTP, hands-free, A2DP, etc.
For Frontline to support for these higher levels protocols was no problem since they were already in use in other
Frontline analyzer products. People have been using Frontline Serialtest serial analyzers and Ethertest™ Ethernet
analyzer to troubleshoot TCP/IP and Internet problems for many years.
As we continued to work closely with the Bluetooth community we also came across one other requirement:
sniffing itself had to be made easier. We took a two-pronged approach to this problem. We simplified air sniffing
(and we continue to work on simplifying the process of air sniffing) and we invented Virtual sniffing.
A.1.4 Virtual Sniffing—What is it?
Historically, protocol analyzers have physically tapped the circuit being sniffed. For example, an Ethernet circuit is
tapped by plugging into the network. A serial connection is sniffed by passively bridging the serial link. A Bluetooth
air sniffer taps the piconet by synchronizing its clock to the clock of the piconet Master.
- 159 -
Appendicies
ComProbe High Speed UART User Manual
Not only is there a physical tap in traditional sniffing, but the sniffer must have some knowledge of the physical
characteristics of the link being sniffed. For example, a Bluetooth air sniffer must know the BD_ADDR of at least
one piconet member to allow it perform clock synchronization. A serial sniffer must know the bit rate of the
tapped circuit or be physically connected to the clock line of the circuit.
With Virtual sniffing the protocol analyzer itself does not actually tap the link and the protocol analyzer does not
require any knowledge of the physical characteristics of the link.
In computer jargon, “virtual” means “not real”. Virtual memory is memory that doesn’t actually exist. Virtual
reality is something that looks and feels real, but isn’t real. So we use the term Virtual sniffing, because there is
sniffing taking place, but not in the traditional physical sense.
A.1.5 The Convenience and Reliability of Virtual Sniffing
Virtual sniffing is the most convenient and reliable form of sniffing and should be used in preference to all other
forms of sniffing whenever practical. Virtual sniffing is convenient because it requires no setup to use except for a
very small amount of software engineering (typically between one and four hours) that is done once and then
never again. Once support for Virtual sniffing has been built into application or into a development environment
none of the traditional sniffing setup work need be done.
This means:
l
NO piconet synchronization.
l
NO serial connection to tap.
l
NO USB connection to tap.
Virtual sniffing is reliable because there is nothing that can fail. With Virtual sniffing all data is always captured.
A.1.6 How Virtual Sniffing Works
ComProbe software Virtual sniffing works using a feature called Live Import. Any application can feed data into
ComProbe software using Live Import. A simple API provides four basic functions and a few other more advanced
functions. The four basic Live Import functions are:
l
Open a connection to ComProbe software.
l
Close a connection to ComProbe software.
l
Send an entire packet to ComProbe software.
l
Send a single byte to ComProbe software.
All applications that send data to ComProbe software via Live Import use the first two functions. Usually only one
of the two Send functions is used by a particular application. When ComProbe software receives data from the
application via Live Import, the data is treated just as if it had been captured on a Frontline ComProbe sniffer. The
entire protocol stack is fully decoded.
With Virtual sniffing the data can literally be coming from anywhere. ComProbe software does not care if the data
being analyzed is being captured on the machine where ComProbe software is running or if the data is being
captured remotely and passed into ComProbe software over an Internet connection.
A.1.7 Virtual Sniffing and Bluetooth Stack Vendors
As the complexity of the Bluetooth protocol stack increases Bluetooth stack vendors are realizing that their
customers require the use of a powerful Bluetooth protocol analyzer. Even if the stack vendor’s stack is bug free,
- 160 -
ComProbe High Speed UART User Manual
Appendicies
there are interoperability issues that must be dealt with.
The homegrown hex dumps and trace tools from the early days of Bluetooth just are not good enough anymore.
And building a good protocol analyzer is not easy. So stack vendors are partnering with Frontline. This permits the
stack vendors to concentrate of improving their stack.
The typical Bluetooth stack vendor provides a Windows-based SDK. The stack vendor interfaces their SDK to
ComProbe software by adding a very small amount of code to the SDK, somewhere in the transport area, right
about in the same place that HCI data is sent to the Host Controller.
If ComProbe software is installed on the PC and the Virtual sniffer is running then the data will be captured and
decoded by ComProbe software, in real-time. If ComProbe software is not installed or the Virtual sniffer is not
running then no harm is done. Virtual sniffing is totally passive and has no impact on the behavior of the SDK.
One Frontline stack vendor partner feels so strongly about ComProbe software that not only have they built
Virtual sniffing support in their SDK, but they have made ComProbe software an integral part of their product
offering. They are actively encouraging all customers on a worldwide basis to adopt ComProbe software as their
protocol analysis solution.
A.1.8 Case Studies: Virtual Sniffing and Bluetooth Mobile Phone Makers
Case Study # 1
A Bluetooth mobile phone maker had been using a homemade HCI trace tool to debug the link between the Host
CPU in the phone the Bluetooth chip. They also were using an air sniffer. They replaced their entire sniffing setup
by moving to ComProbe software.
In the original test setup the Host CPU in the phone would send debug messages and HCI data over a serial link. A
program running on a PC logged the output from the Host CPU. To implement the new system using Virtual
sniffing, a small change was made to the PC logging program and it now sends the data to ComProbe software
using the Live Import API. The HCI traffic is fully decoded and the debug messages are decoded as well.
The decoder for the debug messages was written using ComProbe software’s DecoderScript feature.
DecoderScript allows ComProbe software user to write custom decodes and to modify decodes supplied with
ComProbe software. DecoderScript is supplied as a standard part of ComProbe software. In this case, the
customer also created a custom decoder for HCI Vendor Extensions.
The air sniffer that was formerly used has been replaced by the standard ComProbe software air sniffer.
Case Study # 2
A second Bluetooth mobile phone maker plans to use Virtual sniffing in conjunction with a Linux-based custom
test platform they have developed. Currently they capture serial HCI traffic on their Linux system and use a set of
homegrown utilities to decode the captured data.
They plan to send the captured serial HCI traffic out of the Linux system using TCP/IP over Ethernet. Over on the
PC running ComProbe software they will use a simple TCP/IP listening program to bring the data into the PC and
this program will hand the data off to ComProbe software using the Live Import API.
A.1.9 Virtual Sniffing and You
If you are a Bluetooth stack vendor, a Bluetooth chip maker, or a maker of any other products where integrating
your product with ComProbe software’s Virtual sniffing is of interest please contact Frontline to discuss your
requirements. There are numerous approaches that we can use to structure a partnership program with you. We
believe that a partnership with Frontline is an easy and cost-effective way for you to add value to your product
offering.
- 161 -
Appendicies
ComProbe High Speed UART User Manual
If you are end customer and you want to take advantage of Virtual sniffing, all you need to do is buy any Frontline
Bluetooth product. Virtually sniffing comes standard with product.
- 162 -
ComProbe High Speed UART User Manual
Appendicies
Author: Eric Kaplan
Publish Date: May 2003
Revised: December 2013
- 163 -
A.2 ComProbe Automation Server: Why use it?
Frontline provides a full line of wireless sniffing devices for
developers that include ComProbe BPA 600 for
Bluetooth® Classic, low energy, and coexistence;
ComProbe 802.11 for Wi-Fi and Bluetooth coexistence.
Normal ComProbe protocol analyzer use is through a GUI
on a personal computer In this operation mode the user
has direct control of the setup and data capture through
the keyboard and mouse. User specific ComProbe
analyzer configuration and capture decisions may come
from user prescribed test documents or applied ad hoc or
on-the-fly.
The ComProbe software GUI is sufficient for many
development projects. But situations may arise where a
more automated process is desirable. For example, if a
Figure 1 - ComProbe GUI
company wants to ensure exact test processes,
automating those processes is one answer. When testing
multiple devices long test runs can occur, and automating can free up personnel to perform additional tasks. This
is a list of possible situations when automation would improve testing and developments operations and save
money.
l
Automate long test runs – free up personnel for other tasking or run overnight.
l
Automatic bookmarking capture data for specific events – helps developers focus on specific rest results.
l
Automatic adherence to test procedures – ensures test repeatability and eliminates human error.
l
l
l
Automatic exporting captured data – extracting specific data for post testing analysis outside of the ComProbe
software, e.g. export to CSV.
Automate other Windows – based applications while capturing data – for example, controlling other testing
equipment related to the test.
Automate regression testing.
- 164 -
ComProbe High Speed UART User Manual
Appendicies
The larger your task size the more benefit realized in cost avoidance and efficient resource usage through
automation of the Frontline ComProbe protocol analyzers. The extra effort to program the test automation is
minimal compared to the time saved to manually test.
Frontline's Automation Server provides the means to programmatically control ComProbe software and hardware
in a client-server configuration. The Automation Server is provided when you purchase your ComProbe analyzer,
and is stored in the Frontline ComProbe Protocol Analysis System directory. The ComProbe Automation Server
Protocol Programmers Guide is located in this same directory. The process for automating your data capture is
accomplished in three steps.
1. Connect the ComProbe hardware to a computer running ComProbe software and the Automation Server.
2. Launch the Automation Server program. The program will listen to the commands from the Automation
Client program and according control the ComProbe software.
3. Write your Automation Client program (use the template provided with the installation package) and run
it.
As long as there is no change in the programmed capture process, step 3 can be repeated reliably and without
deviation. Should the test plan change, the program written in step 1 can serve as a template to minimze
development timeand to provide quality control tracability.
A.2.1 Automation Server Topology
The Automation Server executes the commands issued by a user-created
Automation client script. The client script can run either on the local PC or on
a remote over a TCP/IP connection. The Automation Client program can be
written in any language and uses the syntax defined in the ComProbe
Automation Server Protocol Programmers Guide. The client will bypass the
local Microsoft Windows interface and interacts directly with ComProbe
software. One or more instances of the ComProbe software must be running
along with one instance of the Automation Server.
Figure 2 - Automation Server on a
Single PC
Figure 3 - Automation Server Using Two PCs
A.2.2 Writing Automation Script
Automation scripting is done by persons with knowledge of TCP socket communications. The process automation
is achieved by writing a client application which talks over a TCP network socket connection with the ComProbe
Automation Server.
Delivered in your ComProbe installation package is a sample script SampleClient.tcl. This script is located in your
installation directory. This is typically located at C:\Program Files (x86)\Frontline Test System II\Frontline
ComProbe Protocol Analysis System [your version]\Development Tools\. On 32-bit Windows or Windows XP the
root installation folder is "C:\Program Files\".
- 165 -
Appendicies
ComProbe High Speed UART User Manual
The sample script is written in TCL (Tool Command Language). TCL is an open-source, cross-platform programming
language. More information is available at www.tcl.tk. The script can be translated to any general purpose
programming language such as C# as long as you retain the program structure.
The sample script is divided into the
following sections identified by
comments "#".
1. Procedures
2. Command Wrappers
3. FTE_Base namespace vars
4. Start of Sample Script
Do not change any script in Procedures and Command Wrappers.
FTE_Base namespace vars Modifications
In the "FTE_Base namespace vars" section you will need to identify the connections for the host and the port.
Near the top of this section locate the following code at or near line number 747 - 748.
set Connections(Host) 0.0.0.0;
set Connections(Port) 22901;
For the Host, change 0.0.0.0 to the IP address of the computer running Automation Server. For example
192.168.10.94.
For the Port number, the default is set to 22901, which is not a common TCP port. It is unlikely that another
application is using this port, so you can leave the Port set to default 22901.
Note: Before launching the Automation Server, the IP address and IP port—the same as the script
Host and Port values—must be modified in the XML configuration file FTSAutoServer.exe.config.
This file is located in C:\Program Files\Frontline Test System II\Frontline ComProbe Protocol
Analysis System [your version]\Executable\Core\ directory. The code to modify is <add
key="IPAddr" value="0.0.0.0"/> and <add key="Port" value="22901"/>
Start of Sample Script Modifications
This section is the main part of the program and several lines in the template need to be changed to support your
unique data capture environment. First at or around line 792 we need to input the Host IP address again. Locate
the following code and enter your Host IP address. FTEBaseInit is a procedure that sets up the TCP connection.
FTEBaseInit 192.168.0.90
At or around line 803 change "13.1.830.1052" in the following code to the version of your ComProbe software.
The version number can be found listed with your Frontline installation directory at C:\Program Files (x86)
\Frontline Test System II\. CPASVersion is a varible used in the program to locate your installed version of the
ComProbe software.
set CPASVersion "C:\\Program Files\\Frontline Test System II\\Frontline ComProbe Protocol Analysis
System 13.1.830.1052\\Executables\\Core"
Lastly, you need to identify the "personality" of the ComProbe hardware. On or about line 823 you will change the
following code to replace the text within the quotes with the personality key that matches your sniffing hardware
configuration. Within the sample script are a few examples of commonly used personalities or "profiles". The
Programmers Guide provides a complete list of personalities.
set Profile "BPA600_Coex"
- 166 -
ComProbe High Speed UART User Manual
Appendicies
This code is the personality for using a ComProbe BPA 600 for Classic Bluetooth and a ComProbe 802.11 for Wi-Fi
with the software operating in Coexistence View. If you wanted to use just the ComProbe BPA 600 for captureing
Classic Bluetooth and Bluetooth low energy then you would change the value in quotes to "BPA600".
Having made these changes to the sample script template you are ready to capture data using your client-server
configuration, TCP connection, and capture hardware. At this point you shouild save the sample script as your own
template. As long as you maintain this test setup you will not need to change these settings making your unique
template reusable. However you may want to build a library of templates to cover a variety of automation
configurations. Once your unique template is coded you will find that development time for variations to the
template is insignificant.
In the next section we will step through the remainder of the sample script program to show how the Automation
Server converts the sniffing process to a largely self -acting process.
A.2.3 Running Automation Server Script
In this section we will make a comparison between the main program code and the manual operation at the GUI
in a sniffing and capture session. This approach will show that the Automation Server will duplicate the manual
processes but automation offers reliable repetition of those manual process and will save time in development
and regression testing.
Note: Note that this is sample script and that you will have to change the code in the main
program to suit your specific sniffing and capture needs. The command set is outlined in the
Programmers Guide in Chapter 3.
On or about line 824 of the sample script you will see the following code. StaertFTS tells the
Automation Server to launch the ComProbe software by opening your version of Frontline
ComProbe Protocol Analysis System and to use a specific personality.
StartFTS [format "%s;%s" $CPASVersion $Profile]
In the code above from the sample script $CPASVersion was defined at line 803, and the $Profile
was set at line 823 to use ComProbe BPA 600 and ComProbe 802.11 in coexistence. This is
equivalent to 1) double clicking on the Frontline desktop folder and starting the software and 2)
selecting a capture method.
- 167 -
Appendicies
ComProbe High Speed UART User Manual
Figure 4 - $Profile = BPA600_Coex", BPA600 and 802.11 in Coexistence
Moving to line 831 in the sample script we see a configuration setting command for the ComProbe BPA 600. The
only parameters shown in this code are the address of the Master and Slave devices. If other parameters are
omitted from the code the default values are selected. This line of code is equivalent to setting the BPA 600
datasource for Classic Bluetooth.
ConfigSettings [format "IOParameters;BPA600;Master=0x00025b01cb8b;Slave=0x00025b01cbe1"]
- 168 -
ComProbe High Speed UART User Manual
Appendicies
Figure 5 - ConfigSettings equivalent: ComProbe BPA 600 Configuration Settings Dialog
Similar ConfigSettings code will appear in the sample script for the ComProbe 802.11.
At line 853 the StartSniffing command appears. This is equivalent to clicking the Start Sniffing button
on the
BPA 600 datasource toolbar. Start Sniffing will start synchronization of the BPA 600 with the Bluetooth Devices.
Once synchronization is acheived the arrow between the Classic devices will turn green with the arrow head
point to the master device.
StartSniffing
- 169 -
Appendicies
ComProbe High Speed UART User Manual
Note: StartSniffing is unique to Bluetooth ComProbe devices, and it will automatically execute the
Automation Server StartCapture command once synchronized. For non-Bluetooth devices use the
StartCapture command that is equivalent to the Start Capture button
in the Control window.
At line 874 the following code will halt the capture after 10 seconds. This bit of code illustrates the control that
you can have over the capture process.
after 10000
At line 879 we have another Bluetooth-unique command that stops the sniffing and is equivalent to clicking the
Stop Sniffing button on the BPA 600 datasource.
StopSniffing
Here is one of those Bluetooth-unique situations. At line 889 the Stop Capture command is issued. Unlike the Start
Sniffing command , the Stop Sniffing command does not automatically execute the Stop Capture command so it
must be in the program if using ComProbe Bluetooth hardware. Stop Capture will stop the capture of data. This
command is equivalent to clicking on the Stop Capture button on the Contrtol window.
StopCapture
Figure 6 - BPA 600 Control window; Stop Capture is to the right of the red button.
At the end of the program you will want to stop the ComProbe software, so at line 900 we have the following
code.
StopFTS
Finally good programming housekeeping dictates that you should clear all connections. The following procedure
will disconnect the client-server and breakdown the TCP connection.
FTEBaseCleanup
This section has hit only the highlights of the sample script, but it has illustrated the connection between
Automation and the manual sniffing and capture of data. Your programs may be more detailed and will certainly
use many more commands. Refer to the ComProbe Automation Server Protocol Programmers Guide for more
information on the command set.
A.2.4 Saving Automation Captured Data
The Automation Server sample script gives you a building block for building your ComProbe hardware and
software sniffing and data capture process. Of course the primary purpose for using ComProbe products may be
to analyze the captured data to solve design and development issues, and to test your products. The sample script
does not provide sample code for the saving and exporting of the captured data.
- 170 -
ComProbe High Speed UART User Manual
Appendicies
The Save Capture command is equivalent to clicking on the ComProbe software Control window File menu
Save selection. The Save selection opens a Save as dialog where you would enter the location and file name for
your capture data—a .cfa file. The Save Capture command contains parameters that perform the same operation
only automatically.
Save Capture;c:Users\Public\Public documents\Frontline Test Equipment\My Capture Files\mycap.cfa
Figure 7 - ComProbe Software File Save
Save Capture command will save the entire capture file, which can be reloaded into the ComProbe software for
later analysis. To reload the capture file you use the Automation Server Open Capture File command that has
similar parameters to the Save Capture command.
Open Capture File;c:\Users\Public\Public documents\Frontline Test Equipment\My Capture
Files\mycap.cfa
While the Save Capture automatically archives everything that happened during the capture session your may
want to write a script that focuses on specific protocols. To do that you use the Automation Server Export
command that tells ComProbe software to invoke the Frame Display and then automatically selects the File
Export menu option. In the example code below the data is exported to the identified path/file, is waiting for the
frame to complete, and is selecting the 802.11 MAC protocol tab..
Export;c:\Users\Public\Public documents\Frontline Test Equipment\My Capture
Files\mycap.csv;Mode=0;Tab=802.11:802.11 MAC
Figure 8 - Export Command equivalent: Frame Display 802.11 MAC tab selected
Refer to the ComProbe Automation Server Protocol Programmers Guide for detail of the Export command Mode
and Tab parameters.
- 171 -
Appendicies
ComProbe High Speed UART User Manual
Export provides you with the ability to automatically save specific protocol data that may be the focus of your
analysis. The exported file is saved as a comma separate value (.csv) file type. This file may be opened for later
analysis in any application that supports .csv format such as Micosoft Excel or Access.
A.2.5 Keeping Track of Events
Automation Server Add Bookmark command will automatically add a book mark to the last frame currently in the
capture buffer.
Consider this scenario. You have set up your automation script but you want to keep track of the specific events,
for example when you start streaming music from your smart phone to a Bluetooth speaker. The
Add Bookmark;String=StartMusicStream
In this scenario the Add Bookmark command may be used with TCL conditional statements to detect and guide
the event actions. The string parameter will be the name on the bookmark for your saved or exported data
capture. When analyzing the automated capture session at a later date you can use the bookmark to localize your
analysis to the event.
A.2.6 Automation Can Save Time and Money
In a carefully considered design, development, or testing environment automation of wireless sniffing and data
capture can save time and money. The Frontline Automation Server gives you the means to save time by ensuring
process are reliably reproduced. This is especially true for situations when you want to run the identical tests on
several products or versions of a product. Being able to compare captured data across design versions is
enhanced when you can run exactly the same process.
Up-front automation script development time is a consideration when setting up an automated sniffing process.
The ComProbe Automation Server Protocol Programmers Guide is delivered with your installation package, and
the latest version is always available for download on FTE.com/support/documents in ComProbe Automation.
Should you need additional assistance with the Automation Server, contact Frontline's technical support team.
Author: John Trinkle
Publish Date: 8 May 2014
- 172 -
Appendicies
ComProbe High Speed UART User Manual
Index
BL 150
Bookmarks 119-120
A
Boolean 69, 74
Aborted Frame 137
Breakout Box 92
About Display Filters 66
Breakout Box Options 93
About L2CAP Decoder Parameters 22
Breakout Box Window 90
Absolute Time 143
Broken Frame 44
Add a New or Save an Existing Template 21
BS 150
Adding a New Predefined Stack 34
BT Snoop File Format 145
Adding Comments To A Capture File 124
Btsnoop 145
Advanced System Options 136
Buffer 123, 134
Apply Capture Filters 68
Buffer Overflow 134
Apply Display Filters 66-69, 71
Buffer Tabs 100
ASCII 43
Buffer/File Options 134
character set 148
Byte 41-42, 64, 148
viewing data in 43
Searching 110
ASCII Codes 148
byte export 56
ASCII Pane 63
C
Auto-Sizing Column Widths 61
Calculating Data Rates and Delta Times 41
Automatically Request Missing Decoding
Information 37
Capture Buffer 123, 134, 136
Automatically Restart 134
Capture Buffer Size 134
Automatically Restart Capturing After 'Clear
Capture Buffer' 134
Capture File 28, 123-126, 134, 136
auto-save imported files 134
Automatically Save Imported Capture Files 134
capture to a series of files 134
Autotraversal 35-36
capture to one file 134
B
changing default location of 138
Bar Charts 101
changing max size of 134, 136
Baudot 43, 133
framing captured data 35
Baudot Codes 148
importing 126
Begin Sync Character Strip 45
loading 125
Binary 42, 107
reframing 35
Binary Pane 64
- 174 -
ComProbe High Speed UART User Manual
Appendicies
removing framing markers 36
Custom Stack 33-34
saving 123-124
Customizing Fields in the Summary Pane 61
starting capture to file 28
D
Capturing 28
D/1 150
Data to Disk 28
D/2 149
CFA file 124-125
D/3 149
Changing Default File Locations 138
D/4 149
Character 107, 149
D/E 150
Character Pane 63
Data 41, 122-123
Character Set 43, 148-149
Capturing 28
Characters Per Second Table 101
Data Byte Color Denotation 65
Choosing a Data Capture Method 6
Data Errors 115
Clear Capture Buffer 134
Data Rates 41
CN 150
Decimal 42
Color of Data Bytes 65
Decode Pane 62
Colors 65
decoder 151
Comma Separated File 130
Decoder Parameters 18
Compound Display Filters 69
DecoderScript 151
Confirm CFA Changes 125
Decodes 18, 33, 37, 46, 52, 62, 104
Context For Decoding 37
Default File Locations 138
Control Characters 149
Delete a Template 21
Control Signals 44, 90, 92, 94, 96-97, 140
Deleting Display Filters 71
Control Window 15, 134
Delta Times 41
Configuration Information 11
Direction 71
Conversation Filters 71
Directories 138
Copying Statistics 101
Disabling 134
CPAS Control Window Toolbar 10
Display Entire Buffer 97
CR 150
Display Filters 66, 72-74
CRC 40
Display Options 144
CSV Files 130
DL 150
Custom Protocol Stack 33-34
Dots 62
- 175 -
Appendicies
ComProbe High Speed UART User Manual
Driver 151
File 122-125, 134
Duplicate View 38, 40, 55-56
File Locations 138
E
File Series 134
E/B 150
File Types Supported 125
E/C 150
Filtering 80
Easy Protocol Filtering 81
Filters 66-69, 71-74, 81
EBCDIC 43
Find 104, 107-108, 110-111, 115
EBCDIC Codes 149
Find - Bookmarks 117
EM 149
Find Introduction 103
EQ 150
Font Size 46
Errors 115, 140
Frame Display 46, 49, 52-53, 55-56, 61-65
ET 149
Frame Display - Change Text Highlight
Color 64
Event Display 38, 55, 130
Frame Display - Find 53
Event Display Export 130
Frame Display Status Bar 52
Event Display Toolbar 39
Frame Display Toolbar 49
Event Numbering 148
Frame Display Window 47
Event Pane 64
Frame Recognizer Change 45
Event Symbols 44
Frame Symbols 62
EX 149
Frame Information on the Control Window 11
Exclude 68
Freeze 41
Exclude Radio Buttons 68
FS 150
Expand All/Collapse All 62
FTS Serial Driver 151
Expand Decode Pane 56
G
Export
Go To 110
Export Baudot 133
Graphs 102
Export Events 131
Green Dots in Summary Pane 62
Export Filter Out 133
GS 149
F
H
F/F 149
Hex 42
FCSs 40
Hexadecimal 63
Field Width 61
Hiding Display Filters 71
- 176 -
ComProbe High Speed UART User Manual
Appendicies
Hiding Protocol Layers 52
Modify Display Filters 73-74
High Resolution Timestamping 143
Multiple Event Displays 40
HT 150
Multiple Frame Displays 56
I
N
I/O Settings Change 45
New Snapshot 97
Icons in Data on Event Display 44
NK 150
Importable File Types 126
Node Filters 71
Importing Capture Files 125
Nonprintables 133
INCLUDE 68
Notes 124
Include/Exclude 68
NU 149
L
Number Set 42
L2CAP 22
Numbers 148
L2CAP Override Decode Information 23
O
Layer Colors 65
Octal 42
LF 150
Open 40
Live Update 41
Open Capture File 125
Logical Byte Display 53
Options 93, 97, 134, 136-137, 141
Logical Bytes 53
Other Term
Long Break 45
Subterm 14
Low Power 45
Override Decode Information 23, 26
M
Overriding Frame Information 37
Main Window 9
Overrun Errors 116
Message Sequence Chart 81
P
Message Sequence Chart - Find and Go To 86
Panes 56
Message Sequence Chart - Go To 87
Pattern 106
Minimizing 15
Pause 28
Missing Decode Information 25
Performance Notes 93, 144
Mixed Channel/Sides 43
Pie Charts 101
Mixed Sides Mode 43
Printing 102, 129
Modem Lead Names 140
Printing from the Frame Display 126
Modem Leads 94
Progress Bars 148
- 177 -
Appendicies
ComProbe High Speed UART User Manual
Protocol
Saving 123-124
Protocol Layer Colors 65
Display Filter 67
Protocol Layer Filtering 80
Imported Capture Files 134
Protocol Stack 33-34, 36
Saving the Capture File using File > Save or the
Save icon 122
Q
Search 104, 106, 108, 110-111, 115, 118-120
Quick Filtering 80
binary value 106
R
bookmarks 120
Radix 42, 63
character string 106
real time 90, 94
errors 115
Reframe 35
event number 111
Reframing 35
frame number 110
Relative Time 108, 143
hex pattern 106
Remove
pattern 106
Bookmarks 119-120
special event 111
Columns 61
timestamp 108
Custom Stack 33
wildcards 106
Filters 71-72
Seed Value 40
Framing Markers 36
Serial Driver 151
Reset Panes 56
Short Break 45
Resetable Tab 100
Side Names 140
Resolution 142
Sides 140
Resumed 44
Signal Display 94-96
Revealing Protocol Layers 52
Signal Display Options 97
RFCOMM 24-26
Signal Display Toolbar 95
RFCOMM Missing Decode Information 25
Sorting Frames 53
RFCOMM Override Decode Information 26
Special Events 111
RS 149
Start 44
S
Start Up Options 137
Save 68, 122-124
Statistics 98
Save As 122
Statistics Graphs 101
Summary 58
- 178 -
ComProbe High Speed UART User Manual
Appendicies
Summary Pane 58, 61-62
Sync Dropped 45
Sync Found 45
Sync Hunt Entered 45
Sync Lost 45
Synchronization 55
System Settings 134, 136
T
Technical Support 153
Test Device Began Responding 45
Test Device Stopped Responding 45
Timestamp 119, 142-143
Timestamping 119, 141, 143
Timestamping Disabled 45
Timestamping Enabled 45
Timestamping Options 134, 141
Timestamping Resolution 142
Timestamps 141, 143
Transferring Packets 28
Truncated Frame 45
U
Underrun Error 45
Unframe 36
Unframe Function 36
Unframing 36
Unknown Event 46
V
vendor specific decoder 151
Viewing Data Events 42
W
Wrap Buffer/File 134
- 179 -