1
Colasoft Capsa 7.2.1
User Manual
Maximize Network Value
Content
Network Analyzer
Content
Content......................................................................................................................................................................................................... 2
Overview ...................................................................................................................................................................................................... 5
New Features ............................................................................................................................................................................................... 5
License Agreement ...................................................................................................................................................................................... 7
Installation and Deployment ......................................................................................................................................................................... 8
Installation Environment ........................................................................................................................................................................... 8
Port Mirroring .......................................................................................................................................................................................... 11
System Requirements ............................................................................................................................................................................ 12
Installation and Uninstallation ................................................................................................................................................................. 12
Privacy Statement .................................................................................................................................................................................. 13
Activation Guide ..................................................................................................................................................................................... 14
Getting Started ........................................................................................................................................................................................... 15
Launching Colasoft Capsa...................................................................................................................................................................... 15
Start Page............................................................................................................................................................................................... 15
Start a Capture ....................................................................................................................................................................................... 16
Analysis Mode ............................................................................................................................................................................................ 17
Analysis Mode - Capture ........................................................................................................................................................................ 17
Analysis Mode - Replay .......................................................................................................................................................................... 18
Main User Interface .................................................................................................................................................................................... 19
Ribbon .................................................................................................................................................................................................... 19
Menu Button ........................................................................................................................................................................................... 20
Node Explorer Window ........................................................................................................................................................................... 22
Main View ............................................................................................................................................................................................... 24
Status Bar ............................................................................................................................................................................................... 25
Choosing Network Adapter ........................................................................................................................................................................ 27
Using Filters ............................................................................................................................................................................................... 28
Simple Filters .......................................................................................................................................................................................... 30
Advanced Filters ..................................................................................................................................................................................... 33
© 2010 Colasoft. All rights reserved. Colasoft®, the Colasoft logo, Capsa® are among the trademarks or registered trademarks of the company in
the United States and/or other countries. All other trademarks are property of their respective owners.
2 / 133
Content
Network Analyzer
Network Profile ........................................................................................................................................................................................... 35
General Settings ..................................................................................................................................................................................... 36
Network Group ....................................................................................................................................................................................... 37
Name Table ............................................................................................................................................................................................ 39
Alarm Settings ........................................................................................................................................................................................ 41
Analysis Profile Options ............................................................................................................................................................................. 43
Analysis Object ....................................................................................................................................................................................... 44
Packet Storage ....................................................................................................................................................................................... 44
Log Settings............................................................................................................................................................................................ 46
Diagnosis Settings .................................................................................................................................................................................. 47
Local Engine Settings ................................................................................................................................................................................ 49
Customize Protocol................................................................................................................................................................................. 49
Display Format ....................................................................................................................................................................................... 51
Report Settings ....................................................................................................................................................................................... 53
System Options .......................................................................................................................................................................................... 54
General Settings ..................................................................................................................................................................................... 55
Decoder Settings .................................................................................................................................................................................... 57
Dashboard Tab .......................................................................................................................................................................................... 57
Creating Graphs ..................................................................................................................................................................................... 59
Graph Types ........................................................................................................................................................................................... 61
Summary Tab ............................................................................................................................................................................................. 62
Diagnosis Tab ............................................................................................................................................................................................ 64
Protocol Tab ............................................................................................................................................................................................... 68
Physical Endpoint Tab................................................................................................................................................................................ 71
IP Endpoint Tab ......................................................................................................................................................................................... 73
Physical Conversation Tab......................................................................................................................................................................... 76
IP Conversation Tab .................................................................................................................................................................................. 78
TCP Conversation Tab ............................................................................................................................................................................... 80
Data Flow Tab ........................................................................................................................................................................................ 82
Time Sequence Tab ............................................................................................................................................................................... 83
UDP Conversation Tab .............................................................................................................................................................................. 84
Data Tab ................................................................................................................................................................................................. 87
© 2010 Colasoft. All rights reserved. Colasoft®, the Colasoft logo, Capsa® are among the trademarks or registered trademarks of the company in
the United States and/or other countries. All other trademarks are property of their respective owners.
3 / 133
Content
Network Analyzer
Matrix Tab .................................................................................................................................................................................................. 88
Log Tab ...................................................................................................................................................................................................... 96
Report Tab ................................................................................................................................................................................................. 99
Alarm Explorer Window ............................................................................................................................................................................ 101
Creating and Editing Alarms ................................................................................................................................................................. 104
Analysis Profile......................................................................................................................................................................................... 107
Managing Analysis Profiles................................................................................................................................................................... 107
Tools ........................................................................................................................................................................................................ 109
Tool Settings......................................................................................................................................................................................... 109
Colasoft Ping Tool ................................................................................................................................................................................ 112
Colasoft MAC Scanner ......................................................................................................................................................................... 116
MAC Scanner - Scan Network .............................................................................................................................................................. 118
Colasoft Packet Player ......................................................................................................................................................................... 122
Colasoft Packet Builder ........................................................................................................................................................................ 127
© 2010 Colasoft. All rights reserved. Colasoft®, the Colasoft logo, Capsa® are among the trademarks or registered trademarks of the company in
the United States and/or other countries. All other trademarks are property of their respective owners.
4 / 133
Overview
Network Analyzer
Overview
Welcome to Colasoft Capsa 7.1.2
Designed for packet decoding and network diagnosis, Colasoft Capsa monitors the network traffic transmitted over a local network,
helping network administrators troubleshoot network problems. With the ability of real time packet capture and accurate data
analysis, Colasoft Capsa makes your network transparent before you, letting you fast locate network problems and efficiently
expose hidden security threats.
You may install Colasoft Capsa on a laptop and analyze, monitor and diagnose anywhere in your network you want to. Colasoft
Capsa analyzes and diagnoses either real-time network traffic or problems in replayed saved packet files. To realize accurate
problem location and efficient analysis, you can use application analysis profile to lock down problems in real-time.
Colasoft Capsa 7.1.2 adopts new user interface style of Microsoft Office 2007, which intends to display analysis statistics in a more
simple-straight and graphical style. The new organized statistics tabs will really help shorten network engineers' time spent on
finding useful information to diagnose the network. New Dashboard tab gives you enough choices to customize and create almost
any kind of statistics graphs you want.
Based on the second-generation Colasoft Packet Analysis Engine (CSPAE) platform, Colasoft Capsa 7.1.2 ehhances its
performance in large traffic network. No matter in 100M or 1000M network, Colasoft Capsa provides you with efficient and complete
network analysis solution.
With the help of Colasoft Capsa, you can easily accomplish the following tasks:
•
Network traffic analysis
•
Network communication monitoring
•
Network problems diagnosis
•
Network security analysis
•
Network performance detecting
•
Network protocol analysis
Colasoft Capsa analyzes your network from the lowest level and all the way up to the application level, so that it finds out all the
problems of your network. Colasoft Capsa, cooperation with other network management tools, will maximize your network value.
New Features
Feature
Description
New UI
Adopts the latest 2007 Microsoft Office UI Template and displays statistics in a clearer and graphical
style.
Analysis Guiding
•
Guides you to start an analysis project on Start Page in new steps. It generally takes four
steps to start a capture: selecting an analysis mode > making filters > selecting network
profile > choosing analysis profile > start. (See Start Page for more details)
•
Colasoft Capsa provides two analysis modes: Capture Analysis and Replay Analysis.
Capture Analysis
Captures and analyzes packets from one or multiple adapters in real time.
Replay Analysis
Analyzes saved packets by replaying. You can analyze packets to diagnose events happened in your
network in the past.
Network Profile
Designed for storing general properties of different networks. Different network segments may have
their own environment. Colasoft Capsa lets you save the most common-used properties, e.g.
© 2010 Colasoft. All rights reserved. Colasoft®, the Colasoft logo, Capsa® are among the trademarks or registered trademarks of the company in
the United States and/or other countries. All other trademarks are property of their respective owners.
5 / 133
New Features
Network Analyzer
bandwidth, network structure, name table and alarms.
Analysis Profile
Provides network application-oriented analysis profiles, including Full Analysis, Traffic Monitor and
other commonly used protocol/application analysis profiles. Furthermore, you can create your own
analysis profiles to meet you specific demands.
Network Adapter
Unique to the Capture analysis mode, displays real-time network adapter status and properties and
Real-time Status
helps you to identify the packet sources of network.
Display
More Accessible
With enhanced graphical packet filter configurations, lets you read packet processing steps more
Filters
easily. You can check these boxes: Accept Refuse and No checking to build up filters and the right
pane refresh the combination of filters to help you understand packet processing.
New Tab Structure
The new tab organizing structure lets you find useful statistics with less clicks and more easily.
New Ribbon
The Ribbon provides all commonly-used shortcuts and commands. On the Ribbon, you can start or
stop a capture, change project settings and get project status information (start time, start date,
captured filters and packets, dial and buffer map).
Global Status Bar
Provides information and icons on name of the current analysis profile, select network adapter,
reselect replay packet files and alarm information.
Global Traffic Dial
Refreshes by second the network utilization and throughput as analog dials and digits on the Ribbon.
Buffer Map
Graphically displays dedicated packet buffer usage. You can understand buffer usage vividly.
Customize
Lets you customize protocols to meet you necessary based on Ethernet Type, IP protocol, TCP port
Protocol
and UDP port.
New Dashboard
Provides a great many of statistic graphs from global network to a specific node. You are able to as
well create almost any kind of graph based on any MAC address, IP address and protocol, etc. With
these graphs, you can easily find out anomalies of the network and get useful statistics.
New Diagnosis
Provides new diagnosis addresses and more tips on how to solve the problems. You can easily
locate suspicious machines with logs of expert diagnosis. You can choose to display diagnosis
events by protocol layer structure or by type layer (security, performance and fault) and hide all empty
diagnosis categories.
Real Time Alarm
Pops up alert to inform administrator triggered alarms that you created on your demands. You can
Pop-up
find triggered alarm count number on Status Bar and hide the Alarm Explorer window.
Alarms are logged and saved to disk in detail for your later reference.
Enhanced Report
1. Provides a wide variety of global reports based on statistics.
2. Lets you create customized reports and customize report Logo, Name, Title prefix, Author,
Generation time stamp and Top X number.
3. Supports you to generate report in common PDF, MHT and HTML format files.
TCP Time
Choose TCP Type conversation, you can find Time Sequence in TCP Conversation tab, which
Sequence Diagram
displays SYN and ACK information between the two communications nodes. You will feel easy to
understand and analyze the TCP communications between two ends.
Enhanced Matrix
1. The edges of nodes and lines are displayed more smoothly.
2. On-focused nodes or connections will be exaggeratedly enlarged.
3. Right-click a node, you can choose to create a graph based on the selected node.
© 2010 Colasoft. All rights reserved. Colasoft®, the Colasoft logo, Capsa® are among the trademarks or registered trademarks of the company in
the United States and/or other countries. All other trademarks are property of their respective owners.
6 / 133
License Agreement
Network Analyzer
License Agreement
Colasoft Capsa End User License Agreement
Copyright (c) 2001 - 2010 Colasoft Co., Ltd. All rights reserved.
THIS LICENSE AGREEMENT SHALL ONLY APPLY TO COUNTRIES AND REGIONS OTHER THAN THE MAINLAND CHINA.
This License Agreement is a legal contract between you (either as an individual or as an entity) and Colasoft Co., Ltd.
("COLASOFT") for the Colasoft Capsa and related add-ons ("SOFTWARE PRODUCT").
You should carefully read the following terms and conditions before using the Software Product. Installation or use of the
SOFTWARE PRODUCT indicates your acceptance of this License Agreement.
Copyright
The SOFTWARE PRODUCT and Documentation are copyrighted by COLASOFT and are protected by international copyright laws.
The SOFTWARE PRODUCT contains copyrighted software of COLASOFT. All rights reserved. You agree not to remove any
trademarks or copyright notices from the SOFTWARE PRODUCT and Documentation.
License Types
1.
Single Seat License
A Single Seat License grants you the right to install and use the SOFTWARE PRODUCT on one single computer and
provide access for an unlimited number of individuals. You may NOT install and use the SOFTWARE PRODUCT on a
computer other than the first computer you installed the SOFTWARE PRODUCT on. For running this SOFTWARE
PRODUCT on additional computers requires additional licenses.
2.
5 Seat License
A 5 Seat License grants you the right to install and use the SOFTWARE PRODUCT on five computers and provide access
for an unlimited number of individuals with one single license key. You may NOT install and use the SOFTWARE
PRODUCT on a computer other than the first five computers you installed the SOFTWARE PRODUCT on. For running this
SOFTWARE PRODUCT on additional computers requires additional licenses.
3.
Site License
A Site License grants you the right to install and use the SOFTWARE PRODUCT on an unlimited number of computers
and provide access for an unlimited number of individuals with one single license key at a single organization location. To
use the SOFTWARE PRODUCT in remote locations, such as branch offices, requires separate licenses.
4.
Global License
A Global License grants you the right to install and use the SOFTWARE PRODUCT on an unlimited number of computers
and provide access for an unlimited number of individuals with one single license key at any organization location
worldwide.
Not-For-Resale Copies
If the SOFTWARE PRODUCT is marked as a Not-For-Resale (NFR) copy you may not sell or transfer the usage license of the
SOFTWARE PRODUCT for any kind of payment. An NFR copy of the SOFTWARE PRODUCT may only be used for purposes of
demonstration the SOFTWARE PRODUCT’s resources. With an NFR version of the SOFTWARE PRODUCT you may not make or
distribute additional copies.
Demo Version
If the SOFTWARE PRODUCT is marked as a demonstration version for the final user (DEMO) you must buy a legal license and
delete all copies of the demo version after expiring the time limit. The demo version may be distributed freely by any kind of MEDIA,
Internet server, BBS, etc., as long as no changes are made and package content is not changed.
© 2010 Colasoft. All rights reserved. Colasoft®, the Colasoft logo, Capsa® are among the trademarks or registered trademarks of the company in
the United States and/or other countries. All other trademarks are property of their respective owners.
7 / 133
Installation and Deployment
Network Analyzer
Limitation on Use
You may not: permit other individuals to use the SOFTWARE PRODUCT except under the terms listed above; modify, translate,
reverse engineer, decompile, decrypt, extract, disassemble, or create derivative works based on the SOFTWARE PRODUCT; copy
the SOFTWARE PRODUCT other than as specified in Software Usage section of this License; sell, rent, lease, grant a security
interest in, or otherwise transfer rights to the SOFTWARE PRODUCT; or alter or remove any proprietary notices or labels on the
SOFTWARE PRODUCT. LICENSEE warrants that it will not use or redistribute the SOFTWARE PRODUCT for such purposes.
Disclaimer
THE SOFTWARE PRODUCT IS PROVIDED "AS IS" WITHOUT WARRANTY OF ANY KIND, EITHER EXPRESSED OR IMPLIED,
INCLUDING, BUT NOT LIMITED TO, WARRANTIES OF MERCHANTABILITY OR FITNESS FOR A PARTICULAR PURPOSE. IN
NO EVENT WILL COLASOFT BE LIABLE TO YOU FOR ANY DAMAGES, INCLUDING INCIDENTAL OR CONSEQUENTIAL
DAMAGES, ARISING OUT OF THE USE OF THE SOFTWARE PRODUCT, EVEN IF ADVISED OF THE POSSIBILITY OF SUCH
DAMAGES. YOU ACKNOWLEDGE THAT YOU HAVE READ THIS LICENSE, UNDERSTAND IT AND AGREE TO BE BOUND BY
ITS TERMS.
Governing Law
This Agreement will be governed by the laws of the People's Republic of China.
Distribution
The DEMO version of the SOFTWARE PRODUCT may be distributed freely in its original unmodified and unregistered form. The
distribution must include all files of its original distribution. Distributors may not charge any money for distributing this version.
Anyone distributing the SOFTWARE PRODUCT for any kind of remuneration must first contact us for authorization.
Colasoft does not grant you the right to give away, sell, license or otherwise distribute the full version or Not-For-Resale copies of
the SOFTWARE PRODUCT.
Installation and Deployment
Installation Environment
Colasoft Capsa is professional in monitoring and analyzing intranet packets and packets from internet, even packets crossing VLAN.
Colasoft Capsa only need to be installed on the management machine, but other managed clients need not. Administrator needs to
decide which machine to install Colasoft Capsa. Installation on different nodes, total captured packets number may differ. Therefore,
you are recommended that you install or connect Colasoft Capsa to the central switch equipment, so that Colasoft Capsa will
capture packets of your entire network to have a comprehensive monitoring and analysis. Of course you can use a TAP to capture
packets and analyze any network segment. Here we introduce you some common topology environments that Colasoft Capsa
could have a sufficient monitor and analysis.
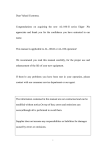
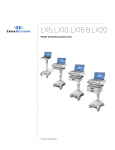
Shared network - Hub
A shared network is also known as hubbed network which is connected with a hub.
Hubs are commonly used to connect segments of a LAN. When a packet arrives at one port, it is copied to the other ports so that all
segments of the LAN can see all packets. A passive hub serves simply as a conduit for the data, enabling it to go from one device
(or segment) to another. So-called intelligent hubs include additional features that enable an administrator to monitor the traffic
passing through the hub and to configure each port in the hub. Intelligent hubs are also called manageable hubs. A third type of hub,
called a switching hub, actually reads the destination address of each packet and then forwards the packet to the correct port.
With a shared environment, Colasoft Capsa can be installed on any host in LAN. The entire network data transmitted through the
Hub will be captured, including the communication between any two hosts in LAN.
© 2010 Colasoft. All rights reserved. Colasoft®, the Colasoft logo, Capsa® are among the trademarks or registered trademarks of the company in
the United States and/or other countries. All other trademarks are property of their respective owners.
8 / 133
Installation and Deployment
Network Analyzer
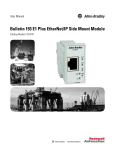
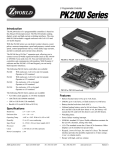
Switched network - managed switches (Port mirroring)
Switch is a network device working on the Data Link Layer of OSI. Switch can learn the physical addresses and save these
addresses in its ARP table. When a packet is sent to switch, switch will check the packet's destination address from its ARP table
and then send the packet to the corresponding port.
Generally all three-layer switches and partial two-layer switches have the ability of network management; the traffic going through
other ports of the switch can be captured from the debugging port (mirror port/span port) on the core chip. To analyze the traffic
going through all ports, Colasoft Capsa should be installed on this debugging port (mirror port/span port).
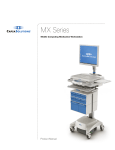
Switched network - unmanaged switches
Some switches do not have the network management function. So there is no mirroring port as well. You can either, in this scenario,
use a Hub or a Tap to monitor and analyze your network with Colasoft Capsa.
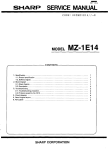
Connect a tap with the line to be monitored
Taps can be flexibly placed on any line in network. When the requirement for network performance is very high, you can add a tap
© 2010 Colasoft. All rights reserved. Colasoft®, the Colasoft logo, Capsa® are among the trademarks or registered trademarks of the company in
the United States and/or other countries. All other trademarks are property of their respective owners.
9 / 133
Installation and Deployment
Network Analyzer
to connect your network.
Connect a hub with the line to be monitored
A Hub costs lower than a Tap but lower performance than a Tap in large traffic network.
Monitoring a network segment
In the case when you only need to monitor the traffic in a network segment (e.g. Finance department, Sales department, etc.), you
can connect the server on which Colasoft Capsa is installed and the network segment with an exchange facility. The exchange
facility can be hub, switch or proxy server.
© 2010 Colasoft. All rights reserved. Colasoft®, the Colasoft logo, Capsa® are among the trademarks or registered trademarks of the company in
the United States and/or other countries. All other trademarks are property of their respective owners.
10 / 133
Installation and Deployment
Network Analyzer
Proxy server
In small network, a proxy server is a reliable choice to deploy an network. Under this circumstance, you can install Colasoft Capsa
directly on the proxy server.
Port Mirroring
Switch is a network exchange facility operating at the data link layer (layer 2) and sometimes the network layer (layer 3) of the OSI
Reference Model. Classified by working protocols, there are two-layer switch, three-layer switch, four-layer switch and
multiple-layer switch. Switch also can be classified into managed switch and unmanaged switch. Generally, three-layer switch and
above has management function (managed switch).
Unlike hubs, switches prevent promiscuous sniffing. In a switched network environment, Colasoft Capsa (or any other packet
analyzer) is limited to capturing packets only from the port the machine connected to and broadcast packets and multicast packets.
However, most modern switches (management switches) support port mirroring, which allows users to configure the switch to
© 2010 Colasoft. All rights reserved. Colasoft®, the Colasoft logo, Capsa® are among the trademarks or registered trademarks of the company in
the United States and/or other countries. All other trademarks are property of their respective owners.
11 / 133
Installation and Deployment
Network Analyzer
redirect the traffic that occurs on some or all ports to a designated monitoring port on the switch. With this feature, you can monitor
the entire LAN segment in switched network environment. Please refer to the configuration documents shipped with your switch for
this feature and configuration instructions.
If your switch does not support port mirroring, you can install Colasoft Capsa on a workstation connected to the same hub as your
Internet gateway, or on your Internet gateway (if acceptable), thus you can monitor all network traffic between your intranet and the
Internet. Read Installation Environment to know how to deploy Colasoft Capsa.
A list of some managed switches (with port monitoring/spanning) which are commonly used is available on our website; please visit
the Switch Management page for references.
System Requirements
Colasoft Capsa does not need a high performance machine and can be installed on many Windows operation systems, such as
Windows XP, Windows 2003, Windows Vista and x64 Edition and the latest Windows 7. Your system's performance and
configuration will affect the running of Colasoft Capsa. The following minimum requirements are the bottom line to install and run
Colasoft Capsa normally; it would be better if your system has a higher configuration, especially in a busy or big network.
Minimum requirements:
•
P4 2.8GHz CPU
•
2 GB RAM
•
Internet Explorer 6.0
Recommended requirements:
•
Intel Core Duo 2.4GHz CPU
•
4 GB RAM or more
•
Internet Explorer 6.0 or higher
Supported Windows Operating Systems:
•
Windows XP (SP1 or later) and 64bit Edition
•
Windows Server 2003 and 64bit Edition
•
Windows Vista and 64bit Edition
•
Windows 2008 and 64bit Edition
•
Windows 7 and 64bit Edition
Installation and Uninstallation
Before Installation:
1. Carefully read Installation Environment and check if your network topology is fit for Colasoft Capsa working environment.
2. Carefully read System Requirements and make sure your machine meets the minimum requirements at least.
3. Close all running applications on your machine.
4. Uninstall any earlier or trial versions of Colasoft Capsa on your machine.
You can skip the unistallation step. Colasoft Capsa will automatically check the older versions and ask you to uninstall them in the
installation wizard.
Installation:
1.
Double-click the installation file; Welcome screen appears, telling you that Colasoft Capsa will be installed on your
© 2010 Colasoft. All rights reserved. Colasoft®, the Colasoft logo, Capsa® are among the trademarks or registered trademarks of the company in
the United States and/or other countries. All other trademarks are property of their respective owners.
12 / 133
Installation and Deployment
Network Analyzer
machine. Click Next to continue or Cancel to exit setup.
2.
Read the License Agreement carefully in the next screen to learn our terms and conditions concerning possession and use
of Colasoft Capsa. You must accept the terms of the license agreement to continue the installation.
3.
The screen presents the important information from the ReadMe file.
4.
Select Destination Location screen. It suggests the default location to install Colasoft Capsa. You may click Browse... to
choose another installation location. Space requirement display on the bottom of the dialog; make sure you have enough
space for the installation. Click Next to continue.
5.
Select Start Menu Folder screen. Click the Browse... button to designate an alternate start menu folder. Click Next to
continue.
6.
Select Additional Tasks screen. Create a Desktop Icon and Create a Quick Icon are checked by default. Uncheck any
checkbox if you do not want to create the icon. Click Next to continue.
7.
Now you are Ready to Install Colasoft Capsa on your machine. Click Install to start installation or click Back to change
your settings.
8.
When installation is complete, the completing screen appears. Click Finish to close the setup wizard. Colasoft Capsa will
be started if you checked Launch Program.
If no change on default create desktop icon and shortcut icon check boxes, you will see an icon on the desktop and one in
Quick Start.
Uninstallation:
To open Colasoft Capsa Uninstallation dialog, do one of the following:
•
To uninstall Colasoft Capsa, choose Start > All Programs > Colasoft Capsa 7.1 > Uninstall Colasoft Capsa 7.1.
•
Open the Control Panel > double-click Add/Remove Programs icon, the Add/Remove Programs window appears >
find Colasoft Capsa 7.1.2 in the list and click Remove.
The Uninstallation dialog appears. Follow these steps to uninstall Colasoft Capsa:
1.
If you want to completely remove Colasoft Capsa 7.1.2 and all of its components from your machine, click YES to continue,
or click NO to quit uninstallation.
2.
If you want to delete the license information, click YES, or click NO to remain license information on your machine to
continue.
You are recommended to click NO to keep license information on your machine, in case you want to install Colasoft Capsa on your
computer again.
3.
If you want to delete your customized alias in Name Table and filters in Colasoft Capsa, click YES or NO to remain them
on your machine to continue.
4.
To finish uninstallation, click YES to restart your machine.
Privacy Statement
The Colasoft Product Activation is an anti-piracy technology designed to verify that the software products have been legitimately
licensed.
When you activate Colasoft Capsa over the Internet, you are not required to send any personal information to Colasoft; the product
activation is completely anonymous.
When you activate Colasoft Capsa by fax or email, you are required to send the serial number and installation ID number displayed
© 2010 Colasoft. All rights reserved. Colasoft®, the Colasoft logo, Capsa® are among the trademarks or registered trademarks of the company in
the United States and/or other countries. All other trademarks are property of their respective owners.
13 / 133
Installation and Deployment
Network Analyzer
on your screen to Colasoft. The installation ID number includes an encrypted form of the product ID and a hardware hash, or
checksum. No personally identifying data is included or required. The confirmation ID is simply an unlocking code for the Colasoft
Capsa installation on that particular PC. The information that you provide will be securely stored by Colasoft and will be protected
from disclosure to any third parties without your consent.
During the product activation process, Colasoft creates a unique hardware identification that represents the configuration of the PC
at the time of activation. The hardware identification does not include any personal information, any information about software or
the data that may reside on your PC, or any information about the specific make or model of your PC. The hardware identification
identifies only the PC and only for the sole purpose of product activation. Colasoft Capsa can detect the minor changes to your PC
configuration. You will be required to reactivate product if you reinstall operating system or use Colasoft Capsa on another PC.
Activation Guide
The product activate process is very important to against privacy. To activate Capsa, you need to correctly enter the serial number;
a dialog will appear to require you to activate your product. You may choose to activate product over the Internet, or by fax or email.
•
Activate product over the Internet (recommend)
It is very quick and easy, the activation process will only take a few seconds with a couple of clicks.
•
Activate by fax or email
If you select to activate product manually, it will need more time to finish. Please send us via email or fax the Serial
Number and Machine Number. After receiving your request, we will get back to you with a Activation Number. Enter the
Activation Number into the textbox as required; your product will be activated immediately.
© 2010 Colasoft. All rights reserved. Colasoft®, the Colasoft logo, Capsa® are among the trademarks or registered trademarks of the company in
the United States and/or other countries. All other trademarks are property of their respective owners.
14 / 133
Getting Started
Network Analyzer
Getting Started
Launching Colasoft Capsa
To start Colasoft Capsa, do any of the following:
•
Launch from the desktop:
If checked the Create a Desktop Icon option while installation, you will find a shortcut icon on the desktop. Double-click
the icon to launch Colasoft Capsa.
•
Launch from the quick launch menu:
Checked the option Create a Quick Launch icon in the setup wizard, you can start it by click the icon from the quick
launch menu of the task bar.
•
Launch from the Start menu:
Choose Start > All Programs >Colasoft Capsa 7.1 Enterprise> Colasoft Capsa 7.1 Enterprise to launch Colasoft
Capsa.
•
Invoke from command line:
Choose Start menu > Run > input "capsa" or "capsa.exe" > OK to invoke Colasoft Capsa.
Start Page
Visit Launching Colasoft Capsa to read how to start Colasoft Capsa.
The Start Page is the first screen you see when you launched the program, which will guide you to start an analysis project
step-by-step. It contains the following parts:
© 2010 Colasoft. All rights reserved. Colasoft®, the Colasoft logo, Capsa® are among the trademarks or registered trademarks of the company in
the United States and/or other countries. All other trademarks are property of their respective owners.
15 / 133
Getting Started
Network Analyzer
1.
Analysis Mode(See Capture and Replay)
2.
Network Profile
3.
Analysis Profile
4.
Settings Overview
These parts aim at leading you to start an analysis mission at your need. It will really save your time in finding useful analysis results
in countless analysis item (See Start A Capture to read how to start an analysis project).
Settings Overview
This section tells your settings on the parts of the left side. You can go over this part to reexamine your settings before you start an
analysis.
You can click
on the right side to read tips and introduction of each setting part.
If you just want to analyze some specific packets on the network, you should use packet filters. You can click Packet Filter Settings
to open the Filter dialog to configure filters (Read Using Filters for more details).
Start a Capture
Follow these steps to start an analysis capture:
© 2010 Colasoft. All rights reserved. Colasoft®, the Colasoft logo, Capsa® are among the trademarks or registered trademarks of the company in
the United States and/or other countries. All other trademarks are property of their respective owners.
16 / 133
Analysis Mode
Network Analyzer
1.
Analysis Mode section:
o
To analyze packets from network adapters: select the Capture analysis mode and select at least one network
adapter in the list. If you need more information about the adapters (Read Capture to know more about this
analysis mode).
o
To analyze packets from packet files: select the Replay analysis mode and click the Add button to add packet
files to be analyzed, or click Remove to delete the selected packet file from the list, or click Clear All to remove all
packet files in the list (Read Replay to know more about this analysis mode).
2.
Network Profile section: Select a network profile that meets the network environment (Read Network Profile for more
details about this section).
3.
Analysis Profile section: Read the descriptions on the right side to help you choose an analysis profile to your need
(Read Analysis Profile for more details).
4.
Settings Overview section: Displays detailed information of the above settings. You can reexamine the settings before
starting an analysis.
5.
Start Analysis: Click the start button on the bottom-right side to start an analysis project.
Tips:
•
If you just want to analyze some specific packets on the network, you should use packet filters. You can click Packet Filter
Settings to open the Filter dialog to configure filters (Read Using Filters for more details).
•
You can run up to FIVE analysis projects on the same machine at the same time.
Analysis Mode
Analysis Mode is used to choose the packet sources. Generally there are two kinds of source, network adapter and packet files.
Colasoft Capsa defines packets from network adaptors as real-time packets, packets from stored files as Replayed packets. You
can read the two analysis mode in detail via the links below:
•
Capture Analysis Mode
•
Replay Analysis Mode
In Capture analysis mode, Colasoft Capsa supports capture packets from multiple adapters. While Replay analysis mode supports
two kinds of replay speeds: original speed and accelerated speed.
Analysis Mode - Capture
You should choose Capture analysis mode when you want to analyze real-time packets on your network using one or multiple
network adapters (also known as NIC). Colasoft Capsa also supports analyze packets in saved files, read Analysis Mode - Replay
for more details.
© 2010 Colasoft. All rights reserved. Colasoft®, the Colasoft logo, Capsa® are among the trademarks or registered trademarks of the company in
the United States and/or other countries. All other trademarks are property of their respective owners.
17 / 133
Analysis Mode
Network Analyzer
The Capture analysis mode contains the following parts:
•
Network Adapter List: All available network adapters are listed here with IP address and Packets (packets received and
sent) to help you identify them. You need to check at least one adapter to start a capture. Colasoft Capsa supports capture
packets from multiple adapters.
•
Network Utilization: This displays as a graph. It refreshes when you check an adapter. It helps you to understand the
throughput of the checked adapter.
You can visit Start Page to read how to start a Capture analysis project.
Analysis Mode - Replay
You should choose this analysis mode when you want to analyze packets saved in files. To start a replay analysis project, you must
add at least one packet file in the Select Packet Files section of the Start Page:
Packet Files
You can find three buttons on the right side of this section:
•
Add: Click and choose a packet file from the file selection dialog. To replay multiple packet file, Packet replaying orders
depend on the time-stamp of the first packet of the packet files, instead of file listing order in packet file list.
•
Remove: Click to remove the highlighted packet file name from the list.
•
Clear All: Click to clear the packet file list.
Replay Speed
You can replay the packets in the files into the program at the following two kinds of speed:
•
Replay: Replay packets according their original delta time, e.g. a file saved 20 minutes of packets will take 20 minutes to
replay back into the program.
© 2010 Colasoft. All rights reserved. Colasoft®, the Colasoft logo, Capsa® are among the trademarks or registered trademarks of the company in
the United States and/or other countries. All other trademarks are property of their respective owners.
18 / 133
Main User Interface
Network Analyzer
•
Quick Replay: Replay packets without delta time intermission.
You can visit Start Page to read how to start a Replay analysis project.
Main User Interface
Ribbon
In an analysis project, you can find four tabs in the Ribbon. The tabs are described below:
•
Analysis: Contains commonly used commands and statistics for the current project.
•
System: Contains all the Local Engine Settings commands and product information.
•
Tools: Contains all the integrated and external tools and tool settings.
•
View: Contains commands of hide and show windows, and display format of IP address and MAC address.
You also find the Help icon on the top-right corner of the ribbon. You can click it to open help document to learn how to use the
program.
You can use the mouse scroll wheel to navigate from one tab to another when the mouse pointer is over the Ribbon.
Analysis Tab
The Analysis tab contains the following groups:
•
Capture: Click the Start Capture icon to start capture packets, and click the Stop Capture icon to stop capture packets.
•
Replay: Click the File icon to open the Packet File Management dialog to manage the files to be replayed.
•
Network Profile: Click to open the Network Profile Management window.
•
Profile Options: Click to open the Analysis Profile Options window.
•
Dials:
•
o
Utilization (0%): Shows network utilization per second in percentage form as a analog dial and digits.
o
pps: Shows the number of captured packets as a analog dial and digits.
Traffic History Chart (bps): Refreshes every second to display the total traffic utilization. Move mouse over the pane, you
can see the traffic number to understand the traffic trend and peak.
•
Packet Buffer:
o
Buffer Map: Shows how much of the project buffer used. The total buffer size with the percentage of already
used buffer is displayed below the Buffer Map.
o
Export: Click this button to open a dialog to save all packets in the buffer.
o
Clear: Click this button and a prompt box appears. If you are sure to clear all packets in buffer, click Sure to clear
buffer.
o
Lock: Click this button, you will only see analysis data from the time you start the capture to the time you click this
button. Colasoft Capsa, however, does not stop capturing packets. Click Lock again, you will see all analysis
statistics again.
If you click the Start Capture icon in a stopped project, all data in this project will be cleared. Need those data, you should save
them to your disk then start the capture.
System Tab
© 2010 Colasoft. All rights reserved. Colasoft®, the Colasoft logo, Capsa® are among the trademarks or registered trademarks of the company in
the United States and/or other countries. All other trademarks are property of their respective owners.
19 / 133
Main User Interface
Network Analyzer
The System tab contains the following groups:
•
Local Engine Settings: See Local Engine Settings for details.
•
Resource: See Menu button for details.
•
Product: See Menu button for details.
Tools Tab
The Tools tab contains the following groups:
•
Tools: See Tools for details.
View Tab
The View tab contains the following groups:
•
Show/Hide: Check or uncheck the Explorer, Alarm and Online Resource to show or hide it corresponding window.
•
Physical Address Show Format: Sets the display format of the physical addresses.
o
Physical Address Only: Shows the physical addresses in digits, e.g. 00:11:22:33:44:55.
o
Physical Name Only: Shows the physical addresses in alias, e.g. localhost.
o
Physical Name and Address: Shows the physical addresses in digits and their alias (if any), e.g.
[localhost]-00:11:22:33:44:55.
o
Show Physical Manufacturers: Check or uncheck to hide or show the adapter vendor where displays the MAC
address.
•
IP Address Show Format: Sets the display format of the physical addresses.
o
IP Address Only: Shows the IP addresses in digits, e.g. 192.168.1.1.
o
IP Name Only: Shows the IP addresses in alias, e.g. Localhost.
o
IP Name and Address: Shows the IP addresses in digits and alias (if any), e.g. [Localhost]-192.168.1.1.
Menu Button
The Menu button is on the top-left corner of a project window.
Click it, and the Menu appears as figure below:
© 2010 Colasoft. All rights reserved. Colasoft®, the Colasoft logo, Capsa® are among the trademarks or registered trademarks of the company in
the United States and/or other countries. All other trademarks are property of their respective owners.
20 / 133
Main User Interface
Network Analyzer
There are three quick access icons beside the Menu button
•
New Project: Click to create a new instance of the program.
•
Close Project: Click to close current project and go back to the Start Page.
•
Export Packets: Click to save all packets in the buffer to disk.
The Items of the Menu
Command
Shortcut
Description
New
Ctrl+N
Creates a new project.
Export Packets
Click to save all the packets in the buffer to disk.
Print...
Prints the current page or sets print configurations.
Local Engine
Customize the protocols, display format and report settings.
Settings
Resource
Offers product information and resources.
© 2010 Colasoft. All rights reserved. Colasoft®, the Colasoft logo, Capsa® are among the trademarks or registered trademarks of the company in
the United States and/or other countries. All other trademarks are property of their respective owners.
21 / 133
Main User Interface
Network Analyzer
Product
Provides product information.
Close
Closes the current project.
Recent Files
A list of recently opened packet files, with the most recently opened listed first. You
can select a file from this list to open it.
Options
Opens the Options dialog.
Exit
Quits Colasoft Capsa.
The sub-menu "Print..." contains the following items:
Command
Shortcut
Description
Print
Ctrl+P
Prints the current window in a format appropriate to its type.
Print Settings
Configures printer functions in the Print Setup dialog.
Print Preview
Preview the print page.
The sub-menu "Local Engine Settings" contains the following items:
Command
Shortcut
Description
Customize Protocol
Configures and customizes the network protocols.
Format
Sets the display format.
Report
Configures the web page contents of the Report.
The sub-menu "Resource" contains the following items:
Command
Shortcut
Description
Colasoft Home Page
Opens Colasoft home page.
Network Analysis Forum
Opens the technical forum, where you can get help and learn more skills on
network analysis.
Message History
Opens the Message History Management dialog.
The sub-menu "Product" contains the following items:
Command
Shortcut
License
Description
Renews your license key.
Key
Activate
Enters license key and activates Colasoft Capsa.
Register
Registers at Colasoft official website to get timely customer services and product
information.
Update
Checks new versions.
About
Opens the About dialog where you can find the version, copyright and license information
of the product.
Node Explorer Window
The Node Explorer window is on the left side which allows you to navigate through the hierarchy structure from a root to a specific
node to get analysis statistics from global to one selected node.
© 2010 Colasoft. All rights reserved. Colasoft®, the Colasoft logo, Capsa® are among the trademarks or registered trademarks of the company in
the United States and/or other countries. All other trademarks are property of their respective owners.
22 / 133
Main User Interface
Network Analyzer
The Node Explorer window contains the following components:
Nodes
Root Nodes
The hierarchy has three root nodes (figure below):
•
Physical Explorer
•
IPv4 Explorer
•
Protocol Explorer
You can expand and collapse the hierarchy by keyboard. press UP or DOWN ARROW key to move up or down on the nodes, press
LEFT ARROW key to collapse the structure till root node and press RIGHT ARROW key to expand to the sub-nodes till last node.
Traffic Direction Icon
You may notice arrow icons before each node with different directions and colors. The green arrow indicates the node is
transmitting packets, the gray arrow completed transmission. The upper arrow indicates packets transmitted in, the below one
indicates packets transmitted out from the node.
Address Type Icon
Before transmission arrows, there are icons indicating the address type of the node,
current node is broadcast address, and
specifying that the address type of the
Internet address.
Internet Address Grouping
IP addresses are grouped by countries in the node Internet Addresses of IP Explorer.
Buttons
© 2010 Colasoft. All rights reserved. Colasoft®, the Colasoft logo, Capsa® are among the trademarks or registered trademarks of the company in
the United States and/or other countries. All other trademarks are property of their respective owners.
23 / 133
Main User Interface
Network Analyzer
The Node Explorer window has the following buttons (figure below):
•
Add to Name Table
•
Add to Filter
•
Make Graph
•
Make Alarm
Add to Name Table
A node selected and this icon clickable, click it (or right click the node and choose Add to Name Table) to open a dialog to add an
alias of the node into the Name Table.
Add to Filter
A node selected and this icon clickable, click it (or right click the node and choose Generate Filter) to open a dialog to create a filter
based on the node.
Make Graph
A node selected and this icon clickable, click this icon (or right-click a node and choose Make Graph) to open a dialog to create a
graph based on the node.
Click OK in the Make Graph dialog, a prompt box appears to ask if you would like to see this graph. Click YES, you will be
redirected to the created graph in Graph tab. If you need to create another graph, click NO to continue to create graphs and click
YES to show them until you done.
Make Alarm
A node selected and this icon clickable, click it (or right click the node and choose Make Alarm) to open a dialog to create an alarm
based on the node. Successful created, a prompt box shows up to tell that the alarm created successfully, click OK to close it.
Main View
Colasoft Capsa provides a wide variety of statistics through tabs in Main View, each focusing on different missions. The table below
collects all 14 tabs and one window in analysis projects. Please note that different analysis profiles may have different tabs in the
Main View.
Dashboard
The Dashboard tab provides a wide variety of useful graphs and charts of the statistics in line,
area and bar form. You can easily get graphical statistics result from the whole network to a
specific node. This tab allows you to create graphs on your need.
Summary
Associated with your selection in Explorer, the Summary tab provides general statistic
information on the selected node.
Diagnosis
The Diagnosis tab presents the real-time diagnosis events of global network by groups of
protocol layers or security levels. Colasoft Capsa diagnoses your network with the captured
packets and lists all diagnosis events in severity levels.
Protocol
The Protocols tab displays the recorded protocols used in network transactions. The pane
under the protocol list offers the packet and conversation details if you select a protocol. You can
view the packet in the Packet pane in a new window by double-clicking a packet.
© 2010 Colasoft. All rights reserved. Colasoft®, the Colasoft logo, Capsa® are among the trademarks or registered trademarks of the company in
the United States and/or other countries. All other trademarks are property of their respective owners.
24 / 133
Main User Interface
Network Analyzer
Physical Endpoint
The Physical Endpoint tab display statistics of all MAC addresses that communicating in the
network. You can easily find out the nodes with top biggest traffic volumes and with that to check
if there is any broadcast storm or multicast storm in you network.
IP Endpoint
The IP Endpoint tab display statistics of all IP addresses that communicating in the network.
You can easily find out the nodes with top biggest traffic volumes and with that to check if there is
any broadcast storm or multicast storm in you network.
Physical Conversation
The Physical Conversation tab dynamically presents the real-time status of physical
conversations between the two nodes, the lower pane on the bottom of this tab offers the related
IP conversation, TCP conversation and UDP conversation that help you drill down to analyze the
conversations.
IP Conversation
The IP Conversation tab dynamically presents the real-time status of IP conversations between
the two nodes, the lower pane on the bottom of this tab offers the related TCP conversation and
UDP conversation that help you drill down to analyze the conversations.
TCP Conversation
The TCP Conversation tab dynamically presents the real-time status of TCP conversations
between the two nodes, the lower pane on the bottom of this tab offers the related packets,
reconstructed data flow and time sequence charts that help you drill down to analyze the
conversations.
UDP Conversation
The UDP Conversation tab dynamically presents the real-time status of UDP conversations
between the two nodes, the lower pane on the bottom of this tab offers the related packets and
reconstructed data flow that help you drill down to analyze the conversations.
Matrix
The Matrix tab graphically presents the nodes communicating in network by connecting them
with lines. The line weight indicates the volume of traffic between nodes arranged in an
extensive ellipse. You can quickly switch among global statistics and the details of specific
network nodes by switch the corresponding nodes in the Node Explorer window.
Packet
The Packet tab contains three parts: Summary Decode, Field Decode and the
Hex/ASCII/EBCDIC Decode. Here you can go down to get the original information of any
packet.
Log
Not all analysis profiles have the Log tab, just DNS Analysis, Email Analysis, FTP Analysis
and HTTP Analysis. In these tabs you can get the logs of TCP conversations, email
communications, web accesses and DNS transactions.
Report
The report tab provides 27 statistics reports from global network to a specific node. You can
choose to display them in 2D or 3D style of line chart or area chart. New feature of this report
allows you to create reports on you demand.
Alarm Explorer Window
The Alarm Explorer window displays all created alarms by catogory and provides real-time
popup alerts of anomalies to inform you to timely solve the problem.
Status Bar
You can find the Status Bar (figure below) at the bottom of an analysis project, which presents you general information of the
current project.
© 2010 Colasoft. All rights reserved. Colasoft®, the Colasoft logo, Capsa® are among the trademarks or registered trademarks of the company in
the United States and/or other countries. All other trademarks are property of their respective owners.
25 / 133
Main User Interface
Network Analyzer
Analysis Mode & Analysis Profile
The name of your selected analysis mode and analysis profile are displayed at this place. You can click it to open the Analysis
Options dialog to configure settings. See Profile Options for more details.
Selected Adapters
The number of your selected adapters displays here, by clicking it, Select Network Adapter dialog appears and allows you to
select adapters. See Choosing Network Adapter for more details.
If you check new or disable an adapter, Colasoft Capsa will clear the buffer and data to restart new capture. If necessary, you are
recommended to save the packets in buffer to your hard disk before you make any change in Select Network Adapter dialog.
Filter
Shows the filter information. Accept means the number of the Accept checkboxes you checked in the Filter dialog. The same as
Reject. You can click it to open the Filter dialog to set filters. See Using Filters for details.
Duration
Shows how long the current project has been initiated.
Accepted & Dropped Packets
Accepted number means Colasoft Capsa has accepted those packets and analyzed them.
Dropped number means those packets are failed to meet the filter criteria and are not analyzed by the program.
Button and Menu Tips
Mouse moved over a button of the Ribbon or item in the Menu, the tip of the focused item shows in the status bar. By default it
shows Ready here.
© 2010 Colasoft. All rights reserved. Colasoft®, the Colasoft logo, Capsa® are among the trademarks or registered trademarks of the company in
the United States and/or other countries. All other trademarks are property of their respective owners.
26 / 133
Choosing Network Adapter
Network Analyzer
Alarm Notification Area
An Alarm icon and three counters of triggered alarms show on the right of the Status Bar. You can click the Alarm Explorer button
to open the Alarm Explorer window, see Alarm Explorer Window for more details.
Choosing Network Adapter
Colasoft Capsa captures packets from adapters of your machine. If you want to start a Capture analysis project, you need to choose
at least one adapter from the Select Network Adapter list.
You can open the Select Network Adapter dialog through the following:
•
Click the Network Adapter icon on the Analysis tab of the Ribbon (figure below).
Change source adapters during a project will restart the capture.
The Select Network Adapter dialog appears as follows:
© 2010 Colasoft. All rights reserved. Colasoft®, the Colasoft logo, Capsa® are among the trademarks or registered trademarks of the company in
the United States and/or other countries. All other trademarks are property of their respective owners.
27 / 133
Using Filters
Network Analyzer
Colasoft Capsa supports Ethernet Card and multiple adapters. You can analyze and monitor network from more than one adapters.
The Select Network Adapter dialog contains the following two parts:
•
Network Adapter List
Colasoft Capsa identifies all adapters in your machine and reads information: Name, IP address and speed, etc. of all
adapters. Also it counts and works out packet number, byte, pps, bps and utilization of the selected adapter.
•
Utilization of the selected adapter
On selecting an adapter, the Utilization of the selected adapter graph refreshes every second to display the adapter's
traffic utilization. Move mouse over the pane, you can check the adapter's traffic to help to understand the traffic trend and
peak.
Using Filters
If no filter created, Colasoft Capsa will capture and analyze all the packets transmitting through your adapter. Thus a filter is an
important way to filter out those packets you are not interested in.
A filter enabled, Colasoft Capsa will capture packets matching with the filter's criteria but drop those failed. You are able to save you
time on finding useful data of network anomalies or attacks among countless items.
You can open the Filter dialog through the following:
•
On the Start Page: Click Packet Filter Settings in the Settings Overview section to open the Filter dialog.
•
In an analysis project: click the Packet Filter icon on the Packet Capture group of the Analysis tab of the Ribbon
(figure below).
© 2010 Colasoft. All rights reserved. Colasoft®, the Colasoft logo, Capsa® are among the trademarks or registered trademarks of the company in
the United States and/or other countries. All other trademarks are property of their respective owners.
28 / 133
Using Filters
Network Analyzer
The Filter dialog appears as follows:
The Filter dialog is divided into three parts:
•
Filter list
•
Filter Flow-chart
•
Buttons
Filter list
There are two checkboxes in every filter item. If you need to accept a kind of packets, check Accept. Otherwise, check Reject. You
may also check multiple boxes to define packets capturing range.
Double-click any filter item in the list to open the Packet Filter dialog to edit the filter. In the Packet Filter dialog, you may change
its settings in Simple Filter tab and Advanced Filter tab.
Filter flow-chart
© 2010 Colasoft. All rights reserved. Colasoft®, the Colasoft logo, Capsa® are among the trademarks or registered trademarks of the company in
the United States and/or other countries. All other trademarks are property of their respective owners.
29 / 133
Using Filters
Network Analyzer
The Filter flow-chart refreshes when you make any change on the left pane and shows how the packets are processed when
Colasoft Capsa captures them. Packets match Accept condition will be accepted and passed on to the next stage; packets match
Reject condition will be dropped.
Buttons
You can find the following buttons on the bottom of this dialog. All buttons are described below:
•
Add: Click to add a new filter.
•
Modify: Click to open the Packet Filter dialog to edit the selected filter's conditions.
•
Delete: Click to delete the selected filter.
•
Import...: Click to reload saved filters in an *.cscpfit file into the project. When an filter file imported, all the filters in the list
will be replaced.
•
Export...: Click to save all the filters in the list to an *.cscpfit file.
•
Reset Default: Click to reset the filter list. All the filters you created will be lost and the filters modified be reset as well.
Simple Filters
The Simple Filter tab allows you to create simple filters by address, port and/or protocol in a single filter. When multiple parameters
set, they are connected by logical And statements. That is, packets must match all of the conditions of the filter to pass on to the
next step.
© 2010 Colasoft. All rights reserved. Colasoft®, the Colasoft logo, Capsa® are among the trademarks or registered trademarks of the company in
the United States and/or other countries. All other trademarks are property of their respective owners.
30 / 133
Using Filters
Network Analyzer
You can also see the defined simple filter in Advanced Filter tab.
In order to capture precise packets, you can define packet transmit direction (address 1 -> address 2, address 2 -> address 1 and
address 1 <-> address 2) in IP address rule, MAC address rule and port rule. Simple filter lets you combine freely among address,
port and protocol and define filter name and filter color for your customized attentions.
Filter Conditions
You can use three types of conditions to create a filter:
•
Address
•
Port
•
Protocol
Address filter
You can set an address filter by physical address, IP address, IP range and IP subnet. To define an address filter, check the
checkbox of Address filter first, select an address type from the upper combo box of Address1, then input an address into the lower
combo box or select from the Name Table. Click the
icon to get references if you are not familiar with address formats.
The combo box of Direction is for you to specify the send/receive relationship between the two addresses. You should select Both
directions to match all packets going in either direction between address 1 and address 2, otherwise you could instead match only
© 2010 Colasoft. All rights reserved. Colasoft®, the Colasoft logo, Capsa® are among the trademarks or registered trademarks of the company in
the United States and/or other countries. All other trademarks are property of their respective owners.
31 / 133
Using Filters
Network Analyzer
traffic going from address 1 to address 2, or match only traffic going the other direction.
Similar as Address1, you must select an address type and enter a valid address in Address2, or simply choose Any Address. You
can select an address from the Name Table for both Address1 and Address2 by clicking the
icon. Below is an example of
address filter.
Please input address value as Address Format below:
Port filter
To define a port filter, check the Port filter checkbox, select a port type and input parameters with correct format in Port 1. Notice
that if you select multiple ports, the ports you enter must be separated with semicolon. Other settings are similar as the Address
filter section.
Please input port value as Address Format below:
Protocol Filter
To define a protocol filter, check the Protocol filter checkbox, click the Select button to open the Protocol Filter dialog, find
protocols by the first alphabet of the protocol name, and then select protocols by checking the corresponding check box and click
OK to confirm your selection. The selected protocols are listed in the pane at the bottom of the Simple Filter page; you can delete a
protocol item from the list with the Remove button.
© 2010 Colasoft. All rights reserved. Colasoft®, the Colasoft logo, Capsa® are among the trademarks or registered trademarks of the company in
the United States and/or other countries. All other trademarks are property of their respective owners.
32 / 133
Using Filters
Network Analyzer
\
Advanced Filters
In addition to make simple filters by address, port and protocol, you can set packet size, packet value, packet pattern and logical
relations as filter parameters to create advanced filters.
The filters you created will be arranged in a filter relation map. The map shows you the logical relations among the conditions from
adapter to Colasoft Capsa project.
For advanced filters have more filter conditions than simple filters, simple filters can be converted to advanced filters. Some filter
conditions, however, will be lost if you convert an advanced filter to a simple filter.
For example, you can create an advanced filter to monitor BT downloading in a network segment as figure below:
© 2010 Colasoft. All rights reserved. Colasoft®, the Colasoft logo, Capsa® are among the trademarks or registered trademarks of the company in
the United States and/or other countries. All other trademarks are property of their respective owners.
33 / 133
Using Filters
Network Analyzer
This filter contains three conditions:
•
First condition: Match a network segment "192.168.0.1 - 192.168.0.200".
•
Second condition: Exclude an IP address "192.168.0.65".
•
Third condition: Match one of packet patterns: (1) Content: Type "Hex", "Pattern" value
"13426974546f7272656e742020726f746f63616c" or (2) "Port Range" from 6881 - 6889.
Following the process of the figure below, Colasoft Capsa compares against captured packets with the conditions. If a packet
matches the criteria, it is recognized as BT downloading packet.
© 2010 Colasoft. All rights reserved. Colasoft®, the Colasoft logo, Capsa® are among the trademarks or registered trademarks of the company in
the United States and/or other countries. All other trademarks are property of their respective owners.
34 / 133
Network Profile
Network Analyzer
Toolbar
The Toolbar contains the following icons:
And
Both the two conditions connected by "And" have to be satisfied.
Or
Only one of the conditions connected by "Or" has to be satisfied.
Not
All packets except those matching the criteria inside this logical Not filter will now be passed to the next
stage.
Edit
Open dialog to modify the selected parameter.
Delete
Delete the selected parameter.
Show Image
Show filter icon for each filter item.
Show
Show details of each filter item.
Comment
Filter Conditions
Advanced filters let you set precise parameters so that Colasoft Capsa can almost capture any packet you need. For example, you
can create advanced filters as follows:
•
Value
•
Size
•
Pattern
Network Profile
Network Profile is designed to store general properties of different networks. Different network segments may have their own
environment. Colasoft Capsa lets you save the most common-used properties, e.g. bandwidth, network structure, name table and
alarms.
When you installed Colasoft Capsa on a laptop and need to move it between different network segments, you are recommended to
save the network properties in a network profile and recall the profile when you come to the network again.
You can open the Network Profile dialog through the following:
•
On Start Page: Double-click (or right-click a network profile and choose Add, Edit or Duplicate in the context menu) in the
Network Profile section to open the Network Profile Management dialog which collects all the saved network profiles.
You can use the buttons on the right side of the Network Profile Management dialog to add a new, edit the selected
network profile and delete the selected network profile.
•
In an analysis project: Click any icon on the Network Profile group of the Analysis tab of the Ribbon (figure below).
© 2010 Colasoft. All rights reserved. Colasoft®, the Colasoft logo, Capsa® are among the trademarks or registered trademarks of the company in
the United States and/or other countries. All other trademarks are property of their respective owners.
35 / 133
Network Profile
Network Analyzer
The Network Profile dialog contains the following items:
•
General Settings
•
Network Group
•
Name Table
•
Alarm Settings
Context Menu
Right-clicking a network profile, you will see a context menu containing the following items:
•
New: Click to create a new network profile.
•
Edit: Click to modify the highlighted network profile.
•
Duplicate: Click to copy a duplication of the highlighted network profile.
•
Delete: Click to delete the highlighted network profile.
General Settings
You can open the General of the Network Profile dialog through the following:
•
On Start Page: Double-click a network profile in the Network Profile section to open the Profile Management dialog. You
will see the General Settings on this dialog.
•
In an analysis project: Click the General icon on the Network Profile group of the Analysis tab of the Ribbon (figure
below).
The General tab appears as follows:
© 2010 Colasoft. All rights reserved. Colasoft®, the Colasoft logo, Capsa® are among the trademarks or registered trademarks of the company in
the United States and/or other countries. All other trademarks are property of their respective owners.
36 / 133
Network Profile
Network Analyzer
The General Settings contains the following items:
•
Profile Name: The name of the current network profile.
•
Profile Description: The short description of the current network profile used to identification.
•
Bandwidth: The correct bandwidth of the network segment.
The bandwidth is very important. It is the benchmark of calculating the network utilization.
Network Group
You can open the Network Group of the Network Profile dialog through the following:
•
On Start Page: Double-click a network profile in the Network Profile section to open the Profile Management dialog.
You will find Network Group Settings on this dialog.
•
In an analysis project: Click the General icon on the Network Profile group of the Analysis tab of the Ribbon (figure
below).
© 2010 Colasoft. All rights reserved. Colasoft®, the Colasoft logo, Capsa® are among the trademarks or registered trademarks of the company in
the United States and/or other countries. All other trademarks are property of their respective owners.
37 / 133
Network Profile
Network Analyzer
The Network Group tab appears as follows:
The Network Group is used to customize your network. You can divide IP addresses and MAC addresses of your network into
different groups. Thus you save your time to lock down the troubled host in a group.
Based on your network, all IP nodes and MAC nodes can be defined into different groups that you will identify local traffic from
internet traffic and broadcast traffic from multicast traffic with ease. For example, you can divide IP address groups by department
names.
Colasoft Capsa automatically generates one default profile, which has the same result as you click Auto Detect and Colasoft
Capsa will map out a default structure of your network based on IP addresses and MAC addresses.
© 2010 Colasoft. All rights reserved. Colasoft®, the Colasoft logo, Capsa® are among the trademarks or registered trademarks of the company in
the United States and/or other countries. All other trademarks are property of their respective owners.
38 / 133
Network Profile
Network Analyzer
Name Table
You can open the Name Table tab of the Network Profile dialog through any of the following:
•
On Start Page: Double-click a network profile in the Network Profile section to open the Profile Management dialog.
You will find Name Table on this dialog.
•
In an analysis project: Click the Name Table icon on the Analysis tab of the Ribbon (figure below).
The Name Table tab appears as follows:
Toolbar
•
Add...: Click to create a new alias item.
•
Modify...: Click to edit a highlighted alias item.
•
Delete: Click to delete a highlighted alias item.
•
Import...: Click to read the filters from a .csccont file or .cscntab file.
© 2010 Colasoft. All rights reserved. Colasoft®, the Colasoft logo, Capsa® are among the trademarks or registered trademarks of the company in
the United States and/or other countries. All other trademarks are property of their respective owners.
39 / 133
Network Profile
Network Analyzer
•
Export...: Click to save the filters to a .csccont file.
•
Options...: Click to set Name Table Options as follows:
Click the Options button, the Name Table Options dialog appears. Here you can choose to Enable passive name resolution or
not and Save the resolved names of IP address when exit or not and change the number how many days the unused names will
be saved (2 by default).
Add or Edit an Alias
The Name Table is used to manage alias of all the IP addresses, MAC addresses, and ports in your network.
You are allowed to select an item and click the Add to Name Table button in toolbar or right-click the item and choose Add to
Name Table to add any IP address, MAC address and port number to Name Table in any of the Node Explorer window and tabs
in the Main View.
The Add to Name Table dialog appears and you enter some letters or words to define the address (port) a label that you would like
it to be displayed other than number.
© 2010 Colasoft. All rights reserved. Colasoft®, the Colasoft logo, Capsa® are among the trademarks or registered trademarks of the company in
the United States and/or other countries. All other trademarks are property of their respective owners.
40 / 133
Network Profile
Network Analyzer
Alarm Settings
The Alarm Settings allows you to manage all the alarms that you created. You can open the Alarm settings in the Network Profile
dialog through the following ways:
•
On Start Page: Double-click a network profile in the Network Profile section to open the Profile Management dialog.
You will find Alarm Settings on this dialog.
•
In an analysis project:
o
On Ribbon: Click the Alarm icon on the Network Profile group of the Analysis tab of the Ribbon (figure below).
o
In the Alarm Explorer window: Double-click an alarm item or click
on the toolbar.
The Name Table tab appears as follows:
© 2010 Colasoft. All rights reserved. Colasoft®, the Colasoft logo, Capsa® are among the trademarks or registered trademarks of the company in
the United States and/or other countries. All other trademarks are property of their respective owners.
41 / 133
Network Profile
Network Analyzer
Buttons
•
Enable all: Click to enable all the alarms in the list.
•
Disable all: Click to disable all the alarms in the list.
•
Inv select: Click to disable the checked alarms and enable the unchecked ones in the list.
•
Properties...: Click to open the Edit Alarm dialog to modify the highlighted alarm.
•
Delete: Click to delete the highlighted alarm.
•
Import...: Click to read the alarm settings from an .clalam file.
•
Export...: Click to save the alarm settings to an .clalam file.
Save Options
Save triggered alarm records to a file are useful for your later evaluation since you may not always stay with the machine. For
example, you set up some alarms then you leave the computer. When an alarm triggered, the program saves the record to a .txt file.
You can open the text file and examine the records.
•
Save into folder: Click the folder selection button to choose a folder to save the alarm log file.
•
Prefix name: Enter a name for the log file.
© 2010 Colasoft. All rights reserved. Colasoft®, the Colasoft logo, Capsa® are among the trademarks or registered trademarks of the company in
the United States and/or other countries. All other trademarks are property of their respective owners.
42 / 133
Analysis Profile Options
Network Analyzer
Analysis Profile Options
Solution options can help you improve the efficiency of analysis, get more useful statistics and save the packets in the buffer to your
hard disk. All the settings are global that can be applied to all analysis projects.
To open the Profile Options window, do one of the following ways:
•
On Start Page: Double-click an analysis profile in Analysis Profile section to open the Modify Analysis Profile dialog
where you can modify the analysis profile. Click the Next button on the bottom-right of the dialog.
•
In an analysis project: Click any icon in the Analysis tab of the Ribbon (figure below).
The Solution Option window appears as follows:
The Profile Options window contains the following components:
•
Analysis Object: Set which objects and protocols to be analyzed and the maximum number of each object.
•
Packet Storage: Set the buffer size, buffer mode and configure how to save packets in the buffer to disk.
•
Log Settings: Customize all available log settings to get more useful log records.
© 2010 Colasoft. All rights reserved. Colasoft®, the Colasoft logo, Capsa® are among the trademarks or registered trademarks of the company in
the United States and/or other countries. All other trademarks are property of their respective owners.
43 / 133
Analysis Profile Options
Network Analyzer
•
Diagnosis Settings: Manage the thresholds of all available diagnosis events to meet your real need.
Analysis Object
The Analysis Object settings are used to customize the objects to be analyzed, e.g. protocols, IP addresses, physical addresses,
conversations and the maximum number of the objects. Properly setting these items will help to improve the performance of the
program.
Some items in the Analysis Object column are locked because they are basic analysis objects. You can uncheck the network
objects to disable the program to analyze them, e.g. remote IP address and four types of conversations.
For example, if you uncheck the Physical Conversation in the Analysis Object column, Colasoft Capsa will not analyze all
physical conversations and not provide physical conversation statistics. However, if you check the Physical Conversation in the
Analysis Object column but disable its corresponding Analysis Protocol, you will find the Physical Conversations tab in the
Main View is empty when you select a second layer protocol (such as ARP).
You can read Analysis Profile Options to learn how to open the Network Object dialog.
Packet Storage
Colasoft Capsa captures traffic on the network and stores the analyzed packets into the buffer. You will find all the packets in the
buffer on the Packet tab. Therefore, the buffer size decides how many packets you see in the Packet tab. You can set the size of
the dedicated buffer and configure to save the captured packets to packet files to disk.
© 2010 Colasoft. All rights reserved. Colasoft®, the Colasoft logo, Capsa® are among the trademarks or registered trademarks of the company in
the United States and/or other countries. All other trademarks are property of their respective owners.
44 / 133
Analysis Profile Options
Network Analyzer
You can read Profile Options to learn how to open the Packet Storage dialog.
This page contains the following two parts:
Packet Buffer
Packet Buffer has the following two settings:
Packet buffer size
By default the packet buffer size is 16 MB. You can change the value, but you should take the size of your system memory into
consideration. If you need to save all the packets in buffer, just click Export button in Packet Buffer group of the Ribbon or click
the Export button in Packet tab.
You are recommended to set the packet buffer size less than half of your computer's physical memory. You could start at 64 MB
then enlarge it if necessary.
Packet buffer mode
When the captured packets fill up the packet buffer you have specified, Colasoft Capsa will do one of the followings:
•
Discard oldest packets (circular buffer)
It is recommended to discard the oldest packets when the packet buffer is full, Colasoft Capsa will store new packets and
© 2010 Colasoft. All rights reserved. Colasoft®, the Colasoft logo, Capsa® are among the trademarks or registered trademarks of the company in
the United States and/or other countries. All other trademarks are property of their respective owners.
45 / 133
Analysis Profile Options
Network Analyzer
keep the packet buffer up to date.
•
Discard new packets after analysis
All new captured packets will be discarded after being analyzed and will not be saved to the packet buffer.
•
Discard all old packets
Colasoft Capsa will empty the packet buffer and then append new packets to it.
•
Stop capture
Stop the current capture.
Save to Disk
This part has the following settings:
•
Enable auto packet saving: If checked, Colasoft Capsa will automatically save packets to a single file or multiple split
files as your configurations.
•
Limit each packet to: If enabled, only the first configured number of bytes of a packet will be stored to the packet file.
•
Single file
All packets are saved to one file.
o
File name
Specifies a name for the packet file. Click the folder selection button behind the textbox to open a dialog for
defining a save path for the packet file.
•
Multiple files
Packets are saved to the files split by time or size. To reduce the total size, you may choose to only keep the most recent
files.
o
Save into folder
Specifies a folder name and the save path for all files. Click the folder selection button on the right to open a
dialog for defining a save path for the folder.
o
Prefix name
The portion of a file name to the left of the period separator. Colasoft Capsa allows very long file names. Click the
button to view an example of the base file name.
o
Split file every
Chooses a rule for splitting the file if the file size is too big. You can split files by time or file size - months, days,
hours, minutes, KB, MB and GB.
o
Keep all files
Saves all split files in the defined save path.
o
Keep the latest
Specifies the number of most recent files for saving.
Log Settings
Colasoft Capsa can analyze and log the application layer traffic, e.g. DNS, HTTP, Email, FTP traffics and also monitors MSN and
Yahoo Messenger chatting messages. This page allows you to set to get more useful logs of these traffics and save the logs to disk.
You can read Analysis Profile Options to learn how to open the Log settings dialog.
© 2010 Colasoft. All rights reserved. Colasoft®, the Colasoft logo, Capsa® are among the trademarks or registered trademarks of the company in
the United States and/or other countries. All other trademarks are property of their respective owners.
46 / 133
Analysis Profile Options
Network Analyzer
This page contains two panes:
•
The left pane: list all the log types from the loaded analysis modules of the current analysis profile. You can uncheck to
disable a certain type of log.
•
The right pane: display the settings of the highlighted log type in the left pane.
Different analysis profiles have different log types. Because analysis profiles use different analysis modules, and different modules
have their own log functionalities. In total, Colasoft Capsa has the following log types:
•
DNS Log
•
Email Log
•
FTP Log
•
HTTP Log
•
MSN Log
•
Yahoo Messenger Log
Diagnosis Settings
This page lists all available diagnosis events of the loaded analysis module of the current analysis project. You can read the
Description and the Possible Reason of an event in the right pane to help you solve a network problem when you selected any
diagnosis event in the events list. The settings: Color, Severity Level and some other parameters (if applicable) can be
© 2010 Colasoft. All rights reserved. Colasoft®, the Colasoft logo, Capsa® are among the trademarks or registered trademarks of the company in
the United States and/or other countries. All other trademarks are property of their respective owners.
47 / 133
Analysis Profile Options
Network Analyzer
customized.
You can read Profile Options to learn how to open the Diagnosis settings window.
All diagnosis events are hierarchical grouped in protocol layers: Application Layer, Transport Layer, Network Layer and Data Link
Layer. You can easily find which layer a network problem comes from.
Diagnosis Events List
In left pane, what diagnosis event items you see depend on what analysis modules loaded in the current project. You can uncheck a
diagnosis event item to disable it and you will not see this diagnosis event in the Diagnosis tab of the Main View.
Settings
You can highlight a diagnosis item on the left pane and customize its settings on the top-right pane. Different diagnosis items have
different settings. The general settings are listed below:
•
Type: The diagnosis item belongs to one of the following diagnosis type: Fault, Security and Performance.
•
Color: To set the font color of the diagnosis item in the Diagnosis tab.
•
Intensity: To set the level of the current diagnosis item.
Information
Click a diagnosis item; you will see its Description and Possible Reason on the bottom-right pane to get more information about
© 2010 Colasoft. All rights reserved. Colasoft®, the Colasoft logo, Capsa® are among the trademarks or registered trademarks of the company in
the United States and/or other countries. All other trademarks are property of their respective owners.
48 / 133
Local Engine Settings
Network Analyzer
the selected diagnosis item.
Toolbar
There are seven buttons on the bottom of this window to help you manage all your diagnosis events.
•
Enable All: Click to check all the diagnosis item in the list.
•
Disable All: Click to uncheck all the diagnosis item in the list.
•
Invert Selections: Click to disable the checked diagnosis item and enable the unchecked ones in the list.
•
Reset: Click to reset the selection in the list.
•
Import: Click to read the diagnosis settings from an .cscdiag file.
•
Export: Click to save the diagnosis settings to an .cscdiag file.
Local Engine Settings
Local Engine settings are global. It contains three parts:
•
Customize Protocols
•
Format
•
Report
You can find these three items at the following places:
•
Menu: Click the Menu button. You will find the first three items under Local Engine Settings menu item.
•
Analysis project: The Local Engine Settings group of the System tab of the Ribbon (figure below).
Customize Protocol
Customize Protocol is used to manage all pre-specified protocols as well as your customized protocols. Colasoft Capsa organizes
them in clean order, so that you can locate any protocol easily. You can customize protocols and create rules to recognize new
protocols in this window.
To open the Customize Protocol window, do one of the following:
•
Click the Customize Protocol icon on the top of the Start Page.
•
Click the Customize Protocol icon in the System tab of the Ribbon.
•
Click the Menu button, choose Local Engine Settings > Customize Protocol.
The Customize Protocol window shows as follows:
© 2010 Colasoft. All rights reserved. Colasoft®, the Colasoft logo, Capsa® are among the trademarks or registered trademarks of the company in
the United States and/or other countries. All other trademarks are property of their respective owners.
49 / 133
Local Engine Settings
Network Analyzer
Protocol List
You can click any of the column headers to rearrange the protocols in descending order or in ascending order.
You can double-click a protocol item to customize it. You are not allowed to modify the color of the pre-specified protocols.
Display Filter
There are two protocol filters on the top for you to locate a certain type of protocol.
•
Select protocol: Displays the selected type of protocol in the list and hide the rest, e.g. Ethernet II, IP, TCP and UDP.
•
Filter display: Displays the protocols by their status, e.g. All Protocols, Built-in Protocols, Customized Protocols and
Modified Protocols.
Buttons
•
Add...: Click to create a new rule to recognize a new protocol.
•
Modify...: Click to edit a highlighted protocol item.
•
Delete: Click to delete a highlighted protocol item.
•
Import...: Click to read the protocol list from an .cscpro file.
•
Export...: Click to save the protocol list to an .cscpro file.
•
Default: Click to reset the protocol list. All your create items will be deleted and buildin protocols will be reset. You should
be careful of clicking this button.
© 2010 Colasoft. All rights reserved. Colasoft®, the Colasoft logo, Capsa® are among the trademarks or registered trademarks of the company in
the United States and/or other countries. All other trademarks are property of their respective owners.
50 / 133
Local Engine Settings
Network Analyzer
You cannot delete any built-in protocols.
The Add New Protocol dialog and the Modify Protocol dialog are as following figures:
Display Format
The Display Format pane lets you customize the format of decimals and measures. You can define the formats for data display,
including decimal places of normal number, decimal places of percentage, byte format, bit format, bytes per second format and bits
per second format.
© 2010 Colasoft. All rights reserved. Colasoft®, the Colasoft logo, Capsa® are among the trademarks or registered trademarks of the company in
the United States and/or other countries. All other trademarks are property of their respective owners.
51 / 133
Local Engine Settings
Network Analyzer
The options are described below:
Precision after decimal
The display precision of a number. You can customize the decimal places though the thousandth in default.
Precision behind percentage decimal
The display precision of a percentage. You can customize the decimal places though the thousandth in default. Byte measure By
default, Colasoft Capsa displays packets sizes and the traffic in an appropriate byte unit, such as B, KB, MB, GB, or TB. Which unit
is selected depends on how large each packet or the current traffic is. Users can define the unit from the combo box.
Byte measure
By default, Colasoft Capsa displays packets sizes and the traffic in an appropriate byte unit, such as B, KB, MB, GB, or TB. Which
unit is selected depends on how large each packet or the current traffic is. Users can define the unit from the combo box.
Bit measure
By default, Colasoft Capsa displays packets sizes and the traffic in an appropriate bit unit, such as b, kb, Mb, Gb or Tb. Which unit
is selected depends on how large each packet or the current traffic is. Users can define the unit from the combo box.
Byte/second measure
Rate at which bits of information are transmitted. Colasoft Capsa displays the rate of information in an appropriate unit, such as Bps,
© 2010 Colasoft. All rights reserved. Colasoft®, the Colasoft logo, Capsa® are among the trademarks or registered trademarks of the company in
the United States and/or other countries. All other trademarks are property of their respective owners.
52 / 133
Local Engine Settings
Network Analyzer
KBps, MBps, GBps or TBps. Users can define a display format from the combo box.
Bit/second measure
Rate at which bits of information are transmitted. Colasoft Capsa displays the rate of information in an appropriate unit, such as bps,
Kbps, Mbps, Gbps or Tbps. Users can define a display format from the combo box.
Default
Click it to reset all the settings in this pane.
Report Settings
You can configure the following options listed below in this pane and you can check out the setting results in the Report tab.
Company logo
Enable this item (disabled by default), select a picture file on your machine or shared network folder as the logo of your company,
which will be displayed on the top right corner of Report tab.
Company name
Enable this item (disabled by default); enter your company name into the textbox. It will be displayed on the top left corner of Report
tab.
© 2010 Colasoft. All rights reserved. Colasoft®, the Colasoft logo, Capsa® are among the trademarks or registered trademarks of the company in
the United States and/or other countries. All other trademarks are property of their respective owners.
53 / 133
System Options
Network Analyzer
Customize Prefix
Enable this item (disabled by default), enter a name into the textbox, which will be added before all report title as a prefix. You can
find it on the top left corner of a report in title area.
Customize Author
Enable this item (disabled by default), enter the name of whoever generate the reports, which will be displayed on the bottom right
corner of reports.
Display timestamp
This item enabled, the time when a report is generated will be displayed on the top left corner of the report. This item is disabled by
default with nothing shown in that area.
Maximum entry in Top X
Specifying this item, you can decide how many items will be listed in Top X reports, 10 items by default.
You can only use number from 1 to 30.
System Options
To open the System Options dialog, do any of the following:
•
Click the System Options icon on the top of the Start Page.
•
Click the System Options button in the System tab of the Ribbon.
•
Click the Menu button and click Options on the bottom-right corner of the menu.
The System Options dialog appears as below:
© 2010 Colasoft. All rights reserved. Colasoft®, the Colasoft logo, Capsa® are among the trademarks or registered trademarks of the company in
the United States and/or other countries. All other trademarks are property of their respective owners.
54 / 133
System Options
Network Analyzer
The following table lists all four items in the left pane of the System Options dialog:
Item
Description
General Settings
General settings for window size, windows suspending and display, etc.
Decoder Settings
All pre-specified decoders are listed here which are designed modularity. You can decide to enable or
disable whichever decoder to meet your specific need. All decoders are enabled by default.
You can read the detailed description of each item via links above.
General Settings
You can configure the listed settings below in the right pane:
© 2010 Colasoft. All rights reserved. Colasoft®, the Colasoft logo, Capsa® are among the trademarks or registered trademarks of the company in
the United States and/or other countries. All other trademarks are property of their respective owners.
55 / 133
System Options
Network Analyzer
Always maximize the window when starting the program
If unchecked, Colasoft Capsa will remember the window size of the last time you run the program.
Disable windows from suspending during capture
The power option schema in your system control panel will be ignored. You cannot standby or hibernate your system without stop
Capsa from capturing.
Disable list smooth scrolling
Instant scrolling will be enabled in effect if you check this option.
Show Save Packet when exiting program
Checked, the program will pop up a dialog to remind you to save the packets in the buffer.
Show Online Resource window on Startup
Checked, the Online Resource window will be displayed on the right side of the project which receives official resource from
Colasoft Capsa.
Default
Click it to reset all settings in this pane.
© 2010 Colasoft. All rights reserved. Colasoft®, the Colasoft logo, Capsa® are among the trademarks or registered trademarks of the company in
the United States and/or other countries. All other trademarks are property of their respective owners.
56 / 133
Dashboard Tab
Network Analyzer
Decoder Settings
In this pane you will find all predefined decoding modules of Colasoft Capsa. All docoders are modularized and you can decide to
enable a decoder or enable one in this page. By default, all decoders are enabled.
Buttons
•
Enable All: Click to enable all decoders.
•
Disable All: Click to disable all decoders.
Dashboard Tab
The Dashboard tab is a new feature of Colasoft Capsa (visible only when the analysis profile root in the Node Explorer window
selected). It provides a great many of statistic graphs from global network to a specific node. You are able to as well create almost
any kind of graph based on any MAC address, IP address and protocol, etc. With these graphs, you can easily find out anomalies of
the network and get useful statistics.
© 2010 Colasoft. All rights reserved. Colasoft®, the Colasoft logo, Capsa® are among the trademarks or registered trademarks of the company in
the United States and/or other countries. All other trademarks are property of their respective owners.
57 / 133
Dashboard Tab
Network Analyzer
The Dashboard tab contains the following components:
Toolbar
By default, there are five graphs provided. Graphs take a lot of space and too many graphs in a single page will make the tab very
crowded and hard to view. Therefore, Colasoft Capsa allows you to organize graphs in different tabs to get a better view.
•
New Tab: Click to create a new graph tab.
•
Rename Tab: Click to give the selected graph tab a new name.
•
Remove Tab: Click to delete the selected graph tab.
© 2010 Colasoft. All rights reserved. Colasoft®, the Colasoft logo, Capsa® are among the trademarks or registered trademarks of the company in
the United States and/or other countries. All other trademarks are property of their respective owners.
58 / 133
Dashboard Tab
Network Analyzer
•
Reset Default: Click to reset the Dashboard tab. Be careful of click this button that all of your created graphs in the
Dashboard will be deleted.
Context Menu
The pop-up menu contains the following items:
•
Pause Refresh: Click to pause graph refresh.
•
3D View: Click to display the graph in 3D style.
•
Legend Box: Click to set legend display options.
•
Line Chart: Click to display the graph in line style.
•
Bar Chart: Click to display the graph in bar style.
•
Pie Chart: Click to display the graph in pie style.
•
Titles: Click to set titles display options.
•
Indicatrix: Click to show a horizontal line which moves with mouse pointer to compare values.
•
Top Number: Click to set the statistic item number.
•
Sampling Values: Click to set the statistic value type: Cumulative Value and Last Second Value.
•
Refresh Interval: Click to set graph refresh interval.
•
Save Graph...: Click to save the current graph to disk.
The display items are described as figure below:
Change Graph Position
Graph positions are changeable. You can click and drag the head of a graph to rearrange its position go get a better view.
You can read Creating Graphs to learn how to create a graph in the Dashboard tab.
Creating Graphs
Colasoft Capsa allows you to create graphs from almost any place in the program. For example, there is a machine (IP:
192.168.5.24) and you need a graph of its total traffic (by byte).
You can create a new graph by following ways:
•
In Node Explorer window
Click
on the toolbar or right-click on any node to create a new graph.
© 2010 Colasoft. All rights reserved. Colasoft®, the Colasoft logo, Capsa® are among the trademarks or registered trademarks of the company in
the United States and/or other countries. All other trademarks are property of their respective owners.
59 / 133
Dashboard Tab
Network Analyzer
•
In Dashboard tab
Click
•
on the top-right corner of every graph title to create a new graph.
In other statistic tabs
Right-click any item and choose Make Graph... from the pop-up menu to create a new graph.
•
In Context Menu
Choose Make Graph... from the pop-up menu to create a new graph.
Create a New Graph Tab
There is already a Default sub-tab on the Dashboard Tab which provides five commonly used graphs. To get a better view of the
new created graphs, you can create a new sub-tab to organize them. Follow the steps below to create a new graph tab:
If you do not see the Dashboard tab in the Main View, go the analysis profile root in the Node Explorer window. Then you will see
the Dashboard tab.
Click New Tab button in the toolbar to add a new tab. Then enter a name for the new tab.
Locate the Node
You may locate the IP address: 192.168.5.24 at many places, Node Explorer window, tabs in the Main View. For example, we
locate the node in the IP Explorer of Node Explorer window. Right-click on 192.168.5.24 and choose Make Graph... item in the
pop-up menu.
Configure Graph Settings
The Make Graph dialog appears as follows:
© 2010 Colasoft. All rights reserved. Colasoft®, the Colasoft logo, Capsa® are among the trademarks or registered trademarks of the company in
the United States and/or other countries. All other trademarks are property of their respective owners.
60 / 133
Dashboard Tab
Network Analyzer
The Make Graph dialog contains the following items and the items you should set:
•
Graph Name: The name of the graph. The name can be automatically generated; you can enter a new name as well.
•
Graph Object: Specifies that the new graph is based on this object (192.168.5.24).
•
Dashboard Tab: Specifies which tab the new graph will be places. Click to choose the tab name we create in step 1.
•
Statistics Counter: Lists all available statistic counters. Check the Total item in the Traffic group.
•
Counter Unit: The measurement of the calculation. Click to select Byte.
Then Click OK to finish the settings.
Now you can see the new graph in the Dashboard tab.
Graph Types
Colasoft Capsa provides a wide range of statistic counters for creating graphs. You can find all available graph types below:
•
Sample Chart
•
Top Chart
Sample Chart
A group of general graphs that can be used to graphing a specific node or the whole network.
© 2010 Colasoft. All rights reserved. Colasoft®, the Colasoft logo, Capsa® are among the trademarks or registered trademarks of the company in
the United States and/or other countries. All other trademarks are property of their respective owners.
61 / 133
Summary Tab
Network Analyzer
•
Alarm: Security, Performance and Fault
•
Traffic: Total, Broadcast, Multicast, Drop, Average Size and Utilization
•
Packet Size Distribution:<=64, 65-127, 128-255, 246-511, 512-1023, 1024-1517 and >=1518
•
Address: Physical Address Count, IP Address Count, Local IP Address Count and Remote IP Address Count
•
Protocol: Total Protocols, Datalink Protocols, Network Protocols, Transport Protocols, Session Protocols, Persentation
Protocols and Application Protocols
•
Flow: Physical Conversation, IP Conversation, TCP Conversation and UDP Conversation
•
TCP:TCP SYN Sent, TCP SYNACK Sent, TCP FIN Sent and TCP Reset Sent
•
DNS Analysis: DNS Query and DNS Response
•
Email Analysis: SMTP Connection and POP3 Connection
•
FTP Analysis: FTP Upload and FTP Download
•
HTTP Analysis: HTTP Request, HTTP Connection and HTTP Server
Top Chart
A group of graphs that can be used to graphing the first ten biggest value of a statistic item.
•
Top Physical Group Total Traffic
•
Top Physical Group Traffic Received
•
Top Physical Group Traffic Sent
•
Top IP Group Total Traffic
•
Top IP Group Traffic Received
•
Top IP Group Traffic Sent
•
Top Physical Address Total Traffic
•
Top Physical Address Traffic Received
•
Top Physical Address Traffic Sent
•
Top IP Address Total Traffic
•
Top Local IP Address Total Traffic
•
Top Remote IP Address Total Traffic
•
Top IP Address Traffic Received
•
Top IP Address Traffic Sent
•
Top Local IP Address Traffic Received
•
Top Local IP Address Traffic Sent
•
Top Remote IP Address Traffic Received
•
Top Remote IP Address Traffic Sent
•
Top Application Protocols
•
Packet Size Distribution
Some graph items will not applied to all the nodes you selected.
Summary Tab
Associated with your selection in the Node Explorer window, the Summary tab provides general statistics on the selected node.
When you select the root node, you can get the statistics on your global network; if you select a specific node, it will present the
particular information of the chosen node. The Summary tab is described as follows:
© 2010 Colasoft. All rights reserved. Colasoft®, the Colasoft logo, Capsa® are among the trademarks or registered trademarks of the company in
the United States and/or other countries. All other trademarks are property of their respective owners.
62 / 133
Summary Tab
Network Analyzer
Refresh
This tab refreshes every ten seconds by default. You can click the refresh icon (on the top-left corner of this tab) to refresh or to set
refresh options. You can either choose Manual Refresh or set an automatic refresh time.
Statistic Items
By selection a node in Node Explorer window, the Summary tab refreshes automatically. Different selections result in different
statistic items. The following table lists all the statistic items you will see in the Summary tab.
Item
Description
Abnormal Causes
Alarm
Statistics on the number of the three types
Anomalies occurred: check the Alarm Explorer
of triggered alarms.
window for details.
Traffic
Statistics on throughput of total, broadcast
•
and multicast traffic of a node or the whole
network.
Over 50% of total traffic utilization: network
may be overloaded.
•
Over 20% of broadcast or multicast traffic
utilization: broadcast/multicast storm and
© 2010 Colasoft. All rights reserved. Colasoft®, the Colasoft logo, Capsa® are among the trademarks or registered trademarks of the company in
the United States and/or other countries. All other trademarks are property of their respective owners.
63 / 133
Diagnosis Tab
Network Analyzer
ARP attack.
Packet Size
Statistics on the packet sizes of captured
Large portion of traffic at <=64 or >=1518: fragment
Distribution
packets.
attack or flood attack.
Address
Statistics on the number of MAC address
Abnormal too big number: MAC flooding attack, TCP
IP address, local address and remote
flooding attack, etc.
address.
Protocol
Statistics on the number of protocols used
in communication.
Flow
Statistics on physical, IP, TCP and UDP
flows.
TCP
Statistics on TCP connection packets.
Large number of TCP SYN packets: port scanning
(TCP SYN flooding attack).
DNS Analysis
Statistics on DNS queries' request and
response.
Email Analysis
Statistics on SMTP and POP3 connection.
FTP Analysis
Statistics on FTP uploading and
Large number of connections: Worm
downloading.
HTTP Analysis
Statistics on web browsing communication.
Diagnosis Tab
The Diagnosis tab presents the real-time diagnosis events of global network by grouping them to protocol layers or security level.
Colasoft Capsa diagnoses your network from the captured packets and lists all diagnosis events. In this tab, all diagnosis events
are sorted by network layers. You can get more information on happening IP address, MAC address, detailed descriptions and
possible reasons for the highlighted diagnosis event.
© 2010 Colasoft. All rights reserved. Colasoft®, the Colasoft logo, Capsa® are among the trademarks or registered trademarks of the company in
the United States and/or other countries. All other trademarks are property of their respective owners.
64 / 133
Diagnosis Tab
Network Analyzer
The Diagnosis tab contains three panes:
1.
Diagnosis Layer
2.
Diagnosis Address
3.
Events
Diagnosis Layer
A diagnosis event occurred; it is organized to its corresponding network layer. Choose one event item, other three panes refresh to
show statistics and information to it. The Diagnosis Addresses pane lists out all the IP addresses and Physical Addresses that
relating to the selected diagnosis event.
Click Only Instance, only the events with records will be listed. Click again to bring them back.
All events are grouped into protocol layers or security levels. Protocol Layers are Application, Transport, Network and Data
Link layer. Security levels are listed in the table below:
© 2010 Colasoft. All rights reserved. Colasoft®, the Colasoft logo, Capsa® are among the trademarks or registered trademarks of the company in
the United States and/or other countries. All other trademarks are property of their respective owners.
65 / 133
Diagnosis Tab
Network Analyzer
Severity Level
Icon
Description
Information
Indicates a normal message, no corrective action is required.
Notice
Indicates normal but significant conditions, may require special handling.
Warning
Indicates an error condition that requires attention and should be addressed soon.
Critical
Requires immediate intervention by administrators to prevent serious problem to the
network.
Different analysis profiles may have different items in Diagnosis Events List, for more details; see Application Layer, Transport
Layer, Network Layer and Data Link Layer.
Toolbar
The buttons of the toolbar are listed in the following table.
Property
Opens Diagnosis Settings dialog.
Save
Saves all of the diagnosis events to a *.txt format file.
Diagnosis Address
Hides/shows the Diagnosis Address pane.
Events
Hides/shows the Events pane.
Refresh
Click to refresh the protocol list or set the refresh options.
Context Menu
The following table lists all the items in the menu of the Diagnosis Layer:
Copy
Copies the selection in original format to the clipboard.
Export Diagnosis Statistics...
Saves all of the addresses to disk as a *.txt format file.
Diagnosis Address
Saves all of the diagnosis events to a *.txt format file.
Events
Hides/shows the Events pane.
Diagnose Property...
Opens Diagnosis Settings dialog.
Select All
Selects all items in the list.
Refresh
Refreshes the current list.
Diagnosis Address
This pane displays all the addresses, e.g. IP addresses and MAC addresses in this pane.
Toolbar
The buttons of the toolbar are listed in the following table:
© 2010 Colasoft. All rights reserved. Colasoft®, the Colasoft logo, Capsa® are among the trademarks or registered trademarks of the company in
the United States and/or other countries. All other trademarks are property of their respective owners.
66 / 133
Diagnosis Tab
Network Analyzer
Save As
Saves the records to your disk as a *.txt format file.
Add to Filter
Opens a new dialog to make a new filter on the basis of the selection.
Add to Name Table
Add an alias for the selected node to the Name Table.
Refresh
Click to refresh the protocol list or set the refresh options.
Context Menu
The following table lists all the items in the menu of Diagnosis Address:
Find...
Finds an item in the list.
Copy
Copies the selection in original format to the clipboard.
Save Log...
Saves all of the addresses to disk as a *.txt format file.
Address Resolve...
Resolves the host name of your selected address item.
Make Filter
Opens a new dialog to make a new filter on the basis of the selection.
Add to Name Table
Add an alias for the selected node to the Name Table.
Make Graph
Generates a graph in the Dashboard tab based on the selected item.
Make Alarm
Generates an alarm item based on the selected item.
Locate in Node Explorer
Locates the current node in the Node Explorer window.
Select All
Selects all items in the list.
Refresh
Refreshes the current list.
Events
Displays the following columns by default: Severity, Type, Layer, Event Description, Node 1 and Node 2. You can go further
analysis on records listed in this tab.
Toolbar
The buttons of toolbar are listed in the following table:
Export
Saves the records to your disk as a *.txt format file.
Add to Filter
Opens the Packet Filter dialog and makes a new filter on the basis of the selection.
Locate in Node Explorer
Locates the current node in the Explorer.
© 2010 Colasoft. All rights reserved. Colasoft®, the Colasoft logo, Capsa® are among the trademarks or registered trademarks of the company in
the United States and/or other countries. All other trademarks are property of their respective owners.
67 / 133
Protocol Tab
Network Analyzer
Refresh
Refreshes the current view.
Event Counter
Sums up the total number of records in the tab.
Context Menu
The following table lists all the items in the menu of Event pane.
Packets in New
Opens a new window to show packet decode information; alternately, you can double click on the
Window
packet.
Copy
Copies the selection in original format to the clipboard.
Save Log...
Saves all of the addresses to disk as a *.txt format file.
Find...
Finds your entry word in the tab.
Address Resolve...
Resolves the host name of your selected item. With the resolved name, you can easily find the
machine in your network.
Make Filter
Opens a new dialog to make a new filter on the basis of the selection.
Add to Name Table
Add an alias for the selected node to the Name Table.
Make Graph
Generates a new graph item in Graph tab based on the selected item.
Make Alarm
Generates a new alarm item in Alarm Explorer window to alert you anomalies, based on the
selected item.
Locate in Node
Locates the current node in the Explorer.
Explorer
Select All
Selects all items in the list.
Refresh
Refreshes the current list.
You can double-click a packet item to examine packet decoding information in a new window (See Packet Tab for details ) or click
Show Decode and Show Hex to show Decoder pane and Hex pane to view decoding information.
Protocol Tab
The Protocol tab displays the statistics on protocols used by network communications. The Protocol tab is described below:
© 2010 Colasoft. All rights reserved. Colasoft®, the Colasoft logo, Capsa® are among the trademarks or registered trademarks of the company in
the United States and/or other countries. All other trademarks are property of their respective owners.
68 / 133
Protocol Tab
Network Analyzer
It contains the following components:
1.
Upper Pane (Protocol List)
2.
Lower Pane (Relating tabs)
Protocol List
Protocols are displayed in a hierarchical structure as their original packaging orders that help you figure out their upper protocols.
Each protocol has its own color that you can easily find out your target protocol in the list by color. You can click any column header
to sort the list to check if there is any abnormal protocol usage. The Protocol List contains the following items:
•
Toolbar
•
Column Header
•
Context Menu
© 2010 Colasoft. All rights reserved. Colasoft®, the Colasoft logo, Capsa® are among the trademarks or registered trademarks of the company in
the United States and/or other countries. All other trademarks are property of their respective owners.
69 / 133
Protocol Tab
Network Analyzer
Toolbar
The following table lists all the items on the toolbar:
Export
Click to export all of the protocol statistics to a *.txt format file.
Details
Click to show or hide the lower pane.
Add to Filter
Click to open the Packet Filter dialog to make a new filter based on the selection in this pane.
Locate
Click to locate the current protocol node in the Node Explorer window.
Refresh
Click to refresh the protocol list or set the refresh options.
Protocol Counter
Shows the number of all protocols in the list.
Column Header
Right-click a column header, you can select more columns to show in the list. Choose Default to get showing columns back to
default.
Context Menu
The following table lists all the menu items in the list:
Packets in New Window
Sends the packets to a new packet decode window.
Copy
Copies the selection in original format to the clipboard.
Copy Column
Copies the selected column in original format to the clipboard.
Customize Column
Shows/ hides columns or changes the position of columns.
Export Protocol Statistics
Saves all of the protocol statistics to a *.txt format file.
Find...
Finds an item in the tab.
Make Filter...
Opens a new dialog to make a new filter on the basis of the selection.
Make Graph
Generates a new graph item in the Dashboard tab based on the selected item.
Make Alarm
Generates a new alarm item based on the selected item.
Locate in Node Explorer
Locates the current node in the Node Explorer window.
Select All
Selects all items in the list.
Refresh
Refreshes the current list.
Relating Tabs
What tabs show in the bottom pane depends on what you selected in the Node Explorer window. These tabs provide the most
relating statistics to your selection. For example, You will have IP Conversation, TCP Conversation and UDP Conversation tabs
when you selected an IP address in the Node Explorer window. Your selection in the Node Explorer window and the selection in
the protocol list will be like filters to get more small items in the bottom tabs. These tabs will save your time and clicks to find the
statistics you need.
Read the corresponding tab introduction to learn how to use these tabs.
© 2010 Colasoft. All rights reserved. Colasoft®, the Colasoft logo, Capsa® are among the trademarks or registered trademarks of the company in
the United States and/or other countries. All other trademarks are property of their respective owners.
70 / 133
Physical Endpoint Tab
Network Analyzer
Physical Endpoint Tab
Endpoints are all the objects communicating in the network. Colasoft Capsa divides all nodes by physical address and IP address.
This tab provides a great number of statistics on physical endpoints to help you find useful information on MAC addresses. For
example, you can find the physical endpoints with the largest traffic and with that to check if there is any broadcast storm or
multicast storm in network. This tab contains the following components:
1.
Upper Pane (Physical Endpoint List)
2.
Lower Pane (Relating tabs)
The Physical Endpoint tab will be invisible if you select any IP address item in Physical Explorer or IP Explorer in of the Node
Explorer window.
Physical Endpoint List
© 2010 Colasoft. All rights reserved. Colasoft®, the Colasoft logo, Capsa® are among the trademarks or registered trademarks of the company in
the United States and/or other countries. All other trademarks are property of their respective owners.
71 / 133
Physical Endpoint Tab
Network Analyzer
Endpoints are displayed in a hierarchical structure. You can click any column header to sort the list to check if there is any abnormal
traffic.
The Physical Endpoint List contains the following items:
•
Toolbar
•
Column Header
•
Context Menu
Toolbar
The following table lists all the components on the toolbar:
Show Switching
Click to switch list layout between hierarchical and tiled style.
Export
Clicks to export all items in the list to a *.txt format file to disk.
Details
Click to show or hide the lower pane.
Add to Filter
Click to open the Packet Filter dialog to make a new filter based on the selection in this pane.
Add to Name Table
Click to add an alias for the selected node to the Name Table.
Locate
Click to locate the current node in the Node Explorer window.
Refresh
Click to refresh the list or set the refresh options.
Node Counter
Shows the number of all physical endpoints in the list.
Column Header
Right-click a column header, you can select more columns to show in the list. Choose Default to get showing columns back to
default.
Context Menu
The following table lists all the items in the menu of this list:
Packets in New Window
Sends the packets relating to the selected node to a new packet decode window.
Copy
Copies the selection in original format to the clipboard.
Copy Column
Copies the selected column in original format to the clipboard.
Customize Column
Shows/hides columns or changes the position of columns.
Export Node Statistics
Saves all of the physical endpoint statistics to disk as a *.txt format file.
Find...
Finds an item in the list.
Make Filter...
Opens a new dialog to make a new filter on the basis of the selection.
Make Graph...
Generates a graph in the Dashboard tab based on the selected item.
Make Alarm...
Generates an alarm item based on the selected item.
© 2010 Colasoft. All rights reserved. Colasoft®, the Colasoft logo, Capsa® are among the trademarks or registered trademarks of the company in
the United States and/or other countries. All other trademarks are property of their respective owners.
72 / 133
IP Endpoint Tab
Network Analyzer
Add to Name Table
Add an alias for the selected node to the Name Table.
Address Resolve...
Resolves the host name of your selected address item.
Locate in Node Explorer
Locates the current node in the Node Explorer window.
Ping
Invokes the build-in Ping Tool.
Packet Player
Invokes the build-in tool Packet Player.
Packet Builder
Invokes the build-in tool Packet Builder.
MAC Scanner
Invokes the build-in tool MAC Scanner.
Select All
Selects all items in the list.
Refresh
Refreshes the current list.
Relating Tabs
Only Physical Conversation tab displays on the lower pane when any node in Protocol Explorer root and Physical Explorer root
selected in the Node Explorer window.
Read the Physical Conversation to learn how to use this tab.
IP Endpoint Tab
Endpoints are all the objects communicating in the network. Colasoft Capsa divides all nodes by physical address and IP address.
This tab provides a great number of statistics on IP endpoints to help you find useful information on IP addresses. This tab contains
the following components:
© 2010 Colasoft. All rights reserved. Colasoft®, the Colasoft logo, Capsa® are among the trademarks or registered trademarks of the company in
the United States and/or other countries. All other trademarks are property of their respective owners.
73 / 133
IP Endpoint Tab
Network Analyzer
1.
Upper Pane (IP Endpoint List)
2.
Lower Pane (Relating tabs)
The IP Endpoint tab will be invisible if you select any MAC address item in Physical Explorer of the Node Explorer window.
IP Endpoint List
Endpoints are displayed in a hierarchical structure. You can click any column header to sort the list to check if there is any abnormal
traffic.
The IP Endpoint List contains the following items:
•
Toolbar
•
Column Header
•
Context Menu
© 2010 Colasoft. All rights reserved. Colasoft®, the Colasoft logo, Capsa® are among the trademarks or registered trademarks of the company in
the United States and/or other countries. All other trademarks are property of their respective owners.
74 / 133
IP Endpoint Tab
Network Analyzer
Toolbar
The following table lists all the components on the toolbar:
Show Switching
Click to switch list layout between hierarchical and tiled style.
Export
Clicks to export all items in the list to a *.txt format file to disk.
Details
Click to show or hide the lower pane.
Add to Filter
Click to open the Packet Filter dialog to make a new filter based on the selection in this pane.
Add to Name Table
Click to add an alias for the selected node to the Name Table.
Locate
Click to locate the current node in the Node Explorer window.
Refresh
Click to refresh the list or set the refresh options.
Node Counter
Shows the number of all IP endpoints in the list.
Column Header
Right-click a column header, you can select more columns to show in the list. Choose Default to get showing columns back to
default.
Context Menu
The following table lists all the items in the menu of this list:
Packets in New Window
Sends the packets relating to the selected node to a new packet decode window.
Copy
Copies the selection in original format to the clipboard.
Copy Column
Copies the selected column in original format to the clipboard.
Customize Column
Shows/hides columns or changes the position of columns.
Export Node Statistics
Saves all of the IP endpoint statistics to disk as a *.txt format file.
Find...
Finds an item in the list.
Make Filter...
Opens a new dialog to make a new filter on the basis of the selection.
Make Graph...
Generates a graph in the Dashboard tab based on the selected item.
Make Alarm...
Generates an alarm item based on the selected item.
Add to Name Table
Add an alias for the selected node to the Name Table.
Address Resolve...
Resolves the host name of your selected address item.
Locate in Node Explorer
Locates the current node in the Node Explorer window.
Ping
Invokes the build-in Ping Tool.
Packet Player
Invokes the build-in tool Packet Player.
Packet Builder
Invokes the build-in tool Packet Builder.
MAC Scanner
Invokes the build-in tool MAC Scanner.
Select All
Selects all items in the list.
© 2010 Colasoft. All rights reserved. Colasoft®, the Colasoft logo, Capsa® are among the trademarks or registered trademarks of the company in
the United States and/or other countries. All other trademarks are property of their respective owners.
75 / 133
Physical Conversation Tab
Network Analyzer
Refreshes the current list.
Refresh
Relating Tabs
There are three tabs show in the lower pane when you selected any protocol item or IP address item in the Node Explorer window:
IP Conversation, TCP Conversation and UDP Conversation. Your selection in the Explorer window and the selection in the
protocol list will be like filters to get more small items in the bottom tabs. These tabs will save your time and clicks to find the
statistics you need.
Read the IP Conversation, TCP Conversation and UDP Conversation to learn detailed descriptions of these tabs.
Physical Conversation Tab
The Physical Conversation tab provides you with MAC address conversation statistics. Each single conversation record has its
source MAC address, destination MAC address, packets sent and received, packet sizes and communication duration, etc. This tab
contains the following components:
1.
Upper Pane (Physical Conversation List)
2.
Lower Pane (Relating tabs)
This tab is visible only when you select a MAC address item in Physical Explorer or protocol item below the IP layer in Protocol
Explorer of the Node Explorer window.
Physical Conversation List
The Physical Conversation List contains the following parts:
© 2010 Colasoft. All rights reserved. Colasoft®, the Colasoft logo, Capsa® are among the trademarks or registered trademarks of the company in
the United States and/or other countries. All other trademarks are property of their respective owners.
76 / 133
Physical Conversation Tab
Network Analyzer
•
Toolbar
•
Column Header
•
Context Menu
Toolbar
The following table lists all the items on the toolbar:
Export
Click to export all of the physical conversation statistics to a *.txt format file.
Detail
Click to show or hide the lower pane.
Add to Filter
Click to open the Packet Filter dialog to make a new filter based on the selection in this
pane.
Refresh
Click to refresh the physical conversation list or set the refresh options.
Physical Conversation
Shows the number of all physical conversation in the list.
Counter
Column Header
Right-click a column header, you can select more columns to show in the list. Choose Default to get showing columns back to
default.
Context Menu
The following table lists all the menu items in the list:
Packets in New Window
Sends the packets relating to the selected node to a new packet decode window.
Copy
Copies the selection in original format to the clipboard.
Copy Column
Copies the selected column in original format to the clipboard.
Customize Column
Shows/hides columns or changes the position of columns.
Export Conversation
Saves all of the physical conversations statistics to disk as a *.txt format file.
Statistics
Find...
Finds an item in the list.
Make Filter...
Opens a new dialog to make a new filter on the basis of the selection.
Address Resolve...
Resolves the host name of your selected address item. This item is grayed out, for MAC
address does not have a host name.
Add to Name Table
Add an alias for the selected node to the Name Table.
Make Graph
Generates a graph in the Dashboard tab based on the selected item.
Make Alarm
Generates an alarm item based on the selected item.
Locate in Node Explorer
Locates one of the MAC addresses of the selected conversation in the Node Explorer
window.
© 2010 Colasoft. All rights reserved. Colasoft®, the Colasoft logo, Capsa® are among the trademarks or registered trademarks of the company in
the United States and/or other countries. All other trademarks are property of their respective owners.
77 / 133
IP Conversation Tab
Network Analyzer
Send Packet to Packet
Sends the selected packets to the build-in tool Packet Builder.
Builder
Select All
Selects all items in the list.
Refresh
Refreshes the current list.
Relating Tabs
There are three tabs in the lower pane: IP Conversation, TCP Conversation and UDP Conversation. Your selection in the Node
Explorer window and the selection in the protocol list will be like filters to get more small items in the bottom tabs. These tabs will
save your time and clicks to find the statistics you need.
Read the IP Conversation, TCP Conversation and UDP Conversation to learn detailed descriptions of these tabs.
IP Conversation Tab
The IP Conversation tab provides you with IP address conversation statistics. Each single conversation record has its source IP
address, destination IP address, packets sent and received, packet sizes and communication duration, etc. This tab contains the
following components:
1.
Upper Pane (IP Conversation List)
2.
Lower Pane (Relating tabs)
This tab is visible only when you select an IP address item in the Physical Explorer or in the IP Explorer, and IP protocol in the
Protocol Explorer of the Node Explorer window.
© 2010 Colasoft. All rights reserved. Colasoft®, the Colasoft logo, Capsa® are among the trademarks or registered trademarks of the company in
the United States and/or other countries. All other trademarks are property of their respective owners.
78 / 133
IP Conversation Tab
Network Analyzer
IP Conversation List
The IP Conversation List contains the following parts:
•
Toolbar
•
Column Header
•
Context Menu
Toolbar
The following table lists all the items on the toolbar:
Export
Click to export all of the IP conversation statistics to a *.txt format file.
Detail
Click to show or hide the lower pane.
Add to Filter
Click to open the Packet Filter dialog to make a new filter based on the selection in this pane.
Refresh
Click to refresh the IP conversation list or set the refresh options.
IP Conversation Counter
Shows the number of all IP conversation in the list.
Column Header
Right-click a column header, you can select more columns to show in the list. Choose Default to get showing columns back to
default.
Context Menu
The following table lists all the menu items in the list:
Packets in New Window
Sends the packets relating to the selected node to a new packet decode window.
Copy
Copies the selection in original format to the clipboard.
Copy Column
Copies the selected column in original format to the clipboard.
Customize Column
Shows/hides columns or changes the position of columns.
Export Conversation
Saves all of the IP conversations statistics to disk as a *.txt format file.
Statistics
Find...
Finds an item in the list.
Make Filter...
Opens a new dialog to make a new filter on the basis of the selection.
Address Resolve...
Resolves the both host names of your selected statistic item.
Add to Name Table
Add an alias for the selected node to the Name Table.
Make Graph
Generates a graph in the Dashboard tab based on the selected item.
Make Alarm
Generates an alarm item based on the selected item.
Locate in Node Explorer
Locates one of the IP addresses of the selected conversation in the Node Explorer
window.
© 2010 Colasoft. All rights reserved. Colasoft®, the Colasoft logo, Capsa® are among the trademarks or registered trademarks of the company in
the United States and/or other countries. All other trademarks are property of their respective owners.
79 / 133
TCP Conversation Tab
Network Analyzer
Ping
Invokes the build-in Ping Tool to ping the endpoints.
Send Packet to Packet
Sends the selected packets to the build-in tool Packet Builder.
Builder
Select All
Selects all items in the list.
Refresh
Refreshes the current list.
Relating Tabs
There are two tabs in the lower pane: TCP Conversation and UDP Conversation. Your selection in the Node Explorer window
and the selection in the protocol list will be like filters to get more small items in the bottom tabs. These tabs will save your time and
clicks to find the statistics you need.
Read the TCP Conversation and UDP Conversation to learn detailed descriptions of these tabs.
TCP Conversation Tab
The TCP Conversation tab provides you with all TCP conversation statistics. Each single conversation record has its source IP
address, source port, destination IP address, destination port; packets sent and received packet sizes and communication duration,
etc. This tab contains the following components:
1.
Upper Pane (TCP Conversation List)
2.
Lower Pane
This tab is visible only when you select TCP protocol (or higher-layer protocols) in Protocol Explorer, or any IP address item in
© 2010 Colasoft. All rights reserved. Colasoft®, the Colasoft logo, Capsa® are among the trademarks or registered trademarks of the company in
the United States and/or other countries. All other trademarks are property of their respective owners.
80 / 133
TCP Conversation Tab
Network Analyzer
Physical Explorer and IP Explorer of the Node Explorer window.
TCP Conversation List
The TCP Conversation List contains the following parts:
•
Toolbar
•
Column Header
•
Context Menu
Toolbar
The following table lists all the items on the toolbar:
Export
Click to export all of the TCP conversation statistics to a *.txt format file.
Detail
Click to show or hide the lower pane.
Add to Filter
Click to open the Packet Filter dialog to make a new filter based on the selection in this pane.
Refresh
Click to refresh the TCP conversation list or set the refresh options.
TCP Conversation
Shows the number of all TCP conversation in the list.
Counter
Column Header
Right-click a column header, you can select more columns to show in the list. Choose Default to get showing columns back to
default.
Context Menu
The following table lists all the menu items in the list:
Packets in New Window
Sends the packets relating to the selected node to a new packet decode window.
Copy
Copies the selection in original format to the clipboard.
Copy Column
Copies the selected column in original format to the clipboard.
Customize Column
Shows/hides columns or changes the position of columns.
Export Conversation
Saves all of the TCP conversations statistics to disk as a *.txt format file.
Statistics
Find...
Finds an item in the list.
Make Filter...
Opens a new dialog to make a new filter on the basis of the selection.
Address Resolve...
Resolves the both host names of your selected statistic item.
Add to Name Table
Add an alias for the selected node to the Name Table.
Make Graph
Generates a graph in the Dashboard tab based on the selected item.
Make Alarm
Generates an alarm item based on the selected item.
© 2010 Colasoft. All rights reserved. Colasoft®, the Colasoft logo, Capsa® are among the trademarks or registered trademarks of the company in
the United States and/or other countries. All other trademarks are property of their respective owners.
81 / 133
TCP Conversation Tab
Network Analyzer
Locate in Node Explorer
Locates one of the IP addresses of the selected conversation in the Node Explorer
window.
Ping
Invokes the build-in Ping Tool to ping the endpoints.
Send Packet to Packet
Sends the selected packets to the build-in tool Packet Builder.
Builder
Select All
Selects all items in the list.
Refresh
Refreshes the current list.
Lower Pane
There are three tabs in the lower pane:
•
Packets Tab
•
Data Flow Tab
•
Time Sequence Tab
These tabs help you go deeper to analyze the original data of the conversations.
Data Flow Tab
A TCP conversation contains many packets. Colasoft Capsa organizes these packets in their correct orders and reconstructs these
packets into a TCP flow. The conversations of Web (HTTP), Email (SMTP/POP3), FTP and MSN, etc can be reconstructed. The
data streams of different directions can be distinguished by colors, e.g. blue is for endpoint 1 to endpoint 2, green is for endpoint 2
to endpoint 1. The Data Flow contains the following parts:
•
Toolbar
•
Context Menu
© 2010 Colasoft. All rights reserved. Colasoft®, the Colasoft logo, Capsa® are among the trademarks or registered trademarks of the company in
the United States and/or other countries. All other trademarks are property of their respective owners.
82 / 133
TCP Conversation Tab
Network Analyzer
You may get unreadable symbols because some data are segments or encrypted in transmission.
Toolbar
The following table lists all the items on the toolbar:
Click to choose one of the three direction types: Bidirectional, Node 1 to Node 2 and Node 2 to
Flow Direction
Node 1, to display flow of both direction, flow from Node 1 to Node 2 or flow from Node 2 to Node
1.
Show Packet Count
By default, only the first 50 packets of a conversation are displayed. You can choose a larger
Limit in Each Flow
value to display more data if a conversation has more packets than 50.
Save
Click to save the content to disk as a *.txt format file.
Refresh
Click to refresh the flow content or set the refresh options..
Packet Counter
Shows the number of packets in the conversation.
Context Menu
The following table lists all the menu items of this tab:
Copy
Copies the selected content to the clipboard.
Line Wrap
Auto-wraps texts longer than the width of the pane.
Charter Set
Chooses a decoding format to view content of packets.
Find
Finds your entry word in the pane.
Find Next
Finds next result of your entry.
Select All
Selects the whole content.
Refresh
Refreshes the flow content.
Still, you can read Time Sequence to get more help on TCP conversation analysis.
Time Sequence Tab
Time Sequence displays the TCP conversations in arrow style in time order. You can read these arrows to understand TCP
communication and analyze the following scenarios:
•
Communications between two nodes.
•
Check if there is any TCP port scanning.
•
Check if there is any password decoding action via TCP.
•
Check if there is any worm virus attack via emails.
•
Check if there is any little size packet with long time communication (IM communicates with HTTP proxy).
With analyzing these diagrams, you will understand the original operations of the connections and go deeper to analyze content and
steps of TCP connections.
© 2010 Colasoft. All rights reserved. Colasoft®, the Colasoft logo, Capsa® are among the trademarks or registered trademarks of the company in
the United States and/or other countries. All other trademarks are property of their respective owners.
83 / 133
UDP Conversation Tab
Network Analyzer
The Time Sequence tab contains the following parts:
•
Toolbar
Toolbar
The following table lists all the items on the toolbar:
Sequence Number
Click to switch display relative or absolute sequence number.
Type
Relative sequence number will display the number of the first packet as 0 and recaculate the
following packet sequence number based on it.
Refresh
Click to refresh the tab or set the refresh options..
Packet Counter
Shows the number of packets in the conversation.
Still, you can read Data Flow to get more help on TCP conversation analysis.
UDP Conversation Tab
The UDP Conversation tab provides you with all UDP conversation statistics. Each single conversation record has its source IP
address, source port, destination IP address, destination port; packets sent and received packet sizes and communication duration,
© 2010 Colasoft. All rights reserved. Colasoft®, the Colasoft logo, Capsa® are among the trademarks or registered trademarks of the company in
the United States and/or other countries. All other trademarks are property of their respective owners.
84 / 133
UDP Conversation Tab
Network Analyzer
etc. This tab contains the following components:
1.
Upper Pane (UDP Conversation List)
2.
Lower Pane
This tab is visible only when you select UDP protocol (or higher-layer protocols) in Protocol Explorer, or any IP address item in
Physical Explorer and IP Explorer of the Node Explorer window.
UDP Conversation List
The UDP Conversation List contains the following parts:
•
Toolbar
•
Column Header
•
Context Menu
Toolbar
The following table lists all the items on the toolbar:
© 2010 Colasoft. All rights reserved. Colasoft®, the Colasoft logo, Capsa® are among the trademarks or registered trademarks of the company in
the United States and/or other countries. All other trademarks are property of their respective owners.
85 / 133
UDP Conversation Tab
Network Analyzer
Export
Click to export all of the UDP conversation statistics to a *.txt format file.
Detail
Click to show or hide the lower pane.
Add to Filter
Click to open the Packet Filter dialog to make a new filter based on the selection in this
pane.
Refresh
Click to refresh the UDP conversation list or set the refresh options.
UDP Conversation
Shows the number of all UDP conversation in the list.
Counter
Column Header
Right-click a column header, you can select more columns to show in the list. Choose Default to get showing columns back to
default.
Context Menu
The following table lists all the menu items in the list:
Packets in New Window
Sends the packets relating to the selected node to a new packet decode window.
Copy
Copies the selection in original format to the clipboard.
Copy Column
Copies the selected column in original format to the clipboard.
Customize Column
Shows/hides columns or changes the position of columns.
Export Conversation Statistics
Saves all of the UDP conversations statistics to disk as a *.txt format file.
Find...
Finds an item in the list.
Make Filter...
Opens a new dialog to make a new filter on the basis of the selection.
Address Resolve...
Resolves the both host names of your selected statistic item.
Add to Name Table
Add an alias for the selected node to the Name Table.
Make Graph
Generates a graph in the Dashboard tab based on the selected item.
Make Alarm
Generates an alarm item based on the selected item.
Locate in Node Explorer
Locates the IP address of the selected conversation in the Node Explorer window.
Ping
Invokes the build-in Ping Tool to ping the endpoints.
Send Packet to Packet Builder
Sends the selected packets to the build-in tool Packet Builder.
Select All
Selects all items in the list.
Refresh
Refreshes the current list.
Lower Pane
There are two tabs in the lower pane:
•
Packets Tab
•
Data Tab
© 2010 Colasoft. All rights reserved. Colasoft®, the Colasoft logo, Capsa® are among the trademarks or registered trademarks of the company in
the United States and/or other countries. All other trademarks are property of their respective owners.
86 / 133
UDP Conversation Tab
Network Analyzer
These tabs help you go deeper to analyze the original data of the conversations.
Data Tab
A UDP conversation contains many packets. Colasoft Capsa reconstructs and decodes these packets into text content. From this
tab, you can see the reconstructed data streams of the selected conversation. The data streams of different directions can be
distinguished by color, e.g. blue is for endpoint 1 to endpoint 2, green is for endpoint 2 to endpoint 1.
The Data tab contains the following parts:
•
Toolbar
•
Context Menu
You may get unreadable symbols because some data are segments or encrypted in transmission.
Toolbar
The following table lists all the items on the toolbar:
Flow Direction
Click to choose one of the three direction types: Bidirectional, Node 1 to Node 2 and Node 2 to
Node 1, to display flow of direction, flow from Node 1 to Node 2 or flow from Node 2 to Node 1.
Show Packet Count
By default, only the first 50 packets of a conversation are displayed. You can choose a larger
Limit in Each Flow
value to display more data if a conversation has more packets than 50.
Save
Click to save the content to disk as a *.txt format file.
Refresh
Click to refresh the flow content or set the refresh options.
Packet Counter
Shows the number of packets in the conversation.
Context Menu
The following table lists all the context menu items of this tab:
Copy
Copies the selected content to the clipboard.
Line Wrap
Auto-wraps texts longer than the width of the pane.
Charter Set
Chooses a decoding format to view content of packets.
© 2010 Colasoft. All rights reserved. Colasoft®, the Colasoft logo, Capsa® are among the trademarks or registered trademarks of the company in
the United States and/or other countries. All other trademarks are property of their respective owners.
87 / 133
Matrix Tab
Network Analyzer
Find
Finds your entry word in the pane.
Find Next
Finds next result of your entry.
Select All
Selects the whole content.
Refresh
Refreshes the flow content.
Matrix Tab
The Matrix tab shows the network traffic statistics in graph. The line weight indicates the volume of traffic between nodes. You can
quickly switch among global statistics and the details of specific network nodes by switching among the Node Explorer window.
You will find the following components in this tab:
1.
Matrix View
2.
Matrix Type
3.
User Hidden Nodes
4.
Invisible Nodes
Matrix View
© 2010 Colasoft. All rights reserved. Colasoft®, the Colasoft logo, Capsa® are among the trademarks or registered trademarks of the company in
the United States and/or other countries. All other trademarks are property of their respective owners.
88 / 133
Matrix Tab
Network Analyzer
The Matrix View contains the following parts:
•
Toolbar
•
The Matrix
•
Context Menu
Toolbar
The following table lists all the components on the toolbar:
Matrix Type
Click the little triangle to choose a matrix type in the list. Simply click the button will hide the Matrix Type
pane, and click it again to bring it back.
Text Size
Click to set the display font size of the nodes in the matrix.
Options
Click to set color of the nodes, lines and background, customize the number of max nodes.
Refresh
Click to refresh the matrix or set the refresh options.
Matrix Node
Shows the number of endpoints in the list.
Counter
The Matrix
Move your mouse over a node, the lines that connecting a node to other nodes that communicated with it will be highlighted and
bolded. A tip box shows the statistics of this node.
The matrix view helps you to get information on:
•
All nodes in network communication.
•
All conversations in network communication.
•
Nodes communicating with a physical address.
•
Nodes communicating with an IP address.
•
Node address of a conversation.
If too many node showing in a matrix, you can:
•
Hide other nodes.
•
Drag nodes to a clear place.
Context Menu
There are two types of Context Menus:
•
Right-click any empty place
•
Right-click on a node
The following table lists all the items in the Context Menus:
Text Size
Sets the display font size of the nodes in the matrix.
Option
Sets color of the nodes, lines and background, customize the number of max nodes.
© 2010 Colasoft. All rights reserved. Colasoft®, the Colasoft logo, Capsa® are among the trademarks or registered trademarks of the company in
the United States and/or other countries. All other trademarks are property of their respective owners.
89 / 133
Matrix Tab
Network Analyzer
Sends the packets relating to the selected node to a new packet decode window.
Show Packet in New
Window
Rearrange Nodes
Rearranges the position of nodes.
Hide
Hides some nodes to concentrate on important nodes.
Resolve Name
Resolves the host name of your selected item. With the resolved name, you can easily find the
machine in your network.
Make Filter...
Opens the Packet Filter dialog and makes a new filter on the basis of the selection.
Make Graph...
Generates a new graph item in Dashboard tab based on the selected item.
Add to Name Table
Adds an alias for the selected node to the Name Table.
Locate in Node Explorer
Locates the current node in the Node Explorer window.
Display All Hidden
Shows all the nodes that you hide them to User Hide Node pane.
Nodes
Matrix Type
There are four matrix types by default:
•
Top 100 Physical Conversation
•
Top 100 Physical Node
•
Top 100 IPv4 Conversation
•
Top 100 IPv4 Node
The Matrix Type pane contains the following parts:
•
Toolbar
•
Matrix Type Properties
Toolbar
The following table lists all the icons on the toolbar:
New Matrix
Click to create a new matrix type
Modify Matrix
Click to modify the properties of the selected matrix type.
Delete Matrix
Click to delete the selected matrix type.
Matrix Type Properties
The Matrix Type Properties dialog appears when you create a new matrix type or modify a matrix type. It contains the following
items:
© 2010 Colasoft. All rights reserved. Colasoft®, the Colasoft logo, Capsa® are among the trademarks or registered trademarks of the company in
the United States and/or other countries. All other trademarks are property of their respective owners.
90 / 133
Matrix Tab
Network Analyzer
Matrix Name
Auto-generates Matrix name on your options by default format: "Top" + Maximum Node + Matrix Type +
Conversation/Node. Also you can enter any name you want to.
Maximum
Sets the max node number of the Matrix.
Node
Matrix Type
Chooses a matrix type: Physical Address and IPv4 (default).
Traffic Type
Chooses a traffic type: Unicast, Multicast or Broadcast.
Sort By
Sets the sorting rules:
•
Object: Conversation and Node
•
Value: Total Packets, Send Packets, Receive Packets, Total Bytes, Send Bytes and Receive
Bytes.
User Hidden Nodes Pane
The User Hidden Nodes pane lists the nodes which have been temporarily hidden. You can hide the nodes you are not interested
in current matrix view.
Display Hidden Nodes
The number in the bracket of the pane head shows the number of hidden nodes. In this pane, you can restore the selected nodes to
the matrix by right-clicking in the pane and choosing Show Selected Nodes from the context menu, or restore all the hidden nodes
by choosing Show All Nodes.
Hide Nodes
© 2010 Colasoft. All rights reserved. Colasoft®, the Colasoft logo, Capsa® are among the trademarks or registered trademarks of the company in
the United States and/or other countries. All other trademarks are property of their respective owners.
91 / 133
Matrix Tab
Network Analyzer
To hide the nodes, select a node, right-click, choose the Hide command from the context menu, select This Node Only, This Node
and It’s Peers and Nodes That are not Peers to This Node from the sub-context menu.
Invisible Nodes Pane
The Invisible Nodes pane lists the nodes which have been temporarily hidden in the matrix because they do not match the settings
in the Display Options pane. The number in the bracket on the Invisible Nodes pane head shows the number of invisible nodes.
Packet Tab
The Packet tab displays captured packets and provides packet decoding information. This page describes all components in this
tab and how to view a packet and its decode information, how to find related packets, and how to change the layout of this tab.
This tab contains the following parts:
1.
Packet List
2.
Field Decode
3.
HEX Decode
You can click the Menu button and choose Options from the menu to open Decoder dialog to configure what protocols to decode.
© 2010 Colasoft. All rights reserved. Colasoft®, the Colasoft logo, Capsa® are among the trademarks or registered trademarks of the company in
the United States and/or other countries. All other trademarks are property of their respective owners.
92 / 133
Matrix Tab
Network Analyzer
Packet List
All packets listed here have the same information with packets in other tabs of Packet pane. It lists all the packets that relating to a
selected conversation. By default, it has the following columns: No., Absolute Time, Source, Destination, Protocol, Size,
Decode and Summary. The Packet List contains the following items:
•
Toolbar
•
Column Header
•
Context Menu
Toolbar
The following table lists all the items on the toolbar:
Export
Click to export selected packet items or all items in the list to a packet file.
Move
Click to highlight the previous or next packet in the list.
Up/Down
Packet List
Click to show the Packet List pane.
Show
Click to show the Field Decode pane.
Decode
Show Hex
Click to show the Hex Decode pane.
Layout
Click to select a layout of these three windows from the three predefined layouts. By default, the packet
decode information are showed at the bottom of this tab.
Add to Filter
Click to open the Packet Filter dialog and makes a filter on the basis of the selection.
Auto Scroll
The packet list will display the newest packet always if check this button. But when you select an item in the
view, this button will stop execution until you check it again.
Refresh
Click to refresh the list or set the refresh options.
Packet
Shows the number of packets in the list.
Counter
Column Header
Right-click a column header, you can select more columns to show in the list. Choose Reset to get showing columns back to
default.
Context Menu
The following table lists all the items in the menu of this list:
Decode in New
Opens a new window to show packet decode information; alternately, you can double click on the
Window
packet.
Copy (Ctrl+C)
Copies the selection in original format to the clipboard.
Copy Column
Copies the selected column in original format to the clipboard.
Customize Column
Shows/hides columns or changes the position of columns.
Packet Summary
Shows the packet summary.
•
Automatic - show the uppermost protocol summary
© 2010 Colasoft. All rights reserved. Colasoft®, the Colasoft logo, Capsa® are among the trademarks or registered trademarks of the company in
the United States and/or other countries. All other trademarks are property of their respective owners.
93 / 133
Matrix Tab
Network Analyzer
•
IP Summary - show the packet summary of IP protocols; if no IP protocols, show the
uppermost protocol summary
•
TCP/UDP Summary - show the packet summary of TCP/UDP protocols; if no TCP/UDP
protocols, show the uppermost protocol summary
Export Packets
Exports selected packets to a file.
Find...
Finds an item in the list.
Set Relative Time
Makes your selected item as the reference time point and recalculates the relative time based on the
selected item.
Make Filter
Opens a new dialog to make a new filter on the basis of the selection.
Address Resolve...
Resolves the host name of your selected item. With the resolved name, you can easily find the
machine in your network.
Add to Name Table
Add an alias for the selected node to the Name Table.
Make Graph
Generates a new graph item in Graph tab based on the selected item.
Make Alarm
Generates a new alarm item in Alarm Explorer window to alert you anomalies, based on the
selected item.
Locate in Node
Locates the current node in the Explorer.
Explorer
Ping
Invokes the build-in Ping Tool to ping the endpoints.
Send to Packet
Sends the selected packets to the build-in tool Packet Builder.
Builder
Select Relative
Highlights the related packets by source, destination, source and destination, conversation or
Packets
protocol.
Hide Selected
Hides the highlighted packets.
Packets
Hide Unselected
Hides all the packets in the list except the highlighted ones.
Packets
Unhide All Packets
Shows all hidden packets back to list.
Select All
Selects all items in the list.
Refresh
Refreshes the current list.
Field Decode Pane
© 2010 Colasoft. All rights reserved. Colasoft®, the Colasoft logo, Capsa® are among the trademarks or registered trademarks of the company in
the United States and/or other countries. All other trademarks are property of their respective owners.
94 / 133
Matrix Tab
Network Analyzer
To view the decode information of the current packet, press the Decode View icon in the toolbar to open the pane, or double click
on the packet to open the Packet Decode window.
The Filed Decode pane presents information based on the protocol used in packet transmission, click on the - minus or + plus
signs in the margin to collapse or expand the hierarchy of any header section.
Context Menu
The following table lists all the items in the menu of the Field Decode pane:
Copy
Copies the selection and puts it on the clipboard.
Copy Tree
Copies the packet decode tree and puts it on the clipboard.
Make Filter...
Opens a new dialog to make a new filter on the basis of the selection.
Add to Name Table
Add an alias for the selected node to the Name Table.
Expand All
Expands all items of the display.
Collapse All
Collapses all items of the display.
Select All
Selects all rows in the Field Decode pane.
Refresh
Refreshes the current pane.
Hex Decode Pane
This pane interworks with the Field Decode pane, when you select a portion of packet content in the Field Decode pane; Colasoft
Capsa highlights the selected portion and the corresponding Hex data and ASCII/EBCDIC data in this pane.
Context Menu
The following table lists all the items in the menu of the Hex Decode pane:
Copy
Copies the data and puts it on the clipboard.
© 2010 Colasoft. All rights reserved. Colasoft®, the Colasoft logo, Capsa® are among the trademarks or registered trademarks of the company in
the United States and/or other countries. All other trademarks are property of their respective owners.
95 / 133
Log Tab
Network Analyzer
Copy HEX
Copies the HEX digits and puts it on the clipboard.
Copy Text
Copy selected text in ASCII/EBCDIC decode area.
ASCII Code Display
Shows the decoded information as ASCII.
EBCDIC Code Display
Shows the decoded information as EBCDIC.
Select All
Select all Hex digits.
Refresh
Refreshes the current pane.
Log Tab
Logs are provided by different analysis modules which focus on recording different sorts of operations in detail by analyzing the
captured packets. Colasoft Capsa automatically analyzes the commands in the captured packets and recognizes the application
type. If logging functionality is activated, the commands and actions will be recorded to the corresponding log.
There are four types of logs are provided at present. Viewing these logs will help you check if there is any unauthorized application
operations on the network, etc. The Log tab is described below:
The Log tab contains the following parts:
•
Log Types
o
Global Log
o
DNS Log
o
Email Log
o
FTP Log
o
HTTP Log
© 2010 Colasoft. All rights reserved. Colasoft®, the Colasoft logo, Capsa® are among the trademarks or registered trademarks of the company in
the United States and/or other countries. All other trademarks are property of their respective owners.
96 / 133
Log Tab
Network Analyzer
o
MSN Log
o
Yahoo Messenger Log
•
Toolbar
•
Context Menu
Click the links above to read more in details.
You can read Log Settings to learn how to configure log settings.
Log Types
Colasoft Capsa provides five types of logs by default. Each type focuses on one kind of application. The following table describes all
five types of logs in the Log tab.
Global Log
DNS Log
Collects logs of other log types in an analysis project. It contains three columns by default: Time, Protocol and
Messages.
Logs the DNS query applications. It provides useful information like Time, Client, Client Port, Server, Server
Port, Query, State and Result, etc.
Whoever sends or receives an email on SMTP/POP3 will be logged. All log records contains Client Address,
Client Port, Server Address, Server Port, CC, Size, Attachment, Duration and Average Speed. Going
Email Log
through their records, you can check if there is any attack via email or email server attack.
If you enabled save emails, all captured emails will be saved to the chosen folder. You can double-click on any
log item to open the email with an email client.
Each item in logs is a record of uploading to or downloading from FTP server which contains 20 columns: Client
Address, Client Port, Server Address, Server Port, Server, Client, Transmission Start Time,
FTP Log
Transmission End Time, Duration (sec), Account, Operation Type, File, Transmission Mode, Total Bytes,
Server Bytes, Client Bytes, Total Packets, Server Packets, Client Packets and Average Speed. These
records help to check if the FTP transmission is working in order or if there is any FTP attack (uploading or
downloading file to/from a host).
Records all HTTP activities including: Client Address, Server Address, Request URL, Method, Status Code
HTTP Log
and Server Response. Look into these records, you can easily get web browsing activities records from a
specific user to the whole network and check if there is any web attack (via port 80).
Records MSN communications in your network. You can read the messages in plain text and login and logout
MSN Log
status records.
Yahoo
Records YAHOO communications in your network. You can read the messages in plain text and login and
Messenger Log
logout status records.
Not every analysis project has all of the five log types. What log types you have in an analysis project depend on what analysis
modules selected. Every analysis project, however, has the Global Log.
If you have a certain Log Type in the Log tab but without any record in it, you should check if the certain logging functionality
enabled (See Log Settings).
Toolbar and Context Menu
This page describes the toolbar and the context menu of the Log tab.
Toolbar
© 2010 Colasoft. All rights reserved. Colasoft®, the Colasoft logo, Capsa® are among the trademarks or registered trademarks of the company in
the United States and/or other countries. All other trademarks are property of their respective owners.
97 / 133
Log Tab
Network Analyzer
The following table lists all the items on the toolbar:
Log Type
Click the little triangle to choose a log type in the list and only this type will be listed. Simply click the
button will hide the Log Type pane, and click it again to bring it back.
Export
Click to export all items in conversation list as a *.txt format file to your disk.
Add to Filter
Click to create a filter based on selected item.
Locate in Node
Click to locate the highlight node address in the Node Explorer window.
Explorer
Auto Scroll
The log list will display the newest record always if check this button. But when you select an item in the
view, this button will stop execution until you check it again.
Refresh
Click to refresh the log list or set the refresh options.
Log Record
Shows the number of logs in the list.
Counter
Context Menu
The following table lists all the items in the menu of the Log tab:
Open
Opens the highlighted URL. Only clickable in HTTP Log Type.
Copy
Copies the selection in original format to the clipboard.
Copy Column
Copies the selected column in original format to the clipboard.
Customize Column
Shows/hides columns or changes the position of columns.
Export Logs
Saves all log items to your disk as a *.txt format file.
Find...
Finds an item in the tab.
Make Filter...
Opens a new dialog to create a filter on the basis of the selection.
Address Resolve...
Resolves the host name of your selected IP address.
Add to Name Table
Add an alias for the selected node to the Name Table.
Make Graph
Generates a graph in the Dashboard tab based on the selected item.
Make Alarm
Generates an alarm item based on the selected item.
Locate in Node Explorer
Locates the current node in the Node Explorer window.
Ping
Invokes the build-in Ping Tool.
Packet Player
Invokes the build-in tool Packet Player.
Packet Builder
Invokes the build-in tool Packet Builder.
MAC Scanner
Invokes the build-in tool MAC Scanner.
Select All
Selects all items in the list.
Refresh
Refreshes the current tab.
© 2010 Colasoft. All rights reserved. Colasoft®, the Colasoft logo, Capsa® are among the trademarks or registered trademarks of the company in
the United States and/or other countries. All other trademarks are property of their respective owners.
98 / 133
Report Tab
Network Analyzer
Report Tab
The Report tab provides the real time reports on global network or a specific node. It contains a wide variety of reports, including
summary statistics, diagnosis statistics, protocol statistics, top 10 IP protocols, top 10 physical addresses, top 10 IP addresses, top
10 local IP addresses, and top 10 remote IP addresses.
Colasoft Capsa also let you save reports in three file formats: *.html, *.pdf and *.mht. You can configure Report Settings to
customize report template as well.
The Report tab contains the following parts:
•
Report View
•
Toolbar
•
Report Item Select
© 2010 Colasoft. All rights reserved. Colasoft®, the Colasoft logo, Capsa® are among the trademarks or registered trademarks of the company in
the United States and/or other countries. All other trademarks are property of their respective owners.
99 / 133
Report Tab
Network Analyzer
Report View
The Report View presents all report items in different tables with statistic numbers and some with bar charts. You can switch
among the nodes in the Node Explorer window to get specific report to the selected node. The Report View has the following four
parts.
•
Report Title
•
Report Index
•
Report Body
•
Report Footer
Report Title
The Report Title has four components:
•
Title: Based on your customized title (See Report Settings) and the title of the selected node in the Node Explorer
window.
•
Company Name: Shows the name of your input company name (See Report Settings).
•
Logo: An image that works as a report logo (See Report Settings).
•
Time of Generation: Displays the time of generation (See Report Settings).
Report Index
What report items are available depend on your selection in the Node Explorer window. Only available report items show in the
Report Index. All the report items are listed below:
1.
Protocols Statistics
2.
Summary Statistics
3.
Top 10 Remote IP Address
4.
Top Application Protocols
5.
Top IP Address
6.
Top Physical Address
7.
Diagnosis Statistics
8.
Top Local IP Address
You can choose to enable or disable a report item, see Report Item Select for details. You can click any of the report items in the
index to move to the detail report in the Report Body.
Report Body
The Report Body is the main part of the report. It consists of multiple tables, statistics and bar charts. Some report item contains
many sub report items. With the bar charts, the report viewer can have a clear understanding of the percentage compilation. You
can click the TOP link to go back to the Report Index section.
Report Footer
The Report End is at the page footer. The specified author name (See Report Settings) will be displayed here.
Toolbar
The buttons on the toolbar are listed in the following table:
© 2010 Colasoft. All rights reserved. Colasoft®, the Colasoft logo, Capsa® are among the trademarks or registered trademarks of the company in
the United States and/or other countries. All other trademarks are property of their respective owners.
100 / 133
Alarm Explorer Window
Network Analyzer
Save As
Saves the report to file format: *.html, *.pdf and *.mht.
Options
Opens Report Settings dialog to customize reports.
Report Item Select
Opens the Report Item Select dialog to enable or disable report items.
Refresh
Click to refresh the report.
Report Item Select
The Report Item Select dialog lists all available report items. Only the items meaning to the selected node in the Node Explorer
window display. You can check the checkbox to enable a report item, or uncheck one to make it invisible in the report.
Alarm Explorer Window
Alarm Explorer Window provides real-time popup alert when an alarm rule is triggered. You also find triggered alarm number in
the Alarm Notification area on the right side of the Status Bar. You are almost allowed to create alarms from any object in
Explorer window and in tabs of the Main View. Read Creating and Editing Alarms to learn how to create and edit an alarm.
To open the Alarm Explorer window, follow any of the ways below:
•
Ribbon: Check the Alarm checkbox in the View tab of the Ribbon.
© 2010 Colasoft. All rights reserved. Colasoft®, the Colasoft logo, Capsa® are among the trademarks or registered trademarks of the company in
the United States and/or other countries. All other trademarks are property of their respective owners.
101 / 133
Alarm Explorer Window
Network Analyzer
•
Alarm Notifications Area: Press
in the Alarm Notifications Area on the right side of the Status
Bar.
The Alarm Explorer window has the following three parts:
•
Alarm List
•
Status Information
•
Toolbar
•
Alarm Notification Area
•
Alarm Pop-ups
For different network needs, not one alarm pre-specified by Colasoft Capsa, you need to create alarms on your own.
Alarm List
All the alarms are hierarchical grouped in three categories: Security, Performance and Fault. You will see all enabled alarms in
the list. You can double-click an alarm item to open the Network Profile window to manage the clicked alarm (See Network Profile Alarm to read in detail).
Click an alarm item, the Status Information pane displays the detail information of the alarm.
Status Information
The Status Information pane displays properties of your selected alarm in detail. Top 10 statistics displays in this pane if you
enabled Top 10 statistics of the selected alarm.
© 2010 Colasoft. All rights reserved. Colasoft®, the Colasoft logo, Capsa® are among the trademarks or registered trademarks of the company in
the United States and/or other countries. All other trademarks are property of their respective owners.
102 / 133
Alarm Explorer Window
Network Analyzer
You can click
to collapse an information group.
Toolbar
The toolbar is on the top of the Alarm Explorer window. It is described as follows:
The toolbar contains the following icons:
Add Alarm
Click to open the Make Alarm dialog to create a new alarm.
Show Switching
Click to switch layout between hierarchical and tiled style.
Show Alarm Instance
Click to display triggered alarms only.
Dismissed Alarm
Click to dismiss an triggered alarm.
Property
Click to open the Network Profile to manage the alarms (See Network Profile - Alarm for details).
You can open Alarm Settings by double-clicking an alarm.
Alarm Notification Area
When the Alarm Explorer window is closed, the Alarm Notification Area is used to display the real-time triggered alarm
information. The Alarm Notification Area is described below:
You can click the Alarm Explorer button to open the Alarm Explorer window.
The three bubbles represent three alarm types: Security, Performance and Fault.
© 2010 Colasoft. All rights reserved. Colasoft®, the Colasoft logo, Capsa® are among the trademarks or registered trademarks of the company in
the United States and/or other countries. All other trademarks are property of their respective owners.
103 / 133
Alarm Explorer Window
Network Analyzer
The digits following the bubbles show the number of triggered alarms of the alarm types.
Alarm Pop-ups
An alarm triggered or dismissed, a pop-up fades in to attract your attention and shows you the number of triggered alarms.
You can click the link: Click here to view alarms' log to view alarm logs (See Alarms to read about saving alarm logs).
Pop-up shows and keeps for only one second then fades away. The corresponding alarm bubble on the right side of the Status Bar
starts flashing when an alarm triggered.
Creating and Editing Alarms
Colasoft Capsa allows you create new alarms from any node in the Node Explorer window and any item in all tabs of the Main
View. A great many of options and thresholds enable you create useful and powerful alarms. You can also open Top 10 statistics in
an alarm. This page describes the following topics:
•
Make a new alarm
•
Edit an alarm
Make Alarm
To open the Make Alarm dialog, do any of the following ways:
•
In Node Explorer window: click
on the toolbar or right-click a node to open the context menu, and then choose Make
Alarm...
•
In Main View: Right-click an item to open the context menu, then choose Make Alarm... (if clickable)
The Make Alarm dialog has the following parts:
© 2010 Colasoft. All rights reserved. Colasoft®, the Colasoft logo, Capsa® are among the trademarks or registered trademarks of the company in
the United States and/or other countries. All other trademarks are property of their respective owners.
104 / 133
Alarm Explorer Window
Network Analyzer
•
General Information
sets the general information of the alarm. Including name, type, object and value type.
•
Counter
sets the statistic item of the alarm and measurement of the alarm. Different alarm object may have different statistics
group.
•
Event Condition
Sets the trigger threshold of the alarm.
•
Dismiss Condition
Sets the threshold that under what condition this alarm will be dismissed.
•
Top 10 Traffic Stat
This functionality enabled, the alarm will make statistics on the chosen top 10s. Recording these top ten statistics are
useful when the alarm triggered. Different alarm object may have different traffic statistic items.
© 2010 Colasoft. All rights reserved. Colasoft®, the Colasoft logo, Capsa® are among the trademarks or registered trademarks of the company in
the United States and/or other countries. All other trademarks are property of their respective owners.
105 / 133
Alarm Explorer Window
Network Analyzer
Edit Alarm
To edit an alarm, do any of the following ways:
•
Click the Alarm Setting icon on the Analysis tab of the Ribbon to open the Network Profile dialog. Select an alarm, and
then click the Properties... button on the right side of the dialog.
•
Double-click an alarm item in the Alarm List of the Alarm Explorer window to open the Network Profile dialog. Then
follow the steps of the fist way.
•
Click the Property icon on the toolbar of the Alarm Explorer window to open the Network Profile dialog. Then follow the
steps of the first way.
The Edit Alarm dialog appears as follows:
You can only change Alarm Type, Severity, Value Type, Trigger Condition and Disable Condition in Alarm Settings dialog.
Other options are unalterable. If you need to modify an alarm, please delete it and create a new one.
© 2010 Colasoft. All rights reserved. Colasoft®, the Colasoft logo, Capsa® are among the trademarks or registered trademarks of the company in
the United States and/or other countries. All other trademarks are property of their respective owners.
106 / 133
Analysis Profile
Network Analyzer
Analysis Profile
Analysis Profile Overview
Colasoft Capsa defines analysis profiles as containers of different analysis modules. This structure can make sure every analysis
profile provides flexible, extensible and effective analysis performance.
Flexible
Combining different modules together, network engineers can easily get a wide variety of statistics data of
their entire network and to find out network anomalies.
Extensible
To follow the pace of network development, new analysis modules can be quickly developed to meet users'
specific demands, and users only need to purchase the modules they need.
Large Traffic
An analysis profile project only captures and analyzes those necessary packets, which saves system
resources and improves analysis efficiency and performance greatly.
Built-in Analysis Profiles
Colasoft Capsa integrates seven analysis profiles: DNS Analysis, Email Analysis, FTP Analysis, HTTP Analysis, Full Analysis
and Traffic Monitor. The first four analysis profiles are designed to analyze on aplication level and the last three for accuracy and
performance analysis.
DNS Analysis
To analyze DNS applications, diagnose DNS applications errors and record DNS application logs.
Email Analysis
To analyze Email applications (based on POP3/SMTP), monitor Email content and attatchments and
log Email transactions.
FTP Analysis
To analyze FTP applications (based on TCP port 21 and 20) and log FTP transactions.
HTTP Analysis
To analyze Web applications (based on HTTP), record clients' web activities and log web
communications.
Full Analysis
•
To accurately analyze objects in the network including physical addresses, IP addresses,
protocols, traffics and every object's traffic.
•
Traffic Monitor
To accurately diagnose network errors and provide customized graphs and reports.
To pursue high efficient analysis of main objects including physical addresses, IP addresses, traffics
and every object's traffic.
Security Analysis
To aim at safety analysis. To analyze worms, Trojans and attacks, etc.
Read Managing Analysis Profiles to learn how to create or edit an analysis profile.
Read Start Page to learn how to use analysis profiles to start an analysis project.
Managing Analysis Profiles
Analysis Profiles consist of different analysis modules. Colasoft Capsa allows you to combine different analysis modules to create
a new analysis profile. Analysis Profile only provides statistics of the selected analysis modules. Thus it reduce the total volume of
© 2010 Colasoft. All rights reserved. Colasoft®, the Colasoft logo, Capsa® are among the trademarks or registered trademarks of the company in
the United States and/or other countries. All other trademarks are property of their respective owners.
107 / 133
Analysis Profile
Network Analyzer
the statistic items in the analysis project. You will save your time in finding useful statistics among the statistic items.
You can conduct creating, editing, copying and deleting analysis profiles on the Start Page. Right-clicking an analysis profile, you
will see a context menu with the following items:
•
New: Click to create a new analysis profile.
•
Duplicate: Click to copy a duplication of the highlighted analysis profile.
•
Edit: Click to edit the highlighted analysis profile.
•
Delete: Click to delete the highlighted analysis profile.
Analysis Profile Settings
The New Analysis Profile Settings dialog appears as follows:
It contains five parts:
•
Name: Enter a name for the new analysis profile.
•
Description: Input text to distinguish the analysis profile from others.
•
Profile Icon: Click the Change button to select an image for the analysis profile.
•
Analysis Module: Check the analysis modules that you want to use in the analysis profile.
•
Buttons: Click Next to open the Analysis Profile Options window, and click Cancel to close the dialog.
© 2010 Colasoft. All rights reserved. Colasoft®, the Colasoft logo, Capsa® are among the trademarks or registered trademarks of the company in
the United States and/or other countries. All other trademarks are property of their respective owners.
108 / 133
Tools
Network Analyzer
Tools
The Tools tab of the Ribbon contains the tools settings and invoking commands. This tab has the following icons:
•
Tool Settings: Click to open the External Tools Management dialog to manage the external tools.
•
Ping: Click to launch Colasoft Ping Tool.
•
MAC Scanner: Click to launch Colasoft MAC Scanner.
•
Packet Player: Click to launch Colasoft Packet Player.
•
Packet Builder: Click to launch Colasoft Packet Builder.
The Tools tab shows as follows:
Tool Settings
In addition to the four tools referred previous, users can customize to add other Windows applications and tools into Colasoft Capsa
with the External Tools Management. You can not only invoke but also execute the added applications and tools via Colasoft
Capsa.
To open External Tools Management dialog, click Tool Settings in Tools tab of the Ribbon.
The External Tools Management dialog appears.
© 2010 Colasoft. All rights reserved. Colasoft®, the Colasoft logo, Capsa® are among the trademarks or registered trademarks of the company in
the United States and/or other countries. All other trademarks are property of their respective owners.
109 / 133
Tools
Network Analyzer
You can click New to attach new tools, Delete to delete your selected Tool in Left pane. And also you can rearrange the listed items
order by Move up and Move Down.
To demonstrate, you can follow the steps below to attach the Tracert command of Windows into Colasoft Capsa.
1. Click the New... button, the Attribute pane appears.
2. Enter Tracert in Title textbox as its name.
3. Enter the path of the program in Command: C:\WINDOWS\system32\tracert.exe, or click
4. Click
to choose the path.
after Parameters textbox. The External Tools Parameter dialog appears.
5. Click the Macro >> button to view the details.
© 2010 Colasoft. All rights reserved. Colasoft®, the Colasoft logo, Capsa® are among the trademarks or registered trademarks of the company in
the United States and/or other countries. All other trademarks are property of their respective owners.
110 / 133
Tools
Network Analyzer
Colasoft Capsa lists the parameters IP Address, Physical Address, Port and Protocol in the window. You can add a parameter by
selecting it's name and clicking the Insert button. If the parameters did not list, you can enter the parameters into the upper window
manually, like as -d, -h, -j and -w in Tracert command. Every parameter should be separated with a blank space.
6. Choose the IP Address and click Insert and then click OK to save the settings and back to the External Tools Management
dialog.
Now you can find Tracert icon in Tools tab of the Ribbon. Click it to open tracert command.
In addition, you can execute to trace an IP with Colasoft Capsa conveniently. Select a packet in the Packet tab and right click,
choose the Tracert command. The source and destination IP address of the selected packet will be listed out, you can trace either
one by its name or both by the All command.
Now let's trace 207.46.26.109 by click its name. System will trace the this IP address and display the details of the execution in the
popup window.
© 2010 Colasoft. All rights reserved. Colasoft®, the Colasoft logo, Capsa® are among the trademarks or registered trademarks of the company in
the United States and/or other countries. All other trademarks are property of their respective owners.
111 / 133
Tools
Network Analyzer
Colasoft Ping Tool
Colasoft Ping Tool is a powerful graphic ping tool, it supports ping multiple IP addresses at the same time, and compares response
time in a graphic chart.
To start Colasoft Ping Tool, do one of the followings:
Click the Ping icon in Tools tab of the Ribbon (figure below).
Choose Start > All Programs > Colasoft Capsa 7.1 > Capsa 7.0 Toolset > Ping Tool.
Choose Start > Run, enter "cping" and click OK.
The Colasoft Ping Tool window appears.
© 2010 Colasoft. All rights reserved. Colasoft®, the Colasoft logo, Capsa® are among the trademarks or registered trademarks of the company in
the United States and/or other countries. All other trademarks are property of their respective owners.
112 / 133
Tools
Network Analyzer
Colasoft Capsa is very intelligent to let you ping either one single IP address (domain name) or multiple IP addresses (domain
names). Enter IP addresses or domain names (multiple items be separated by comma), click Start Ping to start.
Ping a single domain name:
© 2010 Colasoft. All rights reserved. Colasoft®, the Colasoft logo, Capsa® are among the trademarks or registered trademarks of the company in
the United States and/or other countries. All other trademarks are property of their respective owners.
113 / 133
Tools
Network Analyzer
Ping multiple domain names:
© 2010 Colasoft. All rights reserved. Colasoft®, the Colasoft logo, Capsa® are among the trademarks or registered trademarks of the company in
the United States and/or other countries. All other trademarks are property of their respective owners.
114 / 133
Tools
Network Analyzer
By default, Colasoft Ping Tool will keep pinging the target hosts until you click Stop Ping to make it stop.
You can view historical charts and save the charts to a *.bmp format file. With this tool, users can ping the IP addresses of captured
packets in Colasoft Capsa conveniently, including resource IP, destination IP or both of them.
For a clear view, please move your mouse cursor to the graph. Colasoft Ping tool will highlight the specific node and node border
upon it. An annotation will automatically popup which contains the domain name and response time. The response time in the
annotation will be a range of time when your mouse cursor puts on the grid, while it will be a time if your mouse cursor puts on the
grid line.
Ping Options
Users can custom own parameters of the Ping command. Click Options¡ in the Options menu to open the dialog and modify the
listed parameters.
The below figure is the parameter setting by default:
© 2010 Colasoft. All rights reserved. Colasoft®, the Colasoft logo, Capsa® are among the trademarks or registered trademarks of the company in
the United States and/or other countries. All other trademarks are property of their respective owners.
115 / 133
Tools
Network Analyzer
The Ping Options has the following settings:
•
Packet Size
Sets the size of ICMP packet when execute Ping command. The packet size range from 1 to 1024 bytes.
•
Packet Time-To-Live
Indicates how many more hops this packet should be allowed to make before being discarded or returned, range from 1 to
255.
•
Ping Timeout
The amount of time to allow for a response from the peer equipment, range from 100 to 2000 millisecond.
•
Delay Between PINGs
The interval time between two pings, range from 100 to 10000 millisecond.
•
Address transmitted
The amount of host or domain resolution, range from 1 to 5.
•
Poll Interval
The refresh interval of graph, range from 100 to 5000.
•
Load Default
Clicks this button to reset all parameters to default position.
Colasoft MAC Scanner
Colasoft MAC Scanner is a scan tool used for scanning IP addresses and MAC addresses in a local network. It sends ARP queries
© 2010 Colasoft. All rights reserved. Colasoft®, the Colasoft logo, Capsa® are among the trademarks or registered trademarks of the company in
the United States and/or other countries. All other trademarks are property of their respective owners.
116 / 133
Tools
Network Analyzer
to specified subnet, and listens to the ARP responses to get IP addresses and MAC addresses, very fast scanning, you can also
change the number of scanning thread to get better efficiency.
There are two useful new features added.
Database: lets you save your scan result here for later IP address and MAC address comparison.
Add to Name Table With: allows you add IP address, MAC address or both to Name Table directly.
To start Colasoft MAC Scanner, do one of the followings:
Choose Tools tab of the Ribbon, click MAC Scanner icon in the Tools group (figure below).
Choose Start > All Programs > Colasoft Capsa 7.1 > Capsa 7.0 Toolset > MAC Scanner.
Choose Start > Run, enter "cmac" and click OK.
The Colasoft MAC Scanner appears.
Colasoft MAC Scanner contains the following components:
Menu
Contains all the items on toolbar, commands to control the window and help.
Toolbar
© 2010 Colasoft. All rights reserved. Colasoft®, the Colasoft logo, Capsa® are among the trademarks or registered trademarks of the company in
the United States and/or other countries. All other trademarks are property of their respective owners.
117 / 133
Tools
Network Analyzer
Contains shortcuts of the most common used commands. And allows you to customize.
Scan Network View
Scan Network View will display the scanned results, including IP address, MAC address, Host Name and Manufacture in the list. It
will group all IP addresses according to MAC address if a MAC address configured multiple IP addresses. The scanned results can
be exported into .txt file for future reference.
Database View
Database View saves your scan result to database, which is used by Scan Network View to inform you the discrepancies, if any,
when you execute another scan later on.
MAC Scanner - Scan Network
Setting
Users can custom own scan process by clicking the Setting button to open the Setting dialog.
You can custom the subsequent threads, ranging from 1 to 100. It will take more time to finish the scan operation if the subsequent
thread is more less.
1 - Colasoft MAC Scanner will scan all address one after another.
10 - Colasoft MAC Scanner will generate 10 threads and each will scan 25 addresses synchronously.
Default scan threads number is 20.
Start Scan
Next step after setting scan threads number is to click Local Subnet combobox to select a subnet segment item. Click Start to
execute scanning.
You may click Pause to pause or Stop to stop in a scan process.
© 2010 Colasoft. All rights reserved. Colasoft®, the Colasoft logo, Capsa® are among the trademarks or registered trademarks of the company in
the United States and/or other countries. All other trademarks are property of their respective owners.
118 / 133
Tools
Network Analyzer
Scan Network contains six columns, e.g. IP Address, MAC Address, Host Name, Workgroup, Manufacturer and Compare Result.
Compare Result is to display the results of comparing new scanned result with the records in database.
MAC Scanner sums up all the records number and displays the number in status bar.
Scan Network view contains the following columns:
Column
Description
IP Address
Found IP Address.
MAC Address
The MAC address of the IP address.
Host Name
The host name of the IP address.
Workgroup
The group name of the IP address.
Manufacturer
The manufacturer of the host's adapter.
Compare Result
Result of comparing new scan result with records in database.
MAC Scanner automatically compares the scan results with the records in database and display comparison results in different
colors.
•
Black: Scan result accords with the record in database.
•
Blue: New IP address or MAC address (scan result finds no same record in database).
•
Red: Scan result does not accord with the record in database. MAC Scanner displays comparison result in detail. You can
double click the item to see the detailed result in a dialog.
© 2010 Colasoft. All rights reserved. Colasoft®, the Colasoft logo, Capsa® are among the trademarks or registered trademarks of the company in
the United States and/or other countries. All other trademarks are property of their respective owners.
119 / 133
Tools
Network Analyzer
Toolbar
The following table lists all items on toolbar:
Item
Description
Setting
Sets Scan Threads Number between 1 to 100. 20 by default.
Local Subnet
Selects a subnet segment to execute scan.
Start (F5)
Starts to scan a network.
Pause (F7)
Pauses the scan operation for a while.
Stop (F8)
Stops the scan operation.
Export All
Exports the whole scan results to a *.cscntab, *.txt and *.csv format file.
Export Selected
Exports the selected item(s) of the scan results to a *.cscntab, *.txt and *.csv format file.
Add to Database
Adds the selected item(s) to database.
Add to Name Table with
Adds the selected item(s) to Colasoft Capsa Name Table.
Copy
Copies the selected item(s) to clipboard.
Delete
Deletes the selected IP addresses from the results list.
Find
Finds a specific item in the san results.
MAC Scanner - Database
Colasoft MAC Scanner supports adding the scan results to a database and allows you do more (add attributes, automatic
comparison) with the database records. Every time you execute a new scan, MAC Scanner will compare scan results with the
records in database. If there is any discrepancy, MAC Scanner will inform you in Scan Network view.
© 2010 Colasoft. All rights reserved. Colasoft®, the Colasoft logo, Capsa® are among the trademarks or registered trademarks of the company in
the United States and/or other countries. All other trademarks are property of their respective owners.
120 / 133
Tools
Network Analyzer
The following table lists all eight columns in database.
Column
Description
IP Address
Records IP address. Double-click to modify.
MAC Address
Records MAC address. Double-click to modify.
Host Name
Records host's name. Double-click to modify.
Workgroup
Records the host's group name. Double-click to modify.
User Name
Double-click to enter its user name.
Location
Double-click to enter its location.
Manufacturer
Records the manufacturer of the host's adapter.
Comment
Double-click to enter your comment.
The following table describes all items on toolbar.
Item
Description
Import
Import records from a database file.
Export All
Export all database records to your disk, supported format: *.csmdat, *.cscntab, *.csv and *.txt.
Export Selected
Export selected database records to your disk, supported format: *.csmdat, *.cscntab, *.csv and
*.txt.
© 2010 Colasoft. All rights reserved. Colasoft®, the Colasoft logo, Capsa® are among the trademarks or registered trademarks of the company in
the United States and/or other countries. All other trademarks are property of their respective owners.
121 / 133
Tools
Network Analyzer
Add
Add new record to database manually.
Add to Name Table
Add the records to Colasoft Capsa Name Table.
With
Copy
Copy selected records to clipboard.
Delete
Delete selected records.
Find
Search in records.
Properties
Show the properties of a record in Record Properties dialog.
Colasoft Packet Player
Colasoft Packet Player is a replay tool which allows you to open captured packet files and playback to the network. Colasoft Packet
Player supports many packet file formats created by many sniffer software, such as Colasoft Capsa, Ethereal, Network General
Sniffer and WildPackets EtherPeek/OmniPeek etc, it also support burst mode and loop sending feature.
To start Colasoft Packet Player, do one of the following:
Click Packet Player in Tools tab of the Ribbon (figure below).
Choose Start > All Programs > Colasoft Capsa 7.1 > Capsa 7.0 Toolset > Packet Player.
Choose Start > Run, enter "pktplayer" and click OK.
The Colasoft Packet Player appears as follows:
© 2010 Colasoft. All rights reserved. Colasoft®, the Colasoft logo, Capsa® are among the trademarks or registered trademarks of the company in
the United States and/or other countries. All other trademarks are property of their respective owners.
122 / 133
Tools
Network Analyzer
You can find the following items in Colasoft Packet Player
Adapter
You need to select one adapter for sending packets for no adapter selected by default. Click Select... to open the Select Adapter
dialog, choose an adapter from the combo box. The window under the combo box will display the detailed information of the
selected adapter.
© 2010 Colasoft. All rights reserved. Colasoft®, the Colasoft logo, Capsa® are among the trademarks or registered trademarks of the company in
the United States and/or other countries. All other trademarks are property of their respective owners.
123 / 133
Tools
Network Analyzer
Packet File
Defines the packet file you want to send. The file formats that Colasoft Packet Player support are listed below. You can add multiple
files by clicking the Add button. Users also can replay a packet file have been sent out before from the combo box.
•
Colasoft Capsa 5.0 Packet File (*.cscpkt)
•
Colasoft Capsa 5.0 Raw Packet File (*.rawpkt)
•
Colasoft Capsa 7.0 Packet File (*.cscpkt)
•
Accellnt 5Views Packet File (*.5vw)
•
EthePeek Packet File(V7) (*.pkt)
•
EthePeek Packet File(V9) (*.pkt)
•
HP Uinx Nettl Packet File (*.TRCO;TRC1)
•
libpcap(tcpdump,Ethereal,etc.) (*.cap)
•
Microsoft Network Mintor2.x (*.cap)
•
Novell LANalyer (*.tr1)
•
Network Instuments Observer V9.0 (*.bfr)
•
NetXRay2.0 and WINDWS Sniffer (*.cap)
•
Sun_Snoop (*.snoop)
•
Visual Network Traffic Capture (*.cap)
You may use the Clear button to clear all the items in packet file list. To delete some items in the list, choose them and press Delete
Key to delete them.
Bust Mode
Checks this option, Colasoft Packet Builder will send packets one after another without intermission. If you want to send packet as
the original delta time, please do not check this option.
Loop Sending
Defines the repeated times of the sending execution, one time in default. Please enter zero if you want to keep sending packets
until pause or stop it manually.
Delay Between Loops: Appoints the interval between every loop if you defined the loop times more than one. Colasoft Packet
© 2010 Colasoft. All rights reserved. Colasoft®, the Colasoft logo, Capsa® are among the trademarks or registered trademarks of the company in
the United States and/or other countries. All other trademarks are property of their respective owners.
124 / 133
Tools
Network Analyzer
Builder will send without interval between every loop in default.
Ignore any file error
The Packet player will skip the file error in any packet file and keep playing.
Current File
Displays the file name with file path that is sending.
Packets Sent
Shows the number of packets have been sent successfully. Colasoft Packet Builder will display the the packets sent unsuccessfully
too if there is a packet did not sent out.
Status
Displays tips or status of your actions.
Progress
The process bar simply presents an overview of the sending process you are engaged in at the moment.
Replay Packets
Sets the parameters as the below figure. It means theBitTorrent.cscpkt, POP3.cscpkt and http.rawpkt packet files will be replayed
100 times from the Realtek RTL8168C/8111C PCI-E Gigabit Ethernet NIC with 1000 milliseconds delay between every loop, and
the packets will be replayed in the time interval as they were recorded.
© 2010 Colasoft. All rights reserved. Colasoft®, the Colasoft logo, Capsa® are among the trademarks or registered trademarks of the company in
the United States and/or other countries. All other trademarks are property of their respective owners.
125 / 133
Tools
Network Analyzer
Then, click the Play button to start replay as figure below:
© 2010 Colasoft. All rights reserved. Colasoft®, the Colasoft logo, Capsa® are among the trademarks or registered trademarks of the company in
the United States and/or other countries. All other trademarks are property of their respective owners.
126 / 133
Tools
Network Analyzer
Colasoft Packet Builder
Colasoft Packet Builder is useful tool used for creating custom network packets, you can use this tool to check your network
protection against attacks and intruders. Colasoft Packet Builder provides you very powerful editing feature, besides common HEX
editing raw data, it featuring a Decoding Editor which allows you edit specific protocol field value much easier. In addition to building
packets, Colasoft Packet Builder also supports saving packets to packet files and sending packets to network.
To start Colasoft Packet Builder, do one of the followings:
Click Packet Builder icon in Tools tab of the Ribbon (figure below).
Choose Start > All Programs > Colasoft Capsa 7.1 > Capsa 7.0 Toolset > Packet Builder.
Choose Start > Run, enter "pktbuilder" and click OK.
© 2010 Colasoft. All rights reserved. Colasoft®, the Colasoft logo, Capsa® are among the trademarks or registered trademarks of the company in
the United States and/or other countries. All other trademarks are property of their respective owners.
127 / 133
Tools
Network Analyzer
The Colasoft Packet Builder window appears.
Colasoft Packet Builder contains three panes in main view.
•
Packet List
•
Decode Editor
•
Hex Editor
The last two panes collaborate with the Packet List pane. Once a packet selected, Decode Editor and Hex Editor decode the packet
and you can just edit the packet in these two panes.
To customize the layout of the three panes, just drag their heads to move.
You can use Colasoft Packet Builder to:
Add or insert new packets
Simply you can add or insert packets from Packet tab of Colasoft Capsa or packet templete (ARP, IP, TCP and UDP).
Edit packets
Just click the item or digit to edit packets in Decode Editor pane and Hex Editor pane.
Send packets
© 2010 Colasoft. All rights reserved. Colasoft®, the Colasoft logo, Capsa® are among the trademarks or registered trademarks of the company in
the United States and/or other countries. All other trademarks are property of their respective owners.
128 / 133
Tools
Network Analyzer
Click the Send or Send All button on toolbar to tramsmit the created packets to network.
Save your packets to disk is also important. You can click Export to save selected packets or all packets to your machine. Now only
*.cscpkt format files is supported.
Add packets
There are two ways to create a packet - Add and Insert. The difference between these two ways is the new added packet's position
in the Packet List. The new packet will be listed as the last packet in the list if added, whilethe new packet will be listed after the
current packet if inserted.
Click Add or Insert, the Add Packet dialog appears as follows.
There are two options in this dialog:
•
Select Template: To create a packet, you need to specify the packet type by selecting the name from the Select Template
combo box first. The templates contain several kinds of common-used packet - Ethernet Packet, ARP Packet, IP Packet,
TCP Packet and UDP Packet.
•
Delta Time: Then defines the delta time for the new packet. Delta time means the length of time between the new packet
and the last packet in the Packet List, 100 millisecond in default. If you are inserting a packet, the delta time means the
length of time between the current packet.
If there are no packets in the Packet List, this feature will not be enabled
The supported import file formats are listed below:
•
Colasoft Capsa 5.0 Packet File (*.cscpkt)
•
Colasoft Capsa 5.0 Raw Packet File (*.rawpkt)
•
Colasoft Capsa 7.0 Packet File (*.cscpkt)
•
Accellnt 5Views Packet File (*.5vw)
•
EthePeek Packet File(V7) (*.pkt)
•
EthePeek Packet File(V9) (*.pkt)
•
HP Uinx Nettl Packet File (*.TRCO;TRC1)
•
libpcap(tcpdump,Ethereal,etc.) (*.cap)
•
Microsoft Network Mintor2.x (*.cap)
•
Novell LANalyer (*.tr1)
•
Network Instuments Observer V9.0 (*.bfr)
•
NetXRay2.0 and WINDWS Sniffer (*.cap)
© 2010 Colasoft. All rights reserved. Colasoft®, the Colasoft logo, Capsa® are among the trademarks or registered trademarks of the company in
the United States and/or other countries. All other trademarks are property of their respective owners.
129 / 133
Tools
Network Analyzer
•
Sun_Snoop (*.snoop)
•
Visual Network Traffic Capture (*.cap)
Another way to create packet is to send packets from Packet tab of a Colasoft Capsa project.
You may click Move Up or Move Down to rearrange the packets order in Packet List.
Packet Builder - Edit Packets
In addition to create packets, Colasoft Packet Builder allows you to edit the decoding information in the two editors - Decode Editor
and Hex Editor. The feature of editing decoding information of packet is unique to Colasoft Packet Builder, as it is not supported by
others packet builder program.
Decode Editor
Users can edit the packet decoding field by double-clicking the decoding field. The corresponding field in the Hex Editor and
Packet List will change with the modification of the decoding.
Packet Builder will validate the entries in the editor. It will popup a window to inform you if the entry is incorrect and undo the
modification. You may save the incorrect entry with the click the Esc key if you confirm the entries, though.
Hex Editor
The Hex editor displays the actual packet contents in raw hexadecimal on the left and its ASCII equivalent on the right. For you
© 2010 Colasoft. All rights reserved. Colasoft®, the Colasoft logo, Capsa® are among the trademarks or registered trademarks of the company in
the United States and/or other countries. All other trademarks are property of their respective owners.
130 / 133
Tools
Network Analyzer
convenience, both the Hex and ASCII are changeable. The Hex used for modifying the hexadecimal code while the ASCII used for
changing the packet text.
Packet Builder enables Checksum by default and entries the calculated checksum automatically. You can click
to
disable auto calcuoate checksum and enter your value manually.
Packet Builder - Send Packets
In addition to build packet, Colasoft Packet Builder supports sending packet too. This feature allows users to define many
parameters than the Send Packet feature in the Packet tab, such as define the interval between every packet and the delay
between loops.
Click send or Send All to open the Send Packet dialog.
You need to set the following options:
Select Adapter
© 2010 Colasoft. All rights reserved. Colasoft®, the Colasoft logo, Capsa® are among the trademarks or registered trademarks of the company in
the United States and/or other countries. All other trademarks are property of their respective owners.
131 / 133
Tools
Network Analyzer
You need to select one adapter for sending packets for no adapter selected by default. Click Select... to open the Select Adapter
dialog, choose an adapter from the combo box. The window under the combo box will display the detailed information of the
selected adapter.
Burst Mode
Check this option, Colasoft Packet Builder will send packets one after another without intermission. If you want to send packet as
the original delta time, please do not check this option.
Loop Sending
Defines the repeated times of the sending execution, one time in default. Please enter zero if you want to keep sending packets
until pause or stop it manually.
Delay Between Loops
Appoints the interval between every loop if you defined the loop times more than one. Colasoft Packet Builder will send without
interval between every loop by default.
The pane below shows the Sending Information when you start to send packets.
© 2010 Colasoft. All rights reserved. Colasoft®, the Colasoft logo, Capsa® are among the trademarks or registered trademarks of the company in
the United States and/or other countries. All other trademarks are property of their respective owners.
132 / 133
Tools
Network Analyzer
Total Packets: Displays the number of sending packets. For example, 4*5 means four packets are selected and each one will be
sent five times. So Colasoft Packet Builder totally sent out 20 packets.
•
Packets Sent: Shows the number of packets have been sent successfully. Colasoft Packet Builder will display the packets
sent unsuccessfully too if there is a packet did not sent out.
•
Process: The process bar simply presents an overview of the sending process you are engaged in at the moment.
© 2010 Colasoft. All rights reserved. Colasoft®, the Colasoft logo, Capsa® are among the trademarks or registered trademarks of the company in
the United States and/or other countries. All other trademarks are property of their respective owners.
133 / 133