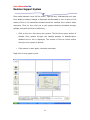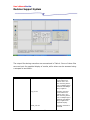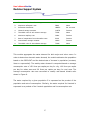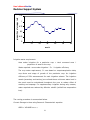
1
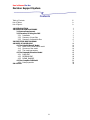
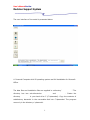
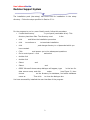
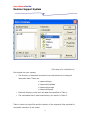
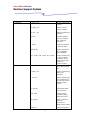
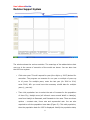
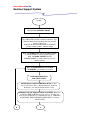
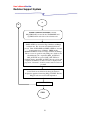
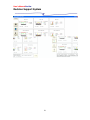
h
FMWR-IUCN-NCF KOMADUGU YOBE BASIN PROJECT 2006
USER’S MANUAL
for
The Decision Support System (DSS)
Cha
d
________________________________________________________________________
Niger
river yobe
om
K
ug
ad
u
na
Ga
nga
Bu
R.
Nigeria
Cam
eroo
n
a
eji
ad
.H
R
e
'ar
ma
Ja
R.
Annex 1 to the
Water Audit for Komadugu Yobe Basin
Afremedev Consultancy Services Limited
Plot 5, A close off 45 Road, Gwarimpa Housing Estate,
PO Box 9155 Wuse, Abuja.
Tele: 09-671 9220
Fax: 09-523 8343
Email: [email protected]
http://www.afremedev.com
May 2006
User’s Manual for the
Decision Support System
ANNEX 1: USER’S MANUAL FOR THE DECISION SUPPORT SYSTEM
FOR THE KOMADUGU YOBE BASIN
Copyright: FMWR-IUCN-NCF Komadugu Yobe Basin Project.
This publication was commissioned as part of the
FMWR-IUCN-NCF Komadugu Yobe Basin Project
and undertaken by Afremedev Consultancy Services Limited.
The views expressed in this publication do not necessarily
reflect official policies. This document has been produced
with the intention of promoting discussion among key
stakeholders in the water sector in Komadugu Yobe Basin.
Please reference the report as: KYBP 2006. User’s Manual for the Decision Support System for the KYB
by Afremedev Consultancy Services Limited for FMWR-IUCN-NCF Komadugu Yobe Basin Project, Kano, Nigeria.
ii
User’s Manual for the
Decision Support System
Contents
Table of Contents
List of Tables
List of Figures
iii
iv
iv
1.0 INTRODUCTION
2.0 INSTALLATION PROCEDURE
2.1 System Requirement
2.2 Procedure of Using the DSS
2.2.1 Installation
2.2.2 Summary of input files
2.2.3 Summary of executable files
3.0 EXECUTING DSS PROGRAM
4.0 BASIS OF MODELLING
4.1 The Rainfall-Runoff Model
4.1.1 Basis of the rainfall-runoff model
4.1.2 Structure of the model
4.1.3 The model parameters
4.2 The Demand-Allocation Model
4.2.1 DAGR.EXE
4.2.2 RESERVOI.EXE
4.2.3 DOWN_DAM.EXE
4.3 The Complete DSSModel
4.3.1 Data preparation
5.0 OUTPUT
1
1
1
1
2
3
6
7
14
14
14
14
16
16
16
18
20
20
20
26
iii
User’s Manual for the
Decision Support System
List of Tables
Table 1: Data files for the DSS
Table 2: Executable files for the DSS
Table 3: Standard for providing rainfall file (Tiga Unit) for Optional Code
Table 4: Output files from the program
Table 5: The model parameters
3
6
10
13
16
List of Figures
Figure 1: The Interface of the model
Figure 2: Selection of Database Name
Figure 3: Welcome interface
Figure 4: Module window
Figure 5: Population dialogue window
Figure 6: Summary of demand and supply behind decision dialogue
Figure 7: Dialogue window for selecting surface water rate
Figure 8: Variation in domestic water demand in KYB
Figure 9: Flow Structure of the DSSModel
Figure 10: Flow along KYB river system (wet year, full development at
Kawali Irrigation Scheme
iv
1
3
8
8
10
12
12
17
22
27
User’s Manual for the
Decision Support System
1.0 INTRODUCTION
The user interface of the model is presented below.
Figure 1: The Interface of the model
2.0 INSTALLATION PROCEDURE
2.1 System Requirement
A Personal Computer with XP operating system and full installation for Microsoft
Office.
2.2 Procedure of Using the DSS
The data files and installation files are supplied in a directory ‘backup-dss’. The
directory has two sub-directories: dssmodel and dss-setup. Create the
directory dssmodel in your hard drive C (C:\dssmodel). Copy the contents of
subdirectory dssmodel in the removable disk into C:\dssmodel. The program
runs only in the directory c:\dssmodel.
1
User’s Manual for the
Decision Support System
The installation pack (dss-setup) has three files for installation in the setup
directory. Follow the steps specified in Section 2.2.1.
2.2.1 Installation
Step 1: Installation of user friendly environment
For the program to run in a user friendly mode, follow this procedure:
•
Locate the directory ‘dss-setup’ in your pack (removable drive). This
directory has three files. The directory must not be in the c:\dssmodel
•
click setup and follow the installation procedure
•
click ok to continue or exit to terminate installation
•
click change directory, and change directory to c:\dssmodel which you
have created.
•
Click setup icon and answer yes to the subsequent questions.
•
Go to control panel – click start and select control panel
•
double click administrative tools
•
double click Data Sources ODBC
•
Select system DSN and click Add
•
Select Microsoft access driver and click finish
•
ODBC Microsoft Access setup dialogue will appear, type gis in the box for
data source name, and click select under database (see Figure 2), then
choose c:\dssmodel as the directory for database, and select database
name as gis.mdb. Then click ok to close the dialogue box.
You have successfully installed the user interface of the program.
2
User’s Manual for the
Decision Support System
Figure 2: Selection of Database Name
Step 2: Check the data files in C:\dssmodel (This step is for verification of
files copied into your system)
•
The directory c:\dssmodel must have four sub-directories to keep the
catchment data. These are:
c:\dssmodel\tiga
c:\dssmodel\challawa
c:\dssmodel\unregul
c:\dssmodel\bunga
•
Each sub-directory must have the data files specified in Table 1.
•
The executable files in each sub-directory are shown in Table 2.
2.2.2 Summary of input files
Table 1 shows the input files and the location of the respective files required for
successful execution of the model.
3
User’s Manual for the
Decision Support System
Table 1: Data files for the DSS
Location
C:\dssmodel
File name
m_hade_r.txt
Monthly rainfall
(mm) for Hadejia
m_bun_r.txt
Monthly rainfall (mm)
for Bauchi
popd.txt
Population data for
Kano City, Hadejia
area, Yobe area,
Borno area
A_pd.txt
Livestock population
in Yobe sub-basin
HNW_D.dat
Weekly requirement
Mm3) for HadejiaNguru Wetlands
Kan_us.dat
C:\dssmodel\tiga
Comment
Monthly rainfall (mm)
for Kano
m_kano_r.txt
had_us.dat
In_disch.txt
bun_us.dat
Monthly rainfall (mm)
for Kano, hadejia
and Bauchi up to a
maximu of 10 years
required for optional
climatic scenario
Historical monthly
inflow (Mm3) to Tiga
lake
M_catch_r.txt
Monthly rainfall (mm)
data for the
catchment
R_user.txt
Monthly rainfall (mm)
up to a maximum of
10 years required for
optional climatic
scenario
Re_tiga.dat
Characteristic data
for the reservoir
Ecol_q.dat
Average weekly
ecological release
requirement (Mm3)
cat-par.dat
Range of values for
catchment
parameters in
rainfall-runoff module
tempe.txt
Monthly temperature
4
User’s Manual for the
Decision Support System
Location
C:\dssmodel\challawa
C:\dssmodel\unregul
C:\dssmodel\bunga
File name
In_disch.txt
Comment
(oC) and relative
humidity (%) for the
catchment
Historical monthly
inflow (Mm3) to
Challawa reservoir
M_catch_r.txt
Monthly rainfall (mm)
data for the
catchment
R_user.txt
Monthly rainfall (mm)
up to a maximum of
10 years required for
optional climatic
scenario
Re_chal.dat
Characteristic data
for the reservoir
Ecol_q.dat
Average weekly
ecological release
requirement (Mm3)
cat-par.dat
Range of values for
catchment
parameters in
rainfall-runoff module
tempe.txt
Monthly temperature
(oC) and relative
humidity (%) for the
catchment
Monthly rainfall (mm)
data for the
catchment
M_catch_r.txt
R_user.txt
Monthly rainfall (mm)
up to a maximum of
10 years required for
optional climatic
scenario
tempe.txt
Monthly temperature
(oC) and relative
humidity (%) for the
catchment
Historical monthly
inflow (Mm3) to
Bunga reservoir
In_disch.txt
M_catch_r.txt
Monthly rainfall (mm)
data for the
catchment
R_user.txt
Monthly rainfall (mm)
up to a maximum of
5
User’s Manual for the
Decision Support System
Location
File name
Comment
10 years required for
optional climatic
scenario
Re_bung.dat
Characteristic data
for the reservoir
Ecol_q.dat
Average weekly
ecological release
requirement (Mm3)
cat-par.dat
Range of values for
catchment
parameters in
rainfall-runoff module
tempe.txt
Monthly temperature
(oC) and relative
humidity (%) for the
catchment
2.2.3 Summary of Executable files
The following executable files must be in the specified directory.
Table 2: Executable files for the DSS
Location
C:\dssmodel
File name
Clnorm_m.exe
Comment
Stratify monthly
rainfall records into
climatic patterns
dagr.exe
Aggregate the
demand in the basin
Route flow from
upper Hadejia to Yau
in Yobe
down_dam.exe
sumfl.exe
C:\dssmodel\tiga
Summarises surface
water and ground
water flow
Stratify monthly
rainfall record in the
catchment into
climatic patterns
Clnorm.exe
Flow.exe
The fit run for
rainfall-runoff
module. Determine
catchment
parameters
Simula.exe
Use optimum
parameters of the
6
User’s Manual for the
Decision Support System
Location
File name
Reservoi.exe
C:\dssmodel\challawa
C:\dssmodel\unregul
C:\dssmodel\bunga
Comment
catchment to
simulate flow for
desired rainfall
pattern
Simulate flow and
demand through the
reservoir for desired
climatic pattern
Stratify monthly
rainfall record in the
catchment into
climatic patterns
Clnorm.exe
Flow.exe
The fit run for
rainfall-runoff
module. Determine
catchment
parameters
Simula.exe
Use optimum
parameters of the
catchment to
simulate flow for
desired rainfall
pattern
Reservoi.exe
Simulate flow and
demand through the
reservoir for desired
climatic pattern
Stratify monthly
rainfall record in the
catchment into
climatic patterns
Clnorm.exe
Avegp.exe
Determine model
parameters for
rainfall-runoff model
as average of Tiga
and Challawa subbasins
Simula.exe
Use optimum
parameters of the
catchment to
simulate flow for
desired rainfall
pattern
Stratify monthly
rainfall record in the
catchment into
climatic patterns
Clnorm.exe
Flow.exe
The fit run for
rainfall-runoff
module. Determine
catchment
7
User’s Manual for the
Decision Support System
Location
File name
Comment
parameters
Simula.exe
Use optimum
parameters of the
catchment to
simulate flow for
desired rainfall
pattern
Reservoi.exe
Simulate flow and
demand through the
reservoir for desired
climatic pattern
3.0 EXECUTING DSS PROGRAM
The program is interactive and it requires input from user. The procedure is as
follows:
•
Click start, then program and click ‘decision support system (GIS)’.
•
The user window (Figure 3) appears.
Figure 3: Welcome interface
•
Click Continue, and the module-window (Figure 4) appears.
8
User’s Manual for the
Decision Support System
Figure 4: Module window
The window shows the various modules. The meanings of the abbreviations that
come up in the course of execution of the model are shown. You can also view
the KYB river system.
•
Click enter year. This will request for year (four digit e.g. 2005) desired for
execution. The program can execute for one year or multiple of years up
to 10 years. For multiple years, enter the last year (for 2006 to 2010,
enter 2010). NB: you must have the necessary rainfall data for multiple
years (r_user.txt).
•
Then click population icon to select the rate of increase for the population
of Kano City, Hadejia area (all informal users around Wudil to Hadejia),
area from Hadejia to Damasak, and Damasak to Yau area. There are three
options – constant rate, linear rate and exponential rate. You are also
required to edit the population base data (Figure 5). Click edit population,
then the population data for 1995 is displayed. Modify the population data,
9
User’s Manual for the
Decision Support System
if desired (or if new information is available). Then click ‘safe and close’
this takes you to dialogue for modifying the livestock data in Yobe subbasin. Modify the data (if desired) then click ‘safe and close”. Then click
‘ok’.
•
Click climate icon to select the climatic pattern of the year. This could be
normal, wet, extra wet, dry, extra dry and prolong dry years as well as
optional code. There are rainfall patterns for the six climatic patterns in
the directory C:\dssmodel, but user has to enter the rainfall pattern for
optional case. See format of entering ‘r_user.txt’ (Table 3). Each of the
four sub-directories has example of the r_user.txt. Also the root directory
c:/dssmodel has three files bun_us.txt, kan_us.txt hav_us.txt for Jama’are
sub-basin, Kano area and Jigawa area, respectively, for user to supply.
Figure 5: Population dialogue window
10
User’s Manual for the
Decision Support System
Table 3: Standard for providing rainfall file (Tiga Unit) for Optional Code
TIGA-CATCH
1986 1992
1
1986 0.0
1987 0.0
1988 0.0
1989 0.0
1990 0.0
1991 0.0
1992 0.0
•
2
17.7
0.0
3.9
0.0
0.0
0.3
2.1
3
1.8
24.1
13.6
0.1
0.0
21.4
29.2
4
32.5
7.4
89.5
50.3
15.7
86.0
83.5
5
84.9
86.7
98.0
65.2
158.3
172.0
136.6
6
140.1
159.3
159.1
134.4
132.7
175.5
148.7
7
302.8
239.9
207.8
185.7
224.8
274.1
233.4
8
215.4
237.6
328.0
315.6
210.5
346.0
292.1
9
147.7
112.5
189.6
109.7
144.4
64.5
191.1
10
8.2
45.0
44.1
53.7
7.3
22.7
34.8
11
0.0
0.0
0.0
0.0
0.0
0.0
2.3
12
0.0
0.0
0.0
4.4
1.0
0.0
0.0
Then click on change user icon’ and enter the proportion of the demand
from a specified user you wish to analyse. You can enter an integer from 0
to 100 for each user. For example, a user rate of 100 for KCWS implies
the current rate (year 2005 value) of water demand for Kano City should
be assessed. Click ok when you have selected the rate (in percentage) for
all users. Then click ok again for a summary of annual water demand for
each user to be displayed. Click continue.
•
Click reservoir icon. Three reservoirs will be active – Tiga, Challawa, and
Kafin Zaki. Click on each icon in order of appearance (top to bottom). A
plot of inflow to each reservoir as estimated in the rainfall-runoff model is
displayed. If you have selected 0 for Kafin Zaki, a plot of inflow at Bunga
is displayed since the reservoir is still proposed. Click continue and then
ok, to display a summary of water available from the four sub-basins. A
summary of the demand from each sub-basin is also displayed. Click
continue
to display
decision dialogue.
The
dialogue requested
for
information on the proportion of the demand that should be satisfied from
available surface water. The decision is expected to be based on the
summary of demand and supply of water in KYB. This summary is
displayed behind the decision dialogue (Figure 6). The decision dialogue
can be moved with the aid of mouse to view the summary of demand and
supply (Figure 7).
11
User’s Manual for the
Decision Support System
Enter value between 0 and 100 for sector: Tiga sub-unit, Challawa sub-unit, area
from Wudil to Hadejia, Hadejia to Damasak and Damasak to Yau. A value of 100
means 100% of the estimated demand should be satisfied from surface water
resources. Click ok, then click yes to plot graphs showing simulated storage,
spillage, demands and level of deficiency.
•
Click on the icon: flow along river system. The flow from upper section of
Hadejia River system through the Hadejia barrage to Hadejia-Nguru
Wetland and to Yau is displayed. The volume of flow at critical section
along the river system is plotted.
•
Click resume to start again, otherwise terminate.
Right click on any graph to print.
Figure 6: Summary of demand and supply behind decision dialogue
12
User’s Manual for the
Decision Support System
Figure 7: Dialogue window for selecting surface water rate
The output files during execution are summarised in Table 4. Some of these files
serve as input for graphical display of results, while others can be accessed using
a notepad or text editor.
Table 4: Output files from the program
Location
C:\dssmodel
File name
Seq_01.txt
Comment
Summary of flow at
critical nodes from
Wudil to Yau in the
basin including deficit
level to Hadejia-Nguru
Wetlands and Hadejia
Valley Irrigation.
Seq_out.txt
Summary of flow at
critical nodes from
Wudil to Yau in the
basin including deficit
level to Hadejia-Nguru
Wetlands and Hadejia
Valley Irrigation for
Graphical Display.
Demd_sum.txt
Summary of demand
from KYB
13
User’s Manual for the
Decision Support System
Location
File name
Supl_sum.txt
C:\dssmodel\tiga
Parame.txt
Optimum parameter
for rainfall-runoff
A_simu.txt
Weekly observed and
estimated flow for
Graphical Display
Res_01.txt
Output from reservoir
operation
.
Output from the
reservoir for Graphical
Display
Optimum parameter
for rainfall-runoff
Res_out.txt
C:\dssmodel\challawa
Parame.txt
A_simu.txt
Weekly observed and
estimated flow for
Graphical Display
Res_01.txt
Output from reservoir
operation
.
Output from the
reservoir for Graphical
Display
Optimum parameter
for rainfall-runoff
Res_out.txt
C:\dssmodel\unregul
C:\dssmodel\bunga
Comment
Summary of water
resources in the basin
Parame.txt
A_simu.txt
Weekly estimated flow
Parame.txt
Optimum parameter
for rainfall-runoff
A_simu.txt
Weekly observed and
estimated flow for
Graphical Display
Res_01.txt
Output from reservoir
operation
.
Output from the
reservoir for Graphical
Display
Res_out.txt
Output files for graphical display might not be self explanatory
4.0 BASIS OF MODELING
4.1 The Rainfall-Runoff Model
4.1.1 Basis of the rainfall-runoff model
The basis of the model is a water balance between the following:
14
User’s Manual for the
Decision Support System
(i)
Input to the catchment as rainfall.
(ii)
Output from the catchment as evapotranspiration loss, surface runoff and
sub-surface flow.
(iii)
Change in the volume of water stored in the catchment. This is
summarized in the equation.
P = Et + Qi + Qs + DS
……………………… (1)
where P is rainfall, Et is evapotranspiration loss, Qi is Surface runoff, Qs is
subsurface flow, and DS is the change in storage (positive or negative).
4.1.2 Structure of the model
The model is conceived as a linear combination of four storage elements
identified as:
(i)
Surface storage
(ii)
Channel storage
(iii)
Soil moisture storage
(iv)
Groundwater storage
Surface Storage: This unit is augmented by rainfall and artificial inflow (if any),
and depleted by evapotranspiration loss and infiltration to the soil moisture zone.
Channel inflow will occur when the storage in the unit exceeds a threshold value,
and a simple budget yields the amount of the channel inflow. The average
monthly evapotranspiration loss was computed by the Baney-Morin-Nigeria
model. The Baney-Morin-Nigeria model accepts daily temperature, relative
humidity and ratio of maximum possible radiation to the annual maximum
radiation as inputs to give the average daily/monthly evapotranspiration.
The average monthly evapotranspiration is given by the model as:
Etp = nrf (0.45 T + 8)(520 – R1.31)/100
……………………… (2)
where Etp is the average monthly potential evapotranspiration in mm, n is the
number of days in the month, T is the mean monthly temperature in OC, R is the
average monthly relative humidity (%) and rf is the ratio of maximum possible
radiation to the annual maximum.
15
User’s Manual for the
Decision Support System
The rate of infiltration which depends on the type and intensity of rainfall, and
the present state of soil moisture was evaluated by the following equation given
as:
f i = foe–kt
……………………… (3)
where fi is the potential infiltration rate in mm. fo is the maximum infiltration rate
in mm. k is the infiltration coefficient and t is the time unit.
Channel Storage: The channel storage is augmented by channel inflow and
depleted by surface runoff. The surface runoff is conceived as a linear function of
the storage. The constant of proportionality depends on the soil type and cover.
The Soil Moisture Storage: The movement of water into the unit is controlled
by infiltration and capillary rise. Evapotranspiration and deep percolation controls
the movement of water out of the unit. Deep percolation occurs when the soil
moisture storage exceeds a threshold value. Capillary rise will cease whenever
there is deep percolation. Both capillary rise and deep percolation depends on
the storage level of the moisture and groundwater storage.
Groundwater storage: This is augmented by deep percolation, and depleted
by capillary rise and flow. When the ground water storage exceeds the threshold
value, the soil moisture storage is capillary rise and deep percolation will cease
to occur, while evapotranspiration loss will act directly on the groundwater.
4.1.3 The model parameters
The water budget model has nine parameters, and they are listed in Table 5. The
codes used for the parameters in the computer program, and their units are also
indicated. The actual values of the parameters are given with the results
printout.
16
User’s Manual for the
Decision Support System
Table 5: The model parameters
s/n
Parameter
Code name
Unit
1.
Threshold value of surface storage
TVSS
Metre
2.
Maximum infiltration rate
FMAX
Metre
3.
Infiltration Coefficient
HINFEL
Per unit time
4.
Channel storage constant
CHSTK
Fraction
5.
Threshold value of soil moisture storage
TVSM
Metre
6.
Maximum capillary rate
CMAX
Fraction
7.
Rate of evaporation from subsurface zone
PCUS
Fraction
8.
Groundwater storage constant
GWSC
Fraction
9.
Threshold value of Groundwater storage
TVGW
Metre
4.2 The Demand-Allocation Model
4.2.1 DAGR.EXE
This module aggregates the water demand for both major and minor users. In
order to determine domestic water demand, the module estimates the population
based on the POPD.DAT and the desired rate of increase in population (constant,
linear or exponential). The weekly water demand is computed based on average
consumption rate of 150 litres per capita per day for city, 100 litres per capita
per day for urban area and 60 litres per capita per day for rural area. The
average consumption rate was converted to weekly rate based climatic ratio
shown in Figure 8.
The water required by a given population P is expressed as the product of the
population and rate of consumption. Similarly, the water required for livestock is
expressed as a product of the livestock population and its consumption rate.
17
User’s Manual for the
Decision Support System
proportion of average rate
1.25
1
0.75
0.5
0.25
0
0
10
20
30
40
50
60
week
Figure 8: Variation in domestic water demand for KYB
Irrigation water requirement:
Area under irrigation for a particular crop = total command area *
proportion of area for the crop
Water required = area under irrigation * Cwr * irrigation efficiency
The crop water requirement, Cwr was based on evapotranspiration data,
crop factor and stage of growth of the particular crop. An irrigation
efficiency of 50% was assumed for each irrigation scheme. The irrigation
canals (secondary and tertiary) are unlined thus a minimum water level in
the canal must be maintained throughout the year to reduce effect of
cracking and seepage. For supplementary irrigation during rainy season,
water required was reduced by effective rainfall (rainfall less evaporation
loss).
4.2.2 RESERVOI.EXE
The routing procedure is summarised below.
Convert Storage to Area using Reservoir Characteristic equation
For Tiga Reservoir:
AREA = VOLUME*ms + c
18
User’s Manual for the
Decision Support System
Ms = 0.21, c = 0.0
for VOLUME ≤ 190
Ms = 21.838, c = 0.0889
for 190 < VOLUME ≤ 1429
AREA = 148.79
for VOLUME > 1429
(Volume in Mm3 and Area in km2)
For Challawa Reservoir:
AREA = VOLUME*ms + c
Ms = 0.09, c = 0.0
for VOLUME ≤ 100
Ms = 0.09, c = 13.79322
for VOLUME > 100
For Bunga Reservoir: Use either the equation for Challawa or Tiga.
MODIFIED INFLOW = INFLOW*(1-AREA/CATCHMENT AREA)
Determine Reservoir Storage less Demand
STORAGE = PREVIOUS RESERVOIR STORAGE + MODIFIED INFLOW – DEMAND –
DOWNSTREAM RELEASE
Convert Storage to AREA using Reservoir Characteristic equation
Determine SPILLAGE
FINAL RESERVOIR VOLUME = STORAGE – SPILLAGE – EVAPORATION +
RAIN on reservoir area
Convert Final Reservoir Volume to RESERVOIR LEVEL using reservoir
characteristic equation
For Tiga Reservoir:
LEVEL = VOLUME*ms + c
Ms = 0.4994, c = 490.96
for VOLUME ≤ 25
Ms = 0.0578, c = 500.23
for 25 < VOLUME ≤ 100
Ms = 0.0268, c = 503.57
for 100 < VOLUME ≤ 300
Ms = 0.0141, c = 507.76
for 300 < VOLUME ≤ 800
Ms = 0.0083, c = 512.6
for 800 < VOLUME ≤ 1500
19
User’s Manual for the
Decision Support System
(Volume in Mm3 and Level in m)
For Challawa reservoir:
LEVEL = A*(VOLUME)3 + B*(VOLUME) 3 + C*(VOLUME) + D
where A = 0.0069, B =-0.225, C=2.6194, D =487.81 for VOLUME ≤ 20
A = 5*10-8, B =-9*10-5, C=0.068, D =501.06 for 20 < VOLUME ≤ 10 20
(VOLUME in Mm3, LEVEL in m)
Use RESERVOIR LEVEL to determine DISCHARGE TO IRRIGATION CANAL or
RIVER CHANNEL FOR WATER SUPPLY as appropriate. The calculation is also
based on Characteristic equation
For Tiga Reservoir:
(a)
Canal -
DISCH = 0
for LEVEL < 508.4 m
DISCH = 9.0143 * LEVEL - 4586
508.4 m ≤ LEVEL < 509.6 m
DISCH = 3.0078 * LEVEL - 1520.6
509.6 m ≤ LEVEL < 513.86 m
DISCH = 25
LEVEL ≥ 513.86 m
(discharge in m3/s)
(b)
River Channel -
DISCH = 0
for LEVEL < 502.0 m
DISCH = 0.089 * LEVEL - 41.269
502.0 m ≤ LEVEL < 507.0 m
DISCH = 0.0768 * LEVEL - 34.994
507.0 m ≤ LEVEL < 509.0 m
DISCH = 0.0768 * LEVEL - 34.994 + LEVEL * 0.1262 – 62.234
for LEVEL ≥ 509.0 m
For Challawa Reservoir
DISCH = ms * LEVEL + c
where ms =12.38, c = -6,140.5
for LEVEL ≤ 498.0
ms =2.4998, c = 1,214.1893
for 498.0 < LEVEL ≤ 514.0
ms =1.6442, c = -775.4073
for LEVEL > 514.0
(DISCH in m3/s and LEVEL in m)
20
User’s Manual for the
Decision Support System
Determine whether the discharge could meet the demand (DEFICIENT in
IRRIGATION OR WATER SUPPLY)
4.2.3 DOWN_DAM.EXE
This module route the flow from Upper Hadejia to Yau. The routing was based on
historical flow records and mathematical relationship between the flows.
4.3 The Complete DSSModel
The acronym of the model developed is termed DSSModel. The model was built
in modules. The flow structure of the model is presented in Figure 9.
4.3.1 Data preparation
The formats for data preparation are expressed below.
POPD.DAT ---- population data file
Example:
1995
4230000 3.0
750000 2.5
56586 2.5
67660 2.5
Line 1: year of record
Line 2: population of Kano City for the year of record, annual growth rate
Line 3: population of community downstream of Kano up to Hadejia (informal
user), annual growth rate
Line 4: population downstream of Hadejia up to Damasak (informal user), annual
growth rate
Line 5: population from Damasak to Yau (informal user), annual growth rate
21
User’s Manual for the
Decision Support System
START
CREATE C:\DSSMODEL AND ALL
ASSOCIATED SUBDIRECTORIES
PREPARE DATA FILES
M_CATH_R.TXT (monthly catchment rainfall for Tiga,
Challawa, Bunga and Unregulated units and put in the
respective directories)
M_KANO_R.TXT, M_HADE.TXT and M_BUNG
(monthly rainfall for Kano, Hadejia, Bunga)
RUN CLNORM.EXE IN EACH SUDIRECTORIES
(to stratify rainfall records into climatic patterns)
RUN CLNORM_M.EXE IN EACH
SUDIRECTORIES (to stratify rainfall records into
climatic patterns)
RUN USER FRIENDLY PACKAGE OF
DSSMODEL (see nstallation procedure)
ENTER DESIRED YEAR
FOR SIMULATION
ENTER POPULATION INCREMENT RATE for Kano
City, downstream of Kano to Hadejia, Hadejia to Damasak,
Damasak to Yau. The file IN_PL.DAT is created
ENTER LEVEL OF DEMAND TO BE SATISFIED. Main users
are KCWS, KRIP and HVIP. Secondary users are domestic and
livestock users in Hadejia, up to Damasak and Yau. U_CTRL.DAT
IS CREATED. FILE DAGR.EXE IS EXECUTED to calaculate
demand in KYB
B
A
A
22
User’s Manual for the
Decision Support System
A
B
ENTER CLIMATIC PATTERN. The file
PM_CTRL.DAT is created in the C:\DSSMODEL and
P_CTRL.DAT in each of the four sub-directories
CLICK RESERVOIR. The files FLOW.EXE and
SIMULA.EXE are executed in Tiga, Challawa and Bunga
subdirectories. The observed and estimated inflows are
plotted. Then AVEGP.EXE and SIMULA.EXE are executed
for unregulated area of Hadejia. THEN the file
RESERVOI.EXE is executed for Tiga, Challawa and Bunga.
This is a reservoir operation study taking care of inflow, and
all withdrawals. Two output files (RES_01.TXT and
RES_OUT.TXT are opened. RES_OUT.TXT is for
graphical display, while RES_01.TXT is the text version with
explanation. Summary of water resources is displayed and
proportion of demand to be met by surface water resources is
provided
GOTO SIMULATION where the file DOWN_DAM.EXE
is run. The flows at critical nodes along the basin are
displayed in graphical form using SEQ_OUT.TXT. The file
SEQ_01 is the text version with explanation
CLICK RESUME
STOP
Figure 9: Flow structure of the DSSModel
23
User’s Manual for the
Decision Support System
IN_DISCH.TXT
Line 1: title of station
Line 2: starting year of record, ending year of record, catchment area in km2
Line 3: month code 1 to 12
Line 4: starting year, monthly flow in Mm3
Line 5: next year, monthly flow in Mm3
..
..
Last line: ending year, monthly flow in Mm3
M_CATH_R.TXT
Line 1: name of station
Line 2: starting year of record, ending year of record
Line 3: month code 1 to 12
Line 4: starting year, monthly rainfall depth
Line 5: next year, monthly rainfall depth
..
..
Last line: ending year, monthly rainfall depth
R_USER.TXT --- monthly rainfall record for user optional code
Line 1: name of station
Line 2: starting year of record, ending year of record
Line 3: month code 1 to 12
Line 4: starting year, monthly rainfall depth
Line 5: next year, monthly rainfall depth
..
..
Last line: ending year, monthly rainfall depth
M_HADE_R.TXT
Line 1: name of station
Line 2: starting year of record, ending year of record
Line 3: month code 1 to 12
Line 4: starting year, monthly rainfall depth
Line 5: next year, monthly rainfall depth
..
..
Last line: ending year, monthly rainfall depth
M_BUNG_R.TXT
Line 1: name of station
Line 2: starting year of record, ending year of record
Line 3: month code 1 to 12
Line 4: starting year, monthly rainfall depth
Line 5: next year, monthly rainfall depth
..
..
Last line: ending year, monthly rainfall depth
24
User’s Manual for the
Decision Support System
M_KANO_R.TXT
Line 1: name of station
Line 2: starting year of record, ending year of record
Line 3: month code 1 to 12
Line 4: starting year, monthly rainfall depth
Line 5: next year, monthly rainfall depth
..
..
Last line: ending year, monthly rainfall depth
RE_TIGA.TXT --- reservoir characteristics data
Example:
TIGA
523.7 1945.0 1100.0
0.0 190.0 0.21
0.0
190.0 1429.0 0.0889 21.838
0.0 25.0 0.04994 490.96
25.0 100.0 0.0578
500.23
100.0 300.0 0.0268
503.57
300.0 800.0 0.0141
507.76
800.0 1500.0 0.0083
512.6
508.4 509.6 509.6 513.86 513.86 9.0143 -4586 3.0078 1520.6 0.0 25.0
502.0 507.0 507.0 509.0 509.0 0.089 -41.269 0.0768 -34.994 0.0768 -34.994
0.1262 -62.234
Line 1: station name
Line 2: maximum reservoir level, maximum storage volume, average storage
volume at the end of year
Line 3 and Line 4: Parameters for volume- area equation (area = coef*vol +
constant). Thus, line 3 and line 4 show lower limit of volume, upper limit,
coefficient and constant.
Line 5 to Line 9: parameters for volume-elevation equation (level=coef*vol +
constant). Thus, each line should have the lower limit of volume, upper
limit, coefficient and constant.
Line 10: parameters for converting reservoir level to canal discharge-KRIP
(discharge = coef*level+const). The first 5 values show the lower limit,
upper limit, lower limit, upper limit and lower limit of the three segments
of the equation, then, the coefficient and constant of the respective
segments.
Line 11: parameters for converting reservoir level to river discharge-KCWS
(discharge = coef*level+const). The first 5 values show the lower limit,
upper limit, lower limit, upper limit and lower limit of the three segments
of the equation, then, the coefficient and constant of the respective
segments.
RE_CHAL.TXT --- reservoir characteristics data
Example
CHALLAWA
524.0 948.0 850.0
0.0 100.0 0.22799 0.0
25
User’s Manual for the
Decision Support System
100.0 948.0 0.09
13.79322
0.0 20.0 0.0069
-0.225 2.6194 487.81
20.0 1020.0 0.00000005 -0.00009 0.068 501.06
0.0 498.0 498.0 514.0 514.0 12.38 -6140.5 2.4998 -1214.1893 1.6442 775.4073
Line 1: station name
Line 2: maximum reservoir level, maximum storage volume, average storage
volume at the end of year
Line 3 and Line 4: Parameters for volume- area equation (area = coef*vol +
constant). Thus, line 3 and line 4 show lower limit of volume, upper limit,
coefficient and constant.
Line 5 to Line 6: Parameters for volume-elevation equation (Level = ax3 + bx2 +
cx + constant, where x is volume). Thus, each line should have the lower
limit of volume, upper limit, coefficient and constant.
Line 7: parameters for converting reservoir level to river discharge (discharge =
coef*level+const). The first 5 values show the lower limit, upper limit,
lower limit, upper limit and lower limit of the three segments of the
equation, then, the coefficient and constant of the respective segments.
RE_BUNG.TXT --- reservoir characteristics data
BUNGA
524.0 948.0 850.0
0.0 100.0 0.22799 0.0
100.0 948.0 0.09
13.79322
0.0 20.0 0.0069
-0.225 2.6194 487.81
20.0 1020.0 0.00000005 -0.00009 0.068 501.06
0.0 498.0 498.0 514.0 514.0 12.38 -6140.5 2.4998 -1214.1893 1.6442 775.4073
Line 1: station name
Line 2: maximum reservoir level, maximum storage volume, average storage
volume at the end of year
Line 3 and Line 4: Parameters for volume- area equation (area = coef*vol +
constant). Thus, line 3 and line 4 show lower limit of volume, upper limit,
coefficient and constant.
Line 5 to Line 6: Parameters for volume-elevation equation (Level = ax3 + bx2 +
cx + constant, where x is volume). Thus, each line should have the
lower limit of volume, upper limit, coefficient and constant.
Line 7: parameters for converting reservoir level to river discharge (discharge =
coef*level+const). The first 5 values show the lower limit, upper limit,
lower limit, upper limit and lower limit of the three segments of the
equation, then, the coefficient and constant of the respective segments.
CAT_PAR.DAT
Example:
0.01 0.05
0.2 0.35
0.1 2.
0.1 0.25
0.04 0.1
26
User’s Manual for the
Decision Support System
0.1 2.0
0.02 0.2
0.075 0.5
1. 1.0
Line 1: minimum
Line 2: minimum
Line 3: minimum
Line 4: minimum
Line 5: minimum
Line 6: minimum
Line 7: minimum
Line 8: minimum
Line 9: minimum
and
and
and
and
and
and
and
and
and
maximum
maximum
maximum
maximum
maximum
maximum
maximum
maximum
maximum
value
value
value
value
value
value
value
value
value
of
of
of
of
of
of
of
of
of
tvss
fmax
hinfl
chstk
tvsm
cmax
pcus
gwsc
tvgw
TEMPE.TXT --- monthly temperature and relative humidity
Line 1: name of station, subtitles (TEMP, REL.HUM)
Line 2: starting year of record, ending year of record
Line 3: month 1 (of starting year), temperature, relative humidity
Line 4: month 2 (of starting year), temperature, relative humidity
..
..
Line 14: month 12 (of starting year), temperature, relative humidity
Line 15: month 1 (of subsequent year), temperature, relative humidity
..
Last line: month 12 (of ending year), temperature, relative humidity
ECOL_Q.DAT --- Ecological release requirement
Line 1: name of station
Line 2: subtitle 9wk, release)
Line 3: wk 1, flow in Mm3
Line 4: wk 2, flow in Mm3
..
..
Line 54: wk 52, …, flow in Mm3
6.0 OUTPUT
Flow along KYB river system for a wet year with full development at Kafin
Zaki and Kawali Irrigation Scheme and all demand based on surface water
resources is shown in Figure 10 as an example of a typical output from
the DSS (i.e. DSSModel).
27
User’s Manual for the
Decision Support System
Figure 10: Flow along KYB river system (Wet year, full
development at Kawali Irrigation Scheme)
28