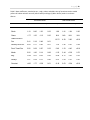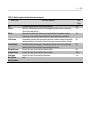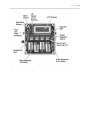
1
2013 YELLOW RAIL MONITORING PLAN FOR LOWER ATHABASCA PLANNING REGION Prepared by: Dr. Erin Bayne, Paul Knaga, Dr. Tyler Muhly, Lori Neufeld, and Tom Wiebe Contact Information: Dr. Erin Bayne Associate Professor Department of Biological Sciences University of Alberta Mail: CW 405 – Biological Sciences Centre Office: CCIS 1-275 Edmonton, AB T6G 2E9 Ph: 780-492-4165; Fax 780-492-9234 e-mail: [email protected] web: http://www.biology.ualberta.ca/faculty/erin_bayne/ Page |2 Executive Summary 1) The Yellow Rail (Coturnicops noveboracensis) is a small secretive marsh bird. Concerns about the status of this species resulted in several oilsands mines in the Lower Athabasca planning region having an EPEA (Environmental Protection and Enhancement Act) clause to monitor Yellow Rail and mitigate impacts on this species. 2) A summary of previous monitoring done to date by the various companies is provided 3) A detailed overview of the steps taken by the EMCLA (Environmental Monitoring Committee of Lower Athabasca) to develop new automated recording technologies for cost-effectively monitoring Yellow Rails along with other species is discussed. 4) Yellow Rail are rare in the region in part because of the difficultly in surveying them and getting to the habitats that they seem to prefer (shrub swamp, shrub fen, graminoid fen, and meadow marshes). All known locations of Yellow Rail have been collated and models with limited predictive ability created. 5) Each company with an Environmental Protection & Enhancement Act (EPEA) Approval clause has already looked for Yellow Rails in their project footprints. In 2013 each company will survey a minimum of 30 locations within graminoid fen and marsh complexes within their project footprints. The EMCLA group at the University of Alberta will attempt to survey an addition 520 locations within 7km of truck accessible roads across the Lower Athabasca planning region to provide a more regional evaluation. EMCLA sites range from Cold Lake, where Yellow Rails have been found historically to Fort Chipewyan. 6) All data will be collected by Automated Recording Units and the data permanently archived by the EMCLA. The EMCLA will be responsible for listening to recordings and modeling resulting habitat relationships. 7) The survey is designed to be directly comparable with ABMI (Alberta Biodiversity Monitoring Institute) protocols. By placing ABMI grid of bird sampling in specific habitats and having the ARU operational at night for many nights the probability of detecting Yellow Rail is maximized. 8) The design of the program is such that we can answer: 1) what wetland class Yellow Rails are most likely to be found in; 2) the size of graminoid fens that they are most likely to occur; 3) the percentage shrubs/ trees in a fen that are too much to support Yellow Rails; and 4) water depths required to find the species. Page |3 Table of Contents Executive Summary....................................................................................................................................... 2 1 - Background Information on Yellow Rail monitoring in Alberta ............................................................... 4 1.1 - Life History of Yellow Rail ................................................................................................................. 4 1.2 – Monitoring Objectives...................................................................................................................... 6 1.3 – History of monitoring Yellow Rail in Lower Athabasca Planning Region ......................................... 7 1.3.1 – Imperial Kearl ............................................................................................................................ 7 1.3.2 - Suncor – Fort Hills ..................................................................................................................... 8 1.3.3 - Shell Canada – Muskeg River Mine ......................................................................................... 10 1.3.4 - 2012 EMCLA “Industrial impact on wetland animals” project .................................................. 7 2 – Approaches to Yellow Rail Monitoring.................................................................................................. 12 2.1 – Playback versus passive listening ................................................................................................... 12 2.2 - Factors influencing detection of Yellow Rail in the boreal forest ................................................... 16 3 – Where should we sample? .................................................................................................................... 19 3.1 – Habitat use by Yellow Rail based on historical data ...................................................................... 19 3.2 – EMCLA ARU distribution relative to selected Yellow Rail habitat in 2012 ..................................... 30 4 - Impact assessment hypotheses for determination of oilsands effects ................................................. 35 5 - 2013 workplan for Yellow Rail Monitoring ............................................................................................ 40 5.1 - Spatial distribution within 7 km of roaded areas in LAPR .............................................................. 40 5.2 - Determine which wetland classes support Yellow Rails ................................................................ 42 5.3 - Does the density of Yellow Rails vary as a function of graminoid fen size? ................................... 43 5.4 - How many shrubs and trees in a fen are too much for the Yellow Rail?........................................ 44 5.5 - Determining annual variation in Yellow Rails by revisiting known locations ................................. 45 5.6 - What are the local habitat conditions required by Yellow Rails? ................................................... 46 5.6.1 - Plot Design ............................................................................................................................... 46 5.6.2 - Habitat Identification ............................................................................................................... 47 5.6.3 - Vegetation Measurements ...................................................................................................... 48 6 – How sampling Yellow Rail habitat can improve biodiversity monitoring ......................................... 57 7 - Expectations for individual companies & EMCLA .................................................................................. 59 Appendix 1: Instructions for ARU usage ..................................................................................................... 62 Appendix 2: Setting and Schedules ............................................................................................................. 76 Literature Cited ........................................................................................................................................... 78 Page |4 1 - Background Information on Yellow Rail monitoring in Alberta 1.1 - Life History of Yellow Rail The Yellow Rail (Coturnicops noveboracensis) is a small secretive marsh bird of the family Rallidae. According to the International Union for Conservation of Nature (IUCN) Red List of Threatened Species, the Yellow Rail is a species of least concern because of its extremely large range (Figure 1: > 20,000 km2). While population estimates are speculative at best, the IUCN reports a worldwide population of 10,000 – 25,000 individuals. Trend data is also limited but according to IUCN is stable (BirdLife International, 2012). Descriptions of the habitat for this species are wet sedge meadows in prairie systems, salt marshes in areas near the ocean, and graminoid fens, and grassy marshes in boreal systems (Bookhout 1995). Figure 1 – Breeding range map of Yellow Rail (Coturnicops noveboracensis) from IUCN website. Note this map underestimates distribution of Yellow Rail in Alberta which has been found near Zama Lake in NW Alberta. The elusive nature of the Yellow Rail, it’s nocturnal habits, and the difficulty of conducting surveys in Yellow Rail habitat have led many authors to conclude that the species is rare and could be at risk of extinction because of human development around wetlands. Rarity, or human perception of rarity, is driven by several factors. First, a species can be rare because it is found in a limited number of spatial locations. This is not the case for the Yellow Rail, as the range extends across most of Canada during the breeding season. The general description of the habitat requirements of this species would suggest that Page |5 the conditions they require are widespread as well. However, the exact soil moisture level or depth of open water level is not well understood and may influence where this species is found year to year. If the exact conditions the species require are ephemeral then the broad categorization of habitat classes previously used may be too coarse to be of utility in determining spatial distribution and abundance in any given year. In addition, the species does not always provide a reliable acoustic cue and is virtually never seen when visited by observers. Combined this spatial and temporal variability along with a poor detection may give a perception that the species is rarer than it truly is. Figure 2 - Picture of Yellow rail. From: http://upload.wikimedia.org/wikipedia/commons/6/62/Yellow_Rail.jpg Page |6 1.2 – Monitoring Objectives The primary objective of the EMCLA’s (Environmental Monitoring Committee of the Lower Athabasca) Yellow Rail monitoring program is to identify whether the Yellow Rail is actually rare in NE Alberta and if so what are the primary reasons for its rarity. The second objective is to determine if there is a more cost effective way of monitoring this species in time and space. The third objective is to use this information to develop an impact hypothesis to predict how habitat alteration by industrial activities such as the energy sector might influence Yellow Rail distribution and abundance over time. Finally, the information that has been collected to date is being used to create a proposal for a long-term monitoring program for the Yellow Rail. Specifically, the logic and cost efficacy of adding a single species sampling design to larger-scale biodiversity programs will be evaluated as data becomes available. The primary reason Yellow Rails are targeted for species-specific monitoring in Alberta is because of EPEA (Environmental Protection and Enhancement Act) approval conditions. The EPEA approval regulates the construction, operation and reclamation of the EPEA approved facility. These approvals tell the operator what valued ecosystem components must be tracked and monitored as part of their operating activities. The goal of these terms is to address concerns raised by Joint Review panels associated with Environmental Impact Assessment (EIA) hearings and ensure that deleterious impacts on valued ecosystem components are minimized. At the time of their regulatory applications, several oilsands companies were identified as proposing projects that were located in areas believed to be important Yellow Rail habitat. Given the status of Yellow Rail at the time of the EIA, further monitoring of this species was identified as an approval condition. The EPEA approval conditions for Shell’s Albian Sands mine, Imperial Oil’s Kearl Oil Sands Project, and Suncor’s Fort Hills mine stated that: “the approval holder shall provide a plan or participate in the development of a plan for the monitoring and mitigation of the Yellow Rail (Cotumicops noveboracensis) by December 31, 200X to the satisfaction of the Director, unless otherwise authorized in writing by the Director” (Clause 6.1.85). This report and the recommendations therein are intended to partially meet this condition. Clause 6.1.86 whereby “The approval holder shall implement the activities outlined in the plan referred to in subsection 6.1.85, including, but not limited to: surveys, determination of effects, the implementation of mitigation strategies and measures where appropriate, and monitoring, as authorized in writing by the Director.” This plan and the recommendations therein, are intended to partially meet the conditions above and highlights additional steps taken by these companies and others to integrate this monitoring into a larger regional framework. Given the “rarity” of the Yellow Rail and the complex set of objectives laid forth in EPEA conditions, it has become clear that achieving a rigorous analysis that fulfills all the terms of the approvals will be Page |7 difficult to achieve on a lease by lease basis. To that end, industry, provincial and federal governments, academia, and the ABMI (Alberta Biodiversity Monitoring Institute) recognized that monitoring of the Yellow Rail and other rare species should take place in a broader spatial and ecological context. The EMCLA was the end result of this process. The EMCLA has argued that it is more likely to achieve desired outcomes if efforts between companies and other monitoring groups were coordinated. To that end, this report also highlights the work of the EMCLA who has been working to develop coordinated protocols for monitoring other rare animal species besides the Yellow Rail 1.3.1 - What has been done to fulfill EPEA approval conditions by individual companies with EPEA clauses? 1.3 – History of monitoring Yellow Rail in Lower Athabasca Planning Region 1.3.1 – Imperial Kearl Imperial Oil conducted three rounds of yellow rail surveys in 2008 on areas within and adjacent to the Kearl Oil Sands Project on June 11, June 24 and July 8. Surveys were conducted using nocturnal call playback survey methods at established plots. The call playback protocol used was based on methods recommended by the Canadian Wildlife Services (Bazin and Baldwin, 2007). The 10-minute call survey broadcast consisted of the following: 1. Five-minute passive listening period; 2. Three 30-second playbacks of yellow rail calls separated by 30 seconds of silence; and 3. Final two-minute passive listening period Each plot was centrally marked with a wooden stake so that call playback and water depth measurements were conducted at the same spot for each survey round. Habitat characteristics, such as dominant wetlands type, waterbody type and emergent vegetation and nearby ecosite phases and/or wetlands types were recorded Results of the 2008 surveys are summarized below: Round 1: Five yellow rails were heard on June 11, 2008 at four different plots. Surveys were conducted at these plots between 00:27 and 01:23 hours. One yellow rail was heard in graminoid fen (FONG) habitat and the rest were heard in shrubby fen (FONS) habitat. Sedges were the dominant emergent vegetation at most of these plots. Round 2: Twelve yellow rails were heard on June 24, 2008 at the same four plots as in Round 1, plus three additional plots. Surveys were conducted at these plots between 01:02 and 02:40 hours. One yellow rail was heard in graminoid fen (FONG) habitat and the rest were heard in shrubby fen (FONS) habitat. Round 3: Fourteen yellow rails were heard on July 8, 2008 at eight different plots. Of the eight plots, yellow rails were heard at five of the seven previous detection locations, plus three additional plots. Surveys were conducted at these plots between 23:20 and 01:25 hours. Five yellow rails were heard in graminoid fen (FONG) habitat and the rest were heard in shrubby fen (FONS) habitat. Sedges were the dominant emergent vegetation at all these plots. All of these observations are part of the EMCLA database used for habitat modeling Page |8 The results of the 2008 yellow rail monitoring were submitted to Alberta Environment on November 12, 2008. On March 16, 2009, Imperial Oil was issued a letter by Alberta Environment, indicating that the report submitted “completes the requirements of subsection 6.1.86 your EPEA Approval.” 1.3.2 - Suncor – Fort Hills May 2009 Alberta Environment updated the Suncor – Fort Hills approval (151469-00-01; as amended) and requiring monitoring and mitigation plans for Yellow Rails as outlined in clause 6.1.85. This clause stated “The approval holder shall provide a plan or participate in the development of a plan for the monitoring and mitigation of the Yellow Rail (Coturnicops noveboracensis) by December 31, 2009 to the satisfaction of the Director, unless otherwise authorized in writing by the Director”. Suncor submitted a response December 11, 2009 stating they would monitor for Yellow Rail in the 2010 field season. If YR was encountered they would develop a mitigation plan as required, otherwise the letter stated a plan was not warranted. Alberta Environment responded August 27, 2010. They clarified survey protocol and noted that 2 observations made in MLWC and Kearl’s work were important for population studies. AENV mentioned that the FHOSP mitigation options as recommended are consistent with EUB decision for Shell Muskeg River Mine. The Project responded February 2, 2011 confirming one YR detection on July 15, 2010 – which is highly likely given Kearl sightings and previous occurrences. Suncor notes the Federal Government have yet to develop a management plan, following that, the Project would develop and mitigation strategy taking the feds plan into consideration. The letter also highlighted the requirement to ensure functionality and diversity of the unmined portion of the fen which likely provides habitat for Yellow Rail. Alberta Environment responded October 26, 2011 stating that EC could not confirm a yellow rail management plan so they recommended the Project develop a detailed and long term monitoring & mitigation plan to avoid further delay which may be updated following the release of the federal plan. Key wording from Alberta Environment was to develop the plan for the McClelland Lake Wetland Complex (hereafter MLWC) and outside the mine footprint In January 2012 an internal draft Yellow Rail monitoring plan was developed but not submitted. As reported in the EIA and supplemental information provided by the Fort Hills Energy Corporation (FHEC) regarding the Fort Hills Oil Sands Project (FHOSP) in 2002, and subsequently in the Mine Amendment Application (July 27, 2007), and the correspondence of February 2, 2011,Yellow Rail monitoring has occurred within the Fort Hills Lease area. Specifically, in 2001 two yellow rail were incidentally recorded during breeding bird surveys. Further, in 2006 and 2007, using rail-specific surveys (following methods in Prescott et al. 2002), no Yellow Rail were detected. Then in 2010, rail-specific surveys were employed to detect one yellow rail (following methods in Bazin and Baldwin 2007). Finally, in 2011 breeding passerine point count surveys Page |9 detected two yellow rail. All the above mentioned yellow rail were detected in the McClelland Lake Wetland Complex. Details for all these detections are included in Table 1 below and in Figure 1. Table 1 – Historical detection details for yellow rail on the Fort Hills lease Method Employed Day-time point count - incidental Day-time point count - incidental Bazin and Baldwin (2007) Bazin and Baldwin (2007) Day-time point count - incidental Day Time Point count - incidental Date Detected 6 July 2011 6 July 2011 15 July 2010 15 July 2010 2001 2001 Location (easting, northing) 476609, 6367620, zone 12 NAD 83 476029, 6369271, zone 12 NAD 83 468913, 6365910, zone 12 NAD 83 468877 6365502, zone 12 NAD 83 57.43240, -111.52471 (Lat. Long.) 57.45393, -111.4319 (Lat. Long.) The decisions made by Suncor where to monitor were based on Prescott et al. (2002), who reported that the habitat where Yellow Rail were most likely detected include sedge-dominated wetlands. The predominant wetland area on the Fort Hills lease is represented by the McClelland Lake Wetland Complex (; Figure 3) where sedge-dominated wetland habitats occur primarily in the eastern half; as represented by AWI wetland habitat types FONG (open fen nonpatterned graminoid-dominated) and FOPN (open fen patterned no internal lawns). In 2013, Suncor discontinued the use of call-playback surveys, instead contributing to the regional EMCLA program. This regional program, which is attempting to clarify habitat preferences for yellow rails, will help guide future yellow rail monitoring in the MLWC. Suncor will continue to work with the EMCLA through the 2014 season At each site water depth, AWI habitat descriptor, moon phase, wind speed and inclement weather will be recorded. As a failsafe against observer ability or bias, a digital recording of the survey will also be completed. Finally, a GPS location will be recorded for reporting purposes. This is directly comparable to EMCLA methods. P a g e | 10 Figure 3 – Yellow rail survey locations, detection locations and incidental detection locations from Suncor. All points are from the 2001, 2006, 2007, 2010, and 2011 field seasons. Some points have been re-visited in multiple years. Proposed cut-off wall details are included in the MLWC Operational Plan submission. 1.3.3 - Shell Canada – Muskeg River Mine Shell Canada has conducted three surveys for Yellow Rail on the Muskeg River Mine lease between the years of 2008 and 2012. The 2012 survey was a habitat-focused survey examining the current state of available habitat in the lease site. The 2008 and 2010 surveys completed Yellow Rail focused surveys using standardized methodology (Bazin and Baldwin, 2007). Day-time habitat surveys were also completed at each survey site. Habitat surveys included collecting information on habitat characteristics such as ecosite, dominant plants and water depth measurements. Night-time call playback surveys were completed 1 hour after sunset and 1 hour before sunrise with the following listening times: • • 5 minutes of silent listening 3 bouts of 30 seconds of call playback followed by 30 seconds of silence; P a g e | 11 • 2 minutes silent listening. The 2008 survey had 3 survey sessions between the dates of July, 8-10, July 21-23, August 5-7. Thirteen sites were surveyed and were selected non-randomly using GIS habitat layers for the Muskeg River Mine Expansion Areas. Shrubby and graminoid fens were chosen as the focus of this survey. No yellow rail were detected during this survey, though timing of the surveys and noise conditions may have influenced these results. The results from this survey were submitted to Alberta Environment on January 20, 2009, with Alberta Environment responding on October 13, 2009 with recommendations for additional surveying and refinement of methods. The 2010 survey also had 3 survey sessions on June 10-12, June 18-19, and June 30- July 1. Twenty sites were surveyed on the Muskeg Rive Mine Lease. Four habitat types were surveyed: graminoid fens, shrubby fens, marsh, and shallow open water. The results from the 2010 Yellow Rail surveys were: 1. Round 1: June 10-12, 2 Yellow Rail detected on two different sites, 17 sites surveyed, all detections in graminoid fens 2. Round 2: June 18-19, 8 Yellow Rail detected on three sites (including the two from Round 1), 19 sites surveyed, all detections in graminoid fens. 3. Round 3: June 30-July 1, 9 Yellow Rail detected on four sites (including the sites from Round 1 and 2), 19 sites surveyed, all detections in graminoid fens. The results from the 2010 survey were submitted to Alberta Environment on May 31, 2011. Alberta Environment responded March 12, 2012. The 2012 survey was a habitat-based survey aimed at documenting the current status of Yellow Rail habitat in the Muskeg River Mine Expansion lease. The surveys were completed on July 20, with 13 wetlands visited to determine wetland status. Of the 13 sites chosen for the survey, only 10 were visited due to accessibility constraints. Seven wetlands did not differ in habitat descriptions from previous surveys. The remaining 3 wetlands had been de-watered as per Shell Canada’s development of the Muskeg River Expansion area. 1.3.4 - 2012 EMCLA “Industrial impact on wetland animals” project In 2012, the EMCLA monitored a total of 167 wetlands across the LAPR (Lower Athabasca Planning Region) (Figure 4). Wetlands were clustered within 29 sites. 15 of these sites were within the bounds of existing SAGD or oilsands leases and 14 were within control sites. A site was an area approximately a township in size. The control sites had a smaller oil and gas footprint at the township scale while the leases were the most developed areas. . At each site, between 4 and 6 wetlands were sampled. Wetlands were chosen mainly in terms of the level of human impact within varying radii around the wetland. This meant that the wetlands closest to central processing facilities of SAGD and oil sands areas were the central point of the sampled site. At our control sites, we tried to match the types of wetlands sampled to those within the SAGD or oilsands areas that we “had to sample”. Many of these wetlands were not optimal Yellow Rail habitat. This was because our objective was to match wetland type close versus far from disturbance so we had to match the far wetlands to those near impacted P a g e | 12 sites. There is insufficient data from this monitoring to draw any conclusions about the impacts of energy sector or habitat selection on Yellow Rails. Other bird and amphibian species were detected with sufficient frequency to do such an analysis and this work will be provided in another report. Figure 4 – Location of EMCLA ARU sampling locations in 2012 in Lower Athabasca Planning Region. 2 – Approaches to Yellow Rail Monitoring Many rare species are not in fact rare, but simply difficult to detect. Yellow Rails are virtually impossible to detect visually. Their call is a metallic tic-tic sound that is typically 5 syllables in length. It has been described as sounding like two rocks being knocked together. In guidebooks and online sources of information, there is a general statement that the species almost exclusively calls during the dark night in May to July. This behavior creates numerous logistical challenges for effectively monitoring this species. 2.1 – Playback versus passive listening To maximize detection of the Yellow Rail, many studies and monitoring programs have used playback. Playback involves using some type of stereo equipment (i.e. wildlife caller) to broadcast the call of the P a g e | 13 Yellow Rail (along with other nocturnal species in some circumstances). The rationale of playback is that species that use sound to communicate with conspecifics will be more likely to give a cue that an observer can detect. The most common playback protocol in use has been Bazin and Baldwin (2007) which is a 10-minute point-count survey that begins with a 5-minute passive survey and concludes with five successive 1-minute intervals during which Yellow Rail calls are broadcast during the first 30 seconds and then followed by 30 seconds of silence at each interval. Observers assigned each detected individual to one of three distance categories: ≤50m, 51-100m, and >100m. The challenge with using playback is when data on other species is also of interest. With hundreds of potential species detectable at any given site, there is no one optimal playback sequence that can be used either diurnally or nocturnally. In addition, playback of some species like owls may result in other species going silent because of perceived predation risk by the prey species. Passive listening by an observer precludes this conflict but may result in lower rates of detection. Given that an observer can only spend a limited time at each station recording the sounds that are heard there is often a high chance of missing a species that is present but not giving a detectable cue at that time. A solution to these problems is the use of ARUs (automated recording units) which can record sounds for extend periods of time without observer intervention. Recordings are brought to the lab and processed by experts in more controlled conditions. Numerous times of day and dates can then be processed to see if the species is present. As the EMCLA objective was to monitor more than just Yellow Rails, we conducted a study where we compared probability of observation of Yellow Rail and other species using playback/ human based passive listening versus ARUs in 2012. Details on other species detected are described in a different report. Having a person visit a station and use playback, we found no Yellow Rails in 2012 at 114 survey locations in the Lower Athabasca region. At 95% of these stations we also had automated recorders. Yellow Rails were detected at three locations via ARUs thus far. Direct comparison of the efficacy of recorders versus playback was not possible in the LAPR as a result of the limited number of rails detected. Dr. Kiel Drake from Bird Studies Canada (a collaborator on the project) has done a direct comparison of the efficacy of recorders versus ARUs in an area with a high density of Yellow Rails however. Near Fishing Lake, Saskatchewan, surveys for Yellow Rails have been conducted at 76 stations in 2011 or 2012. Human-conducted surveys occurred during 22 May-12 July; ARU samples were drawn from recordings made 18 May-12 July. At each station two to five nocturnal human conducted surveys were made between 22:00-03:00 hrs. A total of 323 surveys were completed for an average of ~4 surveys per station. Human surveys followed Bazin and Baldwin 2007. The ARU recordings were sampled by listening to 1-minutes segments of recordings that were made at the top of the hour between the times 22:00-03:00 hrs. For each station six to eleven 1-minute segments were processed totaling 746 1-minute segments of recording. Yellow Rail calls and tones at a sub-set of survey stations were also broadcast to test for potential difference in detection distance between humans and ARUs. Using the software Raven Pro or Adobe Audition while listening, listeners viewed the spectrogram of all of the recordings and were permitted to pause and replay portions of the recording to locate Yellow Rails. Counts of individual Yellow Rails were made by viewing a 0.17 second length (the distance between successive ticks) of recording wherein overlapping calls from individual birds can be seen on the spectrogram. P a g e | 14 Single season occupancy models were implemented in Program MARK (White and Burnham 1999). Encounter histories were formatted so that each encounter occasion comprised a 4-day interval. The human survey data had a 13-occasion encounter history (22 May-12 July) and the ARU data had a 14occasion encounter history (18 May-12 July). A candidate set of six models included: : {Ψ(.) p(.)} constant detection, {Ψ(.) p(t)} detection varying over time, {Ψ(.) p(T)} linear trend in detection, {Ψ(.) p(Q)} quadratic trend in detection, {Ψ(.) p(3 periods)} three seasonal periods, and {Ψ(.) p(2 periods)} two seasonal periods. The seasonal periods considered were early- (18-31 May), middle- (1-26 June), and late-season (27-12 July) intervals, and the two season parameterization maintained the early-season interval while combining the middle- and late-season intervals. Table 2 shows the sum of the maximum count of Yellow Rails detected at each survey station by each survey method. For ARUs, detection distance declined steeply at 170 m and was close to zero at 230 m (Fig. 5). Results on human detection distance were inconclusive (Fig. 5), perhaps due to inconsistency between the two different observers involved in the trails. Based on Yellow Rail capture efforts we estimated that calling Yellow Rail can be detected by humans at distances of 350 m to 400 m. The ARU data overwhelmingly supported a model with a quadratic trend in detection, i.e., {Ψ(.) p(Q)} (AIC weight = 0.887), so occupancy estimates were based on this model. There was some model selection uncertainty for the human survey data, so model-averaged estimates were based on the confidence set of models, which included the model with a quadratic trend in detection {Ψ(.) p(Q)} (AIC weight = 0.632) and the model with three seasonal periods {Ψ(.) p(3 periods)} (AIC weight = 0.228). Estimates of occupancy and detection probabilities derived from ARU data were higher with smaller standard errors (Fig. 2). Estimated occupancy from ARU data was 10% greater than the human survey data and the standard error was reduced by ~32%. The different supported model parameterizations of detection resulted in differing seasonal patterns in estimates of detection. At its greatest difference, detection probability from the ARU data was ~60% higher than detection during human surveys, and the standard error was reduced by ~26%. The 323 human conducted surveys required 3,230 minutes of work, not accounting for time spent driving/walking to each survey station. The 746 1-minute segments in the ARU data required 746 minutes of real time sampling with each segment taking between 2-3 minutes to transcribe to a database (2,238 minutes at 3 minutes). Therefore, in real time the human conducted surveys took 1.4 times longer than ARU surveys to detect and count Yellow Rails. In summary, ARU have equivalent or potentially greater potential to detect Yellow Rails. Combined with the other species that can be monitored with ARU the EMCLA is going to focus in 2013 on developing standards for monitoring Yellow Rails and other species using this technology. Table 2. Maximum number of Yellow Rail detected by autonomous recording units and humans at 726 survey stations in Fishing Lake, Saskatchewan. Autonomous Recording Unit Human within 100 m Human Total 192 182 299 P a g e | 15 1.1 1 Detection frequency 0.9 0.8 0.7 0.6 0.5 ARU 0.4 HUMAN 0.3 0.2 0.1 290 270 250 230 210 190 170 150 130 110 90 70 50 0 Distance (m) Figure 5. Detection frequency of broadcasted Yellow Rail calls at various distances by autonomous recording units (ARUs) and humans in Fishing Lake, Saskatchewan. P a g e | 16 2.2 - Factors influencing detection of Yellow Rail in the boreal forest In the Lower Athabasca Planning Region, we located Yellow Rails at three wetlands in 2012 using ARUs. With the listening and processing of recordings done till January 30th, 2013 we have found them at midnight on May 28 and June 1 at wetlands where two 10-minute point count periods have been assessed. At the first site where we located Yellow Rails, we have also listened to 10 full days of recordings to better understand the calling pattern of Yellow Rails. What this means that at the top of every hour for 10 minutes we have determined whether or not a Yellow Rail called on a minute by minute basis for that entire time period. Figure 6 shows the number of visits (10-minute period) that the Yellow Rail gave at least one acoustic cue that was detected by the observer. There were 10 visits at each hour over the 10 day survey period. During this time of the year, this Yellow Rail was detected a maximum of four times during a particular hour, typically between midnight and three AM. Just prior to sunrise and sunset there was a reduction in calling activity. This bird sporadically called during the day but very rarely. While late in the season, this graph demonstrates the uncertainty of determining Yellow Rail presence based on a single 10-minute survey done by a person. When time permits the same process will be done for the other two locations to more fully understand variation in calling behavior which will further optimize the amount of listening needed to detect Yellow Rails. Midnight 6:00 PM 6:00 AM Noon Mean time 00:48 AM: Vector strength 0.584 Figure 6 - Number of times (from a maximum of 10 survey periods) the Yellow Rail at site 29-WSC2 produced a vocalization that was detected at each hour of the day. P a g e | 17 In an effort to maximize the number of time periods listened to at Fishing Lake, SK, Drake used 1-minute survey periods spread across multiple times of day and date. The rationale is that “clumpy” calling behavior (i.e. periods of time when bird calls regularly are interspersed with long periods of silence) may be easier to detect. During the 10-minute periods when this Yellow Rail was in range of the ARU and was known to have called at least once, he called during 45% of the one-minute intervals listened to (range 1-10: SD = 3.0). In other words there were calls interspersed with silence within the 10-minute intervals as well. The number of calls given by this bird when he was singing was also higher at midnight indicating the calling rate also varies with time of day (Figure 7) 4 4 2 4 4 Midnight 2 6:00 PM 6:00 AM 1 1 2 1 Noon 1 1 mean time for highest calling rate 1:53 AM°: vector strength 0.411 Figure 7 - Mean number of minutes per survey period (10 minutes) when the Yellow Rail at site 29-WS2 called as a function of time of day. Only survey periods where the bird was known to have vocalized are shown. The number of survey periods where vocalization rate could be estimated are shown beside each bar. P a g e | 18 Figure 8 - Site 29 - WSC2 – Sampling location where Yellow Rail was monitored for 10 days between July 4 and 12, 2012. High resolution imagery from Bing Maps (Ikonos 1m resolution from GeoEye). P a g e | 19 3 – Where should we sample? Equally important as to how to sample is to determine where to place recorders to optimize learning and maximize detection of Yellow Rail. The following section rationalizes our decisions. 3.1 – Habitat use by Yellow Rail based on historical data In 2011, the EMCLA collated all known Yellow Rail locations in Alberta. These have been integrated with our new detections to evaluate habitat use and selection. The purpose was to test whether we could accurately predict Yellow Rail occurrences using remotely sensed habitat data and whether we adequately sampled likely Yellow Rail habitat as part of the 2012 monitoring program. We used 25 historic Yellow Rail locations that were accurate to <1 km and <20 years old. This was to ensure we accurately measured habitat in time and space at historic locations. We measured habitat within 100 m (fine-grained scale) and 1,000 m (coarse-grained scale) circular radius buffers at each historic Yellow Rail location and ARU site. The fine-grained scale represents the immediate wetland type used by Yellow Rail, whereas the coarse-grained scale may represent the wetland complex used by Yellow Rail, which is also important to Yellow Rail habitat selection (Bazin and Baldwin). In future models we will change this to 150 metres given that this seems to be the distance over which Yellow Rails can be heard. The habitat covariates that we measured were: - vegetation cover type (Castilla et al. 2012) wetland type (Ducks Unlimited 2012 ) moisture regime ([AESRD] 2011) canopy cover density (AESRD 2011) human footprint type (ABMI 2012) We summarized average values of each habitat covariate within buffers and conducted a Mann-Whitney U test with Bonferroni corrected p-values (i.e., p<0.0007) to compare whether habitat types sampled at ARU sites were statistically different from habitat at historic sites. We then created a Yellow Rail spatial distribution model using a resource selection function (RSF) approach (Boyce and MacDonald 1999; Manly et al, 2002). We compared habitat covariates measured at historic locations to habitat measured at wetlands (i.e., minimum proportion of lowland area was 0.5) at randomly sampled locations within the LAPR (i.e., at 5 km intervals). We modelled Yellow Rail occurrence using logistic regression and included different combinations of covariates, including wetland types (i.e., bogs, swamps, marshes, rich graminoid fens, rich shrub fens and other fens ) and vegetation cover types (i.e., forest, shrub, grass, other). We fit a model for covariates measured within 100 m buffers (fine-grain scale) and one for covariates measured within 1,000 m buffers (coarse-grain). Model fit and parsimony were compared using Akaike Information Criterion (AIC), where models with low AIC values have relatively good statistical fit without being overfit (i.e., more covariates than necessary) to the data (Burnham and Anderson 1998). Model(s) that accounted for majority of AIC weight or had delta AIC <2 (Burnham and Anderson 1998) were considered the top models at modelling the relationship between Yellow Rail occurrence and habitat. We calculated a k-fold cross validation to see how predictive each model was, where the model is fit using 80% of the data and its predictability is tested on the withheld 20% of the data for five iterations (Boyce et al. 2002). Finally, we calculated a spatial prediction of Yellow Rail relative probability of occurrence across the LAPR at 100 m and 1,000 m P a g e | 20 scales and aggregated the models into a single prediction by multiplying them together (DeCesare et al. 2012). Not surprisingly, historical Yellow Rail locations were typically located in wet soil moisture environments at fine- and coarse-grain scales (Table 3). Yellow rail also used open habitats (i.e., <31% canopy closure) with little forest cover perhaps with the exception of some black spruce and tamarack. Yellow Rail primarily occurred in graminoid, shrubby and treed rich fens as well as treed poor fens and shrub swamps to a lesser extent. RSF models at fine- and coarse-grained scales that included both wetland and landcover covariates ranked highest according to AIC scores (Table 4). Proportion of shrubland, forest and grass landcover types were retained as landcover covariates and proportion of graminoid rich fen, shrubby rich fen, poor/treed fens, marsh, bog and swamp were retained as wetland covariates in a comparison of landcover and wetland sub-models using AIC. Yellow Rail selected non-forested areas at fine-grained scales, poor/treed fens and swamps at coarse-grained scales and graminoid rich fens at both scales (Table 5). However, RSF models were on average poor predictors of Yellow Rail occurrence at fine- (ρavg = 0.46) and coarse-grained (ρavg = 0.44) scales according to k-fold cross validation (Table 6). Despite producing poor predictive models of Yellow Rail occurrence we nevertheless applied our RSF model across the LAPR (Fig. 9). We caution that our RSF model should not be widely applied to predict Yellow Rail occurrence, particularly for mitigating anthropogenic impacts on Yellow Rails. We apply our model simply because no other regional-scale model of Yellow Rail distribution exists. Our model should be refined with better data when it becomes available and considered within the context that it is not a highly predictive model. Our RSF model indicates high-probability Yellow Rail habitat in the central portion of the LAPR, particularly in the Birch Mountains Wildland area and north of Fort McMurray nearby and to the north of McClelland Lake. Other areas that may support Yellow Rail include to the north of the Cold Lake Air Weapons Range (CLAWR) and the south-central part of the LAPR between Lac La Biche and Cold Lake. P a g e | 21 Table 3. Proportion of habitat in 100 m and 1,000 m buffers around historic yellow rail locations in the Lower Athabasca Planning Region (LAPR) of northeast Alberta. Buffer radius around historic yellow rail detection Habitat Feature (mean proportion of buffer, standard deviation in parentheses) 100 meter 1,000 meter No data (blank) <0.01 0.02 (0.05) Dry <0.01 <0.01 Mesic 0.03 (0.10) 0.15 (0.21) Wet 0.93 (0.22) 0.80 (0.28) <0.01 <0.01 <6% forest canopy closure 0.51 (0.32) 0.33 (0.18) 6-30% forest canopy closure 0.31 (0.30) 0.26 (0.18) 31-50% forest canopy closure 0.05 (0.10) 0.16 (0.12) 51-70% forest canopy closure 0.09 (0.18) 0.18 (0.13) >70% forest canopy closure 0.01 (0.02) 0.03 (0.06) No forest species 0.51 (0.32) 0.33 (0.18) White Spruce 0.04 (0.19) 0.03 (0.06) Black Spruce 0.18 (0.20) 0.30 (0.19) <0.01 <0.01 Jack Pine 0.02 (0.10) 0.04 (0.13) Balsam Fir <0.01 <0.01 Moisture Class* Aquatic Canopy Closure Class* Dominant Forest Species* Lodgepole Pine P a g e | 22 Buffer radius around historic yellow rail detection Habitat Feature (mean proportion of buffer, standard deviation in parentheses) 100 meter 1,000 meter Tamarack 0.21 (0.30) 0.19 (0.16) Trembling Aspen 0.01 (0.02) 0.07 (0.10) Balsam Poplar <0.01 <0.01 Paper Birch <0.01 <0.01 0.77 (0.30) 0.65 (0.20) White Spruce <0.01 0.03 (0.03) Black Spruce 0.09 (0.19) 0.11 (0.11) Lodgepole Pine <0.01 <0.01 Jack Pine <0.01 0.01 (0.03) Balsam Fir <0.01 <0.01 Tamarack 0.09 (0.14) 0.13 (0.08) Trembling Aspen 0.01 (0.04) 0.02 (0.03) Balsam Poplar <0.01 0.01 (0.06) Paper Birch <0.01 <0.01 Upland 0.07 (0.04) 0.18 (0.20) Emergent Marsh 0.01 (0.07) 0.01 (0.04) Meadow Marsh <0.01 <0.01 Graminoid Rich Fen 0.12 (0.25) 0.05 (0.09) Graminoid Poor Fen 0.02 (0.05) 0.02 (0.02) Shrubby Rich Fen 0.16 (0.20) 0.12 (0.13) Sub-dominant Forest Species* No forest species Wetland Class† P a g e | 23 Buffer radius around historic yellow rail detection Habitat Feature (mean proportion of buffer, standard deviation in parentheses) 100 meter 1,000 meter 0 <0.01 Treed Rich Fen 0.23 (0.23) 0.21 (0.13) Treed Poor Fen 0.18 (0.17) 0.23 (0.13) 0 <0.01 Shrubby Bog 0.01 (0.03) <0.01 Treed Bog 0.04 (0.13) 0.03 (0.09) Shrub Swamp 0.12 (0.22) 0.06 (0.07) Hardwood Swamp <0.01 0.01 (0.02) Mixedwood Swamp 0.01 (0.04) 0.01 (0.02) Tamarack Swamp 0.03 (0.12) 0.01 (0.02) <0.01 0.04 (0.04) Water <0.01 0.02 (0.05) Snow/Ice <0.01 <0.01 Rock/Rubble <0.01 <0.01 Exposed Land 0.04 (0.19) 0.01 (0.04) Developed 0.02 (0.08) 0.01 (0.04) Shrubland 0.72 (0.35) 0.48 (0.25) Grassland 0.03 (0.11) 0.04 (0.10) Agriculture <0.01 0.01 (0.04) Conifer Forest 0.12 (0.22) 0.29 (0.19) Broadleaf Forest 0.07 (0.17) 0.12 (0.13) Shrubby Poor Fen Open Bog Conifer Swamp Landcover Class‡ P a g e | 24 Buffer radius around historic yellow rail detection Habitat Feature (mean proportion of buffer, standard deviation in parentheses) 100 meter 1,000 meter <0.01 0.02 (0.05) Residential Urban <0.01 <0.01 Residential Rural <0.01 <0.01 Urban/Rural Greenspace <0.01 <0.01 High-human Density Commercial/Industrial <0.01 <0.01 0.10 (0.15) 0.07 (0.08) Hard linear road/rail/industrial features >20 m wide <0.01 <0.01 Hard linear road/rail/industrial features 10-20 m wide <0.01 <0.01 Soft linear urban/industrial features 10-20 m wide 0.01 (0.03) <0.01 Soft linear urban/industrial features 2-10 m wide 0.03 (0.02) 0.01 (0.01) <0.01 <0.01 0.01 (0.02) <0.01 Dugout <0.01 <0.01 Lagoon <0.01 <0.01 Reservoir <0.01 <0.01 Agriculture 0.02 (0.12) 0.01 (0.05) Pasture <0.01 <0.01 Forestry Clear Cut <0.01 <0.01 Mixedwood Forest Human Footprint Class** Low-human Density Industrial Vegetated Road Vegetated verges and ditches along roads * Source: Alberta Environment and Sustainable Resource Development. 2011. Alberta Vegetation Inventory (AVI) Crown Polygons. Government of Alberta, Edmonton, Alberta. Available from: http://www.srd.alberta.ca/LandsForests/VegetationInventoryStandards.aspx P a g e | 25 † Source: Canadian Wetland Inventory. 2012. Ducks Unlimited. Available from: http://maps.ducks.ca/cwi/ ‡ Source: Alberta landcover classification map. 2012. Alberta Biodiversity Monitoring Institute. Available from: http://abmi.ca/abmi/home/home.jsp ** Source: Alberta human footprint classification map. 2012. Alberta Biodiversity Monitoring Institute. Available from: http://abmi.ca/abmi/home/home.jsp P a g e | 26 Figure 9 – Predictive RSF model based on Yellow Rail presences. Hotter colors indicate areas with higher selection. Higher selection indicates areas more likely to be used than expected based on the availability of that habitat. P a g e | 27 Table 4. Ranking of resource selection function (RSF) models for yellow rail at small (100 m buffer) and large (1,000 m) scales in northeast Alberta. 100 meter buffer 1,000 meter buffer AIC ΔAIC AIC weight AIC ΔAIC AIC weight Wetland + Landcover 200.5 0.0 0.999 204.30 0.00 1.000 Wetland 239.3 38.9 0.000 227.62 23.32 0.000 Landcover 214.2 13.8 0.001 254.22 49.92 0.000 Model P a g e | 28 Table 5. Beta coefficients, standard errors, z and p-values and odds ratios of covariates used to model yellow rail habitat selection at small (100 m buffer) and large (1,000 m buffer) scales in northeast Alberta. 100 meter buffer 1,000 meter buffer β SE z p-value β SE z p-value Forest -2.64 0.99 -2.66 0.01 -2.53 1.70 -1.49 0.14 Shrub 1.10 0.90 1.23 0.22 1.89 1.81 1.04 0.30 Grass -1.77 1.56 -1.13 0.26 N/A N/A N/A N/A Graminoid Rich Fen 5.41 2.18 2.48 0.01 16.75 4.39 3.82 <0.01 Shrubby Rich Fen 0.93 2.17 0.43 0.67 1.19 1.96 0.61 0.54 Poor/ Treed Fen 2.02 2.08 0.97 0.33 5.46 1.23 4.45 <0.01 Marsh 0.26 1.86 0.14 0.89 -1.03 3.44 -0.30 0.76 Bog -2.38 2.61 -0.91 0.36 -5.82 4.11 -1.41 0.16 Swamp 1.67 2.24 0.75 0.46 4.12 1.64 2.51 0.01 Constant -4.60 1.77 -2.59 0.01 -6.18 2.03 -3.04 <0.01 Covariate P a g e | 29 Table 6. Spearman correlation coefficients (ρ) from k-fold cross validation of resource selection function models of yellow rail in northeast Alberta at two different scales (100 m and 1,000 m) using all covariates (global) and shrub and fen cover covariates. Spearman ρ Group 100 meter 1,000 meter 1 -0.09 0.27 2 0.47 0.39 3 0.70 0.52 4 0.61 0.61 5 0.61 0.39 Average 0.46 0.44 P a g e | 30 3.2 – EMCLA ARU distribution relative to selected Yellow Rail habitat in 2012 We overlaid ARU sites from 2012 onto the Yellow Rail RSF and calculated mean RSF values within 100 m circular buffers around each site. We binned ARU’s by average RSF value to determine how much highselection Yellow Rail habitat we sampled in 2012. We found that we may have under-sampled some many of the vegetation/ wetland classes at ARU sites compared to historic Yellow Rail locations, according to Mann-Whitney U tests (Table 7). Again, this is because most of the impacted areas we studied did not have good quality Yellow Rail habitat. Thus, our sample was not designed to optimally find Yellow Rails but to sample as many species as possible in relation to level of human disturbance. Specifically, in 2012 our ARU sites sampled areas with significantly lower proportion of wet soil moisture habitats at fine and coarse-grain scales (z = -4.329, p < 0.0001; z = -4.564, p < 0.0001, respectively). Instead, we tended to sample near deeper open-water wetlands that were more common near processing facilities. We also under-sampled graminoid poor fens at fine- (z = -3.522, p = 0.0004) and coarse-grained (z = -5.541, p < 0.0001) scales and shrubby (z = -5.321, p < 0.0001) and treed rich fens (z = -4.300, p < 0.0001) at coarse-grained scales. We may also have under-sampled shrubland land cover types at fine- (z = -7.946, p < 0.0001) and coarse-grained (z = -7.081, p < 0.0001) scales. Although few ARUs deployed in 2012 were located in what the RSF predicted as high-probability Yellow Rail habitat, five were located in areas with a mean RSF score >0.5 within 100m of the ARU. These sites were distributed throughout the LAPR, including one 15 km north of Lac La Biche at an unimpacted site (i.e., low human footprint) sampled in early summer, two in the McClelland Lake fen at impacted and unimpacted sites sampled in early and late summer, respectively and two sampled 25 km west of Cold Lake at an unimpacted site sampled in early and late summer. At three of these sites we found Yellow Rails, which were near Cold Lake and Lac La Biche. The issues related to lower numbers of detections of Yellow Rails in 2012 is not because of the ARU technology but because of the EMCLA focus on impacted versus non-impacted sites. In 2013, this focus will shift so that we fully document distribution, occurrence and abundance of Yellow Rails in the best habitat conditions for the Yellow Rail. P a g e | 31 Table 7. Significant differences between proportion of habitat in 100 m and 1,000 m buffers around historic yellow rail locations and autonomous recording unit (ARU) sites in the Lower Athabasca Planning Region (LAPR) of northeast Alberta. Over-sampling is indicated by ↑ and under-sampling by ↓. MannWhitney test z values and p-values are indicated in parenthesis. Buffer radius around historic yellow rail detection Habitat Feature (significant Mann-Whitney test) 100 meter 1,000 meter No data (blank) - - Dry - - - ↑ (z = 4.226, p < 0.0001) ↓ (z = -4.329, p < 0.0001) ↓ (z = -4.564, p < 0.0001) - - <6% forest canopy closure - - 6-30% forest canopy closure - - 31-50% forest canopy closure - - 51-70% forest canopy closure - - >70% forest canopy closure - - ↑ (z = 4.052, p = 0.0001) ↑ (z = 4.839, p < 0.0001) - ↑ (z = 3.751, p = 0.0002) - - Moisture Class* Mesic Wet Aquatic Canopy Closure Class* Wetland Class† Upland Emergent Marsh Meadow Marsh P a g e | 32 Buffer radius around historic yellow rail detection Habitat Feature (significant Mann-Whitney test) 100 meter 1,000 meter Graminoid Rich Fen - - Graminoid Poor Fen ↓ (z = -3.522, p = 0.0004) ↓ (z = -5.541, p < 0.0001) - ↓ (z = -5.321, p < 0.0001) - ↑ (z = 3.680, p = 0.0002) - ↓ (z = -4.300, p < 0.0001) Treed Poor Fen - - Open Bog - - Shrubby Bog - - - ↑ (z = 5.200, p < 0.0001) Shrub Swamp - - Hardwood Swamp - - Mixedwood Swamp - - Tamarack Swamp - - Conifer Swamp - - Water - - Snow/Ice - - Rock/Rubble - - Exposed Land - - Shrubby Rich Fen Shrubby Poor Fen Treed Rich Fen Treed Bog Landcover Class‡ P a g e | 33 Buffer radius around historic yellow rail detection Habitat Feature (significant Mann-Whitney test) 100 meter 1,000 meter Developed - - Shrubland ↓ (z = -7.946, p < 0.0001) ↓ (z = -7.081, p < 0.0001) - ↑ (z = 4.708, p < 0.0001) - ↓ (z = -3.697, p = 0.0002) - ↑ (z = 3.822, p = 0.0001) - - - ↑ (z = 4.214, p < 0.0001) Residential Urban - - Residential Rural - - Urban/Rural Greenspace - - High-human Density Commercial/Industrial - - ↓ (z = -4.353, p < 0.0001) ↓ (z = -4.581, p < 0.0001) Hard linear road/rail/industrial features >20 m wide - - Hard linear road/rail/industrial features 10-20 m wide - - Soft linear urban/industrial features 10-20 m wide - ↑ (z = 4.003, p = 0.0001) ↓ (z = -4.462, p < - Grassland Agriculture Conifer Forest Broadleaf Forest Mixedwood Forest Human Footprint Class** Low-human Density Industrial Soft linear urban/industrial features 2-10 m wide P a g e | 34 Buffer radius around historic yellow rail detection Habitat Feature (significant Mann-Whitney test) 100 meter 1,000 meter 0.0001) Vegetated Road - - Vegetated verges and ditches along roads - - Dugout - - Lagoon - - Reservoir - - Agriculture ↓ (z = -3.697, p = 0.0002) - Pasture - - Forestry Clear Cut - - * Source: Alberta Environment and Sustainable Resource Development. 2011. Alberta Vegetation Inventory (AVI) Crown Polygons. Government of Alberta, Edmonton, Alberta. Available from: http://www.srd.alberta.ca/LandsForests/VegetationInventoryStandards.aspx † Source: Canadian Wetland Inventory. 2012. Ducks Unlimited. Available from: http://maps.ducks.ca/cwi/ ‡ Source: Alberta landcover classification map. 2012. Alberta Biodiversity Monitoring Institute. Available from: http://abmi.ca/abmi/home/home.jsp ** Source: Alberta human footprint classification map. 2012. Alberta Biodiversity Monitoring Institute. Available from: http://abmi.ca/abmi/home/home.jsp P a g e | 35 4 - Impact assessment hypotheses for determination of oilsands effects Part of the EPEA process is to determine effects of oilsands development on Yellow Rail. There is insufficient data to do this currently. A first step in determining impacts is to use conceptual models to identify possibly ways oilsands mining might affect Yellow Rails 4.1 – Environment Canada effects pathways for Yellow Rail As part of the Joint Oil Sands Monitoring program, Environment Canada has been developing preliminary effects pathways that act as conceptual models to direct future monitoring and research for the Yellow Rail. The following is a direct summary of that information provided by Craig Machtans of Environment Canada. Only those aspects of model relevant to the breeding grounds are shown (Figure 10). Note these pathways are deemed preliminary and are under review. At the end of each issue identified by Environment Canada, we identify ways that the EMCLA and member companies will use previously collected data and the data from 2013 to assess impacts and mitigation strategies. Issue 1 - Habitat Loss: Activities associated with oil and gas development in Alberta, such as oilsands mines, pipelines and power lines, have contributed to habitat loss (Oil Sands Wetlands Working Group, 2000). Water management activities such as the drainage, diking, infilling, and diversion of wetlands contribute to local habitat loss (COSEWIC, 2009). The resulting decrease in stand-level habitat area impacts fecundity and summer growth/condition. Changes in stand-level habitat area will have cumulative effects on landscape-level changes. By identifying what environmental conditions represent habitat for Yellow Rail via an extensive survey over the entire Lower Athabasca planning region, the EMCLA will be able to document which areas disturbed by oil and gas could be deemed as “lost” because of energy sector activities. By documenting water depth in suitable vegetation in areas with and without Yellow Rails (both currently and using historical data, where available), potential thresholds of water draw down or changes in flow will be identified. This assumes that significantly more Yellow Rails are located in 2013 to be able to generate the necessary model information. Issue 2 - Habitat Transformation: The conversion of habitats for agriculture results in habitat transformation from wetlands (bogs, fens, marshes) to other habitat types unsuitable for Yellow Rail. However, Yellow Rail will still use some cultivated landscapes for habitat. In Alberta there have also been several sites that were historically occupied by Yellow Rail that have been taken over by agriculture for use as range for grazing livestock (Prescott et al., 2003) (i.e. conversion to an alternate land use). Linear clearing for utility corridors (e.g. pipelines and power lines) associated with oil and gas projects in Alberta may result in habitat transformation in addition to the habitat loss described above (COSEWIC, 2009). While patch clearing may not have a direct impact on Yellow Rail habitat, it does result in the transformation of adjacent forest lands that changes the landscape-level habitat matrix. The resulting decrease in stand-level habitat area impacts fecundity and summer growth/condition. Changes in stand-level habitat area will have cumulative effects on landscape-level changes. The cluster design used in 2013 will allow multi-scale evaluation of local, stand, and landscape level variation in land-use as a factor influencing Yellow Rail habitat use within wetlands. This will be done by pooling data from multiple ARUs to conduct site and cluster level analyses to test landscape level responses. Areas are being sampled in agricultural landscapes to determine how complete landscape P a g e | 36 conversion influences Yellow Rails when the wetland remains. Density and occurrence of Yellow Rail will be compared to similar wetland types surrounded by forest. Variation in total human footprint does exist around these wetlands but there is not an optimized human footprint gradient simply because many areas with high energy sector footprint do not have suitable Yellow Rail habitat. We will NOT be evaluating any element of Yellow Rail fecundity etc. This requires a far better understanding of Yellow Rail abundance and distribution in the boreal forest to warrant the effort. Issue 3 - Landscape-level Changes: Several landscape-level changes will affect Yellow Rail habitat. Modification or reconfiguration of wetlands across the landscape may result from the cumulative changes in stand-level habitat area. Alteration of hydrologic regimes may occur concurrently, as well as being influenced by climate change and water management activities across the landscape (COSEWIC, 2009). Such landscape-level changes in may result from the cumulative effects of many, independent, local-scale water management activities or from large-scale water management activities that have landscape-scale effects. Reclamation efforts that do not restore wetlands to their original types will not restore habitat for Yellow Rail. For example, oilsands development in Alberta is resulting in the loss of fens, which are then being replaced by other types of wetlands, if restored at all (Oil Sands Working Group, 2000).Such landscape-level changes may affect summer growth/condition and affect the quality of habitat sites available. Changes in the landscape-level habitat matrix, through the cumulative impacts of the loss and transformation of stand-level habitats and surrounding areas, can influence changes in predator communities that may increase predation and/or nest predation. The statistical models developed for issue 2, if sufficient Yellow Rails are detected, will be able to predict the amount of Yellow Rail habitat that exists currently. Using future scenario models, the amount of habitat that will be lost and for what period of time can be modeled. This will NOT be something that EMCLA will do in 2013 but the models can be provided to interested parties. Predator responses to industrial development are not a direct objective of EMCLA. However, EMCLA is monitoring boreal owls and would be able to report on whether or not shifts in owl occurrence in relationship to energy sector footprint are being observed. Data from visual observations within ABMI could be used to model the response of other raptors but will NOT be part of EMCLA modeling in 2013. Issue 4 - Site-level Habitat Quality: Yellow Rails have specific site-level habitat needs. They require marshy wet areas with extensive, short, grass-like vegetation that remain wet throughout the breeding season but maintain standing water levels less than 15 cm of standing water. They also require a senescent layer of grass-like vegetation, mostly for nesting material. Stressors that affect these characteristics will reduce site-level habitat quality. Water level is particularly sensitive to annual climate variability, but will also be affected by broader changes in hydrology due to climate change and anthropogenic water management activities. The formation of a senescent layer of vegetation in agricultural habitats is affected several stressors. Grazing by livestock can prevent the formation of a senescent layer by removing vegetation (Robert, 1997; Lundsten and Popper, 2002; Grace et al., 2005). Burning can be an effective tool for promoting dense graminoid growth but may destroy the senescent layer or prevent it from forming if applied too infrequently or too frequently, respectively (Burkman 1993; Mizell 1998; Robert et al. 2000). Mowing or haying, can be effective tools for maintaining Yellow Rail habitat, but if applied inappropriately it can be responsible for the removal of the senescent layer (Robert et al. 2000). Changes in site-level habitat quality contribute to changes in stand-level habitat quality, which affects fecundity and summer growth/condition. P a g e | 37 As described in issue 1, we will validate the water depths required by Yellow Rail via our on the ground habitat sampling (see below). Grazing is deemed irrelevant to energy sector impacts and will not be addressed. Mowing and haying are not likely appropriate mitigation tools for boreal environments. Burning as a mitigation option is possible but when and why it would be applied needs further evaluation. We will not explore this directly. Instead, it is proposed that in 2014 an additional project looking at how YERA respond to natural fires within various fen types be evaluated. Identifying the fen types most likely to be used by YERA must be done first however. Issue 5 - Degradation of Wetlands: Because Yellow Rail is dependent on wetland habitats, stressors that result in the degradation of wetlands will contribute to a decrease in stand-level habitat quality. The wetlands used by Yellow Rails are susceptible to siltification and acidification (Cohen and Kost, 2007). Water management activities such as water extraction or diversion associated with oil and gas developments, especially oilsands extraction, can contribute to degradation of stand-level wetland habitats in addition to their landscape-level impacts on hydrologic regimes, as represented above. Wetlands gather run-off and therefore water pollution, especially from agricultural chemicals but also from other sources, can lead to the contamination of wetland habitats. Changes in hydrology due to climate change may further exacerbate these processes. Wetland degradation may impact fecundity and summer growth/condition through a reduction in stand-level habitat quality. Water depth will be evaluated as part of the 2013 Yellow Rail Monitoring program; however, water quality data will not be collected. If member companies would like to consider this option, the samples could be processed via ABMI water chemistry protocols. However, there is no budget for this currently and more resources would be required to do so. Issue 6 - Predator Communities: Raptors appear to be the primary predator of Yellow Rails, though they may be vulnerable to foxes and herons as well (Walkinshaw, 1939; Grace et al., 2005). It is suspected that eggs and nestlings may be vulnerable to a range of predators (COSEWIC, 2009). A study in Oregon found evidence of nest predation by Red-winged Blackbirds and Marsh Wrens. Bookhout (1995) reports that there is no information available on nest parasitism for Yellow Rails. As illustrated in the higher level models, landscape-level changes in the spatial configuration of habitat types can result in changes in predator communities. Changes in predator communities may have direct impact on summer survival or fecundity, through increased predation or nest predation, or impacts on fecundity and summer growth/condition, through a reduction in stand-level habitat quality. See our response via issue 3. In addition, companion studies are being done on mammal response to energy sector development via remote cameras. These data could be used to evaluate risks from predators. The technology used to survey Yellow Rail will also allow detection of Marsh Wrens and Red-winged Blackbirds. Nest searching for Yellow Rail will NOT be done. Issue 7 - Disruption of Activities: Although little evidence exists, Yellow Rail is believed to be intolerant of human disturbance (COSEWIC, 2009). Therefore human intrusion into Yellow Rail habitat, whether for recreational or industrial purposes, is likely to result in disruption of normal activities. For example, all-terrain vehicles (ATVs) can disturb wetland birds (NBDNR, 2008). Grazing livestock can disturb Yellow Rail activities (Robert, 1997). Agricultural operations (e.g., mowing, cropping and haying) that do not result in incidental take may still disturb Yellow Rail. Disruption of activities could influence fecundity or summer growth/condition depending on what activities are disrupted. P a g e | 38 We will evaluate whether noise and light levels at the sites surveyed influence the occurrence and/or abundance of Yellow Rail. This will be done by estimating industrial and road noise at sites with and without Yellow Rail. The models that include noise and light level will control for other sources of variation such as habitat conditions and industrial footprint. Note because relatively little Yellow Rail habitat is directly adjacent to industrial facilities such models will have very low statistical power. Issue 8 - Water Pollution and Pesticides: Water pollution is an important stressor because wetlands gather run-off and thus indirectly expose Yellow Rail to contaminants collected from across the drainage, which can lead to a variety of impacts (COSEWIC, 2009). Pollution from agriculture is especially relevant to Yellow Rail, but pollutants from other industrial activities within the same drainage may also accumulate in wetlands. Water pollution can result in decreased prey abundance and degradation of wetlands, both of which are discussed above. Pesticides are known to reduce hatching success in other rail species (Schwarzbach et al., 2006), therefore the model infers that this pathway occurs through toxicity impacts on Yellow Rail, which can then affect fecundity and presumably summer growth/condition. Pesticides are known to reduce prey abundance (arthropods, especially beetles, spiders and flies) for other rail species (Schwarzbach et al., 2006). Decreasing prey abundance may impact summer survival directly or may impact fecundity and summer growth/condition through a reduction in stand-level habitat quality. COSEWIC (2009) does not mention the possibility of direct mortality from pesticides (i.e. incidental take), but given the exposure of Yellow Rail to pollution, the model includes this pathway based on inferences from other species. At this time we will NOT evaluate whether pollution in wetlands is an issue. We would surmise that ongoing studies by JOSM related to air and water monitoring can identify whether or not there are issues of concern. We assume that such models could be used in the future with predictive models of Yellow Rails to evaluate the overlap in Yellow Rail habitat and pollutant issues. Issue 9 - Incidental Take – Breeding Season: Throughout its life cycle, Yellow Rail is vulnerable to fairly high levels of incidental take due to agricultural operations, such as mowing, cropping or haying. Yellow Rails may also be vulnerable to predation by cats (COSEWIC, 2009). Damage to Yellow Rails and their nests has been accidentally caused by birders at several sites (Cochrane Environmental Consultants Inc. 1998; Alvo and Robert 1999; Lindgren 2001). Although there is no information for Yellow Rail, pesticides are known to directly affect other rail species (Schwarzbach et al., 2006). Yellow Rail may be vulnerable to collisions with structures and fences in their breeding range in addition to their migratory range. Incidental take directly affects survival. We foresee that direct clearing of land for energy development during the breeding season would be the primary route for incidental take. In addition, removing shrubs or mowing grass on wellpads and pipelines may also result in incidental take. Policies are in place to minimize these clearing activities by energy companies but each company will undertake a review of their policies and how this pertains to Yellow Rails. Much of the habitat that is thought to be used by Yellow Rails is too wet to safely operate during the breeding season. However, the amount of clearing and/or reclearing during the Yellow Rail breeding season could be reported by individual companies. Collisions for Yellow Rails are NOT something that will be addressed by EMCLA. P a g e | 39 Figure 10 - Conceptual model representing the pathways of effects of core hypotheses affecting population status of Yellow Rail. Numbers correspond to issues described above. From Nelitz, M., A. Hall., C. Wedeles, and C. S. Machtans. 2012. Effects pathways for Biodiversity monitoring in the oilsands area: species models. Unpublished report prepared for Environment Canada by ESSA Technologies Ltd., Vancouver, BC. P a g e | 40 5 - 2013 workplan for Yellow Rail Monitoring The primary objectives for 2013 are to understand: 5.1 - Spatial distribution within 7 km of roaded areas in LAPR The map below shows the general areas where sampling for Yellow Rails will occur to assess the spatial distribution of the species. Models that take into account spatial location will be created via trend surface analyses and spatial autocorrelation statistics. Figure 11 – Locations of 2012 ARU and proposed 2013 Yellow Rail sampling sites in Lower Athabasca planning region. The locations shown in map above were identified as being the best potential Yellow Rail habitat in the LAPR based on overlaying our RSF model and by looking for graminoid fens and marshes. There P a g e | 41 are 199 proposed sites within 47 clusters on the map. There are 4sites per cluster. Each site has 5 stations. Clusters are either a large wetland complex or a series of smaller complexes with a few kilometers of each other. A site is identical in spacing to the ABMI sampling grid (600 meters to the far corners) and will use 5 ARUs to determine the abundance of Yellow Rails. Each station has one ARU that will be in place from 7-14 days depending on the number of people available to move the ARUs. Clusters were selected by finding areas in the LAPR that the RSF predicted might be suitable and that had graminoid fens or emergent/ meadow marshes. Building from these specific wetlands we then selected sites within a cluster that varied the types of wetlands that could be sampled to address the questions that follow. Clusters are being monitored by EMCLA staff, Devon, Nexen, Suncor, Shell, and Imperial. The schedule is described in detail in the Appendix for the Suncor, Shell, and Imperial. Figure 12 – Example of cluster, site, and station design used by EMCLA to monitor wetland animals. P a g e | 42 5.2 - Determine which wetland classes support Yellow Rails At the point level, the sites selected emphasize fen habitat which is where most Yellow Rails have been detected in Alberta. However, they also have been found in shrub swamp, marshes, and occasionally bogs. To develop the most robust model possible it is important to confirm that other habitat classes do not have Yellow Rails. In addition, several of the other questions posed below require that these other habitat classes are sampled. These categories were derived from Ducks Unlimited’s Enhanced Wetland Classification and were validated by looking at Spot Imagery and Alberta Vegetation Inventory where available. Table 8 – Approximate number of stations that have either been surveyed or are likely to be surveyed for Yellow Rails with ARUs within each of the Duck’s Unlimited habitat classes from the Enhanced Wetland Inventory. DU Habitat Class Conif/ Tamarck Swamp Decid/ Mixed Swamp Shrub Swamp Marsh Graminoid Poor Fen Graminoid Rich Fen Shrubby Poor Fen/Bog Shrubby Rich Fen Treed Poor Fen Treed Rich Fen Treed Bog Upland Decid/ Mixed Upland Pine/ Conifer TOTAL N 40 20 80 31 22 132 46 127 100 140 51 76 61 ~943 P a g e | 43 5.3 - Does the density of Yellow Rails vary as a function of graminoid fen size? 10 5 0 Frequency 15 20 The habitat where Yellow Rails has been found most often in the LAPR is graminoid fens. To test whether graminoid fen size influences Yellow Rail density we have sampled a range of graminoid fen sizes. This figure shows the distribution of areas of graminoid fen habitat that might be sampled. The number of ARU stations in each area class is shown. 0 2 lnarea1 4 6 Figure 13 – Histogram showing the number of stations that will be within graminoid fens of certain sizes (note units are ln-transformed+1). P a g e | 44 5.4 - How many shrubs and trees in a fen are too much for the Yellow Rail? 0 50 Frequency 100 150 Given the literature on Yellow Rails, grasses and sedges are important elements of Yellow Rail habitat. Thus, shrubs and trees may influence the suitability of fens as Yellow Rail habitat. Within areas with some graminoid fen, we will evaluate if the percentage of graminoid, shrub, and treed fen influences Yellow Rail occurrence. The following histograms show the number of stations that will be sampled in each compositional class. If this analysis reveals a pattern then we may use high-resolution imagery to better document the composition structure of the fens. .2 .4 .6 Proportion graminoid fen .8 1 .8 1 60 0 20 40 Frequency 80 100 0 .2 .4 .6 percwetshrub 0 .2 .4 100 50 0 Frequency 150 200 0 perctree .6 .8 1 Figure 14 - Histograms showing proportion of graminoid, shrub, and treed fen within 150 metres of proposed sampling stations P a g e | 45 5.5 - Determining annual variation in Yellow Rails by revisiting known locations Of the ~50 detections of the Yellow Rail with the mineable oilsands region, we will place ARUs such that ~45 should be detected if the birds are present this year. In addition, we have numerous other stations in the McClelland Lake area that have suitable survey locations. Many of the other locations from FWMIS where Yellow Rails have been detected have coordinate estimates that were very coarse. We have looked in detail at the Yellow Rail locations from FWMIS and placed the ARUs in areas that are likely to have Yellow Rail (fen and marsh habitat that is closest to the FWMIS point). All three locations where Yellow Rail were found by EMCLA will be revisited. The goal of this part of the design is to establish inter-annual variability. There is a possibility that Yellow Rail are like waterfowl and may only use the boreal forest in years when wetland conditions in the prairies are poor. Understanding this variation will be crucial for creating an effective monitoring plan. Figure 15 – Map showing historical locations of Yellow Rails in Alberta. P a g e | 46 5.6 - What are the local habitat conditions required by Yellow Rails? In order to further our knowledge of Yellow Rail habitat, we will be collecting habitat and vegetation measurements for each recorder location. Collecting vegetation and other abiotic data will help to understand the ecology of the Yellow Rail. 5.6.1 - Plot Design The ARU will be the center of each habitat plot (Figure 16). The habitat plot will encompass a 150 m circular area around the ARU. Five sub-plots will be associated with each recorder location: one directly beneath the recorder and four others spaced 50 m in each cardinal direction from the recorder. There cardinal sub-plots will be named N, E, S, W and C (center) for their respective locations. A tape measure or measuring chain will be used to accurately measure the distance between the center plot and the cardinal plots. Sub-plots will measure 2 m x 2m. Figure 16 – Layout of habitat sampling plots. In some scenarios, the ARU will require installation along a forest edge, where the wetland in question might encompass only a fraction of the area near the recorder. In order to distribute the sub-plots evenly, some basic arithmetic will find out the compass heading of each sub-plot. To find the heading of each directional sub-plot (a, b, c, d): d = (x + 7y)/8 c = d + (x – y)/4 b = c + (x – y)/4 a = b + (x – y)/4 where x and y are the respective headings where the wetland is delineated and a through d the subplots. Indicate the compass heading of each of the sub-plots. The center sub-plot will remain “C”. Stations entirely with upland will not be sampled (Figure 17). P a g e | 47 Figure 17 – How to avoid surveying upland habitat near wetland/ forest ecotone. 5.6.2 - Habitat Identification The Canadian Wetland Classification System recognizes various wetland classes based on their overall genetic origin. In this study, we will differentiate visited sites into bog, fen, swamp, marsh, shallow water and open water. In addition, we will identify non-wetland habitat types when present. Differentiation will include deciduous upland, conifer upland and mixedwood upland. Other habitat types include burns and human impact (i.e. well pads, roads, quad trails). At every recorder station, we will draw an aerial –view map detailing the surrounding area by hand. The map should include all habitat types within a visible 150-meter circular radius of the recorder. Note any other important features, such as, gas wells, roads or linear features (i.e. seismic lines). If significant features or habitat types exist beyond 150 m, make note of them in the comments section. If possible, further details about the recorder site can be collected; defining wetland types usually involves knowledge of the hydrological regime and vegetation community. However, this might not always be possible to see at a distance of 150 m, or could be ambiguous in the immediate area. The Boreal Plains Ecozone Wetland Classification Key from Ducks Unlimited Canada breaks down to wetland ecosite the various types of habitat you may encounter. For this study, navigate through the key to identify wetlands as best as possible based on safety, time constraints and personal ability. P a g e | 48 Figure 18 – Mapping wetland types onto SPOT Imagery. 5.6.3 - Vegetation Measurements We will also be recording certain biotic and abiotic indices at each recorder station: water depth, vegetation composition, and horizontal cover. Water Depth: Measure water depth at each 50-m sub-plot. Place a meter stick until it hits solid soil or dense wetland vegetation (e.g. do not penetrate the soil strata). Repeat three times to create an average for each sub-plot. Vegetation Composition: The vegetation composition will be analyzed based on different types of wetland plants. Using the meter stick we will measure a 2 m x 2 m area for each sub-plot. Within the boundaries of the sub-plot, estimate the total cover percentage of each of the following classes of vegetation when applicable: open water, bare ground, grasses, sedges, rushes, bulrush, cattail, Phragmites, emergent forbs, emergent shrubs, moss, lichen and dead vegetation cover. A list of various types of vegetation you may encounter throughout different wetland types in included in Tables 10-14. As with the wetland identification, identify sub-plot vegetation down to species when possible. Horizontal Cover: Using the cover board, one observer will stand at the location of the sub-plot and the second observer 10 m towards the center sub-plot. Percentage of vegetation cover will be taken at intervals of 50 cm (0-50 cm and 50 -100 cm). Indicate primary species (genus or family if species is not known) of vegetation cover. Indicate also if the vegetation is alive or dead. P a g e | 49 TABLE 9 – Wetland vegetation identification based on tree species Wetland Type Bog Poor/Rich Fen Hardwood Swamp Mixedwood Swamp Tamarack Swamp Conifer Swamp Shrub Swamp Marsh/Shallow Water/Open Water Primary Conifer Species Present Black Spruce (Lowland Form) Tamarack, Black Spruce None Black Spruce, Tamarack, Balsam Fir Tamarack Black Spruce, Balsam Fir None None Primary Deciduous Species Present None None Balsam Poplar, Paper Birch Balsam Poplar, Paper Birch None None None None Tree Height 2-10 m 2-10 m >10 m N/A N/A N/A N/A - P a g e | 50 TABLE 10 – Wetland vegetation identification based on shrub species Wetland Type Shrub Layer Composition Bog Poor Fen Rich Fen Conifer Swamp Tamarack Swamp Mixedwood Swamp Hardwood Swamp Shrub Swamp Marsh/Shallow Water/Open Water Rhododendron groenlandicum, Vaccinium spp., Kalmia spp. Betula spp., Rhododendron groenlandicum, Chamaedaphne calyculata, Oxycoccus macrocarpus, Vaccinium vitis-idaea, Salix spp. Myrica gale, Potentilla fructiosa, Betula spp., Andromeda polifolia, Chamaedaphne calyculata, Juniperus spp., Lonicera villosa, Rhamnus alnifolia, Salix spp., Rhododendron groenlandicum Chamaedaphne calyculata, Betula pumila, Betula glandulosa, Gaultheria hispidula, Kalmia polifolia, Ledum groenlandicum, Lonicera villosa, Oxycoccus microcarpus, Vaccinium myrtilloides, Salix spp. Andromeda polifolia, Betula papyrifera, Chamaedaphne calyculata, Lonicera villosa, Myrica gale, Potentilla fruticosa, Rhamnus alnifolia, Ledum groenlandicum, Salix spp. Salix spp., Alnus spp., Cornus stolonifera, Rhamnus alnifolia Salix spp., Alnus spp., Cornus stolonifera, Rhamnus alnifolia Salix spp., Alnus spp., Cornus stolonifera, Rubus idaeus None Shrub Height <2 m <2 m <2 m N/A N/A N/A 0-10 m >2 m - P a g e | 51 TABLE 11 – Wetland vegetation identification based on forb species Wetland Type Forb Layer Composition Bog Drosera spp., Maianthemum trifolium, Rubus chamaemorus, Sarracena purpurea Poor Fen Drosera spp., Equisitem fluviatile, Maianthemum trifolium, Menyanthes trifoliata, Sarracenia purpurea, Scheuchzeria palustris Rich Fen Drosera spp., Equisitem fluviatile, Galium spp., Maianthemum trifolium, Menyanthes trifoliata, Parnassia palustris, Potentilla palustris, Sarracena purpurea, Scheuchzeria palustris, Tofeldia glutinosa Hardwood Swamp Corylus cornuta, Equisitem fluviatile, Galium spp., Rubus spp., Ribes spp., Salix spp. Cornus stolonifera Mixedwood Equisitem fluviatile, Galium spp. Swamp Tamarack Swamp Caltha palustris Conifer Swamp Caltha palustris, Cornus canadensis, Equisitem fluviatile, Galium spp. Shrub Swamp Caltha palustris, Equisitem fluviatile, Galium spp., Potentilla palustris Marsh Free-Floating/Floating-Leaved Submerged Emergent Nuphar variegatum, Nymphaea Potamogeton richardsonii, Potamogeton Sparganium eurycarpum, Typha tetragona, Lemna minor, Lemna zosteriformis, Potamogeton praelongus, latifolia, Acorus calamus, Scirpus trisulca, Spirodela polyrhiza, Potamogeton pectinatus, Potamogeton acutus, Scirpus validus, Juncus spp., Potamogeton natans, Potamogeton friesii, Potamogeton vaginatus, Sagittaria cuneata, Calla palustris, gramineus, Polygonum amphibium, Potamogeton filiformis , Potamogeton Alisma plantago-aquatica, Sparganium angustifolium, Brasenia pusillus, Myriophyllum spicatum var. Menyanthes trifoliata, Potentilla schreberi exalbescens, Ceratophyllum demersum, palustris, Scheuchzeria palustris Ranunculus aquatilus var. capillaceus, Ranunculus circinatus, Hippurus vulgaris, Alisma gramineus, Utricularia vulgaris Shallow/Open Free-floating/Floating-Leaved Submerged Water Nuphar variegatum, Nymphaea tetragona, Lemna minor, Potamogeton richardsonii, Potamogeton zosteriformis, Lemna trisulca, Spirodela polyrhiza, Potamogeton natans, Potamogeton praelongus, Potamogeton pectinatus, Potamogeton gramineus, Polygonum amphibium, Potamogeton friesii, Potamogeton vaginatus, Potamogeton Sparganium angustifolium, Brasenia schreberi filiformis, Potamogeton pusillus, Myriophyllum spicatum var. exalbescens, Ceratophyllum demersum, Ranunculus aquatilus var. capillaceus, Ranunculus circinatus, Hippurus vulgaris, Alisma gramineum, Utricularia vulgaris P a g e | 52 TABLE 12 – Wetland vegetation identification based on graminoid species Wetland Type Bog Poor Fen Rich Fen Hardwood Swamp Mixedwood Swamp Tamarack Swamp Conifer Swamp Shrub Swamp Graminoid Layer Composition Eriophorum spp., Carex spp. Carex spp. Calamagrostis canadensis, Carex spp. Calamagrostis canadensis, Carex spp., Typha latifolia Calamagrostis canadensis, Carex spp., Typha latifolia Calamagrostis canadensis, Carex spp., Typha latifolia Calamagrostis canadensis, Carex spp., Typha latifolia Calamagrostis canadensis, Carex spp., Typha latifolia P a g e | 53 TABLE 13 – Wetland vegetation identification based on bryophytes Wetland Type Moss Layer Composition Bog Sphagnum spp. Poor Fen Sphagnum spp. Rich Fen Sphagnum spp.; Brown mosses: Tomenthypnum nitens, Campyllium stellatum, Scorpidium scorpioides, Drepanocladus spp. Hardwood Swamp No significant species Mixedwood Swamp No significant species Tamarack Swamp No significant species Conifer Swamp No significant species Shrub Swamp No significant species Marsh/Shallow No significant species Water/Open Water P a g e | 54 Table 14 - Boreal Plains Ecozone Identification Key Ducks Unlimited Canada – Field Guide to the Wetlands of the Boreal Plains Ecozone 1a) 1b) 2a) 2b) 3a) 3b) 4a) 4b) 5a) 5b) Terrain contains cover not affected by ground or surface water, or if affected, only for short periods (moisture codes 1- 5). Dominance of upland indicators……..………... Upland i) Conifer-treed forests………………………..………...………… Conifer Upland ii) Deciduous-treed forests………………………………..…….. Deciduous Upland iii) Mixedwood forests…………………………………...…… Mixedwood Upland Upland other (Shrub, Herb, Rock, Snow, etc.)……………………. Upland Other Water table at, near, or above the land surface (moisture codes 6-10) and some wetland indicators present…………………………….……...……………….……. Wetland (3) Wetland areas with an overall accumulation of peat (Sphagnum or woody) > 40 cm; mesic to hydric moisture conditions (moisture codes 6-8); stagnant to moving hydrodynamic systems (hydrodynamic regimes 1-2); trees, if present, are predominantly Picea mariana or Larix laricina, shrub layer variable, but typically less than 2 m tall and ericaceous shrubs typically present…………………………Peatland Wetlands (4) Wetland areas with predominantly mineral soils, with little or no peat accumulation, although some organic material may be present; highly variable moisture conditions (moisture codes 710); moving to very dynamic systems (hydrodynamic factors 3,4,5) trees, if present, typically in higher percentage cover and heights over 10 m; shrub layer typically more than 2 m tall and predominantly willows and alders (little or no ericaceous shrubs)……………………………………………………… Mineral Wetlands (8) Peatland wetlands with poor to medium nutrient regimes, mesic to hygric moisture conditions (moisture codes 6-8), relatively species-poor vegetation communities with a dominance of Sphagnum mosses and ericaceous shrubs (Ledum groenlandicum, Kalmia spp., etc.); lichens commonly present …….......……..(5) Peatland wetlands with medium to rich nutrient regimes, hygric to hydric moisture conditions (7-10), species-rich vegetation communities, abundant fen and/or swamp indicators (See Appendix A)……………………………………..………………….…………...(7) Peatland wetlands with predominantly fibric or woody-based peat accumulation; Picea mariana dominant tree layer with heights > 10 meters, canopy closure > 60%; hummocky terrain with pools of water may exist, rooting zone in contact with mineral-rich water; ground cover a mixture of feather mosses and some Sphagnum.….......Conifer (Black Spruce) Swamps Peatland wetlands with a predominantly Sphagnum peat accumulation, tree heights < 10 m, canopy closures < 60%.....................................................................................(6) Peatland wetlands with raised surface relative to surrounding terrain; hydrologic input is precipitation (no contact with surface or groundwater inputs); mesic moisture regimes (moisture code 6); very poor to poor nutrient regimes; tree layer, if present is <10m in height and <60% canopy cover, and dominated by the lowland form of Picea mariana; shrub layer is ericaceous; no fen or swamp indicators, Sphagnum moss dominant……….…………….Bogs i) Trees > 25% cover ……………………………..………………….Treed Bog ii) Shrubs > 25% cover …………………………..……………..…Shrubby Bog iii) Bryophytes/Herbaceous/Forb >25% cover…….…………….….....Open Bog Peatland wetlands with some mineral-rich water inputs, mesic to hygric moisture regimes (moisture code 6-8), more species-rich vegetation assemblages than in 6a, trees, if present, contain both Picea mariana (lowland form) and Larix laricina at <60% cover and <10 m in height; shrub layer contains a mixture of ericaceous shrubs, dwarf willows, and shrub birch (Betula P a g e | 55 6a) 6b) pumila, Betula glandulosa) typically at heights of < 2 m, graminoid layer typically has a large component of litter.…………………..………………………………..…Poor Fens i) Trees > 25% cover ……………………….……….………….Treed Poor Fen ii) Shrubs > 25% cover …………………………………..…..Shrubby Poor Fen iii) Bryophytes/Herbaceous/Forb >25% cover ……......…..Graminoid Poor Fen Peatland wetlands with Larix laricina trees > 10 meters tall, canopies > 60% cover, hummocky terrain with pools of water, swamp indicators…………...….Tamarack Swamp Peatland wetlands with trees in lowland forms (Picea mariana or Larix laricina) < 10 m, canopy covers < 60%, shrub layer containing shrub birch (Betula pumila, Betula glandulosa), minerotrophic indicators present, hygric to hydric moisture regime (moisture codes 7-9), hydrologic inputs primarily surface and groundwater, medium to rich nutrient regimes…………………..………………………………..…..……………...Rich Fens i) Trees > 25% cover…………………………...……………….Treed Rich Fen ii) Shrubs > 25% cover ……………………………..………..Shrubby Rich Fen iii) Bryophytes/Herbaceous/Forb >25% cover…..….…...…Graminoid Rich Fen 7a) Wetlands with > 25% emergent herbaceous or woody vegetation……………………(9) 7b) Wetlands with <25% herbaceous or woody vegetation, persistent water table well above surface, flooded conditions. Moisture regimes 9 to 10. Submerged or floating leaved vegetation may be present…………………………………………………….Shallow/Open Water i) Floating or submerged aquatic vegetation > 25% ……..………..…Aquatic Bed ii) Exposed mud, sand, gravel, or rock substrate > 25% cover.……………Mudflats iii) No vegetation present, permanent to semi-permanent water table……………………………………………………..Shallow/Open Water 8a) Wetlands with periodic or persistent flooding or slow moving surface water (moisture regimes 8 - 10), nutrient regimes rich to very rich, and dominated with herbaceous or forb vegetation (emergents, graminoids (sedges, rushes, some grasses))……….……..….Marshes i) Vegetation composed of > 25% emergent species………...….. Emergent Marsh ii) Vegetation composed of > 25% graminoid/forb species…..……Meadow Marsh 8b) Wetlands with woody vegetation >1m, standing water and nutrient-rich water (moisture regimes 6,7,8,9) with a hummocky microtopography, swamp indicators……….Swamps (10) 9a) Wetlands with trees < 25% cover, shrubs > 25% cover, shrub vegetation primarily tall form (Salix spp., Alnus rugosa, Cornus stolonifera) >2 m, with species-rich herbaceous/forb understory……………………………………..……..Shrub Swamp (Swamp Thicket) 9b) Wetlands with trees >25% cover…………….………………………………….(11) 10a) Hardwood dominated (primarily Betula papyrifera in upland transitional environments or Populus balsamifera in floodplain environments) wetlands with trees > 10 m and canopy closures > 60%, moisture regimes 7-9, nutrient regimes rich to very rich ……………………..……………………………………………...Hardwood Swamp 10b) Wetlands with hardwood (Betula papyrifera) and/or conifer (Larix laricina, Picea mariana) present with no dominance of either (<80% single tree type in canopy), trees ≥ 10m and canopy closures > 60%, nutrient regimes rich to very rich, moisture regimes 7-9, swamp indicators present………………………….…………………....Mixedwood Swamp P a g e | 56 Figure 19 – Field datasheet for recording habitat conditions around ARUs in wetlands. P a g e | 57 6 – How sampling Yellow Rail habitat can improve biodiversity monitoring At one of the Yellow Rail sites we monitored for 10 days in 2012, we detected an addition 58 species. Yellow Rails are uncommon. While ARU will detect them if they are present, sampling exclusively for Yellow Rails is a poor use of valuable monitoring resources given the costs of getting to these sites. Thus, we chose to use ARU for Yellow Rail so that we could also survey for all acoustic species. This will be done by listening to a minimum of two midnight (optimal time for Yellow Rail) and two dawn choruses for each station. The EMCLA stations will be listened to using resources provided by EMCLA. Additional resources will be requested from each company to listen to the recordings for Yellow Rails and other species. Duration of point count and listening length is to be determined by ongoing analyses but currently we are envisioning listening to three 1-minute sections from as many times of day and year as possible. We will provide a budget estimate in May/ June for recordings based on what we learn about optimal point count length and number. A Yellow Rail automated recognizer will also be created to have a computer scan all recordings for potential evidence of Yellow Rail, a subset of which will be double checked by a human observer. Figure 20 – Number of species detected per number of listening events at an ARU where a Yellow Rail was detected. P a g e | 58 The reason that we do now want to listen just for Yellow Rails is shown in Figure 20. This figure shows the number of species detected by a single ARU from July 5 to July 14, 2012 at a site where a Yellow Rail was located. The ARU came on every hour for 10-minutes between these dates. We have recorded which species were detected within each 1-minute interval on all of these recordings. In other words, we sampled the entire acoustically detectable species at this site across nine - 24 hour periods. This figure shows the cumulative number of species detected. You can see in the graph a series of "flat" visits where no new species were detected. These generally were in the afternoon (i.e. after 12 PM and before 7 PM). The flat sections are "getting longer" with more visits which indicates that fewer new species are being added with each visit BUT as the red line indicates the rate of accumulation has not plateaued as would be expected if the entire species pool had been detected. After 1640 minutes of observation (27+ hours) we have not recorded all the species that are likely to be at that this location and giving an audible cue at this time of year. This curve suggests that at least seventy or more species of animals could be monitored by using a single ARU at Yellow Rail stations. P a g e | 59 7 - Expectations for individual partners & EMCLA This map shows the proposed and already sampled areas for Yellow Rails within the mineable oilsands region. Orange triangles are areas where ARUs were placed in 2012. Red triangles are areas the EMCLA crews will try to get to. Green circles are areas where companies are expected to place and move ARUs to. Table 15 (REMOVED) provides a detailed list of habitat conditions, spatial location, and schedule for each company. If there is a desire to move the ARUs more frequently more sites can be added and/ or companies could take over monitoring so of the sites on the north and east side of McLelland Lake allowing EMCLA crews to spend more time sampling in other areas. EMCLA will provide training to all parties using ARU and will provide a coordinated location for storage of all the sound recordings and processed information. That system is currently being built and will be provided as soon as it is available. An example of the system can be found at http://pumilio.sourceforge.net/ At this site EMCLA will store all recordings, spatially map them, and have a database linked to the recordings that tracks what animals were detected when. A secure online database already exists for 2012 data and all information will be entered there for 2013 surveys. We are currently exploring the optimal length of point counts to conduct for Yellow Rail but the way we currently listen to recordings makes it unimportant how this is done. The reason being we recorded when each individual of each species is detected every minute for 10 minutes. We then listen to different times of day and times of year to detect as many individual and/ or species as possible. We expect that we probably will listen to 3-minutes of data from at least 4 time periods to detect as many Yellow Rails as possible. We also are building an automatic computer recognizer that will scan all of recordings for Yellow Rails that will then be double checked by a human observer. P a g e | 60 P a g e | 61 P a g e | 62 Appendix 1: Instructions for ARU usage EMCLA Autonomous Recording Unit (ARU) DeploymentProtocol Including testing, activation, deactivation, field deployment and data management Overview of ARU’s: Autonomous recording units (ARU’s) are used to remotely survey a variety of species such as birds, amphibians, and bats. On this project, the brand of ARU that we are using is the Song Meter made by Wildlife Acoustics. The units are designed to record autonomously for long periods of time to conduct bird surveys. While most of our Song Meters are the SM2+ model, there are 3 other models that you may have to deploy. The basic operation of all models is the same but there are a few programming differences to be aware of. This protocol will walk you through all aspects of using Song Meters from programing to field deployment and data storage. The field part of this protocol focusses on the forest and wetland ARU deployments for the EMCLA. It does not cover project specific sampling design or site selections. Always check these details with your project supervisor so the deployment locations are correct for the project you are working on. Some adjustments in mounting design may be required. For example, wetland areas do not have trees and you may have to use a stake or other method to secure the ARU in place. SECTION 1: Testing and Programming a. Testing a Song Meter Newly purchased Song Meters should be tested upon delivery to check for any factory defects in the wiring or external construction. They should also be tested before and after every deployment. The following steps allow you to test quickly if a Song Meter is recording correctly: Put batteries in the unit and turn the power on The LCD screen should show that the unit is waking up and display the date, time, software version and the status of the SD cards Put one card in slot A Connect microphones to each port on the outside Do a test recording: manually initiate recording by pressing the up and down buttons at the same time. Once the unit is recording, press the select button to toggle to the screen showing the gain levels. The gain bars and numbers should be similar. Talking directly into the left or right microphone should cause them to peak on that side. Stop the test recording by pressing the back button. Any substantial differences from the average indicate an issue with the microphone connection or the wiring or switches. See section on Troubleshooting for how to address some of these. Any microphones P a g e | 63 or units that are not recording cleanly should not be deployed in the field until the issue is corrected. See Appendix 1 for examples of good and bad recordings. Other things to look at: Check that all external ports are tight and sealed so that water cannot get into the Song Meter case. The microphone ports are particularly important because a loose part will lead to a loose microphone connection and excess static in the recording. Check that the wiring to the batteries is intact and that all button and switches are working. On newer models, check that the white switches on the switch board are in the correct configuration. On older SM2 units, check that all small black jumpers are in place. These serve the same purpose as the switch board in the newer models and can come loose. b. Loading ARU recording schedule Generally, you will be given a pre-made SET file to upload from the SD card in slot A. Always check that you are using the correct SET file and/or settings for the particular project that you are deploying the ARU for. You will always have to enter the file prefix (see “Setting the File prefix” below) every time that you move the ARU to a new location. Make sure that you always have the correct file prefix because this is what uniquely identifies the recording from that location. An error in file naming will result in lost or incorrect data if it is not corrected. 1. 2. 3. 4. 5. 6. Put the SD card with the .SET files in Slot A (will not load from another slot) Wake up unit (see instructions above) Navigate to “Utilities” page Select “Load Songmeter Set from A” Select correct SET file from SD card in slot A Press Select button again. The Song Meter set file will now load. To program the Song Meter directly, follow the instructions in the Song Meter User Manual. You will get a manual with your new Song Meter or you can download this from the Wildlife Acoustics website. For both the Configuration Utility and manual programming, use the following default settings, unless you are instructed otherwise. See Appendix X for default settings. Time and Date Select “Time and date” from the settings menu. The display will look like this: The current time and date are shown on the second line, and today’s calculated sunrise/sunset times are shown on the bottom line. The sunrise/sunset times are dependent on the latitude and longitude. P a g e | 64 GPS-enabled units will automatically find their location and figure out sunrise and sunset according to that. All other units will need latitude and longitude entered so that they know what part of the world they are in. Time and Date The time and date are not updated from the .SET file created on the computer. They need to be set manually for each Song Meter. Select the time and date on the setting menu and use the buttons to change to the current time and date. Check the time and date every time you deploy the Song Meter. The date may be reset to if the timer batteries run out or for other reasons. Location Settings The location settings allow you to change the File prefix, geographic location, and time zone. Setting the File Prefix The Song Meter automatically labels each recording with the date and time that it started according to the following format: YYYYMMDD_hhmmss. In addition, it allows for a 12 character file prefix that is set by the user. This prefix becomes part of the file name for every recording made during a particular recording session. This prefix needs to be programmed at each deployment to a new location. The prefix may contain capital letters, numbers, and hyphens. Press the select button to advance to each position in the prefix, and then use the up and down arrows to select from among the possible characters. Press select one more time to mark the end of the prefix. Use the cluster, site, station name as the file prefix unless instructed otherwise. The file prefix cannot be set in the Song Meter Configuration Utility. Latitude, Longitude and Time zone The latitude and longitude need to be set for the study area for all SM2+ and SM2+BAT Song Meters. Use the latitude and longitude of the actual point, of the site or of the study area. Having the correct latitude and longitude is most important if you create a recording schedule that tracks either sunrise or sunset. The final value to set for the location is the time zone. You can specify the local time zone (as used to set the clock) in hours relative to UTC (Universal Time Coordinated). Note that Song Meter does not automatically adjust for daylight savings time. This is mostly because daylight savings time is determined by government action and not by nature, so we cannot predict the start or end of daylight savings time as this in fact changes from time to time in different countries by their respective governments. Battery life and file volume The best way to estimate the number of days that a Song Meter will run on a given schedule before the batteries run out is to use the Song Meter Configuration Utility to visualize the deployment schedule. Estimates of battery life are displayed in the Song Meter Configuration Utility. These estimates are fairly reliable except for BAT enabled units and GPS enabled units, which require more power. The configuration utility also allows you to calculate the amount of data storage (as SD cards) required to for a certain sampling schedule. If you want to have the recorder run as long as the batteries do, always have more memory space than battery life. Memory space required will vary depending on file compression rate. SECTION 2: Activation and Deactivation P a g e | 65 This section covers what you need to know about starting an ARU up to run in the field and how to stop it when you pick it up. Activating the ARU 1. Attach microphones to each side 2. Use Philips screwdriver to open lid. (Use the correct size of screwdriver so that you do not strip the screws.) 3. Press the “Wake/Exit” button to start the unit. 4. Wait for the unit to initialize 5. Press “Select” button to go to setting options. 6. Scroll down to Location 7. Select “File Prefix” 8. Change the file prefix to the site and station name using this format 9. Press select twice at the end of the file name to save the changes 10. Use the “Back” button to navigate back to the start-up screen 11. Press “Up” and “Down” button simultaneously to do a test recording and check the microphones 12. Press “Select” button during the recording to look at gain levels for left and right microphones. Numerical and visual gain indicators should be identical when you speak in front of the recorder. 13. Press “Back” button to stop test recording 14. Press the “Wake/Exit” Button to put the unit in standby. It should show a message saying: “Going to sleep until <date and time> before it shuts off. Date and time should correspond to the start time programmed into the SET file. This will vary depending on the recording schedule that a specific species or project requires. Deactivating the ARU (at pickup): 1. Open the lid 2. Press the “Wake” button 3. Use “Select” button to leave start-up screen 4. Scroll down to “Utilities”. Select. 5. Select “Go to Sleep”. The unit will turn off completely and stop recording 6. Then turn the power switch to the off position 7. If the ARU is mid-recording when you arrive, you can either wait for the recording to finish or press the “Back” button to stop the recording and then follow the steps above. SECTION 3: Important ARU Care Instructions P a g e | 66 Always handle the ARU units with care. They contain sensitive electronic components that will not withstand crushing or heavy impacts. Do not use excess force to remove the cover, tighten the cover screws or take the mics on and off. Do all these operations gently. Use the correct size screwdriver on the cover screws so that the head do not get stripped. ARU transport: Dropping the units or having them bounce around during transport can cause damage to the connections inside and destroy the outside as well. Always transport the ARUs in the padded bag provided (or in a similar padded, secure wrapping. Be especially careful with the GPS-enabled units and make sure that they cables do not get bent or damaged. Transporting in Totes: Put the foam pads in the bottom of the totes. Put enough packing material around the ARU bags that these cannot bounce around in the totes. Strap the totes firmly to the quad so that the totes cannot fall off during rough trails. The microphones are also sensitive to impact and pressure. Always transport them in hard side cases that are waterproof and cannot be crushed. If microphones are wet when you pick up a recorder, make sure to dry them out before storing them. Rain, Snow and other wet stuff: Extra care is required to handle ARUs in wet weather. When the Song Meters are closed, they are water tight and can with stand most weather conditions in the field. However, do not get water inside on the electronic components or into the external microphone sockets. Water will short out the electrical circuits and may cause permanent damage to the units. Take extra care on activation and deactivation on rainy days. Having wet hands, gloves and clothing will make it difficult to keep the inside of the ARU dry. On rainy days, make sure that you keep the microphone sockets dry so that the unit is not damaged from shorting out. The following steps may be used to minimize the amount of time an ARU is open. Rainy day activation: Set up ARUs in your truck or room. Load SD cards, check batteries, test microphones and press Wake/Exit button to prepare the recorder to start at the correct time. CLEARLY LABEL each recorder with the Site and Station that it is programed for. Take the recorder out, mount it to the tree and attach the microphones. Rainy Day Take Down: Take the recorder off the tree Open it and turn it off only at the truck or in your camp. Note the time when you take down the recorder so that blank tracks can be deleted. Mark this clearly on the datasheet. Troubleshooting If the ARU will not start or record or is not recording equally on both channels, there are a number of things to check before taking it out of service. Screen freezes: Just as with any other piece of electronic equipment, the unit will occasionally freeze and not respond to any of the buttons. If this happens, use the power switch to turn the unit off. Let it P a g e | 67 sit for minute and then turn it back on. This will mostly get it started again. Reload the SET file and check all settings after a forced shutdown like this. Song Meter won’t turn on: This mostly happens due to an interruption of the power supply. Check that the power switch is moved to “internal power” (or the jumper is in the correct location for older models). Also check that the batteries are touching all the contacts. Sometimes a battery will not be positioned correctly and interrupt the circuit. Timer batteries: The timer batteries will also affect how the Song Meter works. If you cannot set the time or the unit won’t turn on, check the timer batteries. You will need to take the main battery holder out to do this. If the timer batteries are taken out and/or replaced, you will have to reset the time and the time zone information. Uneven gain: Check that both microphones are firmly connected. Check that the switch board is in the correct set up (or the jumpers are securely connected on the older units). Switch microphones to check if one of the mics is the problem. If none of these remedies works, there may be an internal wiring issues and the unit should be taken out of service and check over more thoroughly. Excess static: excess static in one of the channels may be cause by wiring issues or microphone connections. If a test recording shows excess static, try different microphones and make sure that the mics are properly connected to the external ports. If none of these remedies work, take the unit out of service and have it checked over more thoroughly. SECTION 4: Field Deployment This section will walk you through how to mount the ARU to a tree and a few other bits of information for successful deployment. Always make sure that you are following project specific instructions to find the correct ARU location. The following equipment is needed to complete the job: ARU kit: ARU with mounting brackets, lock, cable, key, 2 microphones in hard-sided case, three 16 GB SD cards, mounting screws SD card with SET files. Spare microphones and SD cards Electric drill (or screw driver if you want to use muscle power) Grey electrical wire (for GPS enabled units) Philips screw-driver (or universal screwdriver with Philips bit) GPS Data sheets Flagging tape Felt marker and pencil Backpack Totes (for quad transport) ARU Placement P a g e | 68 1. Chose trees that are not wider than the ARU (7 inches diameter). A wider tree will interfere with sound reaching the microphones. 2. Locate units far enough away from the road so that they are not easily detected by humans (15 to 20m is sufficient, especially once the trees and shrubs leaf out) 3. Put ARU on NORTH side of the tree to protect unit from direct sun and ensure more accurate temperature readings. The microphones are then pointing east and west. 4. Put ARU 1.5 m high on a tree. Screw in both top and bottom brackets 5. For GPS enabled units, mount GPS receiver higher than ARU (as far as you are able to reach). Use grey electrical wire to secure the cable to the tree. It is important to use a soft material to tie secure the excess cable so it does not get creased or damaged. 6. Open the cover 7. Follow the steps described in “Activating the ARU”. Change the file name BEFORE you do the test recording 8. Close the cover screws 9. Finally, lock the unit to the tree. Run the cable over the lid and around the tree as required to take up slack. It is possible to tighten the cable enough to lock the lid in place. Make sure that the cable does not touch the microphones. 10. Fill out all fields on the Deployment Datasheet 11. BEFORE YOU LEAVE MAKE SURE THAT YOU ATTACHED THE MICROPHONES, NOTHING IS TOUCHING THE MICROPHONES, AND THE UNIT IS READY TO RECORD AT THE CORRECT TIME. ARU PICK-UP 1. Make sure that you have the correct keys for the locks with you before you hike out to the ARU 2. Unlock the ARU 3. Open the cover 4. Follow the instructions for “Deactivating an ARU” 5. Close the cover 6. Fill out all fields on the ARU Pick-up datasheet 7. Pack the unit and microphones securing in the carrying case Data Sheets Fill out all fields on the datasheets every time that you deploy or pick-up the ARU. Do not rely on your memory to fill information in later. If for some reason you end up at a pick-up or deployment without your datasheets, use your field notebook to record the correct information and fill out the correct datasheets once you get to your truck or camp location. Never think that you are too busy or pressed for time to fill out datasheets correctly. The datasheets are part of the job and need to be completely correctly. Deployment Datasheet Site Number: Site number or other official site descriptor Station: Name of station that you are deploying the ARU (Project dependent) Date: Date ARU is deployed Time: The time of day the ARU is deployed Easting and Northing: Write down co-ordinates from the GPS Surveyor: Name/initials of observer P a g e | 69 ARU ID: Serial number unless there is another identifier on the unit. The serial number sticker is on the bottom of the Song Meter File Prefix: Latitude and Longitude. Use the location of the pre-mapped point unless you need to move the ARU more than 20 m from this location. BE SURE THAT YOU CHANGE THE FILE PREFIX EVERYTIME THAT YOU DEPLOY THE ARU AT A NEW LOCATION. CHANGE THE FILE PREFIX BEFORE YOU DO THE TEST RECORDING. ARU Battery Status: Notes on when the batteries were checked and/ or replaced. For example, you could note that the batteries where used only 5 days prior—in which case they will last another 15. SD Card Number: Fill in the SD card numbers for slots. Number of card (E.g. 001 or 157) Test Recording Done: Yes / No Location Moved >20m: Yes/No, an ARU is considered moved if it is deployed more than 20 m from the designated location Comments: Any comments related to the ARU location, e.g. distance from planned point, how to find them etc. ARU Pick-up Data Sheet Site: Site number Station: Station ID DATE: Date of pickup TIME: Time of pick-up ARU ID: Name on unit (e.g. BAT 001 or EMCLA 003 or serial number for units that do not have an ID written on them) SD Card Numbers: numbers on the SD cards in the slots File Prefix: Write the file prefix from the recorder Observer: Person picking up the unit Comments: anything. For example, are the microphones working, or damaged etc. If there is a file name mistake, PLEASE MAKE SURE TO MAKE A NOTE AND KEEP TRACK OF IT. Figure 1. ARU placement on tree. Maximum width of tree. Microphones still are wider than the trunk, thus avoiding sound shadow from the tree. P a g e | 70 Figure 2. ARU with GPS placement on tree. DATA MANAGEMENT Taking care of the data is one of the most important Before you delete any data from a SD card, it MUST BE BACKED UP IN TWO PLACES. You will be given two hard drives, one for each crew of two. Save SD cards to one of the hard drives. Once each crew has data downloaded onto their hard drive, copy the data to the second hard drive. For example, back up Drive 3 to Drive 4 and back up Drive 4 to Drive 3. Hedwig will periodically be coming to give you a new set of hard drives. If you were to run out of hard drive space, use the computers for the second backup. ALWAYS STORE ONE HARD DRIVE IN EACH TRUCK. Do not let data management pile up. If you are running behind in saving data from SD cards, take some time out of the field and copy the data. Keeping track of existing data is as important as collecting more. P a g e | 71 Store all the data from one site in a folder labeled according to that site and the date of take down (e.g. Site 10 14May2012). Always check and double check file names so that we know where each set of recording came from. P a g e | 72 APPENDIX 1 P a g e | 73 Figure 2. Labelled Diagram of Song Meter P a g e | 74 P a g e | 75 P a g e | 76 Appendix 2: Setting and Schedules Default Song Meter Settings for Bird recording in stereo: Audio Settings Sample rate: 16000 Channels: stereo Compression: Off (for full size WAV files) or WAC0 (for lossless 60% compression of files) Gain left +0.0dB Gain right +0.0dB These settings are the same for the GPS enabled units. BAT enabled units are programmed in this way if they are used for recording birds. Use default BAT setting if recording bats. See Appendix 2. Advanced Settings: Dig HPF Left: Off Dig HPF Right: Off Dig LPF Left: Off Dig LPF Right: Off Trg Lvl Left: Off Trg Lvl Right: Off Trg Win Left: 2.0s Trg Win Right: 2.0s Div Ratio: 16 For all birds and amphibian recordings make sure that the trigger levels (Trg Lvl) are both set to OFF. These settings do not need to be changed unless you are recording bats. Default Song Meter Settings for Bat recordings left channel (Mono left) only: Sample Song Meter Recording Schedules 10 minutes on the hour, 24 hours per day stating at 8 PM (20:00 hours) for maximum duration of battery 01 AT TIME 20:00:00 02 RECORD 00:10:00 03 PAUSE 00:50:00 04 GOTO LINE 02 23X 05 GOTO LINE 01 00X The “00X” in line 05 means “Forever”, which will keep the Song Meter running until the memory is full or the batteries die. P a g e | 77 You can adjust the start time simply by changing the time in line 01. If you want to record shorter block of time, reduce the number of repeats in line 04. For example, if you wanted to record for 6 hours on the hour starting at 4 AM the schedule would look like this: 01 AT TIME 04:00:00 02 RECORD 00:10:00 03 PAUSE 00:50:00 04 GOTO LINE 02 06X 05 GOTO LINE 01 00X If you don’t want to end up with excess data and only want to record for a set number of days, simply change the value in line 05 to the number of days you want to record for. More complex recording schedules are possible including different schedules for different days. P a g e | 78 Literature Cited