1
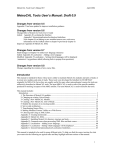
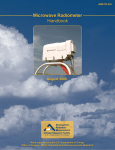
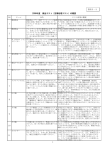
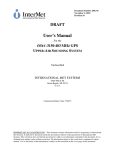
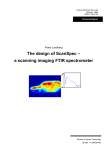
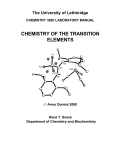
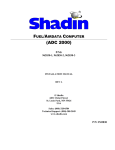
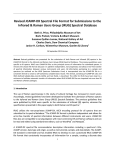
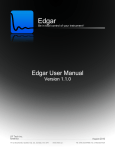
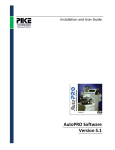
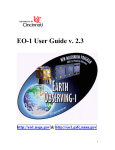
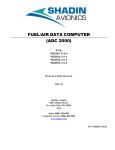
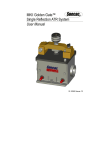
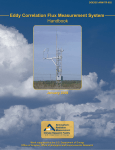
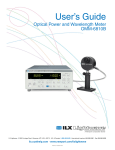
ARM TR-054
Atmospheric Emitted Radiance
Interferometer (AERI) Handbook
January 2005
J. Demirgian
R. Dedecker
Work supported by the U.S. Department of Energy,
Office of Science, Office of Biological and Environmental Research
January 2005, ARM TR-054
Contents
1.
2.
3.
4.
5.
6.
7.
General Overview ............................................................................................................................... 1
Contacts............................................................................................................................................... 1
Deployment Locations and History..................................................................................................... 2
Near-Real-Time Data Plots ................................................................................................................. 2
Data Description and Examples .......................................................................................................... 3
Data Quality ...................................................................................................................................... 10
Instrument Details ............................................................................................................................. 12
iii
January 2005, ARM TR-054
1. General Overview
The atmospheric emitted radiance interferometer (AERI) measures the absolute infrared (IR) spectral
radiance (watts per square meter per steradian per wavenumber) of the sky directly above the instrument.
The spectral measurement range of the instrument is 3300 to 520 wavenumbers (cm-1) or 3-19.2 microns
for the normal-range instruments and 3300 to 400 cm-1 or 3-25 microns, for the extended-range polar
instruments. Spectral resolution is 1.0 cm-1. Instrument field-of-view is 1.3 degrees. A calibrated sky
radiance spectrum is produced every 8 minutes in normal mode and every minute in rapid sampling
mode. The actual sample scan time is 20-30 sec in rapid sampling mode with periodic gaps when the
instrument is looking at the blackbodies. Rapid sampling will become available in all AERIs. Rapid
sampling time will eventually be reduced to data every 20 seconds. The AERI data can be used for 1)
evaluating line-by-line radiative transport codes, 2) detecting/quantifying cloud effects on ground-based
measurements of infrared spectral radiance (and hence is valuable for cloud property retrievals), and 3)
calculating vertical atmospheric profiles of temperature and water vapor and the detection of trace gases.
2. Contacts
2.1
Mentor
Jack Demirgian
Argonne National Laboratory
9700 South Cass Avenue, Building 203
Argonne, IL 60439
Phone: 630-252-6807
E-mail: [email protected]
2.2
Instrument Developer
Cooperative Institute for Meteorological Satellite Studies - SSEC
University of Wisconsin-Madison
1225 W. Dayton St.
Madison, WI 53706
Ralph Dedecker
Phone: 608-263-6779
E-mail: [email protected]
Fred Best
Phone: 608-263-6777
E-mail: [email protected]
Denny Hackel
Phone: 608-263-0226
E-mail: [email protected]
1
January 2005, ARM TR-054
3. Deployment Locations and History
Serial
Number
Property
Number
SZM25321
SZM24017
SZM433MT
SZM433MT
SZM433J6
SZM433J5
SZM433G5
SZM433G6
SZM433JA
SZM433EP
SZM433JA
SZM433EP
SZM433JA
SZM433G1
SZM433J6
SZM433G1
SZM433J6
SZM433EP
SZM433EP
?
Location
Date
Installed
Date
Removed
Status
SGP/C1
SGP/C1
SGP/E14
Hillsboro
Vici
Vici
Morris
Purcell
NSA/C1
NSA/C1
NSA/C1
NSA/C1
SHEBA
TWP-Nauru
TWP-Nauru
TWP-Nauru
Darwin
NSA-2
Oliktok Pt.
1995/04
1993/10
2003/12
1998/12
2002/04
1998/11
1998/12
1998/11
2002/07
2002/04
2001/01
1998/02
1997/10
2002/03
2000/07
1998
2004/12
2003/12
2004/09
current
1995/01
current
2003/12/11
2003/06/09
2002/04
2003/11/05
2003/11/05
current
2002/07
2002/04
2001/01
1999/01
2005/03
2002/03
2000/07
current
2004/08
2004/10
Under repair
Removed from service
operational
relocated E14
To Darwin
AERI-Bago
UW
UW
operational
NSA-2
NSA-1
NSA-2
NSA-1
being repaired
Darwin
Nauru
operational
UW
UW
The Surface Heat Budget of the Arctic Ocean (SHEBA) and Southern Great Plains (SGP) Boundary
Facility sites (Hillsboro, Morris, Purcell, Vici) have been discontinued. SHEBA was an experiment that
took place on the arctic ice from 1997-1999. The boundary facilities circled the SGP Central Facility
(CF) and provided a complete data set for conditions at the SGP. The data collected during the operation
of these facilities are available from the Atmospheric Radiation Measurement (ARM) Program’s archive
(http://www.archive.arm.gov/).
4. Near-Real-Time Data Plots
Real time plots are available on the Internet at http://bora2.ssec.wisc.edu:8050.
A typical web page is shown below with the Darwin site selected.
2
January 2005, ARM TR-054
The user can click on the buttons on the bottom of the page to select the location. The Tropical Western
Pacific (TWP) sites are Nauru and Darwin. The SGP sites are SGP CF and SGP-E14. The two
instruments are collocated at the CF for data comparison purposes. The North Slope of Alaska (NSA)
site is Barrow. Currently, the Barrow AERI is the only one in rapid-sampling mode. A second
instrument (NSA2) will be installed on the NSA site; it will be labeled NSA2. The AERI_BAGO is a
mobile instrument operated by the University of Wisconsin.
The two spectra on the right of the web page represent the short (bottom) and long (top) wave infrared
plots. A summary of data flags are located on the left. The user can click on any of the summary buttons
for further information on each item. The summary plots are available by selecting the choice above
summary of the data flags.
5. Data Description and Examples
5.1
Data File Contents
The AERI data files are stored in both raw and calibrated files. The nomenclature is as follows:
Raw data files
yymmddF1.CXS
yymmddF2.CXS
yymmddB1.CXS
yymmddB2.CXS
yymmddF1.UVS
Complex uncalibrated spectra for Channel 1, Fwd. direction
Complex uncalibrated spectra for Channel 2, Fwd. direction
Complex uncalibrated spectra for Channel 1, Back. direction
Complex uncalibrated spectra for Channel 2, Back. direction
Uncalibrated variance spectra for Channel 1, Fwd. direction
3
January 2005, ARM TR-054
yymmddF2.UVS
yymmddB1.UVS
yymmddB2.UVS
Uncalibrated variance spectra for Channel 2, Fwd. direction
Uncalibrated variance spectra for Channel 1, Back. direction
Uncalibrated variance spectra for Channel 2, Back. direction
Calibrated data files
yymmddC1.RNC
yymmddC2.RNC
yymmddF1.CSV
yymmddF2.CSV
Real normalized calibrated spectra for Channel 1
Real normalized calibrated spectra for Channel 2
Calibrated sky variance spectra for Channel 1, Fwd. direction
Calibrated sky variance spectra for Channel 2, Fwd. direction
Control files
yymmdd.PAR
yymmdd.QC
yymmddhh.SIT
SUMARY.SCR
RADIANCE.SCR
AESITTER.SCR
Configuration parameters used for calibration
ASCII file listing data deviation from normal range
hh is UTC hour - condensed abnormal conditions report
ASCII file containing controls for graphic product displays of summary products
ASCII file containing controls for graphic product displays of radiance spectra
ASCII file containing “Normal” data ranges of summary product items and
graphic display products
ARM converts the .RNC, .CSV, and .SUM files into netCDF format.
5.1.1
Primary Variables and Expected Uncertainty
1. Absolute spectral radiance of the sky in units of watts per square meter per steradian per
wavenumber.
2. Sky brightness temperature as a function of wavenumber in units of degrees Kelvin.
In addition, calculated quantities are also available:
1. Variance of sky infrared spectral radiance as a function of wavenumber.
The value-added procedure (VAP), consisting of the vertical atmospheric profiles of temperature,
potential temperature, mixing ratio, and relative humidity, is also available (AERIPROF).
5.1.1.1
Definition of Uncertainty
The uncertainty in the primary and secondary quantities measured are discussed in detail in a review by
R.O. Knuteson et al. (see Reference 2).
Copies of this paper are available by email from [email protected] or from the instrument
mentor at [email protected] .
5.1.2
Secondary/Underlying Variables
See above
4
January 2005, ARM TR-054
5.1.3
Diagnostic Variables
The following variables reside in the .SUM files. They are critical variables. If they are flagged red, data
quality will usually be compromised.
•
Encoder Scene Confirm - Tells us if the mirror is operational or in a “safe” position. If this flag is
red it’s usually a show stopper. However, sometimes the set point changes after work is done on
the instrument. This happened at Barrow in December 2003.
•
Hatch Open - If this flags, the hatch is either closed or in an intermediate position. There is no sky
data when the hatch is closed. There is still calibration data.
•
Detector Temp - A warm detector means degraded data.
•
LW HBB NEN - Noise-equivalent Radiance in Hot Blackbody at 1000 cm-1) measures detector
noise in the long wave. High values indicate degraded data.
•
SW HBB NEN - Noise-equivalent Radiance in Hot Blackbody at 2500 cm-1) measures detector
noise in the shortwave. High values indicate degraded data.
•
LW Responsivity - Characteristic value representing overall longwave channel responsivity).
Measures the sensitivity of the detector. Low values indicate a problem; very low values affect
data quality.
•
SW Responsivity - Characteristic value representing overall shortwave channel responsivity.
Measures the sensitivity of the detector. Low values indicate a problem; very low values affect
data quality.
•
Rain Intensity - if there is rain there should be no data. The rain sensor, when dirty, will flag
under sunny skies. The sensor has an analog output. The rain sensor is located inside the hatch
near the sky aperture and is used to flag the critical condition of rain falling on the AERI sky
aperture. If rain is detected, the AERI scene mirror will be safe to the down-looking position.
This rain sensor is not used to close the AERI viewing hatch; it could be viewed as an
independent indicator of a situation where the hatch has not closed to protect the AERI
interferometer front end in the presence of rain.
5.1.4
Data Quality Flags
The following flags indicate that there was a problem in calibration because of a temperature or electronic
instability of the ambient and hot blackbodies. Slight deviations from optimum values will not affect data
quality. Larger deviations will cause more noise and can affect data quality for some uses but not for
others. The significance of these deviations is noted by the mentor in Section 6.2, “Data Reviews by the
Instrument Mentor.”
5
January 2005, ARM TR-054
The difference in temperature between the ambient and hot blackbody temperatures provide the
temperature calibration for the sky data. Larger differences between the ambient and hot blackbodies
improve the calibration. Sky temperatures must lie within the ambient and hot blackbody temperatures.
•
•
•
•
•
•
•
•
•
ABB Temp (calibrationCBBtemp) Ambient blackbody temperature
ABB Max Temp Diff
HBB Temp (calibrationHBBtemp) Hot blackbody temperature
HBB Max Temp Diff
HBB Temp Stability
336 Kelvin (Reference) (fixed2500ohmResistor)
293 Kelvin (Reference) (fixed12KohmResistor)
249 Kelvin (Reference) (fixed97KohmResistor)
Max Sample StdDev.
Diagnostic and maintenance
These flags help us determine what may be causing a problem. Most are temperature and humidity
problems. Some flags (noted) tell us a critical component is failing. This gives us warning to replace it
before it fails. Some indicate when routine maintenance is required. I have included a description under
the more important flags.
•
•
•
•
•
Cooler Current - This flags when a cooler (or detector dewar) is beginning to fail. Immediate
action is warranted. It can also lead to a warming of the detector, which will affect data quality.
Cooler Expander Temp - If the expander gets too warm, the cooler cannot cool properly. The
problem is caused by dirty cooling fins (or the cooling motor failed).
Outside Air Temp - If the outside air is too warm, the ambient blackbody is too warm and the
difference between the ambient and hot blackbodies is too small. This increases noise and affects
data quality. We cannot correct ambient temperature. This is never a problem at Barrow.
Scene Mirror Temp - enclosure is too warm; usually flags with outside air.
Air Flow Delta Temp - difference between frontEndFanAirHeatedTemp and
frontEndFanAirUnheatedTemp; indicative of front-end air flow. Flags when outside air is too
warm or filter is plugged.
The following flags indicate the instrument enclosure is too warm, which can affect how the instrument
functions and cause components to fail.
•
•
•
•
•
•
•
•
BB Support Struct. Temp
Air Temp Near BBs
Spare (Shelter) Temp
Interfer. Window Temp
Interfer. 2nd Port Temp
Air Temp Near Interfer.
Rack Ambient Temp
Computer Temp.
6
January 2005, ARM TR-054
The following indicate a component is overheating, probably leading to a failure:
•
•
•
•
•
•
•
Cooler Comp. Temp
Mirror Motor Temp
SCE Temp (Signal conditioning electronics inside air temperature)
ABB Controller Temp
HBB Controller Temp
Cooler Pwr Sup. Temp
Motor Driver Temp.
Atmospheric conditions we can do nothing about but may clue us into a problem:
•
•
Air Humidity (atmosphericRelativeHumidity)
Atmos. Pressure.
Warning to replace desiccant and avoid serious internal damage:
•
•
5.1.5
Interfer. Humidity
Optics Humidity.
Dimension Variables
All AERI data files contain Universal Time Coordinates (UTC) time, date, longitude, latitude, and file
number.
5.2
Annotated Examples
A complete set of detailed updated examples is available at: http://cimss.ssec.wisc.edu/aeri. Some of the
more commonly used ones are noted below.
The following examples are explained in more detail at: http://cimss.ssec.wisc.edu/aeri/science/.
Atmospheric Profiling
The AERI instrument detects vertical and temporal (time) changes of
temperature and water vapor in the lower part of the earth's atmosphere
via changes in measured down-going IR radiation coming from the
lower atmosphere. With a temporal resolution of less than 10 minutes
and an optimal vertical resolution of 100 meters, the AERI instrument
can observe meteorologically important mesoscale phenomena, such as
boundary-layer evolution, cold/warm frontal passages, dry lines, and
thunderstorm outflow boundaries. These temperature and moisture
vertical retrievals provide data for stability index monitoring, planetary
boundary-layer (PBL) research, mesoscale model initialization,
verification, and nowcasting.
7
January 2005, ARM TR-054
Cloud Retrieval
Ground-based AERI and Raman light detection and ranging (lidar)
measurements are used to infer cirrus cloud absorption optical depth and
effective particle size. The high spectral resolution AERI measurements
allow inversion of the infrared radiative transfer equation between
gaseous absorption lines (e.g., regions of minimal atmospheric
emission), referred to as microwindows, to derive the cloud infrared
absorption optical depth. lidar data are used to determine cloud
boundaries, while also providing an independent measurement of cloud
optical depth. Optical depth spectral variation, across the 8-to-12micron atmospheric window, yields information on particle size and
shape. A best fit of absorption optical depth to the measured absorption
optical depth is used to determine the effective radius of particles within the cloud.
AERI Temperature and Water Vapor Research
The AERI is used to produce temperature and water vapor profiles every ten minutes in the PBL, the
lowest 3 km of the earth's atmosphere. AERI measures IR radiation (3 to 18 um) passively, yielding
high-resolution radiance spectra (less than 1 cm-1). The spectra are transformed to vertical temperature
and water vapor profiles by inverting the IR radiative transfer equation (RTE). Several field experiments
have confirmed AERI's high-temperature and water-vapor retrieval skill in the PBL.
8
January 2005, ARM TR-054
5.3
User Notes and Known Problems
The data flags listed in section 5.1.3 determine data quality. They are noted as green, yellow, or red in the
.SUM file. The green, yellow, red limits are available on the web page listed in Section 4 of this web
page, http://bora2.ssec.wisc.edu:8050 . When accessing data using netCDF format, the color of the data
are not noted. The user should obtain the limits and ensure the quality of the data that are used. Data
marked as red will have much larger error limits.
Individual occurrences of “red” data are not recorded in a data quality report (DQR) because of the large
number of occurrences of rain or snow that would cause the hatch to close and put the mirror in a safe
position. The instrument remains running but produces a flat line spectrum. The user must determine
when rain or snow events occur using these data flags. There are too many occurrences to file DQRs for
each snow, rain, or shower event.
5.4
Frequently Asked Questions
Are data taken continuously?
Spectra are coadded and processed every 8 minutes for standard sampling AERIs. In rapid sampling
mode (spectra every minute), less spectra are coadded. Eventually, all AERIs will be in rapid sampling
mode. Because less spectra are coadded in rapid sampling mode, the data have a higher random noise
component. A VAP is being developed that reduces/removes the uncorrelated component of the random
noise.
Are data taken at night or on cloudy days?
Data are taken as long as the precipitation sensors on the instrument hatch are not triggered. This guards
the steering mirror from water and snow that would obscure the optical throughput.
Are independently acquired data on temperature and water vapor profiles available for
comparison? If so, from what source?
Radiosonde data (from weather balloon launches) are available in 3-hour time intervals. Other remote
sensors provide profiles of water vapor and temperature (radio acoustic sounding system (RASS), Raman
lidar, MWRP).
Are there any other references you can recommend?
See the reference section at the bottom of this web page.
Please submit questions to the instrument mentor, Dr. Jack Demirgian, [email protected].
9
January 2005, ARM TR-054
6. Data Quality
6.1
Data Quality Health and Status
Data quality for each spectrometer can be obtained from the following web page.
http://cygnus.mrcsb.com/dqhands/cgi-bin/dqmenu.pl.
A typical page is shown below.
The following links go to current data quality health and status results:
•
•
DQ HandS (http://dq.arm.gov/) for Data Quality Health And Status
NCVweb (http://dq.arm.gov/ncvweb/ncvweb.cgi) for interactive data plotting.
The tables and graphs shown contain the techniques used by ARM's data quality analysts, instrument
mentors, and site scientists to monitor and diagnose data quality.
ARM netCDF file header descriptions may be found at AERI
(http://science.arm.gov/tool/dod/showdod.php?Inst=aeri) Data Object Design Changes.
6.2
Data Reviews by Instrument Mentor
Mentor reviews include an overview of all the instruments and MS Excel spreadsheets covering the
values for data flags that flagged yellow or red.
10
January 2005, ARM TR-054
Previous mentor reviews beginning from 2000 and all spreadsheets are available from the mentor.
Contact Jack Demirgian, [email protected] .
6.3
Data Assessments by Site Scientist/Data Quality Office
This section is not applicable to this instrument.
6.4
Value-Added Procedures and Quality Measurement Experiments
Many of the scientific needs of the ARM Program are met through the analysis and processing of existing
data products into VAPs. Despite extensive instrumentation deployed at the ARM sites, there will always
be quantities of interest that are either impractical or impossible to measure directly or routinely. Physical
models using ARM instrument data as inputs are implemented as VAPs and can help fill some of the
unmet measurement needs of the program. Conversely, ARM produces some VAPs not to fill unmet
measurement needs, but to improve the quality of existing measurements. In addition, when more than
one measurement is available, ARM also produces "best estimate" VAPs. A special class of VAP, called
a Quality Measurement Experiment (QME), does not output geophysical parameters of scientific interest.
Rather, a QME adds value to the input datastreams by providing for continuous assessment of the quality
of the input data based on internal consistency checks, comparisons between independent similar
measurements, or comparisons between measurement with modeled results, and so forth. For more
information see:
•
•
AERI PROF, (http://science.arm.gov/vaps/aeripro.stm) compares retrieved profiles from AERI
with the profiles from radiosondes.
Water vapor and temperature profiles are available at http://cimss.ssec.wisc.edu/aeri/.
The VAPs listed above are also the following QMEs:
•
•
6.4.1
QME AERI PROF, (http://science.arm.gov/vaps/qmeapro.stm) compares retrieved profiles from
AERI with the profiles from radiosondes.
QME AERI/LBLRTM, (http://science.arm.gov/vaps/qmealbl.stm) for analysis of the QME
AERI/LBLRTM residuals. Compares radiances retrieved by AERI with those calculated by the
LBLRTM (line-by-line radiative transfer model), using sonde data for pressure- and temperaturebroadening calculations.
Examples of Data
The following plot shows two spectra taken with the AERI. Recalling that the spectra is emission spectra
from the atmosphere, the absence of emission at 950 and the weak emission at 550 wavenumbers
observed in the lower panel is evidence for a very dry air mass. In fact, the lower panel is a continental
polar air mass (very dry). Compare these same spectral regions with the upper panel taken at Point Magu,
California on the southern California coastline.
11
January 2005, ARM TR-054
This link (http://www.joss.ucar.edu/cgi-bin/josscatalog/sheba/ship_instrument_browse?isindex=AERI_CHAN1 ) provides data from the deployment of
the AERI-ER at the SHEBA ice station. Note the extended wavelength coverage in the low wavenumber
end (long wavelengths). As you click on the "bear paws" next to each available date, note occurrences of
dry air masses (weak emission at 950 and 550 wavenumbers: November 28, 1997). However, on some
days there is a smooth spectral feature indicative of low clouds (e.g., November 11, 1997; actually
snowed on this day).
More data examples appear below under VAPs and Data Quick-Looks.
7. Instrument Details
7.1
7.1.1
Detailed Description
List of Components
The AERI radiometer is composed of six subsystems, which include the following: 1) the interferometer,
2) the detector; 3) the scene-scanning optics; 4) the calibration blackbodies with temperature controller; 5)
a PC-based instrument control, data acquisition, data processing computer with custom software running
under OS/2, and 6) an automated viewport hatch, which serves to protect the AERI optics in inclement
weather.
12
January 2005, ARM TR-054
1. Interferometer (shown below) - The "heart" of the AERI radiometer is a Fourier- transform IR
(FTIR) spectrometer manufactured by Bomem Corp., Quebec, Canada. This spectrometer,
dubbed the model MB-100, is a four-port Michelson interferometer employing a flex-pivot mirror
translation mount and corner cube reflectors. This design is very robust against ambient
vibrations and temperature fluctuations and is well-suited for a field-deployed instrument. In
addition, the use of a flex-pivot mirror-scanning system eliminates the need for bearing surface
maintenance associated with conventional interferometer designs.
2. Detector - The AERI IR detector is a two-layer "sandwich" design (InSb and HgCdTe)
manufactured by Infrared Associates.
3. The scene-scanning optics.
4. Calibration blackbodies.
5. Instrument control Hardware.
6. Hatch.
13
January 2005, ARM TR-054
7.1.2
System Configuration and Measurement Methods
The AERIs are located in trailers at the SGP, NSA, and TWP sites. The viewing mirror and the two
calibration blackbodies are separated by a thermal barrier from the other half of the AERI, which consists
of a: Bomem Interferometer and the data acquisition computer. The viewing mirror is at ambient
temperature. The Bomem and computer are at room temperature in the trailer. The viewing mirror is
rotated to view the sky and alternately the calibration sources.
7.1.3
Specifications
Resolution of instrument is one wavenumber (1/cm). Range of wavelengths is 520 to 3300 wavenumbers
or 400 to 3300 wavenumbers in the ER polar detector. Data are collected only in the atmospheric
windows. Maximum range is top of atmosphere on a clear-sky day. Measurements are taken every 8
minutes in standard mode and every minute in rapid sampling mode. The instrument views straight up
into the atmosphere with a 1.3-degree field-of-view.
7.2
Theory of Operation
The IR spectra is gathered by the AERI instrument and the operation of the interferometer follows. The
FTIR spectrometers measure light absorbed or emitted from a sample as a function of wavelength. They
consist of an optical system for collecting light and concentrating it, an interferometer for algebraically
combining the light from the two light paths, a detector to change the light intensity into an electrical
signal, signal conditioning electronics, and a computer for extracting spectral data from the signal using
FTIR methods.
In general, interferometers combine light from two light paths algebraically resulting in variations in light
intensity across the aperture of the interferometer called interference fringes (for non-coincident or nonidentical wavefronts). One light path is scanned to vary the optical path length. The other path is a
reference path. Consider a Michelson interferometer looking at monochromatic light from a collimated
expanded laser beam, in which the incident beam is split into two equal length paths by a beam-splitter.
Also assume that each path ends in a plane front surface mirror, which is aligned such that the surfaces
are normal to the beam.
If the mirrors are aligned exactly so that the distance traveled by light is point-for-point identical over the
beam for the two paths, the observer will see a uniformly bright entrance aperture through the
interferometer. If the paths differ by a half-wavelength, the observer will see a uniformly black aperture.
For intermediate positions, the intensity will be proportional to the cosine of the phase angle (relative
fraction of a half-wavelength path difference).
This observation is true only for monochromatic light. If a second monochromatic wavelength is added,
the cross-section will have different intensity for each of the two wavelengths because the difference in
path lengths between the two paths will be a different multiple (or fraction) of wavelengths for each
wavelength. For additional wavelengths, intensity contributions are algebraically summed.
14
January 2005, ARM TR-054
If light entering the interferometer is an unknown combination of wavelengths, like light from a source
having a broadband spectrum, the result will be a complex combination of intensities due to the multiple
wavelengths. As the optical path length of one path is slowly but uniformly changed, the difference in
path length for each wavelength will change. Because the wavelengths are different, the path difference
expressed as a factor of the wavelength will be different for each wavelength, and will change at a
different rate. Path differences, resulting in a variation in output intensity, will change more quickly for
short wavelengths than for long wavelengths. If a detector converts the intensity variations into electrical
variations, temporal signal will be a superposition of cosines with periods representing the time variations
in intensity. Analysis of this series into its component frequency components (with coefficients
characteristic of the relative intensities of the individual wavelength components present in the incident
light) is accomplished using a FTIR algorithm. The algorithm is ideally suited to breaking down signals
comprising a series of sines or cosines, resulting in the electromagnetic spectrum of the incident light.
The function of the Helium Neon laser in a modern FTIR is often misunderstood. Its sole purpose is to
measure the position(x) of the moving mirror, the so-called retardation distance. The helium neon laser is
used in a separate interferometer, called the reference interferometer, that shares the moving mirror with
the IR interferometer. In this way, fringes are counted in the reference interferometer, which allows a
precise measurement of the retardation position, x. With the interferrogram, I(x), from the IR
interferometer, and the retardation position, x, the spectra can be obtained by a fast fourier transform.
7.3
7.3.1
Calibration
Theory
Two blackbody sources, one at ambient temperature and the other at 330K are used to calibrate the
instrument. The two sources are used to determine the slope and offset, which define the linear
instrument response at each wavenumber. (see reference 1) The AERI views these two blackbodies every
two minutes. Magnitude of the difference between these blackbody spectra is then formed to compute the
responsivity and offset for the instrument.
After application of the responsivity and offset, the brightness temperature vs. wavenumber agrees with
the known temperatures (290K and 330K) within 1 Kelvin. The residual error is thought to originate
from two sources: angular dependence in the beam-splitter coatings and emission from the beam-splitter
coatings. Of these two sources, the largest error appears to originate from emission in the beam-splitter.
(see reference 1).
7.3.2
Procedures
Calibration procedures are performed automatically by the software. Any anomalies are reported in the
.SUM file and evaluated by the instrument mentor. See references 2 and 3 to see how calibration is
automatically performed.
15
January 2005, ARM TR-054
7.3.3
History
Because this instrument takes a calibration run every 2 minutes, the best history is to obtain views of the
blackbody brightness temperature curves (available only from the Multiple AERI Data System (MADS)
software, instrument mentor). Inspections of these curves by the mentor in the past has revealed no
anomalies in calibration.
7.4
7.4.1
Operation and Maintenance
User Manual
There is no User Manual.
7.4.2
Routine and Corrective Maintenance Documentation
This information is available from the instrument mentor or the Space Science and Engineering Center
(SSEC) and is only to be performed by the site techs and mentors.
7.4.3
Software Documentation
The software for operating the instrument is called MADS. There is no manual. The interface is selfexplanatory.
7.4.4
Additional Documentation
The user may want to contact the instrument manufacturer, Bomem, for instrument details and SSEC for
details on how the Bomem was converted to an AERI.
7.5
Glossary
FTIR - Fourier Transform Infrared
HgCdTe - Mercury Cadmium Telluride Detector for long wavelength infrared detection (5 to 15
microns).
InSB - or 'insbee' detector optimized for near-to-mid-infrared 1 to 5 microns.
Wavenumber - the inverse of the wavelength in centimeters. For example, one micron wavelength (.0001
cm, 1e-4) becomes 10,000 wavenumbers when inverted. Wavenumber is useful because the photon
energy is equal to the wavenumber times planck's constant times two pi (i.e., the wavenumber is
proportional to the photon energy).
7.6
Acronyms
AERI
AERI-ER
atmospheric emitted radiance interferometer
atmospheric emitted radiance interferometer-extended range
16
January 2005, ARM TR-054
ARM
DQR
FTIR
IR
LBLRTM
LIDAR
MADS
NSA
PBL
QME
RASS
RTE
SGP
SHEBA
SSEC
TWP
UTC
VAP
Atmospheric Radiation Measurement (Program)
data quality report
Fourier Transform Infrared
infrared
(line-by-line radiative transfer model)
light detection and ranging
Multiple AERI Data System
North Slope of Alaska
planetary boundary layer
Quality Measurement Experiment
radio acoustic sounding system
radiative transfer equation
Southern Great Plains
Surface Heat Budget of the Arctic Ocean
Space Science and Engineering Center
Tropical Western Pacific
Universal Time Coordinates
value-added product
Also see the ARM Acronyms and Abbreviations.
7.7
Citable References
References 2 and 3 provide outstanding detail on the AERI.
1) Revercomb, H.E., H. Buijs, H.B. Howell, D.D. LaPorte, W.L. Smith, and L.A. Sromovsky. 2004.
"Radiometric Calibration of IR Fourier Transform Spectrometers: Solution to a Problem with the HighResolution Interferometer Sounder." Applied Optics 27(15):3210-3218.
2) Knuteson, R.O., H.E. Revercomb, F.A. Best, N.C. Ciganovich, R.G. Dedecker, T.P. Dirkx, S.C.
Ellington, W.F. Feltz, R.K. Garcia, H.B. Howell, W.L. Smith, J.F. Short, and D.C. Tobin. 2004.
“Atmospheric Emitted Radiance Interferometer. Part I: Instrument Design.” Journal of Atmospheric and
Oceanic Technology 21:1763-1776.
3) Knuteson, R.O. , H.E. Revercomb, F.A. Best, N.C. Ciganovich, R.G. Dedecker, T.P. Dirkx, S.C.
Ellington, W.F. Feltz, R.K. Garcia, H.B. Howell, W.L. Smith, J.F. Short, and D.C. Tobin. 2004.
“Atmospheric Emitted Radiance Interferometer. Part II: Instrument Performance.” Journal of
Atmospheric and Oceanic Technology 21:1777-1789.
4) Brown, P.D. , S.A. Clough, N.E. Miller, T.R. Shippert, D.R. Turner, R.O. Knuteson, H.E. Revercomb,
and W.L. Smith. 1995. "Initial Analyses of Surface Spectral Radiance Between Observations and Lineby-Line Calculations." Proceedings of the Fifth Atmospheric Radiation Measurement (ARM) Science
Team Meeting." March 19-23, pp. 29-32.
17
January 2005, ARM TR-054
Atmospheric Profiling
Feltz, W.F., H.B. Howell, R.O. Knuteson, H.M. Woolf, and H E. Revercomb. 2003. “Near Continuous
Profiling of Temperature, Moisture, and Atmospheric Stability Using the Atmospheric Emitted Radiance
Interferometer (AERI).” Journal of Applied Meteorology 42:584-597.
Feltz, W.F., and J.R. Mecikalski. 2002. “Monitoring High Temporal Resolution Convective Stability
Indices Using the Ground-Based Atmospheric Emitted Radiance Interferometer (AERI) During the 3 May
1999 Oklahoma/Kansas Tornado Outbreak.” Weather Forecasting 17:445-455.
Feltz, W.F., W.L. Smith, R.O. Knuteson, H.E. Revercomb, H.M. Woolf, and H.B. Howell. 1998.
“Meteorological Applications of Temperature and Water Vapor Retrievals from the Ground-Based
Atmospheric Emitted Radiance Interferometer (AERI).” Journal of Applied Meteorology 37:857-875.
He, Hui, W.W. McMillan, R.O. Knuteson, and W.F. Feltz. 2001. “Tropospheric Carbon Monoxide
Column Density Retrieval During the Pre-Launch MOPITT Validation Exercise.” Atmospheric
Environment 35:509-514.
Smith, W.L, W.F. Feltz, R.O. Knuteson, H.E. Revercomb, H.B. Howell, and H.M. Woolf. 1999. “The
Retrieval of Planetary Boundary Layer Structure Using Ground-Based Infrared Spectral Radiance
Measurements.” Journal of Atmospheric and Oceanic Technology 16:323-333.
Smith, W.L., H.E. Revercomb, H.B. Howell, H.M. Woolf, R.O. Knuteson, R.G. Dedecker, M.J. Lynch,
E.R. Westwater, R.G. Strauch, K.P. Morton, B. Stankov, M.J. Falls, J. Jordan, M. Jacobsen, W.F.
Daberdt, R. McBeth, G. Albright, C. Paneitz, G. Wright, P.T. May, and M.T. Decker. 1990. “GAPEX: A
Ground-Based Atmospheric Profiling Experiment.” Bulletin of the American Meteorological Society
71(3).
Turner, D.D., W.F. Feltz, and R.A. Ferrare. 2000. “Continuous Water Profiles from Operational GroundBased Active and Passive Remote Sensors.” Bulletin of the American Meteorological Society 81:13011317.
Cloud Retrieval
Collard, A.D., S.A. Ackerman, W.L. Smith, X. Ma, H.E. Revercomb, R.O. Knuteson, and S.-C. Lee.
1995. “Cirrus Cloud Properties Derived from High Spectral Resolution Infrared Spectrometry during
FIRE II. Part III: Ground-Based HIS Results.” Journal of the Atmospheric Sciences 52:4264-4275.
DeSlover, D.H., W.L. Smith, P.K. Piironen, and E.W. Eloranta. “A Methodology for Measuring Cirrus
Cloud Visible-to-Infrared Spectral Optical Depth Ratios.” Journal of Atmospheric and Oceanic
Technology 16:251-262.
Turner, D.D. submitted. “Arctic Mixed-Phase Cloud Properties from AERI Observations, Part I: Theory
and Simulations.” Journal of Applied Meteorology.
18
January 2005, ARM TR-054
Turner, D.D. submitted. “Arctic mixed-phase cloud properties from AERI observations, Part II: Results
from SHEBA.” Journal of Applied Meteorology.
Turner, D.D., S.A. Ackerman, B.A. Baum, H.E. Revercomb, and P. Yang. 2003. “Cloud Phase
Determination Using Ground-Based AERI Observations at SHEBA.” Journal of Applied Meteorology
42:701-715.
IR Modeling
Tobin, D.C., and coauthors. “Downwelling Spectral Radiance Observations at the SHEBA Ice Station:
Water Vapor Continuum Measurements from 17 to 26 um.” Journal of Geophysical Research 104:20812092.
D.D. Turner, D.C. Tobin, S.A. Clough, P.D. Brown, R.G. Ellingson, M.J. Mlawer, R.O. Knuteson, H.E.
Revercomb, T.R. Shippert, and W.L. Smith. submitted. “The QME AERI LBLRTM: A Closure
Experiment for Downwelling High Spectral Resolution Infrared Radiance.” Journal of Atmospheric
Science.
Instrument
Minnett, P.J., R.O. Knuteson, F.A. Best, B.J. Osborne, J.A. Hanafin, and O.B. Brown. 2001. “The
Marine-Atmospheric Emitted Radiance Interferometer: A High-Accuracy, Seagoing Infrared
Spectroradiometer.” Journal of Atmospheric and Oceanic Technology 18:994-1013.
Oceanic / Land Surface Remote Sensing
Kearns, E.J., J.A. Hanafin, R.H. Evans, P.J. Minnett, and O.B. Brown. 2000. “An Independent
Assessment of Pathfinder AVHRR Sea Surface Temperature Accuracy Using the Marine Atmosphere
Emitted Radiance Interferometer (MAERI).” Bulletin of the American Meteorological Society 81:15251536.
McKeown, W., F. Bretherton, H.L. Huang, W.L. Smith, and H.E. Revercomb. 1995. “Sounding the Skin
of Water: Sensing Air-Water-Interface Temperature-Gradients with Interferometry.” Journal of
Atmospheric and Oceanic Technology 12:1313-1327.
Smith, W.L., R.O. Knuteson, H.E. Revercomb, W. Feltz, H.B. Howell, W.P. Menzel, N. Nalli, O. Brown,
J. Brown, P. Minnett, and W. McKeown. 1996. “Observations of the Infrared Radiative Properties of the
Ocean - Implications for the Measurement of Sea Surface Temperature via Satellite Remote Sensing.”
Bulletin of the American Meteorological Society.
19