1
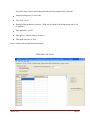
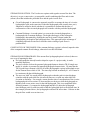
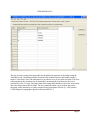
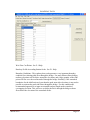
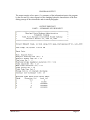
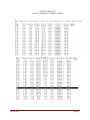
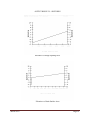
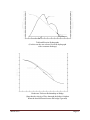
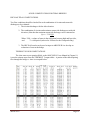
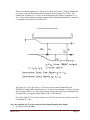
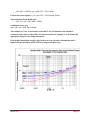
OFFICE OF STRUCTURES
MANUAL FOR HYDROLOGIC AND HYDRAULIC DESIGN
CHAPTER 11 APPENDIX B
TIDEROUT 2 USERS MANUAL
APRIL 2011
APRIL 2011
Page 1
Preface
TIDEROUT 2, Build 1.22 dated June 29, 2006 is the current version of this program and all
previous versions should be discarded. The user is advised to check the web site below for any
revisions to the program: http://www.gishydro.umd.edu
The material presented in this TIDEROUT 2 Users Manual has been carefully researched and
evaluated. It is periodically updated and improved to incorporate the results of new research and
technology. However, no warranty expressed or implied is made on the contents of this program
or the user’s manual. The distribution of this information does not constitute responsibility by
the Maryland State Highway Administration or any contributors for omissions, errors or possible
misinterpretations that may result from the use or interpretation of the materials contained herein.
TIDEROUT 2 is a flood routing program. Its primary purpose is to serve to estimate scour at
bridges in tidal waterways. It can be used to route riverine flows from an upland watershed down
to the tidal basin and then route the combined riverine/tidal flow through the bridge (and perhaps
over the road) down to the sea:
Basic equation: Inflow – Outflow = Storage
Bridge flow/roadway overtopping flow = tidal flow + riverine flow
Many newly designed OBD tidal bridges span wetlands and do not constrict tidal flow so as to
cause significant contraction scour; contraction scour may be more of a problem with older
structures that do constrict the waterway area.
The advantages of the TIDEROUT program include:
1. Takes into account conditions of unsteady tidal flow
2. Evaluates potential benefits of storage in the tidal basin upstream of structure
3. Provides a means of combining riverine and tidal flow hydrographs to estimate the worst
case scour condition
4. The user can very quickly change input parameters to do sensitivity testing of reasonable
combinations of storm tides, riverine flow, wind conditions, etc. to find the worst case
scour.
The limitations of the TIDEROUT 2 program include:
1. Method does not address other aspects of tidal flow such as littoral drift or movement of
sediment through the tidal basin.
2. Method cannot be used for complex tidal currents resulting from flows between islands
where wind forces predominate
APRIL 2011
Page 2
3. User needs to manually compute contraction and local abutment scour
4. User needs to import TIDEROUT2 output into ABSCOUR to compute pier scour.
Introduction
Chapter 10, Appendix A, Hydraulics of Tidal Bridges, provides a comprehensive discussion of
various aspects of the hydraulic design of tidal bridges. The user of the TIDEROUT 2 program is
encouraged to become familiar with the guidance in Chapter 10, Appendix A before conducting
a tidal analysis at a bridge. The user needs to recognize that unsteady tidal flow is complex, and
that TIDEROUT 2 provides for simple hydraulic and scour models to evaluate it. Nevertheless
the program can be used effectively in the design of structure foundations to evaluate and
determine worst-case scour conditions.
Tide Models
The Office of Structures currently uses TIDEROUT 2 and HEC-RAS to analyze tidal flow at a
bridge. Two dimensional flow models are useful for evaluating flow in large estuaries, but are
not considered necessary for the typical SHA tidal crossing. The SHA guidance is geared
towards tidal areas tributary to the Chesapeake Bay. Special studies may be necessary for
estuaries discharging directly to the ocean. The following guidance is provided with regard to
selection of a tidal model for Chesapeake Bay estuaries. Most likely, a typical bridge site will
not exhibit the clear-cut categories listed below and judgment will be needed to select the most
appropriate model. In some cases, it may be helpful to use both models, compare the results and
then select the most appropriate results
Tidal crossing in close proximity to the bay
(Tide elevations control downstream
tailwater elevations)
Tidal crossing at a considerable distance
from the outlet to the bay. (Downstream
tailwater controlled by normal depth
(Manning) considerations
Small riverine discharge; tidal flow
predominates
Large upland drainage basin, riverine
discharge predominates
APRIL 2011
TIDEROUT 2
X
HEC-RAS
X
X
X
Page 3
BOUNDARY CONDITIONS FOR TIDEROUT 2
Tidal flow is complex, especially if a combination of riverine and tidal discharges is to be used in
the analysis:
Assumptions need to be made about the time of the occurrence of the peak tidal flow and
the peak riverine flow. If the upland drainage area is large, and the time of concentration
of the riverine flow is long, it may not be reasonable to assume that the tidal flow and
riverine flow peaks will coincide. The TIDEROUT 2 model can be adjusted to account
for the occurrence of peak tidal and riverine flows at different times.
In low-lying tidal basins (particularly on the Eastern shore) the tidal basin boundary
elevations may be at four feet or less while the storm tide elevations may be at six feet or
more. Careful analysis is needed to decide the proportion of the flows going through the
bridge, over the road, and across the drainage divide to other watersheds.
FEMA maps which are commonly used to define peak storm tide elevations are based on
the NGVD datum of 1929 while SHA current project mapping is based on NAVD datum
of 1988. The user will need to convert tidal data from the NGVD datum to NAVD datum
when using the program (See Chapter 10, Appendix A)
Various other factors, such as the wind, may influence the flow through the bridge.
Please refer to Chapter 10, Appendix A for a discussion of these factors.
INPUT DATA FOR TIDEROUT 2
Typical input values are described below. The user may wish to select other values depending
on the issues to be addressed.
APRIL 2011
Page 4
PROJECT DATA
TIDEROUT 2 opens to the Project Data Card. This card has the following characteristics:
1. TOOL BAR
File – File management including accessing and saving TIDEROUT 2 files.
Run – Run the program
Draw- Draws a schematic of the output results
Tools – Utility tools for quick calculations
Help – Help menus to answer questions about the program
F-1 (Short Help) – Help for any input window can be obtained by placing the cursor in
the input field (window) and clicking on the F1 Key
2. TAB BARS
A. PROJECT DATA
Project: Describe the highway and the estuary being crossed; include information on
particular aspects of the study i.e. flood discharges, referenced tidal station, etc.
Unit option: SHA prefers English units
Analysis starting time: For the Chesapeake Bay the storm tide period is assumed to be 24
hours. Typically, the worst case scour is expected to occur during the 12 hour ebb tide
period starting when the tidal basin is full (high tide) and at the elevation of the design
APRIL 2011
Page 5
storm tide (time 0 hours) and ending when the basin has emptied (time 12 hours)
Analysis ending time 12 at low tide
Time step – See F1
Starting bridge headwater elevation – High tide elevation of the design storm tide or See
F1 guidance
Tide amplitude – See F1
Tidal period – Default value is 24 hours
Tidal peak time (hrs) is Zero
Please click on and read the Disclaimer button
STREAM FLOW DATA
APRIL 2011
Page 6
STREAM FLOW OPTION: The User has two options with regard to stream flow data. The
objective is to get a conservative, yet reasonable, model combining tidal flow and riverine
(stream) flow that includes the peak tidal flow and the peak riverine flow.
Given Hydrograph: A conservative approach would be to arrange the time of a riverine
hydrograph to peak at the same time as the tidal hydrograph peaks (usually time zero).
Judgment is needed to decide whether it is reasonable to assume that the time of
concentration of the riverine hydrograph will coincide with the peak tidal hydrograph.
Constant Discharge: A second option is to convert the riverine hydrograph to a
hydrograph with a constant discharge. The height (discharge) of this rectangular
hydrograph is determined by dividing the total area (runoff volume) under the
hydrograph by the length of the hydrograph base. This approach has the advantage of
combining tidal and riverine flows when the relative timing of peak flows is
problematical.
CONSTANT FLOW DISCHARGE: If the constant discharge option is selected, input the value
of the computed constant flow discharge; otherwise leave this field blank.
STREAM FLOW HYDROGRAPH: If the stream flow hydrograph option is selected, there are
two ways of inputting the data:
If a hydrograph has already been developed as a part of a project study, it can be
manually input here
The user can also click on the generate hydrograph button to obtain a TR-20 single area
model. A window is presented to input the hydrograph characteristics. We note that the
TR-20 peak factor constant is 484 for all of the physiographic regions in Maryland except
for the Eastern Shore which is 284. The time step selected in normally 0.1 to 0.2 hours to
be consistent with the tidal hydrograph.
The user can “shift” the stream inflow hydrograph so that the peak riverine discharge
coincides with the peak tidal flow elevation at time zero, or with any other tidal flow
elevation or discharge. For example, assume that the time of concentration of the riverine
hydrograph peak occurs at time 19 hours and the user desires to shift the hydrograph so
that this peak occurs at time zero for the tidal hydrograph. This is accomplished in the
following manner: (1) compute the hydrograph and then (2) adjust the hydrograph
time/discharge pairs for each time unit to shift the hydrograph peak to the desired time. In
the example presented above, the hydrograph would need to start at time -19 hours so that
the peak flow would occur at time zero.
APRIL 2011
Page 7
TIDE BASIN DATA
The user creates a storage area rating table for the tidal basin upstream of the bridge using the
Tidal Basin card. Beginning with the elevation of the channel bottom at the bridge (usually a
negative value below zero), the information is provided as a set of elevation-area pairs. The areas
corresponding to the elevations can be obtained by measuring the areas between successive
contour lines (See F-1 help). The upper limit of the rating table should be selected as an elevation
above the design storm tide elevation. The area contained within a given contour line can be
measured with a planimeter or can be computed using appropriate software (i.e. GIS Systems,
CADD Programs, topographic digital elevation models, etc.)
APRIL 2011
Page 8
BRIDGE WATERWAY OPENING DATA
Discharge Coefficient:
Refer to F-1 Help. For small bridges, the default value has been selected as 0.6. For
larger bridges, particularly those with streamlined abutments, a more reasonable value
would be 0.8
Bridge Waterway Area Opening Rating Table.
The waterway area rating table is provided by the user as a set of elevation vs. waterway
area pairs. See F-1 Help. The waterway area for various water surface elevations can be
measured from the bridge plans.
APRIL 2011
Page 9
ROADWAY DATA
Weir Flow Coefficient: See F-1 Help
Roadway Profile Ascending Station Order: See F-1 Help.
Boundary Conditions: This roadway data card represents a very important boundary
condition for evaluating tidal flow through the bridge. For many Eastern Shore bridges,
roadway elevations will be below storm tide elevations, and a large quantity of the tidal
prism will flow over the road instead of through the bridge. Similarly, if the watershed
boundaries for the tidal basin are lower than the peak storm tide elevations, it may not be
possible to estimate the peak tidal flows through the bridge. For this condition the
recommended approach is to input an extended roadway length at the watershed
overtopping elevation. This will serve to define the flows through the bridge as those
flows below the elevation of the watershed divide.
APRIL 2011
Page 10
PROGRAM OUTPUT
The output consists of two parts: (1) a summary of the information input to the program
by the user and (2) a time sequence of the changing hydraulic characteristic of the flow
during passage of the selected tide and riverine hydrographs.
OUTPUT PRINTOUT
PART 1 – SUMMARY OF USER INPUT
APRIL 2011
Page 11
APRIL 2011
Page 12
OUTPUT PRINTOUT
PART 2 – TIDEROUT COMPUTATIONS
APRIL 2011
Page 13
OUTPUT RESULTS – SKETCHES
Elevation vs. Bridge Opening Area.
Elevation vs. Basin Surface Area
APRIL 2011
Page 14
Tidal and Riverine Hydrographs
(For this case the user selected a riverine hydrograph
with a constant discharge)
Headwater-Tailwater Relationships at Bridge
(Note that the velocity of flow thorough the bridge is highest
When the head differential across the bridge is greatest)
APRIL 2011
Page 15
SCOUR COMPUTATIONS FOR TIDAL BRIDGES
HEC-RAS TIDAL COMPUTATIONS.
Two flow conditions should be checked for each combination of riverine and storm tide
discharges to be evaluated:
1. The riverine discharge with low tide elevation.
2. The combination of riverine and maximum storm tide discharges at mid-tide
elevation.( Note that the maximum storm tide discharge can be estimated as:
Q max = 3.14 VOL
T
Where VOL = volume of water in the tidal prism between high and low tides,
and
T = tidal period (selected as 24 hours for the Chesapeake Bay)
3. The HEC-RAS results can be used as input to ABSCOUR 9 to develop an
evaluation of scour at the bridge.
TIDEROUT SCOUR COMPUTATIONS
The clear water scour equation (Refer to the ABSCOUR 9 Users Manual in Chapter 11)
is used to estimate scour from the TIDEROUT 2 output tables: A portion of the table depicting
flow through the bridge vs. time is excerpted below:
APRIL 2011
Page 16
Please note that the highest flow velocity of 6.9 fps occurs at time 7.6 hours (underlined
row above) when the downstream tide elevation is at an elevation of 0.84 feet. The
channel bed elevation is at -6.8 feet, so the downstream flow depth is computed as 7.6
feet. Surface and subsurface (boring) samples indicate that the channel bed is comprised
of a medium sand with a D50 of 0.0016 feet.
Clear Water Scour Equation
The values of vo (6.9 fps) and yo (7.6 feet) are known values obtained from the
TIDEROUT output tables and the value of y2 is the total scour depth we wish to calculate.
This missing variable is Vc, the critical velocity of the sand which can be obtained from
the chart below excerpted from the ABSCOUR 9 Users Manual
For a flow depth of 7.6 feet and a particle size of 0.0016, the critical velocity of the sand
is estimated as 3.6 fps.
Solve the equation for y2 (total contraction flow depth including flow depth)
• q = Vo*yo = Vc*y2; then
APRIL 2011
Page 17
•
y2 = q/Vc = (Vo/Vc) *yo = (6.9/ 3.7) * 7.6 = 14.2 ft
Contraction scour depth ys = y2 – yo= 14.2 – 7.6 = 6.6 (say 7) feet
Total Abutment Scour Depth (y2a)
• y2a ~ 1.4 * y2 = 1.4 * 14.2 = 19.9 ft
6 Abutment scour (ysa)
ysa = y2a – yo = 19.9 -7.6 = 12 feet.
The estimates of 7 feet of contraction scour and 12 feet of abutment scour should be
evaluated in the context of the Office of Structures policies in Chapter 11 to determine the
appropriate design for the bridge abutments.
If the bridge foundations include a pier in the waterway, the above information can be
input in the pier module in ABSCOUR 9 to compute the pier scour.
APRIL 2011
Page 18