1
6.828 Fall 2006 Lab 1: Booting a PC
Handed out Wednesday, September 6, 2006 Due Thursday, September 14, 2006
Suggestion For 6.828 2007
Several exercises on C pointer manipulation in user space. In 2006, students had bugs in
Lab 3 because they weren't casting pointer properly, or using unnecessary & operators to
placate the compiler.
Introduction
This lab is split into three parts. The first part concentrates on getting familiarized with
x86 assembly language, the Bochs x86 emulator, and the PC's power-on bootstrap
procedure. The second part examines the boot loader for our 6.828 kernel, which resides
in the boot directory of the lab1 tree. Finally, the third part delves into the initial
template for our 6.828 kernel itself, named JOS, which resides in the kernel directory.
Software Setup
The files you will need for this lab (lab1-handout.gz) are located in the labs section for
this course.To install them in your Athena account, do this:
athena%
athena%
athena%
athena%
athena%
cd ~/6.828
wget [File unavailable for download]
gtar xzvf lab1.tar.gz
cd lab1
We have set up the appropriate compilers and simulators for you on Athena (just use 'add
6.828'). You must use an i386 Athena machine; that is, uname -a should mention i386
GNU/Linux. You can log into our i386 Athena host with ssh -X athena.lcs.mit.edu.
If you are working on a non-athena machine, the tools page has directions on how to set
up bochs and gcc for use with 6.828.
Hand-In Procedure
When you are ready to hand in your lab, submit it electronically by following the
procedure outlined by the instructors.
You do not need to turn in answers to any of the questions in the text of the lab. (Do
answer them for yourself though! They will help with the rest of the lab.)
We will be grading your solutions with a grading program. You can run gmake grade to
test your solutions with the grading program.
Part 1: PC Bootstrap
The purpose of the first exercise is to introduce you to x86 assembly language and the PC
bootstrap process, and to get you started with the Bochs debugger. You will not have to
write any code for this part of the lab, but you should go through it anyway for your own
understanding and be prepared to answer the questions posed below.
Getting Started with x86 assembly
If you are not already familiar with x86 assembly language, you will quickly become
familiar with it during this course! The PC Assembly Language Book in readings section
is an excellent place to start. Hopefully, the book contains mixture of new and old
material for you.
Warning: Unfortunately the examples in the book are written for the NASM assembler,
whereas we will be using the GNU assembler. NASM uses the so-called Intel syntax
while GNU uses the AT&T syntax. While semantically equivalent, an assembly file will
differ quite a lot, at least superficially, depending on which syntax is used. Luckily the
conversion between the two is pretty simple, and is covered in Brennan's Guide to Inline
Assembly.
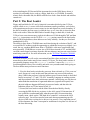
Exercise 1. Read or at least carefully scan the entire PC
Assembly Language book, except that you should skip all
sections after 1.3.5 in chapter 1, which talk about features of
the NASM assembler that do not apply directly to the GNU
assembler. You may also skip chapters 5 and 6, and all
sections under 7.2, which deal with processor and language
features we won't use in 6.828.
Also read the section "The Syntax" in Brennan's Guide to
Inline Assembly to familiarize yourself with the most
important features of GNU assembler syntax.
Certainly the definitive reference for x86 assembly language programming is Intel's
instruction set architecture reference, which you can find on the 6.828 reference page in
two flavors: an HTML edition of the old 80386 Programmer's Reference Manual in the
readings section, which is much shorter and easier to navigate than more recent manuals
but describes all of the x86 processor features that we will make use of in 6.828; and the
full, latest and greatest IA-32 Intel Architecture Software Developer's Manuals from
Intel, covering all the features of the most recent processors that we won't need in class
but you may be interested in learning about. An equivalent (but even longer) set of
manuals is available from AMD, which also covers the new 64-bit extensions now
appearing in both AMD and Intel processors.
You should read the recommended chapters of the PC Assembly book, and "The Syntax"
section in Brennan's Guide now. Save the Intel/AMD architecture manuals for later or
use them for reference when you want to look up the definitive explanation of a particular
processor feature or instruction.
Simulating the x86
Instead of developing the operating system on a real, physical personal computer (PC),
we use a simulator, which emulates a complete PC faithfully: the code you write for the
simulator will boot on a real PC too. Using a simulator simplifies debugging; you can, for
example, set break points inside of the simulated x86, which is difficult to do with the
silicon-version of an x86.
In 6.828 we will use the Bochs PC Emulator. This emulator has been around for quite a
while, and is slow and quirky but has a great many useful features. Another freely
available PC emulator is QEMU, which is much faster than Bochs but has less mature
debugging facilities. You are welcome to give QEMU a try (or any of the commercially
available PC virtual machine programs), but our 6.828 lab assignments will assume (and
sometimes require) that you are running under Bochs.
To get started, extract the Lab 1 files into your own directory on Athena as described
above in "Software Setup", then type gmake in the lab1 directory to build the
minimal 6.828 boot loader and kernel you will start with. (It's a little generous to call the
code we're running here a "kernel," but we'll flesh it out throughout the semester.)
athena% cd lab1
athena% gmake
as kern/entry.S
cc kern/init.c
cc kern/console.c
cc kern/monitor.c
cc lib/printf.c
cc lib/printfmt.c
cc lib/readline.c
cc lib/string.c
ld obj/kern/kernel
as boot/boot.S
cc boot/main.c
mk boot/boot
boot block is 424 bytes (max 510)
mk obj/kern/bochs.img
Now you're ready to run Bochs. The necessary configuration file for Bochs, named
.bochsrc, is already supplied for you in the lab1 directory. This .bochsrc includes a
command to make Bochs use the file obj/kern/bochs.img, created above, as the
contents of the simulated PC's "virtual hard disk" once Bochs starts running. This
simulated hard disk image contains both our boot loader (obj/boot/boot) and our kernel
(obj/kern/kernel).
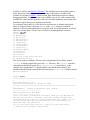
athena% bochs
=======================================================================
=
Bochs x86 Emulator 2.2.6
Build from CVS snapshot on January 29, 2006
=======================================================================
=
00000000000i[ ] reading configuration from .bochsrc
-----------------------------Bochs Configuration: Main Menu
-----------------------------This is the Bochs Configuration Interface, where you can describe the
machine that you want to simulate. Bochs has already searched for a
configuration file (typically called bochsrc.txt) and loaded it if it
could be found. When you are satisfied with the configuration, go
ahead and start the simulation.
You can also start bochs with the -q option to skip these menus.
1. Restore factory default configuration
2. Read options from...
3. Edit options
4. Save options to...
5. Begin simulation
6. Quit now
Please choose one: [5]
Bochs has read the file .bochsrc describing the virtual x86 PC it will emulate for our
kernel, and it is stopping to give you an opportunity to change the settings if desired
before beginning the actual simulation. Since the configuration settings are already
correct, just press Enter to start the simulation. (As Bochs points out, you can bypass this
step in the future by typing 'bochs -q' instead of just 'bochs'.)
Next at t=0
(0) [0xfffffff0] f000:fff0 (unk. ctxt): jmp f000:e05b ; ea5be000f0
<bochs:1>
Bochs has now started the simulated machine, and is ready to execute the first instruction.
An X window should have popped up to show the "virtual display" of the simulated PC.
The window is blank because the simulated PC hasn't actually booted yet - it's frozen in
the state a real PC would be in just after being turned on and coming out of hardware
reset but before executing any instructions.
The text that Bochs printed on your normal shell window, and the <bochs:1> prompt, is
part of the Bochs debugging interface, which you can use to control and examine the state
of the simulated PC. The main reference for this debugging interface that you should
become familiar with is the section Using Bochs internal debugger in the Bochs User
Manual. You can always get a reminder of the names of the most common commands by
typing help:
<bochs:1> help
help - show list of debugger commands
help 'command'- show short command description
-*- Debugger control -*help, q|quit|exit, set, instrument, show, trace-on, trace-off,
record, playback, load-symbols, slist
-*- Execution control -*c|cont, s|step|stepi, p|n|next, modebp
-*- Breakpoint management -*v|vbreak, lb|lbreak, pb|pbreak|b|break, sb, sba, blist,
bpe, bpd, d|del|delete
-*- CPU and memory contents -*x, xp, u|disas|disassemble, r|reg|registers, setpmem, crc, info,
dump_cpu,
set_cpu, ptime, print-stack, watch, unwatch, ?|calc
For now, just type c to "continue" (i.e., start) execution from the current point. Some text
should now appear in the Bochs window, ending with:
Booting from Hard Disk...
6828 decimal is XXX octal!
entering test_backtrace 5
entering test_backtrace 4
entering test_backtrace 3
entering test_backtrace 2
entering test_backtrace 1
entering test_backtrace 0
leaving test_backtrace 0
leaving test_backtrace 1
leaving test_backtrace 2
leaving test_backtrace 3
leaving test_backtrace 4
leaving test_backtrace 5
Welcome to the JOS kernel monitor!
Type 'help' for a list of commands.
K>
Everything after 'Booting from Hard Disk...' was printed by our skeletal JOS kernel;
the K> is the prompt printed by the small monitor, or interactive control program, that
we've included in the kernel. These lines printed by the kernel will also appear in the
regular shell window from which you ran Bochs. This is because for testing and lab
grading purposes we have set up the JOS kernel to write its console output not only to the
virtual VGA display (as seen in the Bochs window), but also to the simulated PC's virtual
parallel port, which Bochs outputs to its own standard output because of a particular line
we included in our .bochsrc. (Identify that line!)
The kernel monitor is currently pretty boring; it only knows about two not particularly
useful commands:
K> help
help - display this list of commands
kerninfo - display information about the kernel
K> kerninfo
Special kernel symbols:
_start f010000c (virt) 0010000c (phys)
etext f0101436 (virt) 00101436 (phys)
edata f0114558 (virt) 00114558 (phys)
end f0114bc0 (virt) 00114bc0 (phys)
Kernel executable memory footprint: 83KB
K>
The help command is obvious, and we will shortly discuss the meaning of what the
kerninfo command prints. Although simple, it's important to note that this kernel
monitor is running "directly" on the "raw (virtual) hardware" of the simulated PC. This
means that you should be able to copy the contents of obj/kern/bochs.img onto the
first few sectors of a real hard disk, insert that hard disk into a real PC, turn it on, and see
exactly the same thing on the PC's real screen as you did above in the Bochs window.
(We don't recommend you do this on a real machine with useful information on its hard
disk, though, because copying bochs.img onto the beginning of its hard disk will trash
the master boot record and the beginning of the first partition, effectively causing
everything previously on the hard disk to be lost!)
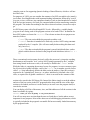
Exercise 2. Scan through the Using Bochs internal debugger
section of the Bochs user manual to get a feel for these
commands and their syntax. Play with the commands a little:
do some stepping and tracing through the code, examining
CPU registers and memory and disassembling instructions at
different points, without worrying too much yet about what
the code is actually doing. While the kernel monitor is
waiting for user input (or at any other time the simulation is
running), you can always hit CTRL-C in the shell window
from which you ran Bochs in order to halt the simulation and
break back into the Bochs debugger. Be sure you understand
the distinction between which software you're interacting
with when you type commands in the kernel monitor versus
in the Bochs debugger.
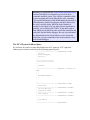
The PC's Physical Address Space
We will now dive into a bit more detail about how a PC starts up. A PC's physical
address space is hard-wired to have the following general layout:
+------------------+ <- 0xFFFFFFFF (4GB)
| 32-bit |
| memory mapped |
| devices |
| |
/\/\/\/\/\/\/\/\/\/\
/\/\/\/\/\/\/\/\/\/\
| |
| Unused |
| |
+------------------+ <- depends on amount of
RAM
| |
| |
| Extended Memory |
| |
| |
+------------------+
| BIOS ROM |
+------------------+
| 16-bit devices, |
| expansion ROMs |
+------------------+
| VGA Display |
+------------------+
| |
| Low Memory |
| |
+------------------+
<- 0x00100000 (1MB)
<- 0x000F0000 (960KB)
<- 0x000C0000 (768KB)
<- 0x000A0000 (640KB)
<- 0x00000000
The first PCs, which were based on the 16-bit Intel 8088 processor, were only capable of
addressing 1MB of physical memory. The physical address space of an early PC would
therefore start at 0x00000000 but end at 0x000FFFFF instead of 0xFFFFFFFF. The
640KB area marked "Low Memory" was the only random-access memory (RAM) that an
early PC could use; in fact the very earliest PCs only could be configured with 16KB,
32KB, or 64KB of RAM!
The 384KB area from 0x000A0000 through 0x000FFFFF was reserved by the hardware
for special uses such as video display buffers and firmware held in nonvolatile memory.
The most important part of this reserved area is the Basic Input/Output System (BIOS),
which occupies the 64KB region from 0x000F0000 through 0x000FFFFF. In early PCs
the BIOS was held in true read-only memory (ROM), but current PCs store the BIOS in
updateable flash memory. The BIOS is responsible for performing basic system
initialization such as activating the video card and checking the amount of memory
installed. After performing this initialization, the BIOS loads the operating system from
some appropriate location such as floppy disk, hard disk, CD-ROM, or the network, and
passes control of the machine to the operating system.
When Intel finally "broke the one megabyte barrier" with the 80286 and 80386
processors, which supported 16MB and 4GB physical address spaces respectively, the PC
architects nevertheless preserved the original layout for the low 1MB of physical address
space in order to ensure backward compatibility with existing software. Modern PCs
therefore have a "hole" in physical memory from 0x000A0000 to 0x00100000, dividing
RAM into "low" or "conventional memory" (the first 640KB) and "extended memory"
(everything else). In addition, some space at the the very top of the PC's 32-bit physical
address space, above all physical RAM, is now commonly reserved by the BIOS for use
by 32-bit PCI devices.
With recent x86 processors it is now possible in fact for PCs to have more than 4GB of
physical RAM, which means that RAM can extend further above 0XFFFFFFFF. In this
case the BIOS must therefore arrange to leave a second hole in the system's RAM at the
top of the 32-bit addressable region, in order to leave room for these 32-bit devices to be
mapped. Because of design limitations JOS will actually be limited to using only the first
256MB of a PC's physical memory anyway, so for now we will pretend that all PCs still
have "only" a 32-bit physical address space. But dealing with complicated physical
address spaces and other aspects of hardware organization that evolved over many years
is one of the important practical challenges of OS development.
The ROM BIOS
Close and restart Bochs, so that you once again see the first instruction to be executed:
Next at t=0
(0) [0xfffffff0] f000:fff0 (unk. ctxt): jmp far f000:e05b ; ea5be000f0
<bochs:1>
From this output you can conclude a few things:
• The PC starts executing in real mode, with CS = 0xf000 and IP = 0xfff0.
The f000:fff0 is the segmented address that translates to 0x000ffff0 in real
mode.
• The first instruction to be executed is a jmp instruction, which jumps to the real
mode segmented address CS = 0xf000 and IP = 0xe05b.
Why does the Bochs start like this? This is how Intel designed the 8088 processor, which
IBM used in their original PC. Because the BIOS in a PC is "hard-wired" to the physical
address range 0x000f0000-0x000fffff, this design ensures that the BIOS always gets
control of the machine first after power-up or any system restart - which is crucial
because on power-up there is no other software anywhere in the machine's RAM that the
processor could execute. The Bochs simulator comes with its own BIOS, which it maps
at this location in the processor's simulated physical address space. On processor reset,
the (simulated) processor sets CS to 0xf000 and the IP to 0xfff0, and consequently,
execution begins at that (CS:IP) segment address. How does the segmented address
0xf000:fff0 turn into a physical address?
To answer that we need to know a bit about real mode addressing. In real mode (the
mode that PC starts off in), address translation works according to the formula: physical
address = 16 * segment + offset. So, when the PC sets CS to 0xf000 and IP to 0xfff0, the
physical address referenced is:
16 * 0xf000 + 0xfff0 # in hex multiplication by 16 is
= 0xf0000 + 0xfff0 # easy--just append a 0.
= 0xffff0
We can see that the PC starts executing 16 bytes from the end of the BIOS code.
Therefore we shouldn't be surprised that the first thing that the BIOS does is jmp
backwards to an earlier location in the BIOS; after all how much could it accomplish in
just 16 bytes?
As a final curiosity, note that Bochs is displaying the address 0xfffffff0 in brackets
where it normally displays the physical address (in this case 0x000ffff0):
Next at t=0
(0) [0xfffffff0] f000:fff0 (unk. ctxt): jmp far f000:e05b ; ea5be000f0
<bochs:1>
This strange detail is related to Bochs's SMP support and is not important for now.
Exercise 3. Use the Bochs debugger to trace into the ROM
BIOS for a few more instructions, and try to guess what it
might be doing. You might want to look at the Bochs I/O
address assignments, Phil Storrs I/O Ports Description, as
well as other materials on the 6.828 reference materials page
( See syllabus.). No need to figure out all the details - just the
general idea of what the BIOS is doing first.
When the BIOS runs, it sets up an interrupt descriptor table and initializes various
devices such as the VGA display. This is where the "Plex86/Bochs VGABios" messages
you see in the Bochs window come from.
After initializing the PCI bus and all the important devices the BIOS knows about, it
searches for a bootable device such as a floppy, hard drive, or CD-ROM. Eventually,
when it finds a bootable disk, the BIOS reads the boot loader from the disk and transfers
control to it.
Part 2: The Boot Loader
Floppy and hard disks for PCs are by historical convention divided up into 512 byte
regions called sectors. A sector is the disk's minimum transfer granularity: each read or
write operation must be one or more sectors in size and aligned on a sector boundary. If
the disk is bootable, the first sector is called the boot sector, since this is where the boot
loader code resides. When the BIOS finds a bootable floppy or hard disk, it loads the
512-byte boot sector into memory at physical addresses 0x7c00 through 0x7dff, and then
uses a jmp instruction to set the CS:IP to 0000:7c00, passing control to the boot loader.
Like the BIOS load address, these addresses are fairly arbitrary - but they are fixed and
standardized for PCs.
The ability to boot from a CD-ROM came much later during the evolution of the PC, and
as a result the PC architects took the opportunity to rethink the boot process slightly. As a
result, the way a modern BIOS boots from a CD-ROM is a bit more complicated (and
more powerful). CD-ROMs use a sector size of 2048 bytes instead of 512, and the BIOS
can load a much larger boot image from the disk into memory (not just one sector) before
transferring control to it. For more information, see the "El Torito" Bootable CD-ROM
Format Specification.
For 6.828, however, we will use the conventional hard drive boot mechanism, which
means that our boot loader must fit into a measly 512 bytes. The boot loader consists of
one assembly language source file, boot/boot.S, and one C source file, boot/main.c
Look through these source files carefully and make sure you understand what's going on.
The boot loader must perform two main functions:
1. First, the boot loader switches the processor from real mode to 32-bit protected
mode, because it is only in this mode that software can access all the memory
above 1MB in the processor's physical address space. Protected mode is described
briefly in sections 1.2.7 and 1.2.8 of PC Assembly Language in readings section,
and in great detail in the Intel architecture manuals. At this point you only have to
understand that translation of segmented addresses (segment:offset pairs) into
physical addresses happens differently in protected mode, and that after the
transition offsets are 32 bits instead of just 16.
2. Second, the boot loader reads the kernel from the hard disk by directly
accessing the IDE disk device registers via the x86's special I/O instructions. If
you would like to understand better what the particular I/O instructions here
actually mean, check out the "IDE hard drive controller" section on the 6.828
reference page. You will not need to learn much about programming specific
devices in this class: writing device drivers is in practice a very important part of
OS development, but from a conceptual or architectural viewpoint it is also one of
the least interesting.
After you understand the boot loader source code, look at the file obj/boot/boot.asm.
This file is a disassembly of the boot loader that our GNUmakefile creates after
compiling the boot loader. This disassembly file makes it easy to see exactly where in
physical memory all of the boot loader's code resides, and makes it easier to track what's
happening while stepping through the boot loader in Bochs.
You can set breakpoints in Bochs with the b command. You have to give the base
explicitly, so say something like b 0x7c00 for hexadecimal. A full command overview
is here. From the debugger, you can continue execution using the c and s commands: c
causes Bochs to continue execution indefinitely; and s allows you to step through the
instructions, executing exactly n instructions (a default of 1 if the parameter n is not
specified) before suspending execution again. trace-on and trace-off can be used to
set tracing before using the other commands.
To examine instructions in memory (besides the immediate next one to be executed,
which Bochs prints automatically), you use the u command. This command has the
syntax u/n addr, where n is the number of consecutive instructions to disassemble and
addr is the memory address at which to start disassembling.
Exercise 4. Set a breakpoint at address 0x7c00, which is
where the boot sector will be loaded. Continue execution
until that break point. Trace through the code in
boot/boot.S, using the source code and the disassembly file
obj/boot/boot.asm to keep track of where you are. Also
use the u command in Bochs to disassemble sequences of
instructions in the boot loader, and compare the original boot
loader source code with both the GNU disassembly in
obj/boot/boot.asm and the Bochs disassembly from the u
command.
Trace into cmain() in boot/main.c, and then into
readsect().
Identify the exact assembly instructions that correspond to
each of the statements in readsect(). Trace through the rest
of readsect() and back out into cmain(), and identify the
begin and end of the for loop that reads the remaining
sectors of the kernel from the disk. Find out what code will
run when the loop is finished, set a breakpoint there, and
continue to that breakpoint. Then step through the remainder
of the boot loader.
Be able to answer the following questions:
• At exactly what point does the processor transition from executing 16-bit code to
executing 32-bit code?
• What is the last instruction of the boot loader executed, and what is the first
instruction of the kernel it just loaded?
• How does the boot loader decide how many sectors it must read in order to fetch
the entire kernel from disk? Where does it find this information?
Challenge! Make JOS boot under Bochs from a simulated
CD-ROM. You will need to learn about the mkisofs utility
(available on Athena), and will have to modify the .bochsrc
appropriately.
Loading the Kernel
We will now look in further detail at the C language portion of the boot loader, in
boot/main.c. But before doing so, this is a good time to stop and review some of the
basics of C programming.
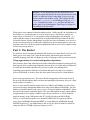
Exercise 5. Read about programming with pointers in C. The best reference for the C
langauge is still The C Programming Language by Brian Kernighan and Dennis Ritchie
(known as 'K&R'). We recommend that students purchase this book (here is an Amazon
Link) or find one of the copies housed in MIT Libraries.
For Exercise 5, it is strongly recommended that you read
Chapter 5 of K&R.
There are other references on pointers in C, though not as
strongly recommended. A tutorial by Ted Jensen that cites
K&R heavily is available in the course readings.
Warning: Unless you are already thoroughly versed in C, do
not skip or even skim this reading exercise. If you do not
really understand pointers in C, you will suffer untold pain
and misery in subsequent labs, and then eventually come to
understand them the hard way. Trust us; you don't want to
find out what "the hard way" is.
To make sense out of boot/main.c you'll need to know what an ELF binary is. When
you compile and link a C program such as the JOS kernel, the compiler transforms each
C source ('.c') file into an object ('.o') file containing assembly language instructions
encoded in the compact binary format expected by the hardware. The linker then
combines all of the compiled object files into a single binary image such as
obj/kern/kernel, which in this case is a binary in the ELF format, which stands for
"Executable and Linkable Format".
Full information about this format is available in the ELF specification on our reference
page, but you will not need to delve very deeply into the details of this format in this
class. Although as a whole the format is quite powerful and complex, most of the
complex parts are for supporting dynamic loading of shared libraries, which we will not
do in this class.
For purposes of 6.828, you can consider the contents of an ELF executable to be (mostly)
just a short, fixed-length header with important loading information, followed by several
program sections, which are just contiguous chunks of code or data intended to be loaded
byte-for-byte into memory at a fixed, pre-computed address before transferring control to
the program. The loader does nothing to the code or data at load time; it must be ready to
go.
An ELF binary starts with a fixed-length ELF header, followed by a variable-length
program header listing each of the program sections to be loaded. The C definitions for
these ELF headers are located in inc/elf.h. The relevant sections for our purposes are
named as follows:
• '.text': The text section holds the program's machine code.
• '.rodata': Data that is intended to be read-only, such as ASCII string constants
produced by the C compiler. (We will not actually bother making this data readonly, however.)
• '.data': The data section holds the program's general (initialized) data, such as
global variables that are declared in the program with initializers such as 'int x =
5;'.
These conventional section names obviously reflect the processor's viewpoint: anything
that humans would consider "text", such as ASCII strings generated by the C compiler
from string literals in the source code, will actually be found in the '.rodata' section.
While the linker is computing the memory layout of a program, it reserves memory space
for all uninitialized global variables, such as just 'int x;', in yet another, special section
called '.bss' that immediately follows the data section in memory. Since this section is
supposed to be "uninitialized", however - or rather, initialized to a default value of all
zeros, as required for all global variables in C - there is no need for the contents of this
section to be stored in the ELF binary file. Instead, the linker simply records the address
and size of the bss section in the ELF program header along with the sizes of the other
sections to be loaded, and leaves it to the loader (or in some cases the program itself) to
zero the bss section.
You can display a full list of the names, sizes, and link addresses of all the sections in the
kernel executable by typing:
athena% i386-jos-elf-objdump -h obj/kern/kernel
You will see many more sections than the ones we listed above, but the others are not
important for our purposes. Most of the others are to hold debugging information, which
is typically included in the program's executable file but not actually loaded into memory
by the program loader.
Besides the section information, there is one more field in the ELF header that is
important to us, named e_entry. This field holds the link address of the entry point in the
program: the memory address in the program's text section at which the program is
supposed to begin executing. You can see the entry point:
athena% i386-jos-elf-objdump -f obj/kern/kernel
To examine memory in the Bochs simulator, you use the x command, which has the
same syntax as gdb's. The command overview (linked above) has full details. For now, it
is enough to know that the recipe x/nx addr prints n words of memory at addr. (Note
that both 'x's in the command are lowercase.)
Warning: The size of a word is not a universal standard. To Bochs, a word is four bytes.
In GNU assembly, a word is two bytes (the 'w' in xorw, which stands for word, means 2
bytes).
Exercise 6. Reset the machine (exit bochs and start it again).
Examine the 8 words of memory at 0x00100000 at the point
the BIOS enters the boot loader, and then again at the point
the boot loader enters the kernel. Why are they different?
What is there at the second breakpoint? (You do not really
need to use Bochs to answer this question. Just think.)
Link vs. Load Address
The load address of a binary is the memory address at which a binary is actually loaded.
For example, the BIOS is loaded by the PC hardware at address 0xf0000. So this is the
BIOS's load address. Similarly, the BIOS loads the boot sector at address 0x7c00. So this
is the boot sector's load address.
The link address of a binary is the memory address for which the binary is linked.
Linking a binary for a given link address prepares it to be loaded at that address. A
program's link address in practice becomes subtly encoded within the binary in a
multitude of ways, with the result that if a binary is not loaded at the address that it is
linked for, things will not work.
In one sentence: the link address is the location where a binary assumes it is going to be
loaded, while the load address is the location where a binary actually is loaded. It's up to
us to make sure that they turn out to be the same.
Look at the -Ttext linker command in boot/Makefrag, and at the address mentioned
early in the linker script in kern/kernel.ld. These set the link address for the boot
loader and kernel respectively.
Exercise 7. Trace through the first few instructions of the
boot loader again and identify the first instruction that would
"break" or otherwise do the wrong thing if you were to get
the boot loader's link address wrong. Then change the link
address in boot/Makefrag to something wrong, run gmake
clean, recompile lab1 with gmake, and trace into the boot
loader again to see what happens. Don't forget to change the
link address back afterwards!
When object code contains no absolute addresses that ``subtly encode'' the link address in
this fashion, we say that the code is position-independent: it will behave correctly no
matter where it is loaded. GCC can generate position-independent code using the -fpic
option, and this feature is used extensively in modern shared libraries that use the ELF
executable format. Position independence typically has some performance cost, however,
because it restricts the ways in which the compiler may choose instructions to access the
program's data. We will not use position-independent code at all in 6.828, simply because
we have no pressing need to.
Part 3: The Kernel
We will now start to examine the minimal JOS kernel in a bit more detail. (And you will
finally get to write some code!) Like the boot loader, the kernel begins with some
assembly language code that sets things up so that C language code can execute properly.
Using segmentation to work around position dependence
Did you notice above that while the boot loader's link and load addresses match perfectly,
there appears to be a (rather large) disparity between the kernel's link and load addresses?
Go back and check both and make sure you can see what we're talking about.
Operating system kernels often like to be linked and run at very high virtual address,
such as 0xf0100000, in order to leave the lower part of the processor's virtual address
space for user programs to use. The reason for this arrangement will become clearer in
the next lab. Most machines don't even have that much physical memory, however. (How
much would it be exactly?)
Since we can't actually load the kernel at physical address 0xf0100000, we will use the
processor's memory management hardware to map virtual address 0xf0100000 - the link
address at which the kernel code expects to run - to physical address 0x00100000 - where
the boot loader actually loaded the kernel. This way, although the kernel's virtual address
is high enough to leave plenty of address space for user processes, it will be loaded in
physical memory at the 1MB point in the PC's RAM, just above the BIOS ROM.
In fact, we will actually map the entire bottom 256MB of the PC's physical address
space, from 0x00000000 through 0x0fffffff, to virtual addresses 0xf0000000 through
0xffffffff respectively. You should now be able to see why the JOS kernel is limited to
using only the first 256MB of physical memory in a PC.
The x86 processor has two distinct memory management mechanisms that we could use
to achieve this mapping: segmentation and paging. Both are described in full detail in the
80386 Programmer's Reference Manual or the IA-32 Developer's Manual, Volume 3 (see
readings). When the JOS kernel first starts up, we'll initially use segmentation to establish
our desired virtual-to-physical mapping, because it is quick and easy - and the x86
processor requires us to set up the segmentation hardware in any case, because it can't be
disabled!
Exercise 8. Use Bochs to trace into the JOS kernel, and
identify the exact point at which the new virtual-to-physical
mapping takes effect. Then examine the Global Descriptor
Table (GDT) that the code uses to achieve this effect, and
make sure you understand what's going on.
What is the first instruction after this point that would fail to
work properly if this virtual-to-physical mapping wasn't in
place? Comment out or otherwise intentionally "break" the
segmentation setup code in kern/entry.S, trace into it in
Bochs, and see if you were right.
Formatted Printing to the Console
Most people take functions like printf() for granted, sometimes even thinking of them
as "primitives" of the C language. But in an OS kernel, all I/O of any kind that we do, we
have to implement ourselves!
Read through kern/printf.c, lib/printfmt.c, and kern/console.c, and make sure
you understand their relationship. It will become clear in later labs why printfmt.c is
located in the separate lib directory.
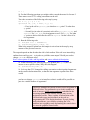
Exercise 9. We have omitted a small fragment of code - the
code necessary to print octal numbers using patterns of the
form "%o". Find and fill in this code fragment.
Be able to answer the following questions:
1. Explain the interface between printf.c and console.c. Specifically, what
function does console.c export? How is this function used by printf.c?
2. Explain the following from console.c:
3. 1 if (crt_pos >= CRT_SIZE) {
4. 2 int i;
5. 3 memcpy(crt_buf, crt_buf + CRT_COLS, (CRT_SIZE - CRT_COLS) *
sizeof(uint16_t));
6. 4 for (i = CRT_SIZE - CRT_COLS; i < CRT_SIZE; i++)
7. 5 crt_buf[i] = 0x0700 | ' ';
8. 6 crt_pos -= CRT_COLS;
9. 7 }
10. For the following questions you might wish to consult the notes for Lecture 2.
These notes cover GCC's calling convention on the x86.
Trace the execution of the following code step-by-step:
int x = 1, y = 3, z = 4;
cprintf("x %d, y %x, z %d\n", x, y, z);
o First, in the call to cprintf(), to what does fmt point? To what does
ap point?
o Second, list (in order of execution) each call to cons_putc, va_arg, and
vcprintf. For cons_putc, list its argument as well. For va_arg, list what
ap points to before and after the call. For vcprintf list the values of its
two arguments.
11. Run the following code.
12. unsigned int i = 0x00646c72;
13. cprintf("H%x Wo%s", 57616, &i);
What is the output? Explain how this output is arrived out in the step-by-step
manner of the previous exercise.
The output depends on that fact that the x86 is little-endian. If the x86 were instead bigendian what would you set i to in order to yield the same output? Would you need to
change 57616 to a different value?
Here's a description of little- and big-endian and a more whimsical description.
14. In the following code, what is going to be printed after 'y='? (note: the
answer is not a specific value.) Why does this happen?
15. cprintf("x=%d y=%d", 3);
16. Let's say that GCC changed its calling convention so that it pushed arguments
on the stack in declaration order, so that the last argument is pushed last. How
would
you have to change cprintf or its interface so that it would still be possible to
pass it a variable number of arguments?
Challenge! Enhance the console to allow text to be printed in
different colors. The traditional way to do this would be to
make it interpret ANSI escape sequences embedded in the
text strings printed to the console, but you may use any
mechanism you like. There is plenty of information on the
6.828 reference page and elsewhere on the web on
programming the VGA display hardware. If you're feeling
really adventurous, you could try switching the VGA
hardware into a graphics mode and making the console draw
text onto the graphical frame buffer.
The Stack
In the final exercise of this lab, we will explore in more detail the way the C language
uses the stack on the x86, and in the process write a useful new kernel monitor function
that prints a backtrace of the stack: a list of the saved Instruction Pointer (IP) values that
can be used to determine the exact context in which a particular piece of C code was
called.
Exercise 10. Determine where the kernel initializes its stack,
and exactly where in memory its stack is located. How does
the kernel reserve space for its stack? And at which "end" of
this reserved area is the stack pointer initialized to point to?
In C programs on the x86, both the esp (stack pointer) and ebp (base pointer) registers
typically have special meanings. The stack pointer points to the current dividing point in
the stack area between "free" stack space and "in use" stack space. Since the stack grows
down on the x86 (and on most other processors), at a given time the stack pointer points
to the first "in use" byte of the stack; everything below that location in the region reserved
for the stack is considered "free". Pushing values onto the stack decreases the stack
pointer, and popping values off the stack increases the stack pointer. In this respect the
x86 works just like the PDP-11, except that the values are usually 32-bit words instead of
16-bit. Various x86 instructions, such as call, are "hard-wired" to use the stack pointer
register.
The ebp register, in contrast, is associated with the stack primarily by software
convention. On entry to a C function, the function's prologue code normally saves the
previous function's base pointer by pushing it onto the stack, and then copies the current
esp value into ebp for the duration of the function. If all the functions in a program
consistently obey this convention, then at any given point during the program's execution,
it is possible to trace back through the stack by following the chain of saved ebp pointers
and determining exactly what nested sequence of function calls caused this particular
point in the program to be reached. This capability can be particularly useful, for
example, when a particular function causes an assert failure or panic because bad
arguments were passed to it, but you aren't sure who passed the bad arguments. With
stack backtrace functionality, you can trace back and find the offending function.
Exercise 11. To become familiar with the C calling
conventions on the x86, find the address of the
test_backtrace function in obj/kern/kernel.asm, set a
breakpoint there in Bochs, and examine what happens each
time it gets called after the kernel starts. There are two ways
you can set this breakpoint: with the b command and a
physical address, or with the vb command, a segment
selector (use 8 for the code segment), and a virtual address.
How many 32-bit words does each recursive nesting level of
test_backtrace push on the stack, and what are those
words?
The above exercise should give you the information you need to implement a stack
backtrace function, which you should call mon_backtrace(). A prototype for this
function is already waiting for you in kern/monitor.c. You can do it entirely in C, but
you may find the read_ebp() function in inc/x86.h useful. You'll also have to hook
this new function into the kernel monitor's command list so that it can actually be
invoked interactively by the user.
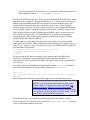
The backtrace function should display a listing of function call frames in the following
format:
Stack backtrace:
ebp f0109e58 eip f0100a62 args 00000001 f0109e80 f0109e98 f0100ed2
00000031
ebp f0109ed8 eip f01000d6 args 00000000 00000000 f0100058 f0109f28
00000061
...
The first line printed reflects the currently executing function, namely mon_backtrace
itself, the second line reflects the function that called mon_backtrace, the third line
reflects the function that called that one, and so on. You should print all the outstanding
stack frames, not just a specific number for example. By studying kern/entry.S you'll
find that there is an easy way to tell when to stop.
Within each line, the ebp value indicates the base pointer into the stack used by that
function: i.e., the position of the stack pointer just after the function was entered and the
function prologue code set up the base pointer. The listed eip value is the function's
return instruction pointer: the instruction address to which control will return when the
function returns. The return instruction pointer typically points to the instruction after the
call instruction (why?). Finally, the five hex values listed after args are the first five
arguments to the function in question, which would have been pushed on the stack just
before the function was called. If the function was called with fewer than five arguments,
of course, then not all five of these values will be useful. (Why can't the backtrace code
detect how many arguments there actually are? How could this limitation be fixed?)
Exercise 12. Implement the backtrace function as specified
above. Use the same format as in the example, since
otherwise the grading script will be confused. When you
think you have it working right, run gmake grade to see if
its output conforms to what our grading script expects, and
fix it if it doesn't. After you have handed in your Lab 1 code,
you are welcome to change the output format of the backtrace
function any way you like.
Challenge! Modify the JOS boot loader to load the symbol
table from the kernel's ELF binary in addition to the text and
data sections, and then modify your stack backtrace function
to look up and display the name of each function called in the
backtrace in addition to the return eip. You may find this
enhancement particularly useful for debugging in future labs.
This completes the lab. When you are ready to hand in your lab, submit it electronically
by following the procedure outlined by the instructors.