1
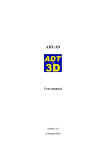
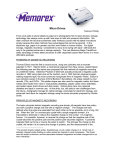
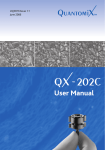
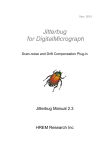
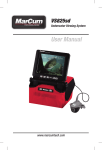
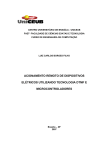
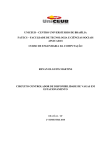
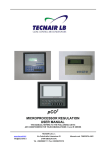
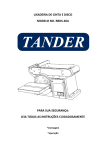
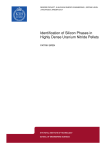
EDAX FOCUS Inside This Issue Page 2 EDAX Introduces the New Orbis Micro-XRF Spectrometer Page 3 System Automation Making the Genesis System Work for You Page 4 EDAX Introduces the New Orbis Micro-XRF Spectrometer Building on more than 10 years of Micro-XRF experience, the Orbis spectrometer yields a system with excellent Micro-XRF capability while setting a new standard in analytical flexibility. The Orbis incorporates a unique motorized turret integrating video and X-ray optics allowing coaxial sample view and X-ray analysis. Primary beam filters can be used with a variety of X-ray optics to allow true XRF analytical capabilities in a micro-spot analysis. The working distance is increased to allow analysis over a rougher sample topography without sacrificing signal intensity. Two additional X-ray collimators can be added to the optical turret for a total of three X-ray beam sizes to expand the Orbis analytical capabilities beyond traditional Micro-XRF analysis. Resolving EDS Overlaps Using WDS • Non-destructive measurement • Minimal sample preparation (e.g. no sample Page 6 coating is necessary) Training and Events • Improved sensitivity for many elements in comparison to SEM/EDS • Inclusion and coating thickness analysis with Page 7 Employee Spotlight Page 8 Customer News Vol.6 No.3 All this analytical flexibility is packaged into a table-top unit with powerful, easy-to-use analysis software. Orbis users can make elemental analyses on small samples such as particles, fragments and inclusions, or automated multi-point and elemental imaging analysis on larger samples with all the benefits and simplicity of an XRF analyzer. Benefits include: Ca-P-Si elemental map of fossilized bone using a RedGreen-Blue mixer to create overlay. Micro-XRF scan of the Co concentration depleted zone on the exterior surface of sintered polycrystalline diamond compact. the penetrating power of X-rays • Analysis of wet samples The Orbis can provide solutions in a wide variety of analytical applications including: Criminal Forensics (fragments, GSR, inks/ pigments, trace evidence); Industrial Forensics and Quality Control (wear metal debris; contaminant/corrosion analysis; materials verification; elemental distributions and imaging; pharmaceutical tablets and packaging); Non-Destructive Testing (Museum artifacts; paper documentation and currencies; gemstones; authentication); Materials (metal, glass, ceramics, cement/ concrete, catalysts); Electronics (RoHS; layer thickness and composition; solder joints); Geology; Process Control and more. XRF NEWS Orbis Configuration EDAX Introduces the New Orbis Micro-XRF Spectrometer (Cont'd. from Pg. 1) Orbis • 300 µm or 100 µm mono-capillary • Dual CCD video: 10x and 100x • Standard precision XYZ motorized stage Orbis PC: • 30 µm poly-capillary • Dual CCD video: 10x and 75x (with 3x digital zoom) • High precision XYZ motorized stage • Large vacuum sample chamber with longer working distance Features The Orbis Micro-XRF system offers a set of features which provide excellent analytical versatility. • Co-axial X-ray optic and sample view for accurate sample positioning and X-ray analysis • 8 position primary beam filter system Industry-leading 6 filters selectable by software, open position plus beam shutter Filters can be used with micro spot X-ray optics for flexible Micro-XRF analysis Analyze over rougher sample topography while maintaining constant distance to the detector with no sacrifice of signal intensity • 1 mm and 2 mm collimators available with X-ray optic (option) Automated primary beam filter system is standard on all Orbis instrument configurations. Accommodates samples up to 270 mm (W) x 270 mm (D) x 100 mm (H) Industry-first motorized turret design integrates video, X-ray optic, 1 mm and 2 mm collimators for optimal analytical flexibility (three X-ray beam sizes selectable by software) Allows filtered high sensitivity bulk analysis or fast mapping along with Micro-XRF analysis • Analytical Software Qualitative and quantitative analysis (with or without standards) Automated Multi-point analysis Elemental imaging and linear scans Alloy identification Layer thickness and composition A B Improved sensitivity Removal of spectral artifacts • Large signal collection area detectors: C Best resolution 80 mm2 Si(Li) detector available standard on Orbis and Orbis PC Large area SDD (option) - High processed countrate with excellent resolution LN2 free • Low and high magnification CCD video sample viewing EDAX FOCUS - Page 2 Spectral map data set generated by Micro-XRF showing (A) Video, (B) X-ray count map and (C) Elemental overlay. Copyright© 2008 All rights reserved EDAX Inc. 2008 TIPS & Tricks System Automation - Making the Genesis System Work for You Collecting a series of spectra from one set of samples? Use the “Save in Sequence” function from the File drop down menu in the Spectrum tab and designate a starting Filename. Each time you collect a new spectrum, click the Save in Sequence icon on the tool bar and that spectrum will automatically be saved as the next number in the sequence. Make use of the new Auto Amplifier time function and allow the system processor to optimize itself for the active kV and beam current conditons. Select “Auto” in the toolbar Amp Time drop down list and the software will automatically select the closest amp time that yields about 30% dead time for the active count rate. Looking to batch quantify a series of spectra? Simply collect and save all of your spectra, then click on the Auto drop down menu in the Spectrum tab and select Process Spectra. Choose your spectra, add them to the list and give an output filename. Next, click Process to start the routine. When completed, you can open the generated report in Excel and see the spreadsheet of all of your quantitative data for all spectra. Example output: Wt % Samples Lsec NK OK SiK SiO2.spc 100 0.96 49.17 49.88 Sioxyn.spc 100 27.13 19.44 53.42 Take advantage of the Multipoint routine within the Mapping tab. You can designate your areas of interest for spectrum collection as a spot, reduced raster or a free hand draw. Next, enter a collection time and an output filename and let the system work while you take a break. When the collection is complete, just click open to review the data that you spent no time collecting! Have you tried using the Multifield collection capability yet? On systems with Stage Control, go to the Multifield area and easily designate multiple stage collection fields. Fields can be individual locations, multiple fields along a line or a matrix of fields covering both the x and y direction. Just find each location of interest and click on “Add” for each field you want to analyze. This is particularly useful for large mapping areas and particle analysis. EDAX FOCUS - Page 3 Want to turn all of your spectrum files into image files all at once? Use Spectral Utilities to batch convert .spc files to .bmp, .jpg or .png. Just select a folder containing the spectra, highlight the spectra then click SPC >> BMP (JPEG or PNG are selected in the setup area). Take advantage of the Help options directly available on your system The Help Contents area is a standard MS Windows format which allows for easy searching by Keyword, by a Table of Contents or by an Index. You can even bookmark pages and topics that you might want to go back to for future reference. The entire Genesis User Manual is located within the Help menu of the system and can be launched right from Genesis. Search for your topic within the Table of Contents, or flip through the pages for a good refresher on functions and capabilities that you may have forgotten about. Does everyone in your lab want to learn how to use your EDAX system? The User Manual is in PDF format and can be copied from your system PC to any other desktop or laptop PCs, allowing anyone to access it anywhere, anytime without tying up the system. Detailed information about the New Features that are included in your latest version of software can be found by going to the Help menu, then selecting “New Features”. This document contains descriptions of the features as well as detailed instructions on how to use them. Are you unfamiliar with some of those unusual looking icons? Simply activate Tooltips in the Help menu – when you pass your cursor over an icon, a description of that icon will appear. Click around the software – most functions have logical names on the drop down menus from the file bar. Try learning a new capability or two just by exploring what the software has to offer! If you do find that you need further help or support, go to our website at www.edax.com/service/service.cfm to check out our new on-line support capabilities. Copyright© 2008 All rights reserved EDAX Inc. 2008 WDS NEWS Resolving EDS Overlaps Using WDS EDX is a fast and easy way to get information on samples requiring microanalysis on a SEM or Dualbeam. One limitation to EDX is peak overlaps, where two X-ray lines from different elements have peaks at the same energy, and can not be reliably distinguished using EDX. One example is the tungsten Mα and silicon Kα overlap seen in semiconductor samples, which will be examined in this article. Other examples include PbSMo and BaTi in minerals, HfTaSi in nickel based alloys, CrMn in steels, and InCd in solar panels. WDX, in comparison, has better resolution compared to EDX, and is able to resolve most EDX overlaps. In this case, only WDX can resolve W from Si. In Figure 2, data was acquired at 5kV in the raster region. Typically, peak intensities are measured from a region of interest (ROI) around the peak centroid, but the ROIs for tungsten Mα and silicon Kα are too similar to resolve one from the other. Using WDX, the peaks for Si and W are fully resolved and can be accurately measured. The EDAX Trident and Neptune, combined EDX and WDX systems, are very useful for analyzing such samples. Data was acquired using an EDAX Apollo 40 high-solid angle SDD, and an EDAX TEXS Parallel Beam (PBS) WDX Spectrometer. PBS systems are compact compared to curved crystal systems and will fit on almost any SEM or Dualbeam. The system is designed to act like an EDX system, making it easier for new WDX users to operate. Figure 1: Top window is WDS showing a fully resolved silicon peak and two resolved tungsten peaks as compared to the lower EDS spectrum in which the lines are not fully resolved. EDAX FOCUS - Page 4 Figure 2: Screenshot of EDAX GUI interface with image showing analysis region in upper left corner. WDS Spectrum is shown in upper right and EDS with WDS overlayed on bottom. An important issue to consider is increasing beam spread with kV. In semiconductor samples, a low kV is required to keep the beam within the analysis area. Figure 5 shows a comparison of 5kV vs.10kV. Figure 3: Left image shows SEM cross section and right image shows WDS map resolving tungsten regions. Copyright© 2008 All rights reserved EDAX Inc. 2008 WDS NEWS Resolving EDS Overlaps Using WDS (Cont'd. from Pg. 4) At 5kV the beam is within 1000Å, while at 10kV the beam spread increases tenfold. For this reason, 5kV was used for this analysis. With EDX mapping, silicon and tungsten M lines cannot be resolved and both maps will look very much the same. Using WDX, tungsten Mα and silicon can be resolved at 5kV, and W maps will clearly show where tungsten is located in the sample. When collecting map data, WDX can be used for overlapped lines such as tungsten Mα, while most other lines can be mapped successfully using EDX. In Figure 4, only tungsten Mα was mapped by WDX, all other elements were mapped using EDX. Al K OK Si K WM WDX, in addition to resolving overlaps, has a better peak-to-background ratio, and Figure 4: Overlay of WDS data along with EDS data of Al K, O K, and Si K. therefore better detection limits compared to EDX. For quantitative applications, WDX can be used for trace elements and lines that are overlapped, while EDX can be used for the major elements. This improves the accuracy of trace analysis, without requiring long acquisition times for full sample characterization. EDAX would like to thank Doug Hamilton of Xilinx, San Jose for providing the samples and allowing EDAX to share their data. Figure 5: An example of a simulation of beam spread on a 1000 Å tungsten film on a silicon substrate. EDAX FOCUS - Page 5 Copyright© 2008 All rights reserved EDAX Inc. 2008 TRAINING AND EVENTS October 6-9 October 14-17 October 16-17 World-Wide Events MS&T (The Materials Science & Technology Expo.) (Formerly called ASM) Pittsburgh, PA AReMS (Appalachian Regional Microscopy Society) Boone, NC NWAFS Meeting (Northwest Association of Forensic Scientists) Boise, ID 15th ENFSI EWG Firearms/GSR Meeting November 2-7 APMC9 (9th Asia Pacific Microscopy Conference) December 2-4 MRS (Materials Research Society) November 5-6 Dubrovnik, Croatia Jeju, Korea Boston, MA ***Please see our website, www.edax.com for a complete list of our tradeshows World-Wide Training To help our present and potential customers obtain the most from their equipment and to increase their expertise in EDS microanalysis, WDS microanalysis, EBSD/OIM and Micro-XRF, we organize a number of Operator Courses at the EDAX facilities in North America; Tilburg, NL; Wiesbaden, Germany; and Japan. Europe Tilburg = (T) (in English) Wiesbaden = (W) (in German unless stated otherwise): Microanalysis Courses: 3-4 Day November 3-6 Japan Microanalysis Courses: October 1-3 November 5-7 Tokyo Osaka November 24-26 (W) 2 Day October 30-31 (T) LEX Course: October 7-9 (T) Pegasus Course: October 20-24 (W) EDAX FOCUS - Page 6 For more information on our training classes, please visit our website at: www.edax.com/service/ user.cfm Copyright© 2008 All rights reserved EDAX Inc. North America Microanalysis Courses: October 27-31 December 1-5 Mahwah, NJ Mahwah, NJ November 11-13 Mahwah, NJ Particle Course: WDS Course: Mahwah, NJ November 18-20 Academy Course: EBSD OIM October 14-16 Draper, UT Micro-XRF Course: Mahwah, NJ October 7-9 2008 EMPLOYEE SPOTLIGHT Dr. Joe Nicolosi is Director of Technology responsible for Research and Hardware Engineering at EDAX’s corporate office in Mahwah, New Jersey. Joe also looks after Technical Support and hardware interface requirements of EMM’s. Joe holds graduate degrees from both Polytechnic Institute of NY in Crystallography and X-ray Physics and a B.S. in Physics from New York Institute of Technology. Joe began his career in 1972 with Philips Research Labs, developing new techniques and instrumentation for X-ray diffraction and spectroscopy and later moved to the operating division of Philips Electronics Instruments to develop commercial instrumentation. In 1998, when the EDAX division of Philips moved to Mahwah, NJ, Joe took on the role of detector development for EDS Systems. In his current position Joe works with product management, scientists and engineers in formulating and realizing new capabilities in products for materials and micro analysis. Joe and his wife Wendy have been married for 25 years and have three adult children Brooke, Joe, and Emily (a senior at University of Vermont). Fond memories remain for Cub Scout and Church Youth Group leadership as well as competitive J/24 sailboat racing. These days Joe and Wendy enjoy sailing the New England coast from New York to Maine. Their favorite stops include Block Island, Cuttyhunk, Martha’s Vineyard, and Nantucket Islands. When not shoveling snow in the winter, Joe and Wendy enjoy skiing in the Berkshires and Vermont. EDAX FOCUS - Page 7 Andreas Makat is the Sales Manager for the EDAX Wiesbaden, Germany office. Andreas was born and raised in Berlin, Germany. He studied Mineralogy at the Free University and continued his education at the Technical University of Berlin. In 1987 he received his Mineralogist certification. After receiving his certification, Andreas relocated to the city of Wiesbaden where he became a sales engineer for Vacuum Generators (VG), a UK based company. For 7 years he was responsible for the sales of XPS and Auger Spectrometers of VG Scientific in Germany, Austria, Switzerland, and Scandinavia. In 1994, Andreas joined Röntgenanalytik Messtechnik GmbH where he was responsible for the sales of EDAX spectrometers in Germany. Andreas was key to the growth of the EDAX business in Germany. As business grew, the organization grew with it and in 1998, Andreas received full responsibility for the EDAX business and was promoted to Sales Manager for EDAX products. In 2002 EDAX became a business unit within the AMETEK organization. Today, the EDAX office in Wiesbaden has grown to include sales, service, and support of the EDAX products in Germany, Austria and Switzerland. Andreas resides with his wife and daughter Tabea near the city of Braunfels, which is close to the city of Wetzlar. In his spare time, Andreas enjoys gardening, volleyball and motor biking and spending time with his family. Copyright© 2008 All rights reserved EDAX Inc. 2008 CUSTOMER NEWS The University of North Texas The University of North Texas Center for Advanced Research and Technology (CART) is located in Denton, Texas, approximately 30 miles north of Dallas. The CART facility enables research projects from all University departments and disciplines including Materials Science and Engineering, Mechanical and Energy Engineering, Physics, Chemistry, and Biology. The CART center supports UNT students, researchers, and faculty from the departments listed above, as well as outside University, government laboratory, and industrial scientists. The facility currently has five EDAX systems in their collection of analytical tools. These include an FEI Tecnai 200 KV STEM with integrated EDAX EDS, FEI Nova 200 FIB/SEM with an EDAX Pegasus system, FEI Quanta 200 Environmental SEM with a Pegasus system, Phillips EM 420 TEM with an XM2 EDS system, and a Jeol 5800 with an XM2 EDS/Imaging system. An Apollo 40 SDD and 3D EBSD software were recently added to the Dual Beam to elevate the capabilities of their existing Pegasus system. Brian Gorman, a senior researcher within CART, is very excited to begin experiments with the 3D software and collaborate with EDAX. He plans to utilize the 3D capability to investigate grain boundary orientations in polycrystalline solar cells and compositional microstructures of aerospace materials. The University is most impressed with the phase ID capabilities the Pegasus system provides. “The ability to collect EDS and EBSD data simultaneously is a powerful tool and is very helpful in distinguishing subtle differences in our samples” notes Brian. He is also pleased to have the high throughput of EDS counts the Apollo 40 will provide. This capability shortens 4-D spectral image acquisition times, allowing for more users to take advantage of the technology. Brian also states that the dual beam is the most heavily used instrument in the facility. It is presently use for TEM and Atom Probe specimen prep, and 3D serial sectioning. Brian is very interested in acquiring a LEXS WDS system to enhance the ability to collect light element data at low KV conditions. Brian is very pleased with the EDAX systems and would recommend EDAX for any lab conducting high tech research. He is most impressed with the breadth of knowledge that the EDAX EBSD applications and developers possess, and enjoys developing techniques with them in conjunction with his research. Art & Layout: Christine Meehan EDAX Inc. EDAX FOCUS - Page 8 Contributing Writers: Andreas Makat Dr. Joe Nicolosi Tara Nylese Jack Rosek Dr. Bruce Scruggs Craig Theberge Copyright 2008 EDAX Inc. No part of this publication may be reproduced, stored in a retrieval system, or transmitted in any form or by any means without prior written permission of EDAX Inc. 91 McKee Drive Mahwah, NJ 07430 Phone: (201) 529-4880 E-mail: [email protected] Copyright© 2008 All rights reserved EDAX Inc. www.edax.com 2008