1
PSZ
I9:16 (Pind.
l/l3l
UNIVERSITI TEKNOLOGI MALAYSIA
DECTARATION OF THESIS / UNDERGRADUATE PROJECT PAPER
Author's full nome
NURUT ANRAH BINTI MUSTAFFA
Dote of birth
09 FEBRUARY 1?92
Title
CoNTTNUOUS GTUCOSE MONITORING (CGM) USING
tAB ON CHIP (tOC)
Acodemic
Session
20141201s
declore thot this thesis is clossified os
E
iI
Y
:
CONFIDENTIAT
(Contoining confidentiol informotion under the Officiol Secrel
Act 19721*
RESTRICTED
(Conioining restricted informoiion os specified by the
orgonisotion where the reseorch wos done)*
OPEN
ACCESS
logree thot my thesis be published ond occessed online
(full
text)
I
locknowledge thot UniversitiTeknologiMoloysio reseryes the right os follows:
1.
2.
The thesis is the property of UniversitiTeknologi Moloysio.
The Librory of UniversitiTeknologiMoloysio hos the right to moke copies for ocodemic
purposes.
SIGNATURE
924209-1 l-5530
(NEW rC NO. /PASSPORT NO")
Dote :
NOTES
:
as lob l>olY
*
DR. SUHANA BINTIMOHAMED SULTAN
NAME OF SUPERVISOR
Dote : t"q laG l>ots
lf the thesis is CONFIDENTAL or RESTRICTED, pleose
ottoch the letter from
the orgonisotion concerned stoling the reoson/s ond durotion for the
confidentiolity or restriction.
“I hereby declare that I have read this final year project report and in my opinion this
final year project report is sufficient in terms of scope and quality for the purpose of
awarding the degree of Bachelor of Electrical Engineering (Electric-Electronic) ”
Signature
Name
Date
:
:
:
DR. SUHANA BINTI MOHAMED SULTAN
June 24, 2015
CONTINUOUS GLUCOSE MONITORING (CGM) USING LAB ON CHIP (LOC)
NURUL ATIRAH BINTI MUSTAFFA
A final year project report submitted in fulfilment of the
requirements for the award of the degree of
Bachelor of Electrical Engineering (Electric-Electronic)
Faculty of Electrical Engineering
Universiti Teknologi Malaysia
JUNE 2015
ii
I declare that this final year project report entitled “CONTINUOUS GLUCOSE
MONITORING (CGM) USING LAB ON CHIP (LOC)” is the result of my own research
except as cited in the references. The final year project report has not been accepted
for any degree and is not concurrently submitted in candidature of any other degree.
Signature
Name
Date
:
:
:
NURUL ATIRAH BINTI MUSTAFFA
June 24, 2015
iii
Special thanks to
My beloved parents and family that always keep their prayers for me
My supervisor that guide me through hardship
My friends who always assists and give me moral support
And also to
Everyone that help me through this research
iv
ACKNOWLEDGEMENT
Greatest thanks and grateful to Allah s.w.t with all His majesty, that give me an
opportunities to complete this thesis and gift me a good health that makes me able to
think and solve problem. Alhamdulillah.
A special thanks to my family especially my parents Mustaffa bin Hamzah and
Fauziah binti Wahid that always give motivation and keep their prayers to me. Without
their motivation and prayers it would be hard for me to complete this project.
I would also express my deepest gratitude towards my supervisor, Dr. Suhana
binti Mohamed Sultan for her care and supervision that provide me guidance
throughout the entire research process. She also always check my mistake and help
me to improve myself for the future challenge.
In addition, I want to express my sincere appreciation to Dr Fauzan Khairi that
help me to generate ideas and solve the problem regarding this project. Besides that, I
want to express my thankfulness to Sherrin and Aldi Michi for their kindness that help
me during this project
Last but not least, I deliver my sincere gratitude to my friends that had give me
their support either physically or mentally and also to everyone that involved in this
project.
v
ABSTRACT
Glucose is an important parameter that has to be considered before undergoing
any surgery. Variation of glucose level in body will affect the decisions during surgery.
Utilizing lab on chip (LOC), glucose measurement can be taken continuously during
operation time, in order to give any sign if a problem occurs. LOC with channel of
two inlets and one outlet can be implemented using polydimethyl siloxane (PDMS)
that is designed using Solidworks program. A screen printed electrode (SPE) is placed
in the middle of the channel inside the LOC to measure the amperometric reaction
using Emstat between glucose and glucose oxidase that is pumped in through both
inlets. Glucose buffer solution and glucose oxidase is prepared using combination
of phosphate buffer saline (PBS) and deionized water. The system performance is
measured using PSTrace program. The result shows that, the current detected by the
SPE is proportional to the concentration of glucose.
vi
ABSTRAK
Glukosa adalah parameter penting yang perlu dipertimbangkan sebelum
menjalani sebarang pembedahan. Perubahan paras glukosa dalam badan akan memberi
kesan kepada keputusan semasa pembedahan . Menggunakan makmal pada cip (LOC),
pengukuran glukosa boleh diambil secara berterusan sepanjang waktu pembedahan,
untuk memberi sebarang tanda jika terdapat masalah. LOC dengan dua saluran masuk
dan satu salur keluar boleh dilaksanakan menggunakan polydimethyl siloksan (PDMS)
yang direka menggunakan program Solidworks. Elektrod bercetak skrin (SPE)
diletakkan di tengah-tengah saluran dalam LOC untuk mengukur reaksi amperometric
menggunakan Emstat antara glukosa dan glukosa oksidase yang disuntik melalui
kedua-dua salur masuk. Cairan penampan glukosa dan glukosa oksidase disediakan
menggunakan kombinasi garam fosfat penampan (PBS) dan air ternyahion. Prestasi
sistem diukur menggunakan program PSTrace. Hasil menunjukkan, arus yang dikesan
oleh SPE adalah berkadar terus dengan kepekatan glukosa.
vii
TABLE OF CONTENTS
CHAPTER
TITLE
DECLARATION
DEDICATION
ACKNOWLEDGEMENT
ABSTRACT
ABSTRAK
TABLE OF CONTENTS
LIST OF TABLES
LIST OF FIGURES
LIST OF ABBREVIATIONS
LIST OF SYMBOLS
PAGE
ii
iii
iv
v
vi
vii
ix
x
xi
xii
1
INTRODUCTION
1.1
Introduction
1.2
Problem Statement
1.3
Objectives
1.4
Research Scope
1.5
Thesis Outline
1
1
2
2
2
3
2
LITERATURE REVIEW
2.1
Continuous Glucose Monitoring
2.2
Glucose Detection
2.2.1
Screen Printed Electrode
2.2.2
Glucose Sensor Based on Functional
Polymers
2.3
Lab on A Chip
2.3.1
Methods of Moving Fluids inside Microfluidic Devices
2.3.2
Pattern of Microfluidic Devices
4
4
4
5
5
6
6
7
viii
2.3.3
2.4
Fabrication Process of Microfluidic Device
Conclusion
7
8
3
RESEARCH METHODOLOGY
3.1
Project Work Flow
3.2
Block Diagram
3.2.1
Process Flow Chart
3.3
Hardware Implementation
3.3.1
Peristaltic Pump
3.3.2
Motor Driver
3.3.3
Screen Printed Electrode (SPE)
3.3.4
Potentiostat
3.4
Experiment Flow
3.4.1
Fabrication of Lab on Chip (LOC)
3.4.2
Preparation of Solution
3.4.3
Arduino Programming
3.4.4
Emstat And PSTrace Program
3.5
Project Management
3.5.1
Gantt Chart
3.5.2
Cost Estimation
3.6
Conclusion
9
9
10
11
12
13
14
15
15
16
16
18
19
20
22
23
25
26
4
RESULTS AND DISCUSSION
4.1
Lab on Chip (LOC)
4.2
CGM System
4.3
Data Analysis
4.3.1
Cyclic Voltametry (CV) Technique
4.3.2
Amperometric Detection Technique
4.4
Conclusion
27
27
28
29
29
31
32
5
CONCLUSION AND RECOMMENDATION
5.1
Conclusion
5.2
Limitation
5.3
Recommendation
33
33
34
34
REFERENCES
Appendices A – B
35
37 – 56
ix
LIST OF TABLES
TABLE NO.
3.1
3.2
3.3
3.4
3.5
3.6
3.7
3.8
4.1
TITLE
Specification of peristaltic pump
Specification and limitation of motor driver
Gantt chart FYP1
Gantt chart FYP2
Cost estimation for lab on chip fabrication
Cost estimation for solution preparation
Cost estimation for hardware implementation
Cost estimation for CGM system
Result of glucose concentration samples and current reading
PAGE
13
14
23
24
25
25
26
26
32
x
LIST OF FIGURES
FIGURE NO.
2.1
2.2
2.3
2.4
3.1
3.2
3.3
3.4
3.5
3.6
3.7
3.8
3.9
3.10
3.11
3.12
3.13
4.1
4.2
4.3
4.4
TITLE
Screen Printed Electrode
Glucose sensor based on functional polymer
Model based design of microfluidic biochip
PDMS casting
Block diagram of CGM process
Process flow chart for the CGM System
Hardware implementation to run the peristaltic Pumps
Peristaltic pump
Motor driver
Screen printed electrode
Potentiostat
Solidworks design of lab on chip (LOC)
Fabrication process of LOC
Flowchart of programming in Arduino software
Implementation of Emstat and PSTrace program
PSTrace program using cyclic voltametry measurement
technique
PSTrace program using amperometric detection measurement
technique
Lab on chip
Hardware implementation of CGM system
Cyclic voltametry graph of various concentration of glucose
solution
Amperometric detection of various glucose concentration
graph
PAGE
5
6
7
8
10
11
12
13
14
15
16
16
18
20
21
21
22
28
29
30
31
xi
LIST OF ABBREVIATIONS
CGM
-
Continuous Glucose Monitoring
LOC
-
Lab On Chip
SPE
-
Screen Printed Electrode
PDMS
-
Polydimethyl Siloxane
PBS
-
Phosphate Buffer Solution
3D
-
3 Dimensional
GOD
-
Glucose Oxidase
MPC
-
Methacryloyloxyethyl Phosphorylcholine
Ag
-
Silver
AgCl
-
Silver Chloride
Pt
-
Platinum
MEMS
-
Micromechanical System
WE
-
Working Electrode
CE
-
Counter Electrode
RE
-
Reference Electrode
DC
-
Direct Current
USB
-
Universal Serial Bus
FYP1
-
Final Year Project 1
FYP2
-
Final Year Project 2
mg
-
Miligram
dl
-
Deci liter
xii
LIST OF SYMBOLS
µ
-
micro
xiii
LIST OF APPENDICES
APPENDIX
A
B
TITLE
Coding
Data Sheet
PAGE
37
40
CHAPTER 1
INTRODUCTION
This chapter gives the explanation about the project background, problem
statement, objectives, as well as project scope.
1.1
Introduction
Glucose is an important aspect in human body where, its level in the blood is
controlled by the secretion of insulin in the negative feedback system. For a diabetic
patient, the blood glucose concentrations usually fall outside the normal range of
70-180mg/dl. This happened because their body does not secrete insulin or maybe
there is derangement in both insulin secretion and action [1]. Usually, in surgical
procedures, before a patient undergo any surgery, glucose measurement must be taken
several times per day in the perioperative environment [2]. The measurement must
be taken a week before the operation so that the insulin regimen can be adjusted
according to the condition of the patient [3]. This is an important aspect that has to
be considered especially in diabetic patient because they face more challenges during
surgery compare to the non-diabetic patients. Many of the challenges occur due to
inabilities to maintain a balance between insulin and its counter regulatory hormones
[4].
Nowadays, several sensors have been developed in order to measure the
glucose concentration, continuously in the human body. With the continuous glucose
monitoring (CGM), the glucose concentration in the human body can be measured
continuously for a long period of time [5]. Compare to the intermittent measurement,
such as finger prick [6], CGM provides more information about the glucose level, such
as frequency, magnitude, direction, duration, and cause of fluctuation in glucose level
[7]. This information is useful if applied during the surgery because it can continuously
2
measure the glucose level of patients and give a sign if there are any problems that
happened during the surgery.
1.2
Problem Statement
Based on the application in the operation room, the intermittent measurement
that has been applied to measure the glucose level is very inconvenient [8] because
the measurement must be taken several times in order to get the pattern of the glucose
level in the patient’s blood [4]. The measurement is taken only before the surgery and
it is not being monitored during the operation [9]. This may provide risk to the patient
as there is no indication in fluctuation of glucose level during the operation.
1.3
Objectives
This project aims to:
i. Design a system that can measure the glucose level continuously
ii. To fabricate lab on chip using PDMS materials
iii. Measure the system performance by using PSTrace program
1.4
Research Scope
In order to achieve the objectives stated in 1.3 , several scopes have been
outlined. The scope includes Solidworks 2013, as a platform to design 3D image
that will be used to make mold of lab on a chip. While, Polydimethylsiloxane (PDMS)
will be used as material to fabricate the lab on a chip. Moreover, the screen printed
electrode (SPE) will be used as a detector and the glucose level will be measured using
the Emstat. Lastly, the PSTrace program will be used to analyze the performance of
the CGM system.
3
1.5
Thesis Outline
This thesis consists of six chapters that include the introduction, literature
review, research methodology, result and discussion, project management, conclusion
as well as future works.
The first chapter gives the brief explanation about the project background as
well as the problem statement that are related to the project. Based on the problem
statement, several objectives have been introduced that aim to solve the problem issues
with the guideline from the research scope.
In second chapter, discussion about literature review will take place that give an
overview about previous project that are related with the CGM system or lab on chip
fabrication. This chapter help to give a clear picture about the working principles of
CGM system, types of sensor that are usually used in CGM system, methods of moving
fluids inside microfluidic devices, and pattern of microfluidic device that usually use
in designing lab on chip.
In third chapter, a brief explanation about project work flow, block diagram,
software implementation in designing mold of lab on chip, steps fabrication of lab on
chip using PDMS materials, and hardware implementation for CGM system.
The fourth chapter deals with the functionality of the system that analyze
the result obtained based on the hardware and software implementation as well as
the reaction from different concentration of glucose and glucose oxidase inside the
channel of lab on chip that detected by SPE. The result based on cyclic voltametry and
amperometric detection graph also included in this chapter.
The fifth chapter gives a brief explanation about the project management.
Where, in this chapter, project schedule and project costing has been included.
Lastly, chapter six gives conclusion about the result obtained and give a brief
explanation about the limitation and recommendation for future works.
CHAPTER 2
LITERATURE REVIEW
This chapter gives a brief review about the previous or similar projects of CGM
system. It provides a clear understanding about type of glucose sensors that is suitable
to be used in CGM system, methods of moving fluids inside microfluidic devices, and
pattern of microfluidic device that usually use in designing lab on a chip.
2.1
Continuous Glucose Monitoring
Continuous glucose monitoring (CGM) is a way to measure the glucose level
throughout a long period of time. CGM provides all information about the magnitude,
duration, direction and causes of fluctuation in the glucose level [7].
2.2
Glucose Detection
The glucose detection is based on an amperometric approach of enzymatic
oxidation between glucose and glucose oxidase (GOD) such as shown in Equation
2.1 [10]:
Glucose u O2 GOD
−−−→ Gluconolactane u H2 O2
5
H2 O2 −→ O2 u 2H + u 2e−
(2.1)
The enzyme was immobilized onto the surface of working electrode which react with
glucose to produce electric current [11].
2.2.1
Screen Printed Electrode
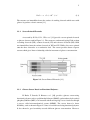
A research by H. Xu, G. Li, J.Wu et al. [12] provide a screen printed electrode
as glucose detector such in Figure 2.1 . The sensor use carbon and Ag/AgCl ink to form
a working electrode (WE), counter electrode (CE) and reference electrode (RE). GOD
was immobilized onto the carbon electrode of WE and CE. While, silver were printed
onto the three electrodes as a conductive lead. The sensor provides better response
current which gives linear relationship with the increment of glucose concentration.
Figure 2.1: Screen Printed Electrode [12]
2.2.2
Glucose Sensor Based on Functional Polymers
H. Kudo, T. Sawada, E. Kazawa et al. [10], provide a glucose sensor using
functional polymer such as polydimethylsiloxane (PDMS), and methacryloyloxyethyl
phosphorylcholine (MPC) as its material with Pt and Ag/AgCl as its electrodes through
a process called micromechanical system (MEMS). The sensor showed a better
flexibility, such as shown in Figure 2.2 since it was fabricated using functional polymer.
It also showed a good sensitivity towards different glucose concentration. However,
6
the performance decreases after rinsing the electrode with potassium ferricyanade as
electron mediator. The decrease is due to the loss of electrons during rinsing.
Figure 2.2: Glucose sensor based on functional polymer [10]
2.3
Lab on A Chip
Lab on chip is a microfluidic device that uses to integrate miniaturized
laboratory function such as separation and analysis of mixture components on a single
microprocessor chip using extremely small volume of fluids [13].
2.3.1
Methods of Moving Fluids inside Microfluidic Devices
The fluidic transport system is an important element that needs to be considered
in microfluidic devices. B. Weigl, R. Bardell, C. Cabrera [14], have proposed
several techniques for fluidic transport such as pressure driven flow, electroosmotic
flow, electrokinetic flow control, and electrokinetic mixing. Thus, it concludes
that electroosmotic flow provides very sensitive to the variations in both liquid
decomposition and channel wall coating. It requires limited use of generic pumping
solution while, pressure driven flow significantly less sensitive towards viscosity of
fluids.
7
2.3.2
Pattern of Microfluidic Devices
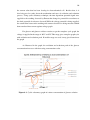
Y. Atalay, P. Verboven, S. Vermeir et al. in [15] provide model based design for
microfluidic biochip that uses to detect multiple analytes. The design such in Figure
2.3 consists of five inlets and one outlet. Where, in this case, inlet 1 is used to inject
a buffer solution, inlet 2 and 3 for sample volume, while, inlet 4 and 5 used to inject
enzyme. Therefore, it stated that, the design was used for fast quantification of multiple
components in the multiplexed microchannel reactor. Furthermore, since this model
is designed to detect multiple analytes, thus, it is quite complex and not necessarily
considered in detecting one sample of analytes such as glucose.
Figure 2.3: Model based design of microfluidic biochip [15]
2.3.3
Fabrication Process of Microfluidic Device
P. Abgrall, A. Gue, [16] show the fabrication of microfluidic device based
on the PDMS casting process. As shown in Figure 2.4, the process begins by
manufacturing the mould by bulk machining silicon frequently. Then, a mixture of
silicon rubber and cross linking agent is cast on top of the silicon layer. After cross
linking process, the elastomer is peeled off from the substrate. Then, access is created
frequently with a part holder. After that, the part is transferred into another piece of
PDMS. This technique gives property that makes the PDMS easy to close because it
places the open structure on a flat substrate and easy to be stripped as PDMS is an
elastomer. Furthermore, this technique is preferred to be done in a laboratory that did
not have advanced technology tools as it uses material such as PDMS.
8
Figure 2.4: PDMS casting [16]
2.4
Conclusion
Based on the research that has been made for this project, the CGM system in
this project will use screen printed electrode (SPE) as a detector because of its good
sensitivity towards different glucose level. Furthermore, since this project only focus
to detect and measure the glucose level, therefore, the pattern of lab on a chip will be
designed by having two inlets for injection of glucose and GOD enzyme, together with
one outlet to pump out the waste.
CHAPTER 3
RESEARCH METHODOLOGY
This chapter gives a brief explanation about project work flow, block diagram,
experimental flow that involves in fabrication process of lab on chip using PDMS
materials, preparation of glucose and glucose oxidase solution, as well as software
and hardware implementation in designing CGM system. Besides that, this chapter
also explain about the system specification.
3.1
Project Work Flow
This project is divided into three main stages which are designed lab on a chip
that is suitable to be used in a CGM system using Solidworks 2013, fabrication process
of lab on a chip using PDMS material, and lastly assembly of the hardware together
and analyze the data using PSTrace.
10
3.2
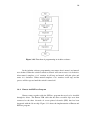
Block Diagram
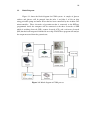
Figure 3.1 shows the block diagram for CGM system. A sample of glucose
oxidase and glucose will be pumped into the inlet 1 and inlet 2 of lab on chip
using peristaltic pump and motor driver that has been controlled by the Arduino Uno
microcontroller. Three electrodes of potentiostat that is connected to the PSTrace
programmed inside the computer will be connected to the three electrodes of SPE
which is working electrode (WE), counter electrode (CE), and a reference electrode
(RE) that has been integrated with the lab on a chip. The PSTrace program will analyze
the output measured from the potentiostat.
Figure 3.1: Block diagram of CGM process
11
3.2.1
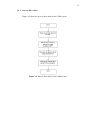
Process Flow Chart
Figure 3.2 shows the process flow chart for the CGM system.
Figure 3.2: Process flow chart for the CGM System
12
3.3
Hardware Implementation
This project requires two peristaltic pumps, one motor driver, Arduino Uno
microcontroller, a potentiostat and SPE as a detector for glucose. In order to control
the speed of peristaltic pump, Arduino Uno microcontroller as well as the motor
driver has been used. The Arduino Uno microcontroller board has been program
using Arduino software. The program are then transferred into the board using USB
cable. Additional 9V battery power supply has been used so that the Arduino Uno can
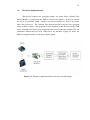
standalone without the need to be connected to any machine. Figure 3.3 shows the
hardware implementation to run the peristaltic pump.
Figure 3.3: Hardware implementation to run the peristaltic Pumps
13
3.3.1
Peristaltic Pump
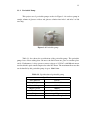
This project uses 2 peristaltic pumps such as in Figure 3.4 in order to pump in
sample volume of glucose oxidase and glucose solution into inlet 1 and inlet 2 of lab
on a chip.
Figure 3.4: Peristaltic pump
Table 3.1 also shows the specification of the peristaltic pump. The peristaltic
pumps have silicon tubing that can move the fluid from one place to another place
safely. Furthermore, it also operate at motor voltage of 12V DC with 300 mA motor
current which is quite small compared to other DC motor. The maximum flow rate that
can be handle by this peristaltic pump is up to 100mL/min.
Table 3.1: Specification of peristaltic pump
Specifications
Tube Material
Silicon
Working Temperature
00 C − 400 C
Motor Voltage
12V DC
Motor Current
300mA
Flow Rate
Up to 100mL/min
Weight
200g
Dimension
Diameter : 27mm, Length : 62mm
14
3.3.2
Motor Driver
This project requires one motor driver in order to control speed of the pump to
pump in the sample volume into lab on chip. The motor driver used is the shield type
that allows the motor driver to be stacked on top of Arduino Uno as in Figure 3.5.
Furthermore, the motor driver used are compatible with arduino Uno and can be used
to control two DC motor up to 2A for each channel. Since the peristaltic pump operate
at 300mA, therefore, by using 2A motor driver it can be used to drive the peristaltic
pumps.
Figure 3.5: Motor driver
Table 3.2shows the specification and limitation of the motor driver. The motor
driver can operate at maximum 2A current value and can be supplied with minimum
5V to 26V input power.
Table 3.2: Specification and limitation of motor driver
Parameter
Min Typical Max Unit
Power Input Voltage (Motor supply voltage)
5
-
26
V
IM AX (Maximum Continuous Motor Current)
-
-
2
A
IP EAK (Peak Motor Current)
-
-
2
A
V IOH (Logic Input-High Level)
3.3
-
5.5
V
V IOL (Logic Input-Low Level)
0
0
0.5
V
Maximum PWM Frequency
-
-
10
KHz
15
3.3.3
Screen Printed Electrode (SPE)
Screen printed electrode (SPE) such as in Figure 3.6 contain three electrodes
such as working electrode (WE), counter electrode (CE) and reference electrode (RE).
It is used as a detector to detect the presence of glucose through the reaction of glucose
and glucose oxidase inside Lab on a chip. In this project, screen printed electrode that
are made up of gold material for its working and counter electrode as well as silver
material for its reference electrode were used. This type of material were selected
since its has more stability towards glucose reaction.
Figure 3.6: Screen printed electrode
3.3.4
Potentiostat
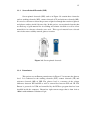
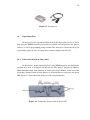
This project uses an Emstat potentiostat as in Figure 3.7 to measure the glucose
level. It is connected to the working electrode (WE), counter electrode (CE) and
reference electrode (RE) of SPE. The glucose level is a measure of the voltage
difference between WE and RE as well as current flow between WE and CE. The
Emstat is powered via USB and controlled by the PSTrace program that has been
installed inside the computer. Emstat has eight current ranges that is from 1nA to
100mA with minimun resolution of 1pA.
16
Figure 3.7: Potentiostat
3.4
Experiment Flow
In this project, the experimental flow include the fabrication process of lab on
chip using the PDMS material, preparation of solution for both glucose and glucose
oxidase, as well as programming using Arduino Uno software to control the the speed
of peristaltic pumps in order to pump in the solution samples into the LOC.
3.4.1
Fabrication of Lab on Chip (LOC)
In this process, before fabricating LOC using PDMS material, the Solidworks
program were used to design the mould of LOC. The mold is designed in 50mm x
20mm dimension with 1mm diameter of Y and spiral shape channel. At the end of the
spiral shape channel, 6mm circular diameter is designed that use to place the integrated
SPE. Figure 3.8 shows the mold design of LOC using Solidworks.
Figure 3.8: Solidworks design of lab on chip (LOC)
17
After Solidworks design, the mould has been cut using electronic cutter on a
sticker paper. Then, the sticker paper that has been cut was placed onto a petri dish
to be used as mould in order to develop channel. After that, the PDMS material that
consist of Silicon elastomer base and curing agent has been mixed in ratio of 10:1.
Basically, to fabricate a layer of PDMS that has 1.5mm thickness, only 10g of Silicon
elastomer base and 1g Silicon elastomer curing agent were needed.
The mixture were then stirred and poured onto the petri dish. The petri dish was
then placed inside the vacuum chamber for 30 minutes in order to suck out trapped air
bubbles. After 30 minutes, the petri dish is let to be dry in room temperature for one
day. Then, the dry PDMS was repealed from the petri dish using Isopropanol solution
and cut into dimension of 50mmx20mm using cutter. After that, inlets and outlet of
the mould were punched using puncher.
Then, the process was repeated two times in order to make the second and third
layer that is use to make interface with SPE. Figure 3.9 shows fabrication steps of
LOC.
18
Figure 3.9: Fabrication process of LOC
3.4.2
Preparation of Solution
Different concentration of glucose solution were prepared using the phosphate
buffer solution (PBS) and anhydrous glucose powder. The available high concentration
of 1.0M of phosphate buffer solution were diluted using deionized water to 0.1M
using ratio 1:10. Then, the glucose stock solution were prepared by mixing 700mg
of anhydrous glucose powder into 1L of 0.1M phosphate buffer solution which then
produce 1.0M glucose stock solution. Since in this project, the standard glucose level
in human body are being referred, therefore, samples of 4mmol, 5mmol, 6mmol and
8mmol glucose concentration were prepared. To prepare the more diluted glucose
concentration from 1.0M glucose stock solution, the 0.1M of phosphate buffer solution
were added into 1.0M glucose stock solution according to the Equation 3.1 below :
19
M1 V1 = M2 V2
(3.1)
Basically,M1 refers to molarity of glucose stock solution, V1 refers to the
volume of glucose stock concentration while, M2 refers to the desired dilute glucose
concentration and V2 refers to the volume of 0.1M phosphate buffer solution that is
need to be added in order to get the desired dilute molarity of glucose concentration.
Another sample which is glucose oxidase solution were prepared by mixing
5mg of the enzyme powder with 200uL, 0.1M phosphate buffer solution. Both of the
samples were kept in temperature below -100 C to ensure the stability of the solution.
3.4.3
Arduino Programming
In this project, two peristaltic pumps were used in order to pump in two
different samples inside lab on chip. Therefore, to control the speed of the peristaltic
pump, Arduino Uno microcontroller as well as motor driver were used. The motor
driver that been used is the shield type that can be placed on top of the Arduino Uno.
The Arduino software were used to program the Arduino Uno microcontroller thus to
drive the motor driver to control the speed of the peristaltic pumps. Figure 3.10 shows
the process flowchart of programming in arduino software.
20
Figure 3.10: Flowchart of programming in Arduino software
In the Arduino software programming, two motors that is motor1 and motor2
were defined. When the switch is turned on, motor1 will start to rotate 360o clockwise.
After motor1 complete a 360o rotation, it will stop and motor2 will take place and
rotate 360o clockwise. When, motor2 complete a 360o rotation, it will stop, and the
process will be repeated until the switch is turned off.
3.4.4
Emstat And PSTrace Program
Emstat comes together with the PSTrace program that need to be installed
through its driver. The Emstat USB cable that has three crocodile clips were then
connected to the three electrode of screen printed electrode (SPE) that has been
integrated with the lab on chip. Figure 3.11 shows the implementation of Emstat and
PSTrace program.
21
Figure 3.11: Implementation of Emstat and PSTrace program
When the samples of glucose oxidase and glucose solution were pumped into
lab on chip, the screen printed electrode will detect the rate of reaction between
the samples. Meanwhile Emstat will measure the reaction by cyclic voltametry and
amperometric detection techniques. The different measurement technique can be set
in the PSTrace program. The PSTrace program will produce cyclic voltametry and
amperometric graph based on the reaction between the samples.
Figure 3.12 shows the cyclic voltametry graph of one sample of glucose
concentration in PSTrace program.
Figure 3.12: PSTrace program using cyclic voltametry measurement technique
22
By using cyclic voltametry techniques, the voltage range has been set from
-0.5V until 0.5V with 100mV/s scan rate which give complete cycle graph.
Figure 3.13 shows amperometric detection graph based on one concentration
of glucose solution in PSTrace program.
Figure 3.13: PSTrace program using amperometric detection measurement technique
By using amperometric detection technique, the voltage bias is set to -0.2V
with 60 second running time.
3.5
Project Management
Project management is a project development that help to achieve the of the
objectives of the projects. Project management include the gantt chart for the project
planning and cost estimation for the whole system.
23
3.5.1
Gantt Chart
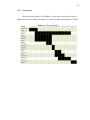
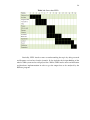
The Gantt chart in Table 3.3 and Table 3.4 shows the overview of the project
implementation during Final Year Project 1 (FYP1) and Final Year Project 2 (FYP2).
Table 3.3: Gantt chart FYP1
24
Table 3.4: Gantt chart FYP2
Basically, FYP1 involves more on understanding the topic by doing research
and literature review based on the journals. It also includes the design thinking of the
whole CGM system and overall project flow. While, FYP2 involve more on fabrication
and hardware implementation in order to get the output data to be analyzed by the
PSTrace program.
25
3.5.2
Cost Estimation
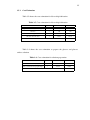
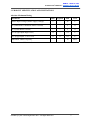
Table 3.5 shows the cost estimation for lab on chip fabrication.
Table 3.5: Cost estimation for lab on chip fabrication
LIST
QUANTITY
UNIT PRICE (RM)
AMOUNT(RM)
1.1 kg Silicon elastomer (base + curing agent)
1
120.96
120.96
Petri dish
3
2.50
7.50
Sticker paper
1
1.20
1.20
Silhouette electronic cutter
1
269.99
269.99
399.65
TOTAL
Table 3.6 shows the cost estimation to prepare the glucose and glucose
oxidase solution.
Table 3.6: Cost estimation for solution preparation
LIST
QUANTITY
UNIT PRICE (RM)
AMOUNT (RM)
D(+)- Glucose Anhyrdous
1
93.00
93.00
Glucose Oxidase From Aspergillus Niger
1
362.00
362.00
TOTAL
455.00
26
Table 3.7 shows the cost estimation for hardware implementation to run the
peristaltic pump and to detect the glucose level.
Table 3.7: Cost estimation for hardware implementation
LIST
QUANTITY
UNIT PRICE
AMOUNT (RM)
Arduino Uno Board
1
97.52
97.52
2A Shield Motor Driver
1
44.00
44.00
Screen Printed Electrode
1
90.00
90.00
Bottle
3
2.60
7.80
Peristaltic Pump
2
43.00
86.00
Silicon tube
1
10.18
10.18
TOTAL
335.50
Table 3.8 shows the cost estimation for the whole CGM system where, the
total cost for the CGM system is RM1190.15.
Table 3.8: Cost estimation for CGM system
3.6
PART
SUBTOTAL (RM)
Lab on chip
399.65
Solution preparation
455.00
Hardware Implementation
335.50
TOTAL
1190.15
Conclusion
In short, the continuous glucose monitoring (CGM) system focus on the
fabrication of lab on chip, Arduino programming, and glucose level measurement
techniques by using Emstat and PSTrace program that has been implemented in the
specific time schedule.
CHAPTER 4
RESULTS AND DISCUSSION
This chapter will discuss about the design and functionality of the project.
Therefore, it will give more explanation about the applications of the CGM system and
the suitability of the lab on chip design with the CGM system. This chapter also include
the result obtained from the reactions of different concentration of glucose solution
with the glucose oxidase solution in terms of cyclic voltametry and amperometric
detection graph.
4.1
Lab on Chip (LOC)
Using Solidworks 2013, a mould of LOC has been designed. The designed
LOC needs to have dimension of 50mm x 20mm with an inlet diameter of 2mm to
pump in sample volume of glucose and glucose oxidase. The fluid flow is in spiral
shape with 1mm diameter. An outlet with diameter 2mm also included in order to
pump out the waste.
The channel of LOC is designed in Y shape inlets that are made to pump in two
different samples and spiral shape channel to give more time for the different samples
to mix completely in order to get maximum output current. Although it might will be
time consuming, but in this project, time is not being a concern since the glucose level
needs to be measured continuously through a long period.
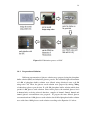
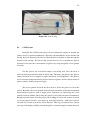
The end product of LOC is shown such as in Figure 4.1. The LOC has been
successfully fabricated that allows the two different samples of fluids to flow and mix
inside the channel without leakage.
28
Figure 4.1: Lab on chip
4.2
CGM System
Basically, this CGM system aims to be used during the surgery to monitor the
glucose level of a patient continuously. Therefore, the microfluidic device which is lab
on chip has been introduced in order to allow the blood of patient to flow through the
channel of lab on chip. The lab on chip also has been used as a medium for glucose
detection to measure the concentration of glucose by using integrated screen printed
electrode.
For this project, the real blood sample is not being used since the focus is
more on the design and fabrication of lab on chip. Therefore, the glucose and glucose
oxidase has been used as samples to replace the blood. As in Equation 2.1 the glucose
level is measured amperometrically by the reaction of glucose and its enzyme which is
glucose oxidase in the present of oxygen.
The screen printed electrode has been used to detect the glucose level in this
project. Basically, the screen printed electrode has been widely used in the intermittent
measurement of glucose such as finger prick. Therefore, by interfacing the screen
printed electrode with the lab on chip, the glucose level can be measured continuously
through a period of time. For this project, the working electrode and counter electrode
of screen printed electrode were made up from gold material , while the reference
electrode were made up from the silver material. This type of material were chosen
since it provide higher stability towards the glucose reaction compare to other material.
29
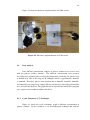
Figure 4.2 shows the hardware implementation of CGM system.
Figure 4.2: Hardware implementation of CGM system
4.3
Data Analysis
Four different concentration samples of glucose solution were used to react
with the glucose oxidase solution. The different concentration were prepared
according to the standard glucose level in the human body. Normally, the glucose level
in human body falls in the range of 70-180mg/dl which is approximately 4mmol/L
to 8mmol/L. Therefore, glucose concentration that is 4mmol/L, 5mmol/L, 6mmol/L,
and 8mmol/L were prepared as samples.The measurement of each of the concentration
were recorded and analyzed. The graph that has been produced in the PSTrace program
were exported and combined in Microsoft Excel.
4.3.1
Cyclic Voltametry (CV) Technique
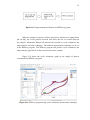
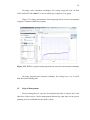
Figure 4.3 shows the cyclic voltametry graph of different concentration of
glucose solution. Cyclic voltametry is an electrochemical technique that measure
30
the current value that has been develop in electrochemical cell. Besides that, it is
also being used to study about the mechanism and rates of oxidation and reduction
process. Using cyclic voltamery technique, the time dependent potential signal were
supplied to the working electrode by Emstat that change its potential in accordance to
the fixed potential of reference electrode.While the voltage potential is being supplied,
the current flow between the working and counter electrode are being measured which
then translated into current against voltage graph.
For glucose and glucose oxidase reaction, to get the complete cycle graph, the
voltage is supplied in the range of -0.5V to 0.5V. This range gives complete graph cycle
with oxidation and reduction peak. If smaller range are used, it may give distortion to
the graph.
As illustrated in the graph, the oxidation and reduction peak of the glucose
concentration increases with increasing concentration value.
Figure 4.3: Cyclic voltametry graph of various concentration of glucose solution
31
4.3.2
Amperometric Detection Technique
Amperometry is the changing in electric current due to the detection of ion
present in the solution. Therefore, Amperometric detection technique is used to
measure the current value based on the detection of ion that present in the glucose
with the enzyme.
Figure 4.4 shows the amperometric detection graph based on various
concentration of glucose level. The glucose level also shows an increament in the
current value with the increasing concentration. The graph shows negative value of
current since the amperometric detection measure the reduction reaction of glucose
and glucose oxidase.
Figure 4.4: Amperometric detection of various glucose concentration graph
Table 4.1 shows the result of current value for four different concentration of
glucose solution. Based on the reading, 8mmol/L produce higher current value which
is 0.0014µA while the lowest concentration which is 4mmol/L produce lowest current
value which is 0.0007µA.
32
Table 4.1: Result of glucose concentration samples and current reading
Glucose Concentration (mmol/L) Current (µA)
4.4
4
-0.0007
5
-0.0009
6
-0.0011
8
-0.0014
Conclusion
Based on the cyclic voltametry and amperometric detection techniques, it
shows that the current values increases as the concentration of glucose increases.
Therefore, in normal condition of glucose level, the current value do not fall outside
of range 0.0007µA to 0.0014µA. This current measurement condition can be applied
during surgery. Therefore, when the current value falls outside this range, the doctor
can make preparation to adjust the insulin regimen of the patient blood. Furthermore,
the whole CGM system was successfully implemented which has the advantage of
smaller size and mobile.
CHAPTER 5
CONCLUSION AND RECOMMENDATION
This chapter give conclusion about the result and the whole CGM process.
Recommendation for the future work also included in this chapter.
5.1
Conclusion
A CGM system has been designed so that it can measure the glucose level
continuously during the surgery. The design include the whole CGM system as well
as the fabrication of Lab on Chip. The Lab on Chip was designed with two inlets and
one outlet that has Y shape and spiral channel in Solidworks program. Then, the Lab
on Chip was fabricated using PDMS material that consist of silicon elastomer from
base and curing agent in ratio of 10:1. The end product of lab on chip that has been
integrated with screen printed electrode shows that, the samples were able to flow and
mix through the channel without leakage. In addition, the screen printed electrode is
able to detect the amperometric reaction between both samples.
Based on the result, the current depicts an increment with the increasing
concentration of glucose which is as expected since high concentration of glucose
produce more hydogen peroxide and more electron as stated in Equation 2.1.
The whole CGM process also can be applied in the surgery. The peristaltic
pump can pump out blood from the blood vessel into the lab on chip which then,
the integrated screen printed electrode inside the lab on chip will detect the glucose
concentration of blood amperometrically. The blood will then flow back into the blood
vessel of the patient body through outlet of lab on chip.
34
5.2
Limitation
The whole CGM system and process can be applied during the surgery.
However, in this experiment, the real blood is not being tested. Instead, the glucose
and glucose oxidase has been used as samples to replace the blood. The result may
differ and more accurate if using the real blood sample.
5.3
Recommendation
The CGM system is able to measure the glucose level continuously but
in invasive way which need to damage the blood vessel. Therefore, for future
recommendation, instead of measuring the glucose level invasively, make a smaller
lab on chip that can measure the glucose level non-invasively and can be used not only
during the surgery, but also in the normal condition.
REFERENCES
1.
G. Sparacino, F. Zanderigo, S. Corozza et al. "Glucose Concentration Can
Be Predicted Ahead In Time From Continuous Glucose Monitoring Sensor
Time-Series". 2007. 54(5): 931–937.
2.
M. Rice, A. Pitkin, D. Coursin. "Glucose Measurement In The Operating
Room: More Complicated Than It Seems". Anesthesia and Analgesia, 2010.
110(4): 1056–65.
3.
A. Trial. "Annals of Internal Medicine Article Intensive Intraoperative Insulin
Therapy versus Conventional Glucose Management during Cardiac Surgery".
2007.
4.
J. Marks. "Perioperative Management of Diabetes". 2003: 4–6.
5.
A. Facchinetti, S. Favero, G. Sparacino et al. "Modeling The Glucose Sensor
Error". 2014. 61(3): 620–629.
6.
M. Chu, K. Mitsubayashi. "Soft Contact-lens Sensor for Monitoring Tear
Sugar as Novel Wearable Device of Body Sensor Network".
7.
M. Minimed, R. City. "Continuous Glucose Monitoring". 2005. 28(5).
8.
N. Sharma, S. Singh. "Designing a Non Invasive Blood Glucose Measurement
Sensor". 2012: 12–14.
9.
R. Plodkowski, S. Edelman. "Pre-Surgical Evaluation of Diabetic Patients".
2001. 19(2): 92–95.
10.
H. Kudo, T. Sawada, E. Kazawa et al.
"A flexible and Wearable
Glucose Sensor Based on Functional Polymers With Soft-MEMS Techniques".
Biosensors & Bioelectronics, 2006. 22(4): 558–62.
11.
K. Louchis, S. Driscoll. "Fundamental Sensing Limit of Electrochemical
Glucose Sensors". 2011. (1): 7670–7673.
12.
H. Xu, G. Li, J. Wu et al. "A Glucose Oxidase Sensor Based On Screen-printed
Carbon Electrodes Modified By Polypyrrole". 2005: 1917–1920.
13.
Manz et al. "Miniaturized Total Chemical Analysis Systems". 2007: 99–108.
36
14.
B. Weigl, R. Bardell, C. Cabrera . "Lab-on-a-chip For Drug Development".
Advanced Drug Delivery Reviews, 2003. 55(3): 349–377.
15.
Y. Atalay, P. Verboven, S. Vermeir et al. "Model-based Design and
Optimization of a Multiplexed Microfluidic Biochip for Multi-analyte
Detection". 2008: 482–485.
16.
P. Abgrall, A. Gue. "Lab-on-chip Technologies : Making a Microfluidic
Network and Coupling It Into a Complete Microsystem". 15.
APPENDIX A
ARDUINO UNO SOURCE CODE
CODE FLOW TO CONTROL THE SPEED OF PERISTALTIC PUMPS
#include "Shield2AMotor.h"
// Connect 4 pin on SHIELD-2AMOTOR to "Signed Magnitude" mode
Shield2AMotor motor(SIGNED_MAGNITUDE);
signed int leftSpeed, rightSpeed;
int i;
void setup()
{
}
void loop()
{
// Rotate 360 degree CW
for(i = 0; i < 50; i++)
{
motor.control(100, 0); //rotate motor1
delay(10);
motor.control(100, 0); //rotate motor1
motor.control(0, 100); //stop motor1
delay(10);
motor.control(0, 100); //stop motor1
delay(10);
motor.control(0, 100); //stop motor1
motor.control(-100, 0); //rotate motor1
delay(10);
motor.control(-100, 0); //rotate motor1
delay(10);
motor.control(-100, 0); //rotate motor1
motor.control(0, -100); //stop motor1
delay(10);
motor.control(0, -100); //stop motor1
delay(10);
motor.control(0, -100); //stop motor1
motor.control(100, 0); //rotate motor1
delay(10);
}
delay(1000);
// Rotate 360 degree CCW
for(i = 0; i < 50; i++)
{
APPENDIX B
DATA SHEET
1. Schematic diagram of Arduino Uno
2. 2A Motor Driver Shield
P$2
P$1
P$2
P$1
1
2
3
4
5
8
4
1
1
3
5
2
4
6
2
1
2
1
33
27
31
30
29
28
4
3
32
1
2
24
PAD
UCAP
UVCC
DD+
UGND
VCC
GND
AVCC
XTAL1
(INT4/ICP1/CLK0)PC7
(OC1A/PCINT8)PC6
(PCINT9/OC1B)PC5
(PCINT10)PC4
(AIN2/PCINT11)PC2
(CTS/HWB/AIN6/TO/INT7)PD7
(RTS/AIN5/INT6)PD6
(XCK/AIN4/PCINT12)PD5
(INT5/AIN3)PD4
(TXD1/INT3)PD3
(RXD1/AIN1/INT2)PD2
(AIN0/INT1)PD1
(OC0B/INT0)PD0
XTAL2(PC0)
1
(PCINT7/OC0A/OC1C)PB7
(PCINT6)PB6
(PCINT5)PB5
(T1/PCINT4)PB4
(PD0/MISO/PCINT3)PB3
(PDI/MOSI/PCINT2)PB2
(SCLK/PCINT1)PB1
(SS/PCINT0)PB0
RESET(PC1/DW)
2
3
6
13
12
11
10
9
8
7
6
22
23
25
26
5
21
20
19
18
17
16
15
14
6
2
3
1
7
OUT
GND NC/FB
ON/OFF
IN
4
2
3
1
5
4
5
4
5
6
1
3
2
2
8
1
7
1
1
5
4
2
2
5
2
1
4
3
8
4
8
1
2
7
3
3
7
8
21
20
22
9
10
1
3
VCC
GND
AREF
AVCC
AGND
XTAL1
XTAL2
RESET
1
2
3
4
5
6
7
8
2
1
7
8
(AIN1)PD7
(AIN0)PD6
(T1)PD5
(T0)PD4
(INT1)PD3
(INT0)PD2
(TXD)PD1
(RXD)PD0
(ADC5)PC5
(ADC4)PC4
(ADC3)PC3
(ADC2)PC2
(ADC1)PC1
(ADC0)PC0)
(SCK)PB5
(MISO)PB4
(MOSI)PB3
(SS)PB2
(OC1)PB1
(ICP)PB0
1
3
5
2
4
6
13
12
11
6
5
4
3
2
28
27
26
25
24
23
19
18
17
16
15
14
3
IN OUT
1
4
2
5
6
4
3
8
7
6
5
4
3
2
1
6
5
4
3
2
1
10
9
8
7
6
5
4
3
2
1
3
2
6
7
ROBOT . HEAD to TOE
Product User’s Manual –
2A Motor Driver Shield
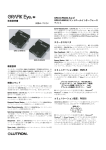
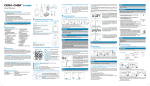
SHIELD2AMOTOR Cytron 2A Motor Driver Shield User's Manual V1.1 Feb 2015 Created by Cytron Technologies Sdn. Bhd. – All Rights Reserved 1 ROBOT . HEAD to TOE
Product User’s Manual –
2A Motor Driver Shield
INDEX 1. Introduction
3 2. Packing List
4 3. Product Specification And Limitations
5 4. Dimension
6 5. Board Layout 7 6. Hardware
9 7. Software
14 8. Warranty
15 Created by Cytron Technologies Sdn. Bhd. – All Rights Reserved 2 ROBOT . HEAD to TOE
Product User’s Manual –
2A Motor Driver Shield
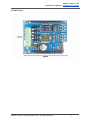
1. INTRODUCTION SHIELD2AMOTOR is an Arduino shield for controlling dual DC motor up to 2A for each channel. It is compatible with Arduino Uno, Arduino Leonardo, Arduino Mega, Arduino Due and possibly other pin compatible main boards. SHIELD2AMOTOR uses L298P SMD IC and support for both signed magnitude and locked antiphase. SHIELD2AMOTOR shield has stackable side headers which allows for more Arduino shields to be stacked on top of it. SHIELD2AMOTOR come with this features: ● Bidirectional control for 2 brushed DC motor. ● Support motor voltage ranges from 5V to 26V. ● Maximum current up to 2A continuous per channel. ● 3.3V and 5V logic level input. ● Stackable I/O header pin. ● Selectable pins for Signed Magnitude and Locked AntiPhase. ● Test switch for both channel. ● External voltage polarity protector. Created by Cytron Technologies Sdn. Bhd. – All Rights Reserved 3 ROBOT . HEAD to TOE
Product User’s Manual –
2A Motor Driver Shield
2. PACKING LIST Please check the parts and components according to the packing list. If there are any parts missing, please contact us at
[email protected]
immediately. 1. 1 x
SHIELD2AMOTOR 2. 5 x
mini jumper Created by Cytron Technologies Sdn. Bhd. – All Rights Reserved 4 ROBOT . HEAD to TOE
Product User’s Manual –
2A Motor Driver Shield
3. PRODUCT SPECIFICATION AND LIMITATIONS Absolute Maximum Rating Parameter Min Typical Max Unit Power Input Voltage (Motor supply voltage) 5 26 V I
MAX
(Maximum Continuous Motor Current) 2 A I
PEAK
(Peak Motor Current) 2 A V
IOH
(Logic InputHigh Level) 3.3 5.5 V V
IOL
(Logic Input Low Level) 0 0 0.5 V Maximum PWM Frequency 10 KHz *Must not exceed 10 seconds Created by Cytron Technologies Sdn. Bhd. – All Rights Reserved 5 ROBOT . HEAD to TOE
Product User’s Manual –
2A Motor Driver Shield
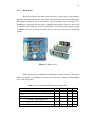
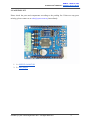
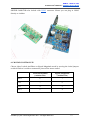
4. DIMENSION Created by Cytron Technologies Sdn. Bhd. – All Rights Reserved 6 ROBOT . HEAD to TOE
Product User’s Manual –
2A Motor Driver Shield
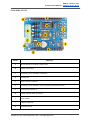
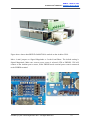
5. BOARD LAYOUT Label Function A Reset button for Arduino main board B Motor connectors. C External power (PWRIN) connector. D PWR LED. E Power source selection. F External power (PWRIN) reverse polarity protection circuit. G L298P driver motor IC. H Motor control mode selection. I Test switch. J LSS05 connector. K Arduino pinout. Created by Cytron Technologies Sdn. Bhd. – All Rights Reserved 7 ROBOT . HEAD to TOE
Product User’s Manual –
2A Motor Driver Shield
Reset button User can press this button to restart Arduino program. Motor connectors Connect DC motor here. External power (PWRIN) connector Connect external power source here. PWR LED Motor power indicator. Power source selection. User can choose power source either from external (PWRIN) or internal (VIN). External power (PWRIN) reverse polarity protection circuit. In case user wrongly connect the external power source polarity, this circuit will protect the shield from broken. L298P driver motor IC. SHIELD2AMOTOR uses L298P driver motor IC. Motor control mode selection. User can choose motor control mode either
Signed Magnitude
or
Locked AntiPhase
. Test switch. When button A is pressed, current flows from output A to B and motor will turn CW (or CCW depending on the connection). When button B is pressed, current flows from output B to A and motor will turn CCW (or CW depending on the connection). LSS05 connector. LSS05 can connect directly to this shield and can be interfaced with Arduino. Arduino pinout. Other Arduino shield can be stacked on top of this shield. Created by Cytron Technologies Sdn. Bhd. – All Rights Reserved 8 ROBOT . HEAD to TOE
Product User’s Manual –
2A Motor Driver Shield
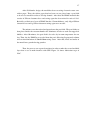
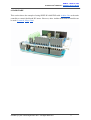
6. HARDWARE This section shows the example of using SHIELD2AMOTOR with
Arduino Uno as the main controller to control dual brush DC motor. However, other Arduino main board controller can be used (
Leonardo
,
Mega
,
Due
). Created by Cytron Technologies Sdn. Bhd. – All Rights Reserved 9 ROBOT . HEAD to TOE
Product User’s Manual –
2A Motor Driver Shield
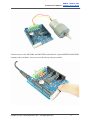
Figure above shows that SHIELD2AMOTOR is stacked on the Arduino UNO. Move 4 mini jumpers to Signed Magnitude or Locked AntiPhase. The default setting is Signed Magnitude. Make sure correct power source is selected (VIN or PWRIN). VIN will connect to the Arduino power source, while PWRIN needs external power source connected to the PWRIN terminal. Created by Cytron Technologies Sdn. Bhd. – All Rights Reserved 10 ROBOT . HEAD to TOE
Product User’s Manual –
2A Motor Driver Shield
Connect motor to the MOTOR1 and MOTOR2 terminal block. Upload SHIELD2AMOTOR example code to Arduino. Or you can test directly by using test switch. Created by Cytron Technologies Sdn. Bhd. – All Rights Reserved 11 ROBOT . HEAD to TOE
Product User’s Manual –
2A Motor Driver Shield
SHIELD2AMOTOR also include with
LSS05 connector. Means you can plug in LSS05 directly to Arduino. 6.1 MOTOR CONTROL PIN Choose either Locked AntiPhase or Signed Magnitude mode by moving the 4 mini jumpers on shield. Below is a table to summarize pin used for motor control. Locked AntiPhase (Arduino Pin) Signed Magnitude (Arduino Pin) DIR 2 6 7 EN 2 7 6 EN 1 4 5 DIR 1 5 4 Created by Cytron Technologies Sdn. Bhd. – All Rights Reserved 12 ROBOT . HEAD to TOE
Product User’s Manual –
2A Motor Driver Shield
6.2 LSS05 PIN LSS05 can connect directly to this shield and can be interfaced with Arduino. Below is a table showing the pins connection between LSS05 and Arduino on 2A motor driver shield. Arduino Pin LSS05 Output Pin 5V 5V GND GND A1 01 A2 02 A3 03 A4 04 A5 05 D8 Cal Created by Cytron Technologies Sdn. Bhd. – All Rights Reserved 13 ROBOT . HEAD to TOE
Product User’s Manual –
2A Motor Driver Shield
7. SOFTWARE Arduino library and example code can be downloaded from the SHIELD2AMOTOR product page at Cytron’s website. Created by Cytron Technologies Sdn. Bhd. – All Rights Reserved 14 ROBOT . HEAD to TOE
Product User’s Manual –
2A Motor Driver Shield
8. WARRANTY ● Product warranty is valid for 12 months. ● Warranty only applies to manufacturing defect. ● Damaged caused by misuse is not covered under warranty ● Warranty does not cover freight cost for both ways. Prepared by: Cytron Technologies Sdn. Bhd. No. 16, Jalan Industri Ringan Permatang Tinggi 2, Kawasan Industri Ringan Permatang Tinggi, 14100 Simpang Ampat, Penang, Malaysia. Tel: +604504 1878 Fax: +604504 0138 URL: www.cytron.com.my Email:
[email protected] [email protected] Created by Cytron Technologies Sdn. Bhd. – All Rights Reserved 15