1
Infrared Telescope Facility
Institute for Astronomy, University of Hawai`i
2680 Woodlawn Drive, Honolulu, HI 96822
CSHELL: NASA IRTF
Cryogenic Echelle Spectrograph
USER'S MANUAL
Revision 2.0.1
16 August 1994
T. Greene
A. Denault
IRTF CSHELL User's Guide
Lots of Mahalo to Alan Tokunaga for immeasurable guidance throughout the CSHELL project
8/16/94
Page 2
IRTF CSHELL User's Guide
Table of Contents: IRTF CSHELL User's Manual
I. Introduction .......................................................................................................... 5
A. Preparations Before Coming to the IRTF ...................................................... 6
B. Instrument Description............................................................................... 6
Table1: General Specifications............................................................. 7
Table 2: Key Technical Features .......................................................... 7
Predicted Sensitivity.......................................................................... 8
Instrument Design Overview............................................................... 9
Table 3: CSHELL SBRC 256 x 256 InSb Array Performance ................... 10
II. Using CSHELL.................................................................................................... 13
A. Before Night Time Observing ..................................................................... 14
System Checkout.............................................................................. 14
Signal and Noise Checks.................................................................... 15
Wavelength Calibrations & Dispersion Measurement............................... 15
Example: Setup for HI Br !, 2.16609 µm ............................................ 17
B. Observing at the Telescope ......................................................................... 17
General Observing Procedures.............................................................. 18
CSHELL Observing Checklist ............................................................ 19
Flat Field and Dark Frames................................................................. 20
Astronomical Observations................................................................. 20
Imaging .......................................................................................... 20
Spectroscopy.................................................................................... 21
Command Files................................................................................ 21
Common VF Quick Look Techniques................................................... 22
III. CSHELL Instrument Reference............................................................................... 23
A. CSHELLXUI and VF Software Description and Reference................................ 24
What is the IC and XUI? .................................................................... 25
Moving the IC computer between the Summit & Manoa.......................... 35
CSHELL XUI / IC Command Reference ............................................... 36
What is VF? .................................................................................... 44
VF Source and Docs from IRTF-online................................................. 61
VF Command Reference..................................................................... 64
B. Turning CSHELL and its CCD Camera On and Off........................................ 71
A. CSHELL Startup.......................................................................... 71
B. CSHELL Shutdown ...................................................................... 71
C. CCD Guider Camera ..................................................................... 71
8/16/94
Page 3
IRTF CSHELL User's Guide
C. Observing Techniques................................................................................ 72
1. Setting IR Array Bias Voltages ........................................................ 72
2. Check For Read-Noise Limit and Saturation ....................................... 72
3. Flat-fielding ................................................................................. 73
4. Focus And Collimation.................................................................. 73
5. Tweaking the CVF for a Flatter Flat ................................................. 73
6. Darks.......................................................................................... 74
7. Acquiring Objects.......................................................................... 74
8. Slit Rotation................................................................................ 74
9. Integrations and Nodding................................................................. 75
10. Observing Extended Objects........................................................... 76
11. Command Files........................................................................... 76
D. Observing Spectral Lines ........................................................................... 78
1. Popular Astronomical Line List....................................................... 78
2. Night Sky OH Lines...................................................................... 79
3. Using Calibration Lamps and cal_lines.............................................. 80
E. IRTF Computer Services............................................................................ 82
1. IRTF Mauna Kea Computer Facilities............................................... 82
2. Archiving Your Data...................................................................... 82
3. Anonymous FTP and WWW Site Information .................................... 84
F. CSHELL Data and its Reduction.................................................................. 85
1. CSHELL FITS File Header Example ................................................ 85
2. Data Reduction Guide with IRAF Examples ....................................... 86
G. Using the CSHELL CCD Guider Camera...................................................... 88
GIC / GUIDER XUI Command Reference ............................................. 89
IV. Appendices......................................................................................................... 90
A. Observing Log Sheet and Line Settup Form .................................................. 90
B. CSHELL Hardware Reference...................................................................... 93
C. Troubleshooting....................................................................................... 101
Filter and Slit Wheels........................................................................ 101
CSHELL Grating Equations................................................................ 103
Verifying CSHELL Throughput .......................................................... 103
D. Temperatures and Controllers...................................................................... 104
Procedure A: Front Panel Configuration................................................ 104
Procedure B: Software Control............................................................. 104
E. Summary of Upgrade Changes for Previous CSHELL Users ............................. 105
F. IR Array Linearity Data.............................................................................. 107
8/16/94
Page 4
IRTF CSHELL User's Guide
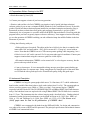
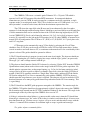
I. Introduction
This document is meant to be a reference to the CSHELL spectrometer for IRTF observers,
operators, and staff. Sections I and II of this document are also intended to serve as a guide to
introduce new users to the instrument. These first two sections prepare the user, describe the
instrument, and cover the basics of system startup, wavelength calibration, and data acquisition.
Section III is a detailed reference to instrument operation, observing techniques, spectral line
selection, data archiving, and data reduction. The appendices in § IV include data log sheets, spectral
line setup forms, instrument hardware information, a troubleshooting guide, temperture controller
setup instructions, and a summary of changes implemented in the 1994 CSHELL Upgrade.
CSHELL users control the instrument through a Sun workstation computer using data
acquisition and quick look reduction software under the Sun Open Windows graphical user interface
(GUI). The Sun computer communicates via TCP/IP over the observatory Ethernet network to an
instrument control (IC) computer mounted on the telescope with CSHELL. Normally the IC machine
is always on and running the CSHELL software, but the observer logs onto the Sun machine each
night to use the user interface software. Users must use a mouse, windows, and icons on the Sun
computer to acquire and look at CSHELL data. The IRTF staff has endeavored to make the user
interface programs as intuitive as possible, and they are fully documented in § III A.
Using the programs can be frustrating, however, if one is not familiar with the Open
Windows mouse button conventions. Briefly, the left mouse button is used for selecting items such as
text fields, buttons in windows, and default menu choices. The right mouse button is used to display
a menu of choices by clicking it when the mouse is positioned on any object that displays a small
down-pointing triangle indicative of further choices. A menu of options appears once this is done,
and menu items are selected by again pressing the right mouse button when the mouse pointer is
positioned on top of them. Default menu items are circled by ovals; they can be selected by either the
above procedure or else by just clicking the left button when the mouse pointer is over the original
object associated with the menu. Text can be selected with the left button in several ways. The
mouse pointer can be positioned at the desired insertion point and the left mouse button clicked to
select that point for text insertion. This selected position will be the active insertion point whenever
the mouse pointer is positioned in the parent window of that text field. Alternatively, the mouse
pointer can be positioned in a text field and the left mouse button can be double- or triple-clicked
(rapidly) to select either a portion or all of the text in that field. Text can also be selected by
positioning the pointer, clicking the left button, and dragging the pointer over the desired text.
Selected text is highlighted and will be replaced by whatever new text is typed on the Sun keyboard.
All text changes and commands must be followed by carriage returns to make them effective. This is
a very important and often overlooked item!
The two columns of keys at the left edge of the sun keyboard can also be used to manipulate
windows that the mouse pointer is on top of. Most of these are toggles, so pressing the “Front” key
will alternately place the window under the pointer either in front of or behind all other displayed
windows. See § III.A of this manual for further details on the CSHELL software.
8/16/94
Page 5
IRTF CSHELL User's Guide
A. Preparations Before Coming to the IRTF
a. Read this manual (§ I and § II)
b. Contact your support scientist if you have any questions.
c. Retrieve and read the cshellxui (CSHELL user interface) and vf (quick look data reduction)
software guides if you are not a computer WIMP (Windows, Icons, and Mouse Person). If possible,
get the vf quick look data reduction program installed at your home institution and practice using it.
Instructions on how to obtain these user guides and programs electronically is given in § III E.
Alternatively, the vf programs is accessible at HP on the IRTFs Sun workstation. Practicing with this
program before your run can greatly improve observer efficiency. Your support scientist will usually
go over the operation of CSHELL and help you take calibration lamp data at Hale Pohaku in the first
afternoon of your run.
d. Bring the following with you:
• Offset guide stars if required. The offset guider has a field-of-view that is an annulus with
inner radius 100" and outer radius ~200", and it can reach V= 12 mag in 1 second with no
moon. Note that the CSHELL on-axis CCD camera permits guiding while integrating, has a
field-of-view of ~60", and it can reach V= 16 mag stars under typical conditions. Contact your
support scientist about using this camera to guide on visible objects.
• Slit rotation information. CSHELL can be rotated ± 90° to a few degrees accuracy, but the
process takes up to half an hour.
• 8 mm or 4 mm tapes. It is recommended to bring one tape per night to permit backing up
each night's data on a separate tape. Bring enough tapes for enough copies of the entire data
set. We find the video grade tapes to be of insufficient quality; bring data grade tapes.
B. Instrument Description
CSHELL is a long-slit spectrograph which uses a 31.6 lines/mm, 63.5° echelle with narrow
band circular variable filters that isolate a single order (orders from 11 to 56). The spectrograph can
achieve resolving powers up to 42000, or 7 km/s, over the 1-5 µm spectral region. CSHELL
originally had both Rockwell 256x256 NICMOS3 HgCdTe and Huhes SBRC 58x62 InSb detector
arrays, but both have been now replaced with a single Huhes SBRC 256x256 InSb device sensitive
from 1-5.5 µm. The instrument also has a direct imaging mode, described below. Further technical
information on the design and performance can be found in Greene et al. (1993, Proc. SPIE, vol.
1946, p. 313) and Tokunaga et al. (1990, Proc. SPIE, vol. 1235, p.131). The Greene et al.
(1993) paper must be cited in all publications of CSHELL data!
CSHELL was constructed with funds from the NSF and NASA. Its design and construction
was achieved by a team of IRTF and IfA personnel. The principal specifications and technical features
of CSHELL are summarized below:
8/16/94
Page 6
IRTF CSHELL User's Guide
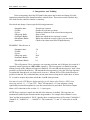
Table1: General Specifications
Array:
SBRC InSb; 256 spectral by 160 spatial pixels
Pixel Size:
0.20 arcsec; 2.7 km/s per pixel at blaze angle
Wavelength Range:
1.08 - 5.6 µm
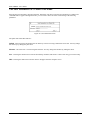
Free Spectral Range: " 2.5 × 10⁻³ #
Resolving Power (R) 43000 21500 14300 10800 5400
Slit width (arcsec)
0.5
1.0
1.5
2.0
4.0
Pixels/slit
2.5
5
7.5
10
20
R = # / $#
Slit: 30" in length. Discrete slit widths of 0.5", 1.0", 1.5", 2.0" and 4.0".
The 4" slit has been provided to permit spectrophotometry on point sources.
The slit orientation may be changed by manually rotating the spectrograph with
the instrument rotator on the telescope.
Table 2: Key Technical Features
Optics
Collimator type
Collimated beam diameter
Material
Grating
Object acquisition capability
Cooling method
Overall dimensions
f/13.67 beam at the slit
Off-axis cassegrain
8.0 cm
Zerodur
Milton Roy 31.6 lines / mm echelle, 63.5˚ blaze angle
Visible CCD and direct IR imaging of the focal plane
Closed-cycle cooler with Nitrogen regulation
Inner cold box 56 cm × 19 cm × 18 cm
Outer vacuum case 64 cm × 35 cm × 27 cm
Direct Imaging Mode
CSHELL has a direct imaging mode in which a plane mirror substitutes for the
grating and provides an image of the 30" field-of-view on the infrared array.
This mode is useful for viewing the field in the infrared, acquiring sources,
8/16/94
Page 7
IRTF CSHELL User's Guide
and centering them in the slit. Images of the field may be recorded for
reference with either narrow band or standard photometric filters, though the
system is not meant to provide high quality photometric images.
Calibration Lamps
Argon, krypton and xenon spectral lamps and a continuum lamp are provided
for wavelength calibration and flat fields.
Software
On-line quick look data reduction software is available for use with the
instrument. It allows examination of the data by providing sky subtraction,
flat fielding, and simple spectral extraction. Raw or reduced FITS format
data files are recorded in tar format on 4 mm or 8 mm tape.
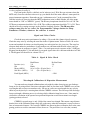
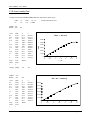
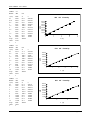
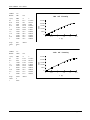
Predicted Sensitivity
The spectrograph sensitivity F in W/m2/µm is given by
F=
F0 % S % R
#
N % ( n r2 + nb % t )
2
T %t
Other parameters are
F0
S
R
#
N
nr
nb
t
T
=
=
=
=
=
=
=
=
=
=
2.4×10⁻¹⁹ # < 3 µm (16.5% throughput @ blaze angle)
3.2×10⁻¹⁹ # > 3 µm
signal-to-noise ratio
resolving power
wavelength in µm
total number of pixels summed (spatial + spectral directions, including sky)
electronics noise (readout and other sources) in electrons
dark current and background in electrons/sec
individual exposure time
total observation time
Below we present the sensitivity for S = 10, R = 21500 (1.0" slit), and
T = 1 hour. Calculations are for a point source in which sky subtraction is
achieved by nodding the telescope along the slit such that the object remains
in the slit; for the surface brightness sensitivity, the telescope is nodded
to blank sky. Pixels are summed 1" along the slit and over one resolution
element along the dispersion direction; therefore, the results are per
8/16/94
Page 8
IRTF CSHELL User's Guide
resolution element, not per pixel. The numbers below may be scaled to other
cases using the above formula, but longer (guided) exposures can improve sensitivities.
We use a system electronics noise of 35 electrons. This is representative of (almost)
the entire array (including high dark current pixels) for 240 s exposures with 6 samples
(Fowler MCS technique) at 325 mV applied bias. For wavelengths short of 2.5 µm we take
nb = 5 electrons / sec and t = 240 sec. At 3.4 µm, nb = 28 electrons / sec and t = 120 sec. At
4.8 µm, nb = 1000 electrons / sec and t = 10 sec, usually short enough for good sky
subtraction. We sum 5 pixels in the dispersion direction by 5 pixels (1'') in the spatial
direction .
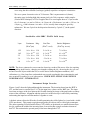
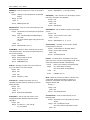
Sensitivities with SBRC 256x256 InSb Array
# µm
Continuum Mag.
(W/m2/µm)
1.25
1.65
2.2
3.4
4.8
9.6 × 10⁻¹⁵
5.6 × 10⁻¹⁵
3.2 × 10⁻¹⁵
3.2 × 10⁻¹⁵
8.2 × 10⁻¹⁵
13.8
13.3
12.8
10.9
8.5
Line Flux
(W/m2 / resol)
Surface Brightness
(W/m2/sq. arcsec)
5.6 × 10⁻¹⁹
4.3 × 10⁻¹⁹
3.2 × 10⁻¹⁹
5.1× 10⁻¹⁹
1.8 × 10⁻¹⁸
7.9 × 10⁻¹⁹
6.1 × 10⁻¹⁹
4.6 × 10⁻¹⁹
7.2 × 10⁻¹⁹
2.6 × 10⁻¹⁸
NOTE: The above estimates do not account for observing overhead. Be sure to allow for acquiring
objects, guiding inefficiencies, changing wavelengths, rotating the slit, observing the sky (you can
not nod extended objects within the slit, so use the above Surface Brightness numbers), and
calibrations (e.g. flats, lamp lines, and standard stars at each wavelength) when estimating the total
time required for making a set of observations. CHECK IRTF ONLINE FOR UPDATED
PERFORMANCE INFORMATION!
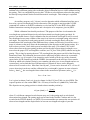
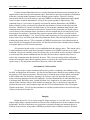
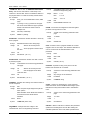
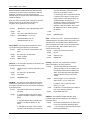
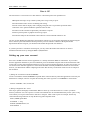
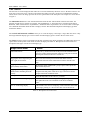
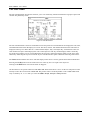
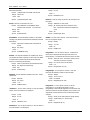
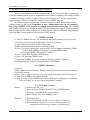
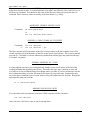
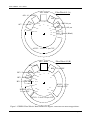
Instrument Design Overview
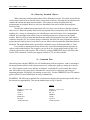
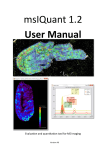
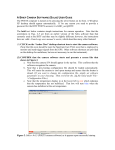
Figures 1 and 2 show the light path through the instrument. The incoming beam from the IRTF is
f/35, and the beam is converted to f/13.67 by the input lens, a plano-convex BaF2 lens. The input
lens forms an image of the focal plane at the slit while forming an image of the pupil at the secondary
mirror of the collimator. Alignment with the optical axis of the telescope is achieved by translating
and rotating the input lens and flat number 1 together as a unit.
A dichroic mirror reflects the IR to the slit while permitting the visible light to be viewed with a visible
CCD (not shown). This permits acquisition and guiding on objects with a visible light counterpart.
The order-separating CircularVariable Filter (CVF) wheels are positioned at a suitable distance from
the slit, such that the width of the incoming beam is not wider than a single resolution element of
theCVF. This maintains the spectral purity of the beam through the CVF.
8/16/94
Page 9
IRTF CSHELL User's Guide
The CVFs were selected from the stock catalog of Optical Coatings Lab Inc. These CVFs cause
ripples in CSHELL spectra with amplitudes of 10 - 20% peak-to-peak and periods of 2 - 10 cycles per
frame due to optical interference in their substrates. This is CSHELL's most severe remaining
instrumental problem. However, we have constructed discrete He I 1.083 µm and HI Br ! 2.167 µm
filters which do not exhibit this fringing and are also investigating replacing the CVFs with ones that
will not exhibit fringing. The # < 2.5 µm CVFs also have small leaks from adjacent grating orders,
with maximum leak amplitudes at their shortest wavelenghts (2% at 1.1 µm).
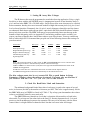
After the filter wheels, the beam passes through an off-axis Cassegrain collimator designed to produce
a collimated beam 8.0 cm in diameter. The effective focal length of the collimator is 109 cm, and its
design is such that its optical axis has been translated by 0.56 cm from that of the incoming beam.
This produces a 1.12-cm displacement of the incoming and outgoing beams. The dispersed light is
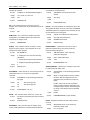
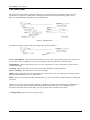
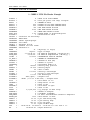
directed to flat number 3. The distance between the secondary and primary mirrors of the collimator
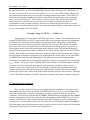
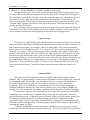
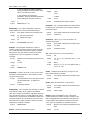
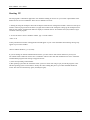
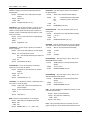
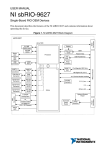
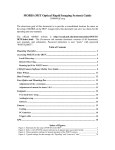
is 12.6 cm, which is enough for installation of a "direct imaging mirror" (shown in Figure 2). When
inserted into the beam, this mirror sends the beam back to the collimator, forming an image of the
focal plane at the IR array. The telescope focal plane can thus be viewed directly in the IR, and the slit
positioned before a spectrum is taken. It is also be possible to record an image of the field if desired.
There is little room for placement of an IR array at the image of the spectrum, so we allow the
dispersed light to expand to a spherical relay mirror via flat number 4. The relay mirror forms the
final image of the spectrum on the IR array. A pupil image is located about 3 cm in front of the IR
array where there is a stop and pupil mask to reject stray light.
The closed-cycle cooler allows continuous operation for three weeks or longer on the telescope. We
are using a CTI Cryogenics Model 350 CP closed-cycle cooler that provides acooling capacity of 20
watts at 77K and 2 watts at 13K. A vibration-damping mount was developed to reduce compressorinduced microphonics.
CSHELL now uses a single Hughes SBRC 256 x 256 InSb pixel IR array to acquire all infrared
photons. Its performance and operating parameters in CSHELL are tabulated below. See also
Appendix F for linearity data.
Table 3: CSHELL SBRC 256 x 256 InSb Array Performance
Read Noise:
Electrons / ADU:
Background Limit:
Int. Time:
Temperature:
Dark Current:
Quantum Efficiency:
Pixel size:
“1% linear” Well Size:
Device Artifacts:
8/16/94
55 electrons @ 1 sample, 22 electrons @ 6 samples (Fowler MCS)
11.0
~ 100 ADU in 240 s exposure @ 6 samples
& 76 ms Fowler sampling; 50 ms Fast Mode
30 K
~ 0.5 electrons / second
~ 80% for 1 µm < # < 3 µm; ~ 60% for 3 µm < # < 5.5 µm
30 µm
55,000 e- @ 325 mV bias; 92,400 e- @ 500 mV bias;
170,000 @ 800 mV bias; 234,000 e- @ 1.0 V bias (see § III.C, IV.F)
~ 1000 icky pixels (high dark current), tachyons (re. Fowler)
Page 10
IRTF CSHELL User's Guide
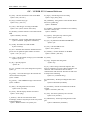
Echelle
Spherical relay mirror
Secondary
Flat #4
Collimator primary
Slit wheel
Flat #3
IR detector array
Filter wheel #2
Incoming light
Filter wheel #1
Input lens
Dichroic•
Flat #1
(Flat #2)
Dewar window
Figure 1. CSHELL optical layout. The CCD is mounted behind the dichroic but is not shown.
8/16/94
Page 11
8/16/94
Rubber
damper
Bellows
Flat #1
Input
lens
Incoming
light
Echelle
Flex pivot
Echelle yoke
Ball drive
{
Dewar
vacuum
case
74 K cold box
IR Detector array
Flat #4
Spherical relay
mirror
Echelle drive
housing
Closed-cycle cooler
(outline)
{
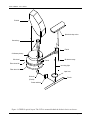
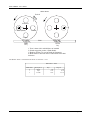
Figure 2. Front and side views of CSHELL. The length of the dewar vacuum case (tom to bottom) is 64 cm.
The inner cold box is thermally isolated and mechanically supported by fiberglass tabs (not shown).
Slit wheel
Filter wheels
Dichroic
Dewar vacuum
case
Direct imaging
mirror
Primary
Flat #3
Closed cycle cooler
Incoming•
light
Filter wheels
Slit wheel
Flat #3
Primary
(collimator)
Secondary
Direct
imaging
mirror
Echelle
IRTF CSHELL User's Guide
Page 12
IRTF CSHELL User's Guide
II. Using CSHELL
NOTE: This section assumes the user is familiar with the basic function of the cshellxui (data
acquisition) and vf (quick look data reduction) programs. See the cshellxui and vf
documentation (§ III.A) for information on the details of this software.
Powering up CSHELL and starting its software (explained in § III.B) initializes the instrument
in a “safe” state: the calibration lamps are off, the lamp mirror is out, the filters and slit are in closed
“blank” positions, and the shutter is closed. This is done by the telescope operator, day crew, or
support scientist. No light enters the spectrometer or falls on the infrared array in this initialized
configuration, but the internal CCD can see out through the telescope. This configuration is
graphically represented by the cshellxui Observing Parameters Window icons representing the
elements in the instruments optical path. Icons representing elements exposed to light are colored
yellow, ones not in the light path are gray, and the filter wheel is colored blue when the CVF has
been manually changed to select a grating order different from the one of the entered wavelength.
One must select the proper states of each mechanism by selecting from each icon's menu with
the mouse (right button for menu). Typical mouse menu operations with the icons are turning the
calibration lamps on and off, moving the lamp mirror in and out of the beam, selecting the desired
filter, choosing a slit size, switching between imaging and spectroscopic modes, open and closing the
shutter, and switching between the detector arrays. It is best to evaluate and change the states of the
icons from right to left order as displayed in the window. Different observing modes are selected by
changing the configurations of CSHELL's mechanisms. Open the shutter if you wish the detector
array to be exposed to incident light, but close it if you wish to acquire dark images. The direct
Imaging Mirror must be moved into the light path if one wants an image of the focal plane, and it must
be out of the light path if one wishes to acquire a spectrum. Spectra are usually taken through a 30"
long slit of selected width (the slit width determines flux and resolution), and images can be taken of a
large field (30" × 30") through the open slit position or else through a narrower slit .
Filters must be selected for the desired wavelengths, and the grating is automatically
positioned at the correct angle when wavelengths are entered into the cshellxui software. Calibration
lamps must be turned on (and the lamp mirror moved in) to take wavelength calibration (e.g. Argon or
Krypton lamp) or flat field (continuum lamp) frames. All lamps should be off (and the mirror moved
out) when acquiring astronomical data. The calibration lamps and mirror are usually used just when
taking spectral calibration data, and the lamp mirror is moved in and out by repeatedly selecting the
lamp that is on. The filter wheels are usually set to the CVF / Open (# > 1.57 µm) or CVF / Blocker
(# ' 1.57 µm) position unless one is observing lines for which we have discrete filters installed.
Be sure to enter your name, institution, etc. in the Setup Parameters Frame (Window) each
time you restart the cshellxui software. The (vacuum) wavelength or wave number to be observed is
entered into the Observing Parameters Frame. Parameters such as integration time, the number of
coadds per frame, and the number of frames (or Cycles) to be acquired are also entered into this
window's text fields.
8/16/94
Page 13
IRTF CSHELL User's Guide
Data can be acquired in either stare mode (single frame; “.a” appended to the filename) or else
in nodding mode. The nodding mode moves the telescope between frames and stores each frame
separately with a “.a” or “.b” name extension to indicate beam polarity. A single cycle in nodding
mode acquires one frame in position “A” and another frame in position “B.” Multiples of two cycles
cause data to be acquired in the “ABBA...” position sequence. The nod direction and magnitude are
set to your request by the telescope operator. Newly acquired data goes into one of several buffers
and may also be automatically saved. The LastFrame buffer in the Observing Parameters Frame
indicates which buffer new data will go into. Buffer b0 is the default new data buffer, and the vf
quick look program displays this buffer by default in its Canvas A. This is the standard configuration
for data to be displayed in the top left canvas of the vf quick look program. A MeanFrame buffer can
be selected so that a VF window shows the mean of a sequence of cycles (e.g. mean “A-B” in Nod
mode or mean “A” frame in Stare mode).
Autosave must be enabled for data to be automatically written with the concatenated filename
and number shown on the bottom line of the Observing Parameters Frame. Autosave is enabled by
checking its box; this ensures that the data files will be saved onto the Sun (XUI) computer's disk in
FITS disk format. The data in a buffer can also be saved by the vf quick look program. The Save
Data option of the vf File menu will save a selected buffer as a FITS data file, but will omit the
instrument and telescope information from the file header. Therefore it is best to have Autosave
enabled before acquiring any data if you wish to save it. The Object and Comment fields in the
Observing parameters Frame are also written into the file header.
One must issue a “Go” command to take an exposure. This is usually done by selecting “Go
Obs” from the Go menu of the cshellxui Base Frame (main window). This is also the default for that
menu so “Go Obs” can also be selected by clicking the left mouse button when the pointer is
positioned over the “Go” menu. The data goes into the chosen buffer (default LastFrame buffer is b0)
and is written to a disk file only if Autosave is enabled. The data buffer can be displayed in a canvas
of the vf window (Canvas A displays buffer b0 by default). The current image coordinate and data
value of the image pixel beneath the mouse cursor is displayed at the top of the image. The image can
be zoomed, rescaled, or restretched in its vf display window canvas, and it can also be redisplayed as
a spectral cut, histogram, or file header in any vf canvas. See the vf documentation in § III.A for
details.
A. Before Night Time Observing
System Checkout
The IRTF day crew checks the basic wavelength calibration, sensitivity, and overall
functionality of CSHELL each time it is mounted on the telescope, but you can also check these
parameters when you do wavelength calibrations at the start of each night. The presence of the
calibration lamp lines at the proper locations and intensities as well as the proper appearance of the flat
field and dark frames are adequate assurances of the proper functioning of the instrument. The IRTF
day crew and support staff have priority in using CSHELL between 9:00 am and 3:15 pm, while
observers have usage priority at other times. Before the first night's observing (starting after 3:15
pm), we recommend that the signal and dark frame noise checks and the wavelength calibrations be
performed either at HP or at the telescope. This will provide you with hands-on experience with
using the instrument before taking astronomical data and allow you to spot any problems early on.
8/16/94
Page 14
IRTF CSHELL User's Guide
Call the IRTF summit before starting any work with the instrument from Hale Pohaku - the day crew
or other staff may be using it!
First start up the cshellic, cshellxui, and vf software (see § III.A-B or get assistance from the
IRTF staff). Once the cshellxui software is up, you should check the main window's status panel for
proper instrument operation. Remember to type “xuihostname wien” in the command line of the
cshellxui window if observing from the IRTF workstation (wien) at Hale Pohaku. All of the status
items should be "OK" or "READY" (green). The IR array temperature should be 30.0 ± 0.2 K. The
CCD array temperature should be 190 ± 20 K. The coldbox temperature should be 72.5 ± 2 K. There
should not be any warning messages in the cshellxui feedback window. The IR array bias
voltages must also be set (select Set Programmable Voltages button in Setup
Parameters Window) whenever the software is started.
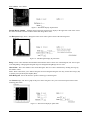
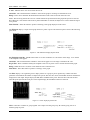
Signal and Noise Checks
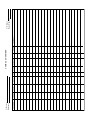
Check the array noise performance by taking a 2.0 second dark (shutter closed) exposure.
Check the array noise by selecting the stats item in the vf Options menu. Refer to Table 4 to see the
means and standard deviations you should getting in a sub-region box of a given size. The array has
adequate dark and noise performance if your numbers are consistent with the table values, and you
can now evaluate its response to signals. Take a 2 second spectroscopic exposure of the 2.19085 µm
Krypton line through the 1" slit and check if your peak signal values are consistent with those in Table
4. The Krypton line should be in column 128 ± 5.
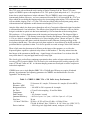
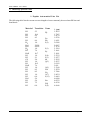
Table 4: Signal & Noise Check
Int. time (sec)
Slit
Mean (ADUs)
Std. Dev. (ADUs)
Peak Signal(ADUs)
Dark Frame
2.0
Blank
0.0 ± 10 (50 x 50 pixel box)
3-5
(50 x 50 pixel box)
-
Kr Line Frame
2.0
1''
~ 1200
Wavelength Calibrations & Dispersion Measurement
You must take wavelength calibration data each night by either observing rare gas discharge
lamps or else by using telluric emission or absorption lines in your data itself. CSHELL uses vacuum
wavelengths and vacuum wave numbers only. Be sure to correct rest wavelengths for any velocity
shifts in your objects before entering them into the CSHELL software. The first step of the discharge
lamp wavelength calibration process is selecting which calibration lamp lines to use. Lines must be
selected for calculation of the spectral zero point and dispersion at each observational wavelength
(grating position) selected.
CSHELL's spectral range is only 1/400 of the central wavelength .This narrow range dictates
that the lines of the calibration lamps rarely fall on the arrays when the instrument is set up to observe
lines of astronomical interest. We can trick CSHELL into observing these calibration lines at the same
grating position as used for astronomical lines, however. The procedure is to select the (vacuum)
8/16/94
Page 15
IRTF CSHELL User's Guide
wavelength which you wish to fall near the center of the array for your astronomical observations,
and then select a different grating order so that the desired calibration lines are visible without moving
the grating. This is accomplished by moving the CVF filter to select different orders after the grating
has already been positioned for the desired astronomical wavelength. This technique is explained
below.
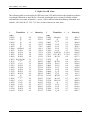
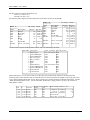
An auxiliary program, cal_lines, is used to determine which calibration lamp lines are to
be used at a given wavelength selected for observation. This program is run from either a UNIX
command line window on an IRTF workstation, or else from the PC in the IRTF office at Hale
Pohaku. Instructions on using the program and a description of its output are given in §III.D.
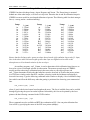
Which calibration lines should you observe? The purpose of the lines is to determine the
wavelength zero point and dispersion for each observational wavelength (grating position). In
practice, one should observe a single calibration line for each desired wavelength as well as several
lines distributed across many columns of the array for at least one wavelength setting at the start of
each night. The single line at each grating position (selected wavelength) directly allows the
determination of the wavelength of the illuminated array column, and observing several lines over a
range of columns on the array allows the determination of the dispersion at that grating setting. It is
best to observe at least 3 lines which span at least half of the array (128 columns). We wish to
observe these lines at the same grating position used for the object observation wavelength, so we
must select the proper CVF wavelength for each line (see Cal_lines Table, §III.D) without moving the
grating. This is done by entering the new CVF wavelength into the proper text field of the Observing
Parameters Frame. The calibration lines must also be sufficiently bright to observe in a reasonable
amount of time (e.g. 60 seconds ). Line intensities can be looked up in the copy of the elemental
spectral atlas (by M. Outred) kept with the CSHELL documentation at the telescope. Lines must be
looked up within each element's listing by wave number (the atlas gives air wavelengths and we use
vacuum ones), and we find that lines with intensities of 100 units or above can be adequately
observed in 60 seconds or less. Most lines listed by cal_lines can be observed in 15 s or less. If
you are observing in order nobs and the calibration line (wavelength #l) appears in some column in
order nl , then #obs ,the wavelength of that column in the astronomical spectrum (order nobs), is:
# obs = # l nl / nobs .
#obs is given in column 3 and nl is given in column 4 of the Cal_lines Table (see also §III.D). The
expected position of a line on the SBRC 256 × 256 array is listed in col(SBRC256) in the table.
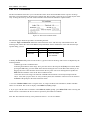
The dispersion at one grating position is related to that at another position by:
$# ( µ m / pixel ) = C %
# (µ m )
2 % tan( ( )
where C is a different constant for each detector array and is the grating angle at each desired
observational wavelength. The grating angle can be found in the cshellxui window and it is also
recorded in the FITS file headers (see §III.F). We recommend that you measure the zero-point for all
observed wavelengths and the dispersion for at least one wavelength each night of your run.
8/16/94
Page 16
IRTF CSHELL User's Guide
It is also a good idea to look at the CSHELL Atmospheric Atlas kept at the telescope (kindly
provided by John Lacy @ UT) or the KPNO Solar Spectral Atlas (Livingston, W., and Wallace, L.
An Atlas of the Solar Spectrum from 1850 - 9000 cm-1 (1.1 to 5.4 µm), NSO Technical Report #91001, National Solar Observatory) as part of the wavelength calibration procedure. These atlases are
useful for evaluating the strengths and locations of any telluric absorption lines in the wavelength
ranges which you will observe. This will show you if any telluric lines will land on or near your
astronomical ones, and these lines may also be used as accurate wavelength references for
interpretation of your data while observing. You may also observe the sky at twilight to see if the
telluric lines occur in their predicted places in your spectra. Finally, OH sky emission lines can be also
used as a wavelength check (See §III.D).
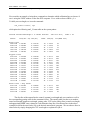
Example: Setup for HI Br !, 2.16609 µm
Suppose that you want to observe the HI Br ! line at the 2.16609 µm wavelength (given as an
example in §III.D). First select CVF/ Open from the Filter icon menu, then type this wavelength into
the Wavelen text field of the cshellxui Observing Parameters Frame. The grating is automatically
positioned to the correct angle for observation, and the CVF is moved to the selected wavelength.
Next choose the slit size you wish to observe with, and make sure that the grating is selected (e.g.
direct imaging mirror is out of the optical path) and the shutter is open. Note that the Kr lamp has
strong lines that are predicted to land at columns 50, 95, and 212 of the array (see Cal_lines Table in
§ III.D). Each of these lines must be observed to adequately measure the dispersion at the 2.16609
µm wavelength. Remember to change the CVF wavelength to the correct value (see Cal_lines Table
in § III.D) before observing each calibration line. The spectral zero point and dispersion at the
2.16609 µm wavelength may be calculated by performing a linear fit to the apparent line wavelengths
(#obs , column 3 of Cal_lines Table in §III.D) and the array columns in which they appear at the row
of interest. It is best to repeat this procedure for each wavelength you plan to observe, but it is
possible to only observe single lines at each wavelength (for spectral zero-point information) and
compute the dispersion from the Br ! dispersion using the above formulae. Be sure to record the
grating angle for each line, which can be read from the cshellxui program's main window. This angle
is also in the FITS file headers (see §III.F). Repeat this calibration procedure each night of your run.
B. Observing at the Telescope
Once you arrive at the telescope you may want to enter the coordinates of your target objects
and standard stars into the user star catalog of the IRTF DAS. This will save you from doing so later
while you are observing. Your telescope operator or support scientist can help you type in the
coordinates. The Telescope Operator will fill CSHELL with liquid nitrogen and bring up the CSHELL
software each night for you. Be sure to ask the telescope operator to rotate CSHELL to your desired
slit angle (default is East - West with North to the left on the VF display) as well as configure the
telescope focus, off-axis guider, and on-axis TV camera (focus and crosshair position) for CSHELL.
Select the proper detector and perform the system, signal, and noise checks as well as the wavelength
calibrations detailed in §II.A if you have not already done so.
8/16/94
Page 17
IRTF CSHELL User's Guide
General Observing Procedures
The general observing procedure is to image the field of your object after completing a
telescope slew. Next you must position the telescope so that your object is on the slit of the
spectrometer and then switch to spectroscopic mode. Note the position of your object on the CCD
camera display and ask the operator to start auto-guiding on it. You may use an off-axis guide star if
your object is invisible on the CCD. You will usually acquire spectral data in frame pairs, with frames
on and off of the object. It is convenient to nod the telescope by about 15" along the slit between the
“on” and “off” frames. This allows the object to be observed in both frames of a pair if the object is
not spatially extended. Be sure to nod far enough away from the object so that pixels seeing the
object in the “on” frame see nothing but blank sky in the “off” frame. The telescope operator can
enter the magnitude and direction of the nod for you, and the cshellxui software will automatically nod
the telescope between exposures if you observe in nodding mode. Keep exposure times short initially
(120-240 seconds per frame) to be sure that the telescope is tracking and guiding properly. The
telescope operator can alter the tracking rates to correct for consistent drifts.
You must select the CVF/Blocker Option and also use the shutter wheel blocker (SPF) when
observing with the 1.1 - 1.57 µm CVF! This CVF transmits # > 2.5 µm radiation, causing
significantly increased background in your data if not blocked as prescribed. The blockers impart
about a 10% reduction in flux over the 1.1 - 1.6 µm region.
You must observe celestial standard stars to correct for telluric absorption. Find a bright (V <
6) standard from either the Yale Bright Star Catalog or the IRTF standard tables. Be sure that the star
is of a satisfactory spectral type so that it does not contain any spectral features that you are attempting
to observe in your objects. You need to observe standards at a minimum of two different airmasses to
be able to fit their telluric corrections to the airmass range of your objects. Also try to observe the
standards at the same array location (row) as your objects; this will minimize CVF fringing in your
data as well as simplify both your quick look and final data reductions.
The SBRC InSb detector saturates at different count levels depending on its bias voltage (see
table below); try to keep your data values below the 1% linearity deviation for your selected bias.
Using a single fixed bias (as done with the old NICMOS array) is inappropriate because of nonlinearities and icky pixel artifacts in the SBRC 256 x 256 InSb arrays. Larger biases allow more
electrons to be collected before saturation, but they also cause increased numbers of high dark current
pixels (icky pixels) and low-level non-linearities. Fortunately, the icky pixels mostly disappear when
object and sky frames are subtracted. See § III.C.1 and Appendix F for more information on selecting
appropriate detector bias voltages.
Remember to transfer your data to magnetic tapes; it is best to do this at the end of each night
at Hale Pohaku. See §III.E for details. Also remember that telescope operators are allowed to work
no more than 12 hours at a time on the summit; plan your calibrations, observations, and data
archiving accordingly. You may stay to archive data after the operator leaves. Be sure to set the
CSHELL filter and slit wheels to their Blank positions and terminate the cshellxui software program at
the end of each night. Ask the operator to shut down the instrument if there is a danger of lightning.
See §III.B for details. See the following Observing Checklist for more details. Next we consider
some details of the observing procedure. We present a reference of observing techniques in §III.C.
8/16/94
Page 18
IRTF CSHELL User's Guide
CSHELL Observing Checklist
Before Leaving Home
Produce Objects, Standards, and Guide Stars Lists
Calculate Integration Times for Desired Sensitivities
Determine Slit Orientations
Get one 4mm or 8 mm tape for each night of your run
Read §I and §II of this manual
Daytime at Hale Pohaku or the Summit
Obtain an IRTF guest observer account (log into IRTF workstation as “guests”)
Select Calibration Lamp lines with cal_lines
Start the CSHELL Software and Check the System Status
Set Programmable Voltages (Setup Parameters Frame)
Take Signal and Noise Test Data
Take Calibration Line Data for all Grating Settings that night
At The Summit
Request CSHELL Rotation, Focus, Guider, and Crosshair Configurations
Enter Personal and Instrument Setup Information into CSHELLXUI and VF Software
Select bias macro and Set Programmable Voltages (Setup Parameters Frame)
Select First Wavelength
Image Sky or Ar lamp through Slit and Record its Column Position (Direct Imaging Mode)
Take Flat Field and Dark Frames (Spectroscopic Mode)
Slew to Object
Image Object
Move Slit to “Open” and Select Direct Imaging Mode
Choose Nod Vector for Imaging
Take Image Frame Pair of Object
Move to Slit using VF TCS Coordinates Window
Take Object Spectra
Insert Slit and Select Spectroscopic Mode
Locate Object along Slit and Choose Nod Vector
Guide with CCD Camera
Take First Spectrum (short exposure) and Evaluate Signal
Take More Spectra (longer exposures)
Slew to Standard
Image Standard
Move Slit to “Open” and Select Direct Imaging Mode
Choose Nod Vector for Imaging
Take Image Frame Pair of Object
Move to Slit using VF TCS Coordinates Window
Take Standard Spectra, Darks, and Flats
Insert Slit and Select Spectroscopic Mode
Locate Standard along Slit and Choose Nod Vector
Take Spectrum
Close Shutter, Take Dark Frames, Open Shutter
Select Continuum Lamp and Mirror
Take Flat Field Frames
Repeat Flat, Object, and Standard Observations at other Wavelengths Until Done
Take any missing Calibration, Flat Field, or Dark Frame Data
Blank CSHELL Filter and Slit from cshellxui
Quit CSHELLXUI, VF , and Guider Software; logout from Sun
Archive Data (4 mm tape drive at summit, 8 mm tape drive at Hale Pohaku)
8/16/94
Page 19
IRTF CSHELL User's Guide
Flat Field and Dark Frames
Uniform celestial illumination does not exactly illuminate the detector arrays uniformly due to
imperfections in the telescope and instrument optics. Each detector pixel also responds to illumination
differently, causing further departures from a uniform system response. However, dividing
astronomical data by a flat field made by exposing CSHELL to a uniform illumination source should
correct for these response abnormalities as long as the system responds to light linearly. The
continuum lamp is a good source of spatially and spectrally uniform illumination, and CSHELL
behaves linearly as long as each pixel has about the same number of counts in both object and flat
filed data. Therefore we can take flat field frames by observing the continuum lamp with the same
instrument state used for astronomical observations. In practice this means that you should acquire
several frames of the continuum lamp's spectrum at each wavelength and slit size employed in your
astronomical observations. Continuum lamp spectra exposure times of about 5 seconds result in
about 2000 counts through a 1" slit. You may take many flat frames (10+) by typing the number of
frames in the Cycles text field of the Observing Parameters Frame. The first step in this process is
resetting the grating order or CVF wavelengths of CSHELL from those used for calibration lines to
those used for your astronomical observations. All flat field and data frames should be taken without
moving the grating or CVF between exposures.
All exposures include a dark current contribution from the detector arrays. This current can be
a significant fraction of the signal from astronomical objects since CSHELL operates at very high
resolution. Objects are normally observed in frame pairs (on and off the source) which are subtracted
to remove this dark current contribution from the data. We must observe separate dark frames to
remove this component from the flat fields, however. This is done by turning off the calibration
lamps and closing the shutter before acquiring frames of exposure time equal to the flat field frames.
Again, many (5-10) dark frames should be acquired at a time in this manner.
Astronomical Observations
You are ready to acquire astronomical data once you have completed your calibration lamp,
flat field, and dark frame observations. All flat field and data frames should be taken without moving
the grating or CVF between exposures. The next step is to find the array column which corresponds
to the location of the slit. Do this by acquiring a direct image of the slit; insert the direct imaging
mirror (selecting imaging mode) into the light path. You may illuminate the sit with either they sky or
a discharge lamp. Record the array column which the slit is centered on; you must position your
objects on this column to observe them with the spectrometer. This is a good time to enter the slit
position, the plate scale, and slit rotation angle into the TCS Coordinates frame of the VF program
(Options menu item). VF will use this information to calculate position offsets to move the telescope
so that your objects fall on the slit.
Imaging
Bright objects (K < 9) are easily imaged in single exposures of 1 second or less. Fainter
objects require longer exposures and are best observed in a nodding mode in order to subtract the sky
background. Be sure to check the focus several times a night by imaging non-saturated objects at
different focus positions, using either a FWHM or peak pixel focus evaluation criterion. Evaluate
8/16/94
Page 20
IRTF CSHELL User's Guide
several exposures or coadds at each focus position to integrate over seeing effects. You should be able
to achieve a 1" or better FWHM source profile on nights of good seeing.
You must position your object on the slit once you have found it in the imaging field (30" on
each side). This is easily done by displaying the field in a pane of the VF program and selecting the
TCS Coordinates item from the VF Option menu. Be sure that the plate scale, slit rotation angle, and
slit position are correct, then click the left mouse button while the pointer is at the center of your
object. Next press the “F” key on the Sun keyboard to enter the mouse coordinates, and click on the
“Calculate Offset” button to calculate how far to offset the telescope. Then offset the telescope by
pressing the Offset TCS button.
It is a good idea to acquire a frame at the new telescope position to ensure that your object will
be on the slit. Once this frame is acquired (and saved if desired) you should switch to your desired
slit size and select spectroscopic observing mode (removing the direct imaging mirror).
Spectroscopy
It is best to move the telescope in the direction of the slit to position your object away from the
array center and nod about half a slit length in the opposite direction in order to observe your source in
both A and B beam positions. For example, if the slit is oriented East - West (default orientation),
then you may wish to move the telescope 7.5" east and use a 15" West nod between frames if you are
observing a point source. This would position your source spectrum nearly equally displaced from
the array center in both the on and off (A and B) frames when observing in a nod mode. It is in your
best interest to guide the telescope using a guide star in the field of either the internal CCD or offset
guider camera. Guiding is required for good signal to noise ratios. The mean of the A-B data pairs can
be accumulated in a buffer if you are taking many spectra of an object. The MeanFrame buffer is
initially set to "N/A" to disable this feature. To turn it on, select an unused buffer from its list in the
Observing Parameters Frame. This buffer will then contain the mean A-B for the current set of
cycles.
Command Files
The cshellxui and VF programs can read command files which automatically configure
CSHELL. This is a great advantage over the manual configuration of each mechanism for commonly
used instrument setups. For example, one can create and execute a command file which selects a
detector bias for spectroscopy, puts in a slit, switches to spectroscopic mode, and sets the
integrations. This is in fact what the spect command does, and it can be used to automatically
configure CSHELL for spectroscopic observations. Likewise, image will configure CSHELL for
imaging, and a VF command file can subtract 2 buffers and divide the result by the Flat Field buffer.
Command files maybe be created and edited in several ways. The current state of all CSHELL
mechanisms may be recorded into a command file by selecting the “Save Parameters” item in the
cshellxui Parameters menu. Command files may be loaded, edited, and saved with this window also.
Commands may be entered into files by either recording your real-time manipulations of the
spectrometer (check “Record” button in the Commands frame) or typing the text commands into the
edit window of the Commands frame. Command syntax is identical to the cshellxui / cshellic and VF
command line syntax; see §III.A.
Cshellxui command files are stored in the macro/cshellxui directory of your guest observer
account, and VF command files are in the macro/vf directory . These are the default directories that the
8/16/94
Page 21
IRTF CSHELL User's Guide
programs use to load and save command files. There are more macros in the ~cshell/macro
directories, and you may copy ones from there to your guest account. The most commonly used
command files are godark, goflat, image, and spect. These commands execute a series of dark
exposures, a series of flat field exposures, set up for a pair of nodded images, and set up for a pair of
nodded spectra, respectively. Command files starting with go (e.g. godark, goflat, godark) have “Go
Obs” as their last commands so exposures are actually taken when they are executed Command file
names without go (e.g. image, obs) do not contain “Go Obs” statements; exposure times or other
parameters may be modified before starting exposures if you are using these files. The commands in
these files are listed in §III.C.11. Command file execution may be usually repeated by simply
pressing the “Go” button in the cshellxui main menu; you need not re-load and re-execute the file
since the state of CSHELL has already been set by the command file. It is most efficient to use
command files for all of your observations, but keep a close eye on the exposure time, Autosave
status, and other instrument parameters; it is quite easy to start an integration with the instrument in
the wrong state. For example, you may wish to save images of the field, but the image command files
turns Autosave off.
Common VF Quick Look Techniques
The data in any buffer can be examined using the VF program. For example, suppose a
spectral frame is stored in buffer b0 and canvas A of VF is set to display an image of the buffer b0
data. Canvas C can also be set to point to buffer b0 and its display mode set to "SpectraA" or
"Spectra B" in order to show a binned spectrum of the data over some range in coordinate values.
Draw a box on the image in canvas A and select the "Obj Box" and the "X-scale" buttons in the
canvas C panel to show the spectrum of the data in the canvas A box in a graph in canvas C. These
and other techniques are described in the VF documentation, §III.A. A hard copy of the image or the
spectrum shown in the selected canvas can be obtained by selecting the print button at the bottom right
of the VF window.
You may also perform frame arithmetic on and rotate images with VF. For example, you can
co-add images to evaluate the quality of your data, divide data by standard stars to remove telluric
lines, or rotate a spectrum 180° so that you can compare it to a frequency spectrum. You can also
combine the data of the A and B beams in a differenced spectrum with the Spectra A or Spectra B
displays. If your object is in both beams in a differenced spectral image (you are nodding along the
slit), then define a box enclosing the A beam as the object and a box enclosing the B beam as the sky
and select "subtract sky" to see a display of the summed data.
VF also can edit and execute command files. This feature is convenient for performing frame
arithmetic on and displaying data once they are loaded into buffers. Several VF command files are
provided for your use.
8/16/94
Page 22
IRTF CSHELL User's Guide
III. CSHELL Instrument Reference
A. CSHELLXUI and VF Software Description and Reference
B. Turning CSHELL On and Off
C. Observing Techniques
D. Observing Spectral Lines
E. IRTF Computer Services
F. CSHELL Data and its Reduction
G. Using the CSHELL CCD Guider Camera
8/16/94
Page 23
IRTF CSHELL User's Guide
A. CSHELLXUI and VF Software Description and Reference
8/16/94
Page 24
IRTF CSHELL User's Guide
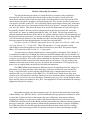
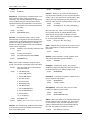
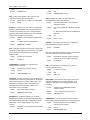
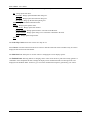
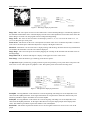
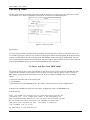
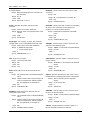
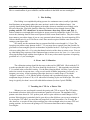
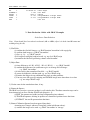
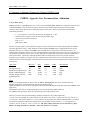
What is the IC and XUI?
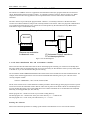
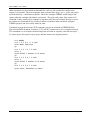
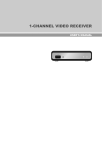
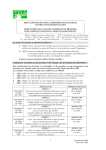
The software for CSHELL consist of 2 applications, the Instrument Control (IC) program and the X User's Interface
(XUI). The Instrument Control is named "cshellic", or commonly referred to as the IC. The IC executes on a 386PC
computer located on the telescope platform, and is responsible for the real-time control of the instrument and its
electronics.
The user's interface is provided by the program named "cshellxui", or commonly referred to as the XUI. The XUI
executes from a SUN workstation, and provides a friendly interface to the camera. These two programs communication
over an ethernet network allowing you to control and view data produce by the instrument from any IRTF's SUN
workstations. Figure 1 illustrates this setup.
Telescope's ethernet network
CSHELL
XUI & VF
IC computer
Sun Workstation
Observer on workstation
in observer's room
IC (Instrument Control) execute on
PC at telescope platform
Figure 1 -IC and XUI diagram
A word about initialization files and environment variables.
This section describes the initialization files for the IC and XUI program. Normally you will not need to modify these
files since default values are automatically setup for your account. They are described here so that you may modify them
as needed. Or so you can check them if thing are not working.
An environment variable CSHELLXUI identifies the location of the XUI executable and associated information file. For
example, if the cshellxui application is stored in /usr/local/cshell/XUI the following line in your .cshrc file would
correctly setup this variable
setenv CSHELLXUI /usr/local/cshell/XUI
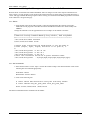
The IC, XUI, and VF all use a similar method to initialize parameters when starting up. Each program look for a special
text file and execute the commands stored in that file. These file are plain text file which contain one command per line.
You may modify them using your favorite UNIX editor. The available commands set are documented in the Command
Dictionary for each application (IC, XUI, and VF).
This IC program uses ".cshellic-init" from in your current working directory.
The XUI program uses ".cshellxui-init" from your home directory. i.e.: ~/.cshellxui-init.
The VF program uses ".vf-init" from your home directory. i.e.: ~/.vf-init.
Starting the Software
This section outlines the procedures for starting up the software. Note that there are two version of the software:
8/16/94
Page 25
IRTF CSHELL User's Guide
1. Observers version - This version is the last version of the software which has been tested in an actual
observing night at the telescope.
2. Engineering version - This version is under development or testing. This version may contain new features,
but has not been fully tested yet.
You should use the observers version, unless you were specifically told by your support scientist to use the Engineering
version of the software. The following sections describe how to start up both the observer and the engineering version.
Starting the IC
Normally the Instrument Technician will start the IC program for you. However, in case of computer crashes or other
problems, the procedure is explained here. Note only one person at a time can start the IC program. Please check with
the Telescope Operator or Instrument Tech before staring up the IC program. The procedures for starting the IC program
are as follows:
1. Log in on the IC computer (host name is cshell) as the user 'cshellic'.
a. Find the keyboard & screen for the cshell IC computer. Login as the user "cshellic". There is no password for
this account.
login: cshellic
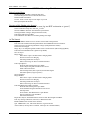
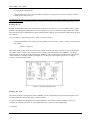
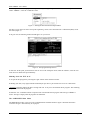
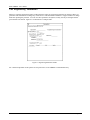
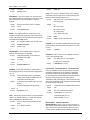
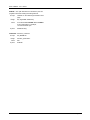
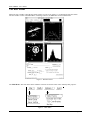
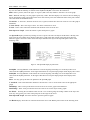
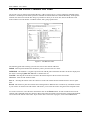
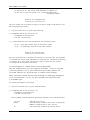
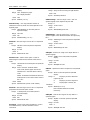
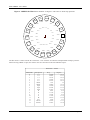
After hitting return, it takes about 90 seconds for the software to startup and display the status screen. See Figure 2 for
an example of the IC's status screen. Once this screen is display and all mechanisms show "READY", you may go
ahead and start the XUI. If any of the status show an "ERROR" state, you should try to reinitialize the item using the
??init command (i.e.: FilterInit, GOInit, GratingInit, etc..). If this fails, ask assistance from the T.O. or support
scientist to trouble shoot this failure.
Figure 2 - IC program Sample Screen
Starting the XUI
Once the IC program is running and all status is READY, you may start the XUI program. The XUI program is an X
windows applications. Here are the steps to start the cshellxui.
1. Login on the IRTF's sun workstation and start Openwindows. Your support scientist should have given you
instruction on obtaining an account. To start Openwindows, type "openwin" at the UNIX prompt.
% openwin
8/16/94
Page 26
IRTF CSHELL User's Guide
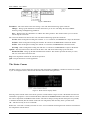
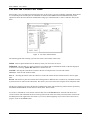
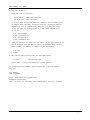
2. From OpenWindows, bring up the workspace menu by clicking the right mouse button on the workspace area.
Under "CSHELL", select the "Cshell XUI" item.
Figure 3 - Starting the XUI from the Workspace Menu
For those of you who were told to start up the engineering version, select the menu item " CShell XUI (ENG)" from
the menu (Figure 3).
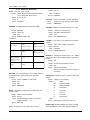
If all goes well, the following window should appear on your screen.
Figure 4 - XUI program Sample Screen.
3. Start VF. At this point you should also start VF. Access the workspace menu, under the "CShell", select the "VF"
menu item. VF should start up immediately.
Shutting down the XUI & IC
1. To quit the XUI program by selecting the "Quit" button on the cshellxui window.
2. Backup your data (every night) with the 8 mm Exabyte tape drive to prevent data loss in case of a disk failure.
! Stop here. Normally quitting the XUI is enough. The T.O. or day crew can terminate the IC program. The remaining
steps, will terminate the IC program.
3. Enter the "die" command on the IC computer. This will terminate the IC program. The message "CSHELL is
down!" message is display when all programs are terminated.
The CSHELLXUI Main Menu
The Main Menu provides you access to the command frames and other functions. Figure 5 illustrates the menu's
selections and give a brief summary of its purpose.
8/16/94
Page 27
IRTF CSHELL User's Guide
Figure 5 Main Menu
Parameters - The select button selects the 'Change..' item. The menu button bring up the sub-menu.
Change... - Brings up the 'Parameters' window which allow you to view and change the many CSHELL
observing, Setup, and Engineering parameters.
Save.. - Brings up the 'Save Parameters as a Macro File' dialog window. This window allows you to write the
current setup as a macro file.
Go - The select button select the 'Go Obs' item. The menu button brings up the GO sub menu.
Go Obs -Starts an integration creating files with the '.a' or '.b' extensions, and IMAGETYP = object in the header.
Go Dark - Starts an integration creating files with the '.dk' extension, and IMAGETYP = dark in the header.
Go Flat - Starts an integration creating files with the '.fl' extension, and IMAGETYP = flat in the header.
Go Comp - Starts an integration creating files with the '.cll' extension, and IMAGETYP = object in the header.
Options - The select button selects the 'Execute Do Files' item. The menu button brings up the sub menu.
Execute DO Files - Brings up the Edit Command Files window. This window provides the ability to create,
edit, save, load, and execute macro files.
Stop - The stop button will abort the current GO operation.
Quit - The quit button will exit the application.
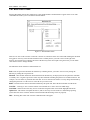
The Status Canvas
The Status Canvas is used to display the current state and configuration of CSHELL. A number of formats are available
to you. To change the format, select an item from the status canvas menu panel item.
Figure 6 - Status Canvas display 'Status'
Selecting 'status' from the status canvas menu, specifies a format similar to figure 4. This is the default selection. The
information is grouped in 3 sections labeled STATUS, SET UP and TEMPERATURE. Under Status, there is a list of
the various components of CSHELL which can take some time to change (moving the filter from point A to point B)
or should be monitored (like the amount of time left in an integration). Each item may show 3 possible states.
OK - This item is ready to receive commands.
BUSY 99% - This item is currently in motion or in use. A new command concerning this item cannot be issued until it
has completed its current motion.
8/16/94
Page 28
IRTF CSHELL User's Guide
ERROR - A malfunction has occurred either in software or hardware. The software task should be initialized after
inspecting the hardware related to that item.
For example, a filter command will be accepted only when the filter status is OK. After the command is accepted, its
status will change to BUSY. While the filter is moving, no new filter commands will be accepted and the percentage
complete is updated to provide visual feedback. When the filter has reached its new position, the status will return to
OK.
The SETUP shows some important setup parameters. In the example, the CSHELL is currently using the SBRC array.
TEMPERATURE displays the current temperature readings from the sensors. There are 4 sensors and their values are
shown in Kelvin.
Under the Status Canvas, there are 4 buttons labeled Status, Motors, TempCntl, About.... Selecting the different
buttons will allow you to view the different status screen available. There different format are not explained in detailed
here, but it is suggested you check them out.
8/16/94
Page 29
IRTF CSHELL User's Guide
The Parameter's frame.
The Parameters frame allows you to view and edit the most common CSHELL parameters. These parameter are
separated into 3 groups: Observing, Setup, and Engineering. The first set of blue buttons on the Parameter's frame
allows you to switch between these groups. You may view/edit each set of parameter by selecting the proper group.
Each time you select a group the Parameter's frame appearance will change to display the appropriate parameters.
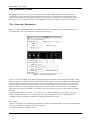
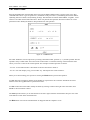
The Observing Parameters.
When you select the 'Observing' button on the Parameter's frame, it will display the most common parameters used
while observing. Figure 6 is an illustration of the frame for Observing.
Figure 7 - Observing Parameter Frame
The row of icons in the middle of the window represent mechanical components in the optical path. From left to right,
each icon represents a component which can alter/redirect/block the light as it enters the CSHELL and travels through it.
On top of each icon, the name of the component is shown. On the bottom, its current value or setting is shown. For
example, look at the shutter's icon and you can see it is currently open. Each icon is colored gray or yellow. Yellow
shows that an item is in the optical path, while gray shows you that an item is either blocked or moved out of the
optical path. For example, if the Filter is set to blank, all the icons to the left will be gray since the filter is blocking
the light.
The other prompts and menu are usually self-explanatory. For a detailed explanation of each options, refer to the
CSHELL Command Dictionary. For example if you wish to know what happens when you change the value for
'CVFWlen', look up 'CVFWlen' in the dictionary. A detailed explanation is provided.
Special Notes:
1. Input a wavelength or wave number into the "Wavelen" parameter to move the grating to the desired wavelength. The
CVF is also automatically changed to the proper wavelength.
2. Coadds is the number of coadds per beam.
8/16/94
Page 30
IRTF CSHELL User's Guide
3. Cycles determines the number of times an observing mode is repeated.
4. "ObsMode" determine how many beam switches are done.
5. After the 'Lastframe' label you are presented with 3 panel items: Buffer, -Dark, /Flat. These items control how the
data is sent to the VF program upon reading out the array. In stare observing mode, data is sent to the buffer specified.
In nod observing mode, after each object-sky pair, the difference frame is sent to the VF program. If the -Dark or /Flat is
checked, a dark frame is subtracted from the data and it is divided by a flat frame.
The 'MeanFrame' is also contain similar panels. If you do a GO with cycles greater than 1, you can calculate the mean
of all the frames sent to VF.
If a MeanBuffer is specified, each time data is placed into Lastframe-buffer, the mean of all the frame in the current cycle
is calculated an placed into this buffer. The -Dark and /Flat, specifies the processing done when calculating the mean
frame.
In VF, there are two special buffers, a dark buffer and a flat buffer. You must load data into these buffers if you specify
the -Dark or /Flat options.
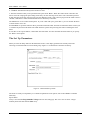
The Set Up Parameters.
When you select the 'Setup' button on the Parameter's frame, it will display parameter not normally used while
observing, but which should be reviewed during setup. Figure 7 is an illustration of the frame for 'Setup'.
Figure 8 - Calibration/Set Up Frame
The items are usually self-explanatory. For a detailed explanation of each options, refer to the CSHELL Command
Dictionary.
Special Notes:
Always select the Set Programmable Voltage button on the Setup page. The user's must set these voltages
manually before take data with the SBRC array.
8/16/94
Page 31
IRTF CSHELL User's Guide
The Engineering Parameters.
When you select the 'Engineering' button on the Parameter's frame, the engineering parameter are displayed. These are
parameters which should not be changed by casual observer. The Instrument Technician or support scientist can change
them after inputting the password. You can view these parameters at anytime, but they can only be changed after the
password has been entered. Figure 8 is an illustration of a sample frame.
Figure 9 - Engineering Parameters Frame
For a detailed explanation of the options for each panel item, see the CSHELL Command Dictionary.
8/16/94
Page 32
IRTF CSHELL User's Guide
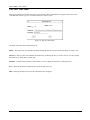
The Save Parameters as a Macro File frame.
Selecting the 'Save Parameter' menu item from the `Parameters' sub menu causes the Save Parameters as a Macro File
command frame to appear. Through this frame, you can create a macro file of the current setting of the following
parameters:
Figure 10 - Save Parameters Frame
The panel items inside this frame are:
DoPath - This text panel item identifies the sub directory used for accessing command or macro files. You may change
this directory by editing this panel item.
Filename - The macro file is created using this filename. You may change the filename by editing this field.
Save - Selecting this button will execute the 'SaveSetUp' command, which crates a macro file using your current setup.
Hide - Selecting this button will cause the frame to disappear from the computer screen.
8/16/94
Page 33
IRTF CSHELL User's Guide
The Edit and Execute Files frame.
XUI provides a way of creating and executing macro files. A macro file is a text file containing commands. There should
be 1 command per line and the syntax for commands are defined in the CSHELL XUI Command Dictionary. In the
Options sub menu, the choice 'Execute command files' brings up a command frame to create or edit files, and execute
them.
Figure 11 - 'Do' Files command frame
The following panel items will help you read, edit, and save the contents of macro file:
DoPath - This text panel identifies the sub directory where your macro files are stored.
DoFileMask - The file mask is a regular expression used with the path to determine the names of the files displayed
in the file list. Selecting Update File List will re-initialize the list.
Load File - Selecting this reads the file selected in the file list and places the text in the edit window.
Clear text - Clear the edit windows buffer.
Save as - Selecting this button writes the current text in the edit window into the filename shown in the text panel
item.
Record - This check box panel item controls the recording function. When the box is checked, any commands executed
by XUI will also be written to the edit window. This allows you to write macro files using the mouse and panels items.
The file list is identical to the one in the Execute Command Files frame. The sub directory and file mask is specified by
the DoPath and DoFileMask variable which are shown in the Execute frame.
To execute a command file, select the file in the list then click on the Execute button. XUI will read the file and
execute each line. The commands and its error message ('Error None' when successfully executed) will be written to the
Feedback panel on the Application's base frame so you can see what's happening. If you wish to abort a macro file in
progress, click on the Cancel button.
8/16/94
Page 34
IRTF CSHELL User's Guide
Moving the IC computer between the Summit & Manoa
Because the PC is used both at the summit and Manoa, there are changes in some of the setup file which need to be
done to allow it to work properly at each location. The manoa host name is 'cshell-manoa'. The summit host name is
'cshell'. This page identifies the changes required. This is mostly just a reminder for the IRTF programmer or technical
staff. Cshell users can ignore this page.
File: /bin/rc
a. At the bottom of the file the rdate program is called to initialization the date and time at boot time.
Additional line call programs at boot time to initialize the DIO board and PC-38 to mode friendly with
CSHELL.
Change the comment to use the approriation line. For example, on the summit it would be:
#---------------------------------------------------------------# Addition startup command added by Tony Denault, IRTF Programmer
#---------------------------------------------------------------/usr/local/bin/rdate herschel
#/usr/local/bin/rdate wirth
# These lines initializes the DIO48 board. It set the mode to
# 0x82 (output, input, output) and write 0's to ports A, C.
#
/usr/local/bin/pc38io -o 643 -d 130
/usr/local/bin/pc38io -o 640 -d 0
/usr/local/bin/pc38io -o 642 -d 0
# This line initialize the PC-38 to power automatic mode.
/usr/local/bin/pc38io ` rs;arpa;aspa;atpa;aupa;avpa;axpa;aypa;'
File: /net/rc.network
a. Insure the host name is correct. nsfpc is used on the summit. irlabpc is the manoa hostname. Look for the
following lines and comment appropriately.
hostname cshell
#hostname cshell-manoa
b. Look for the following line:
#
#
Mount remote NFS directories using the following format:
mount remhost:rem_dir_path_name local_dir_path_name
mount wirth:/home/wirth /home/wirth
The mount command should be commented on the summit.
8/16/94
Page 35
IRTF CSHELL User's Guide
CSHELL XUI / IC Command Reference
Array - Set the size and location of sub-arrays to be
readout for r the next GO. These coordinate are relative to
the physical device. You data is normally viewed rotated
90˚ clockwise.
Prompt
Array_icon on the Parameters screen, OBS
page.
Range
x y wid hgt - The (x,y) location of the upper
left corner and its width and hgt is specified.
Please note that these values must be
multiples of 8.
Initial
Syntax
Full size (0 0 256 256).
Prompt
Range
Initial
Syntax
Prompt
Range
Prompt
Range
Syntax
Initial
Syntax
Off
- Data is not saved by the IC.
Off
AutoSaveIC { off | on }
AutoSaveXUI - Determines whether the data is saved
by the XUI program.
Range
'AutosaveXUI' on the observing parameter's
Obs page.
Off
- Data is not saved by the XUI.
On
- The XUI program on the SUN
saves the data.
Initial
Syntax
Prompt
Off
AutoSaveXUI { off | on }
Initial
Syntax
CamMode - Specifies the clocking and readout modes in
the GO sequence.
Range
N/A
Basic- Acquires single images with just the
basic options.
SIM- Simulation mode. Allows the software to
be used with out the actual camera
hardware.
Initial
Syntax
Basic
CAMMODE { basic | sim }
ChgClkBias -.Changes the bias voltage to the
clock/bias DAC. This is an engineering command.
8/16/94
1 to 16.
Volts:
-10 to 10.
N/A
CHGCLKBIAS board dac volt
'Coadd' on the observing parameter's Obs
page.
1 ti 32000
1
COADD num
None
OFF or ON.
OFF
COLOR { off | on }
Comment - Specifies a string to be place in the fits
header of the saved file as a comment.
Prompt
Range
Initial
Syntax
Prompt
DAC
Color - Indicate to the IC program whether the console
supports color for text output. The character attributes for
color or monochrome are selected based on this
parameter.
Range
Prompt
1 to 4.
Parameters window in the Setup page,
On
- The IC program on the PC saves
the data.
Initial
Board
CoAdd - The number of intergrations summed together
per beam or chop position in a GO.
ARRAY x y wid hgt
AutoSaveIC - Determines whether the data is saved by
the IC program.
'ChgClkBias' button on the Observing
Parameter's Engineering page.
'Comment' on the observing parameter's Obs
page.
Any string up to 40 characters.
Undefined.
COMMENT string
Cycles - Cycles is a repeat factor in a GO sequence
under basic mode. For the ObsMode NoiseImage, Cycles
indicates how many frames will be used to calculate the
noise.
Prompt
Range
Initial
Syntax
'Cycles' on the observering parameter's Obs
page.
1 to 1000.
1
CYCLES num
CVFwlen - When a CVF filter is selected, this parameter
specifies the wavelenght for the CVF filter. Setting the
CVFWlen update the user's order, which specifies which
Page 36
IRTF CSHELL User's Guide
order to be used by grating to observe at the wavelen
specified by CVFwlen.
Prompt
Range
Initial
Syntax
'CVFWLen' on the Filter Wheel Dialog Box.
window in the XUI program. This command can only be
executed from the XUI program.
Prompt
1.0 to 2.449, or 2.46 to 5.6
Range
2.20
CVFWLEN num
Initial
Syntax
Die - This command stops the execution of the IC
program. This command can only be executed from the IC
program.
Syntax
DIE
DiMirrorInit - The command to initialize the Direct
Imaging Mirror. The DiMirror places the insturment in
spectrscopic or imaging mode.
Syntax
DIMIRRORINIT
Display - This command selects the various screen
layouts on the IC program. This command can oly be
executed form the IC program.
Prompt
Range
XUi_PROMPTS
0 - Displays the most common observing
parameters.
1 - Display the descriptive text parameters.
2 - Display the engineering parameters.
Initial
Syntax
Range
Initial
Syntax
DISPLAY num
*
DOFILEMASK string
DoPath - This path identifies the subdirectory where the
XUI program will search for DO or macro files. The $HOME
and $DATE macros are supported. This command can only
be executed from the XUI program.
Prompt
Range
Initial
Syntax
'DoPath' on the Execute Do Files window.
Any legal UNIX subdirectory
$HOME/macro/camxui
DOPATH string
DSPResetMSec - Specifies the amount of time in
millisecond between array reset. Array resets are
performed during idle periods.
Prompt
Range
Initial
Syntax
'DSP Reset Msec' on the observing
parameter's Eng page.
500 to 10000 milliseconds
1000
DSPRESECMSEC num
DSPSampleMode - Specifies the sampling mode used
to readout the array during a GO.
Prompt
'Sample Mode' on the observing parameter's
Eng page.
Range
Single - A single sample is done by reseting
the array. After the integration time has
passed the array is readout to produce an
image.
'DoFastMode' on the observing parameter's
Eng page.
Off
- Slow clocking mode.
On
- Fast clocking mode.
Double - After an array reset, a pedestal
image is readout. After the intergration time,
a sample image is readout. The final image is
the result of the sample minus the pedestal
readout.
Off
DOFASTMODE { off | on }
DoFile - This command starts exection of a macro file.
Prompt
See Execute Command File in the XUI User's
manual.
Syntax
DOFILE filename
DoFileMask - This command sets the pattern string
used in creating the file list on the Edit and Executed File
8/16/94
Any string.
0
DoFastMode - Select the fast or slow clocking mode by
setting Fastmode on or off. This is an engineering
command.
Prompt
'DoFileMask' on the Execute Do Files
window.
Initial
Syntax
Double
DSPSAMPLEMODE { single | Double }
DTime - Specifies the dead time after a beam swith in
seconds.
Prompt
Range
'Beamswitch DTime' on the observing
parameter's Setup page.
0 to 10 seconds.
Page 37
IRTF CSHELL User's Guide
Initial
Syntax
2
Range
Syntax
'epassword' on the observing parameter's
Eng page.
Any string
EPASSWORD string
Filename - The filename's prefix is used ot create
filenames when saving data to disk. New filenames are
constructed by concatendating Filename with the Image
Number, then adding a file extension. For example, if
Filename is '01jan' and image number is 45, the data file
saved could be '01jan045.a'.
Prompt
Range
Initial
Syntax
'Filename' on the observing parameter's Obs
frame.
FIlterPos - Allows you to position the filter wheels to
any step position. Normaily you may only offset the wheel
position -100 or +100 steps from its normal location. After
entering the engineering password, this restrictions is
removed, but be careful of flashing the array in this mode.
Range
Syntax
FILTERPOS { A | B } step# [ {A|B} step# } ]
Syntax
GO [{ obs | dark | flat | comp }]
GoInit - Initializies the go task in the IC program. The go
task is responsible for controlling the DSPs and Array's
electornics.
Syntax
GOINIT
A string of 8 characters
The current date in the form DDMMM
FILENAME string
Filter - Select a filter combination using the 2 filter
wheels. The selection are indicated by the index values.
Range
1 to 40000 .
Go - Performs a GO, which is a set of integrations. The
GO command can take an optional parameter which
determines the type extension for filenames in basic
mode. Please read the section description of CamModes
for a more complete description.
GoReset - Places the DSP in a reset operation mode.
The go task's state will be change to ERROR.
Syntax
Prompt
FILTERINIT
DTIME sec
EPassWord - The Epassword command allows you to
enter a password. After entering the password
sucessfully, any restrictive parameters (ie engineering)
can be modified. Issing the command with an invalid
password will cause those parameters to be restricted.
Prompt
Syntax
Click on the FIlter Icon on the observing
parameters window.
0 - CVF Wlen & Open
GORESET
GratingInit - Initializes the grating. The grating is
initialized by reading the step position from the encoder to
set the step postion of the grating's stepper motor.
Syntax
GRATINGINIT
1 - 2.35 um NBF & Open
2 - 4.05 um NBF & Open
3 - He 1.083 & Open
4 - HI 2.167 & Open
5 - Both wheels blank
GratingPos - Commands the grating's stepper motor to
move to a specific step position.
Syntax
Range
GRATINGPOS
100000 to 400000
6 - CVF Wlen & Open
7 - 2.35 um NBF & Blocker
8 - 4.05 um NBF & Blocker
9 - 2.5 um Blocker
10 - 4.1 um Blocker
Initial
Syntax
Blank Blank 2.20
FILTER { 0 | 1 | 2 | 3 | 4 | 5 | 6 | 7 | 8 | 9 | 10 }
FilterInit - This command will initialize the filter wheels
by moving them to their limit switches and then moving
them to their initial position.
8/16/94
GratingRMove - Moves the grating from its current
position by a relative number of steps.
Range
Syntax
-2000 to 2000
GRATINGRMOVE steps
GWLen - Moves the grating to the indicated wavelenght.
First the optimum order is calculated. The user's order is
set to the optimum order. Then the step position of the
grating is determined from the inputted wavelenght and
this order. The grating is moved to this position.
Prompt
See 'WaveLen' command.
Page 38
IRTF CSHELL User's Guide
Range
Syntax
1.0 to 6.0.
Initial
Syntax
ITIME sec
GWLEN micons
ICHostName - The XUI program uses this hostname
when initiating network communication to the IC program.
This command can only be executed from the XUI
program.
Range
Syntax
Enter the hostname of the IC computer
Lamp - Turn off/on the calbration lamps This command
automaticly move the lamp mirror out when the lamps are
turned off, and in when the lamps are on.
Prompt
Range
'Cal_Lamp' icon on the Parameter window's
Observing page.
off
cshell
AR - Argon Lamp
ICHOSTNAME name
KR - Krypton Lamp
XE - Xenon Lamp
ICPath - The path identifies the subdirectory the IC
program uses when writing data files. This command will
create new subdirectories if path doesn't exist. Supports
the $DATE and $HOME macors.
Range
Initial
Syntax
Cont - Continuum Lamp
Initial
Syntax
$HOME/data/$DATE
ICpath string
LampInit - The command to initialize the lamp and lamp
mirror by turning the lamp off and moving the mirror out of
position.
Syntax
Range
Initial
Syntax
'Next Image Number' on the observing
parameters Obs page.
1 to 9999
1
IMAGENUMBER num
InstMode - Places the instrument in Spectrocopic or
Direct Imaging mode by moving the Direct Imaging mirror
out or in.
Prompt
'Instrument Mode' menu is accessed by
clicking on the Grating or DiMirror icon on
Parameter's Observing page.
Range
S (Spectroscopic) Optical path is through
grating.
D (Direct Imaging) Blocks the grating
Initial
Syntax
S
INSTMODE { S | D }
Itime - The amount of time the array is exposed between
readouts, or the time interval for 1 Coadd. The minimum
value is determined by the readout rate.
Range
Initial
8/16/94
'Itime' on the observing parameter's Obs
page.
0.1 to 3600.0 seconds
1
LAMPINIT
LampMirror - More a mirror so the calibration lamp are
out or in the optical light path.
Range
Out - lamps are out of optical path.
In- lamp are in optical path.
Syntax
LAMPMIRROR { out | in }
LastFrmBuf, LastFrmSubDark, LastFrmDivFlat These are switches used by the XUI program to process
each frame of data during a GO operation. LastFrmBuf
identifies the buffer in the VF program which will display
the data. When set, LastFrmSubDark and LastFrmDivFlat
will cause some processing of the data frame by
subtracting a dark and dividing by a flat. The dark and flat
frames are identified by the VF program as the data loaded
into buffer 5(Dark) and 6(Flat).
Prompt
Range
Initial
Syntax
Prompt
LAMP { off | AR | KR | XE | Cont }
Any legal unix subdirectory. 80 chars max.
ImageNumber - An ID number used to create the
filename. See Filename for an example.
Prompt
Blank
'LastFrame' on the Calibration/Setup frame.
N/A
Buf = b0, -Dark and /Flat are off.
LastFrmBuf {0 | 1 | 2 | 3 | 4 | 5 }
LastFrmSubDark {off | on }
LastFrmDivFlat { off | on }
MeanFrmBuf, MeanFrmSubDark,
MeanFrmDivFlat - During a GO you have the option of
accumulating the data and displaying a mean frame at the
end of each cycles. These parameters allow you control
over this option. The MeanFrmBuf identifies the buffer in
Page 39
IRTF CSHELL User's Guide
the A beam and a 'object' frame is taken.
Then the telescope is positioned a the B
beam and a 'sky' frame is taken.
the VF program uses to display the mean frame. If set,
MeanFrmSubDark and MeanFrmDivFlat will cause some
processing of the mean frame by subtracting a dark and
dividing by a flat frame. The dark and flat frame are
identified by the vf program as the data loaded into buffers
5(Dark) and 6(Flat).
4 - Noise Image. This is a special mode used
to produce noise images. For each cycle a
image is readout. Using these images, the
standard deviation of each pixel is
calculated. A frame is produced where each
pixel position contains the standard
deviation of that pixel position. These value
are multipled by 100 to preserve decimal
information.
Note: This option consumes much of the CPU's execution
time and should only be used during GO with long
integration times( greater than 15 seconds ).
Prompt
Range
Initial
Syntax
'Meanframe' on the Calibration/Setup frame.
N/A
Buf = N/A, -Dark and /Flat are off.
MeanFrmDivFlat { off | on }
Object Name - This information identifies the object
you are observing and is placed in the fits header.
Range
Initial
Syntax
'Object' on the observing parameter's Obs
page.
Any string up to 40 characters.
'Name of Object'
OBJECT string
Observer - This information identifies the observers and
is placed in the fits header.
Prompt
Range
Initial
Syntax
'Observer' on the observing parameter's Obs
page.
Range
Prompt
Range
Initial
Syntax
OBSERVER string
'Obs Mode' on the observing parameter's
Obs page.
0 - Obj(A) integrates at the present beam
position. This data is treated as an 'object'
frame.
3 - Pair (AB). In this mode, a pair of frames
are taken. First the telescope is position at
None. Enter command at prompt.
8 to 60
Optimum order
ORDER num
PVoltage - Sets the user programmable voltage's
VDDUC and VDET on the clock bias board.
Prompt
'Your name'
1 - Sky (B) integrates at the present beam
position. This data is treated as a 'sky'
frame.
8/16/94
OBSMODE num
Order - Set the user's order. The grating wavelenght is
calculated based on the grating angle (step position) and
an implied order. This implied order is called the user's
order. Normal the user's order is set to the optimum order
for a given wavelenght. This command allows you to
change the user's order.
Any string up to 40 characters.
ObsMode - The observing mode determines the beam
switch pattern performed in a GO sequence and when in
the sequence the files are saved. The obmode is identified
by an index number
Prompt
Syntax
0
MeanFrmBuf {0 | 1 | 2 | 3 | 4 | 5 }
MeanFrmSubDark {off | on }
Prompt
Initial
Range
The observing parameter's Setup page
contains prompts for set the voltages. First
input the appropriate values in VDDUC and
VDET. Then select the 'Set Programmable
Voltages' with the mouse to send these
values.
VDDUC range is -3.75 to -2.505 volts.
VDET range is -3.75 to -2.505 volts.
In addition, vdet >= vdduc and (vdetvdduc)<=1.5 volts.
Initial
Syntax
Undefined. You must initialize the voltage as
part of your startup procedures.
PVOLTAGE vdduc vdet
PWindow - The PWindow variable indicates which
parameter page should be displayed in the Observing
Parameters frame.
Prompt
Range
Set of Blue colored button in the upper-right
corner of the Observing Parameter frame.
1 - Obs. Displays is most commonly changed
Observing parameters.
Page 40
IRTF CSHELL User's Guide
2 - Setup. Displays the setup parameters.
These parameters should be examine at the
start of you observing session.
3 - Eng. Displays the engineering
parameters. These are restricted parameters
mostly dealing with the array electronics.
Initial
Syntax
0
Range
Range
Shutter
Open
Close
2.5SPF
Initial
Syntax
Close
SHUTTER {Close | Open | 2.5SPF }
PWINDOW { 0 | 1 | 2 }
RotateImage - This option automaticly rotates the
image clockwise 90˚ in the obsmode Stare and Nod.
Prompt
Prompt
ShutterInit - This command initializes the shutter wheel
by searching for it limit switch, then moving the shutter to
the closed position.
None. Enter command at command prompt.
Prompt
None. Enter command at command prompt.
Off - No rotation performed.
Syntax
ShutterInit
On - Rotates the image.
Initial
Syntax
On
ROTATEIMAGE { Off | ON }
Samples - This parameter identifies the number of
samples or times the array is readout to obtain the image
for 1 coadd. Note that increased the number of samples
will lower you noise, but will also increase you minimum
integration time. This is a engineering or restricted
command.
Prompt
Range
Initial
Syntax
'Samples' on the Observing Parameter's Eng
page.
1 to 256.
1
ShutterPos - Allows you to move the shutter to an
absolute step position.
Prompt
Range
Syntax
Prompt
'Save Parameters' on the main menu access
the Save Parameters as a Macro file
Frame.
Syntax
SaveSetUp filename
Prompt
Range
Initial
Syntax
Syntax
SETMOTORDY
Shutter - Selects a shutter wheel position.
8/16/94
ShutterPos step#
Slit
0.5, 1.0, 1.5, 2..0, 4.0, Blank, Open, J, H, K,
L, L', M
Blank
Slit {0.5 | 1.0 | 1.5 | 2..0 | 4.0 | Blank | Open | J
| H | K | L | L' | M }
SlitInit - Initializes the slit wheel by moving it into the
limit and then setting it to BLANK.
Prompt
None. Enter command at command prompt.
Syntax
SlitInit
SlitPos- Move the slit wheel to a step position
Prompt
Range
SetMotorRdy - This command sets the status for all the
motorized items (filter, dit, len, pplate) to the READY
state. This command is intended for engineering purposes
only. Since all item must in in a ready state before a GO is
accepted, this command clears any ERROR condition due
to mechincal failures. Do not attempt to move any motors
which has been set ready using this command. This is an
engineering or restricted command.
0 to 4999
Slit - Select and moves to a slit wheel position.
SAMPLES num
SaveSetUp - Ceates a macro file of some of the current
parameter in the dofile directory. This command is used
only by the XUI program.
None. Enter command at command prompt.
Syntax
None. Enter command at command prompt.
0 to 64000
SlitPos step#
SlowCnt - When DoFastMode is OFF, the SlowCnt
variable specifies the numbers of NOP's or delays in the
DSP clocking algorithm. This effectively slows down the
clocking pattern which lowers the readout rate and read
noise. This is an engineering or restricted command.
Prompt
Range
'SlowCnt' on the Observing Parameter's Eng
page.
1 to 100.
Page 41
IRTF CSHELL User's Guide
Initial
Syntax
1
SLOWCNT num
Range
Initial
Syntax
Stop - During an integration or GO cycle, the stop
command is used to abort the acquisition.
Prompt
'Stop' button on the XUI's command frame.
Syntax
STOP
SubArray - Load the size and position of the default
subarray. These parameters are used when setting the
subarray from the XUI's array icon on the Parameter's
Observing page. These parameter refer to an unrotated
image. This is an engineering command.
Prompt
Range
Syntax
'SubArray' on the Parameter's Engineering
Page.
x, y, wid, hgt must be a multiple of 8.
SUBARRAY x y wid hgt
Range
Syntax
Any legal TCS command.
TCS string
TCSHostName - Identifies the computer host
accepting TCS commands.
Range
Initial
Syntax
The current TCS host is 'planck'
'planck'
TCSHOSTNAME name
TempCmd - Sends a commands to any of CShell's two
Temperature Controllers. Any string after the TempCmd is
send to the temperature controller. Please refer to the
Description of Hardware section or the temperature
controller's manual for the correct syntax for the
temperature control commands.
Range
Syntax
Prompt
Range
Initial
Syntax
Prompt
8/16/94
'TempRecord' on the Observing parameter's
Eng page.
Click on the VCCD Icon on the observing
parameters window.
Out - VCCD Dichroic and ND filter out of light
path.
Out
VCCD { out | in }
VCCDInit - The command to initialize the visible CCD
dichroic/Netural Density filter assembly.
VCCDINIT
VF - Commands VF from the XUI program. This command
can only be executed from the XUI program.
Range
Syntax
Any legal VF command. See the Command
Dictionary for the VF program for syntax.
VF command
Wait - Sets the acquire or Go task busy for a time
interval specified seconds.
Range
Initial
Syntax
0.1 to 60.0 seconds
N/A
WAIT sec
Wavelength- This command changes the value of the
CVFWlen and GWLen. It is provide to allow the use to
change the grating and CVF wavelenght with a single
command.
Prompt
WaveLen on the Parameters window
Observing Page.
Range
1.10 to 2.449, 2.46 to 5.60 microns
Syntax
TempRecord - TempRecord allows you to switch
OFF/ON the recording to temperature information. When
ON, the temperature information is appended to the file
'temper.log'. The recording interval is once every 5
minutes.
TEMPRECORD { off | on }
In - Places the VCCD Dichroic and ND filter in
light path.
Any legal controller command
TEMPCMD { A | B } string
OFF
VCCD - Selects the position for the visible CCD
dichroic/Netural Density filter assembly.
Syntax
TCS - Using this command you may send a string to the
Telescope Control System (TCS). This string is assumed
to be a correct TCS command with a 40 character
maximum limit.
OFF or ON.
WAVELEN num
XUIHostName - The IC program uses this hostname
when initiating network communication to the XUI program.
Range
Initial
Syntax
Enter the hostname of the workstation
running the XUI interface.
Planck
XUIHOSTNAME name
Page 42
IRTF CSHELL User's Guide
XUIPath - This path identifies the subdirectory the XUI
programs uses when reading and writing data file.
Prompt
Range
Initial
Syntax
'XUIPath' on the Observing Parameter's Obs
page.
Any legal UNIX subdirectory
/scr1/nsfcam/data/DDMMM. Where DDMMM
is the current date. For example,
/scr/nsfcam/data/01jan.
XUIPATH string
Command - Describe_command.
Prompt
Range
Initial
Syntax
8/16/94
XUi_PROMPTS
describe_parameters.
N/A
SYNTAX
Page 43
IRTF CSHELL User's Guide
What is VF?
The VF software is a tool used to View Fits data files. A brief description of its capabilities are:
• Manipulate fits images of up to 2048 by 2048 pixels using 32 bits per pixel.
• Provides 8 buffers and 5 canvases for holding and viewing.
• Provide various mode of display such as imaging, histogram, line cut, plus other specialized modes.
• Allows the user to perform arithmetic operation on the fits data.
• Provides tools the calculate box photometry and statistics on pixels.
• Produces postscript files of graphics for hard copy output.
• Provides the ability for the instrument control software to send commands and data to VF.
VF runs on a Sun Workstation under Sun's Openwindows software. It is an X windows application developed using the
XView tool kit by the NASA Infrared Telescope Facility. The user interface conforms to the Openlook GUI
Specifications. Before using VF, you should become familiar the Openlook User Interface.
If you have questions or comments concerning VF, you may contact the author of the software via email at
[email protected] or by calling the IRTF at (808)956-8101.
Setting up your user account
Since VF is an IRTF in-house software application, it is already installed on IRTF all workstations. If you wish to
have this application installed on your own workstation, please see the IRTF computer staff for more information. This
section will cover the setup information needed on you user account to run this application. To setup your account, you
will need to know where the application is stored on the hard disk. Normally the IRTF will install it in /usr/local/VF,
however you should check with the computing staff on this. The directory /usr/local/VF will be used as an example in
this document.
1) Setting the environment variable $VFHOME.
Create a environment variable $VFHOME to equal the name of the sub directory where the application is stored on your
hard disk. For example, each user can place the following line in the .login file to set VFHOME to '/usr/local/VF':
setenv VFHOME /usr/local/VF
2) Startup configuration file .vf-init.
This step is optional, but highly recommended. When VF starts up, it searches for the file .vf-init in your home
directory. If this file exist, VF expects it to contain VF commands. See VF Command Dictionary for the syntax. Using
an text editor you can place instructions in this file to configure when it starts up VF. For example, the file may
contain the following instruction to setup the directory paths and printer name.
Path $HOME/protodat
FileMask *.img
DoPath $HOME/macro/vf
DoFilemask *
8/16/94
Page 44
IRTF CSHELL User's Guide
printer irlabpr
Starting VF
The VF program is a Xwindows application. You should be running an X server on your console. Openwindows is the
default X server for sun workstations. There are two methods to start VF:
1. Starting VF using the workspace menu. The workspace menu has been configured to include a selection to start up an
instance of the VF program. Press the menu (or right) mouse button on the workspace to bring up the workspace menu.
Then click on 'Cshell" with the menu button to display its submenu. Select 'VF' with the select (left) button to begin
execution of the VF program.
2. To start VF from a xterm or shelltool window, type 'vf' in the window.
unix% vf &
At this point the base window of the application should appear on your screen. Sometimes the following message may
appear in your console window.
Run VF without Sockets? (y or n) <CR):
If you are running VF with the instrumentaion software, you must run VF with sockets. Otherwise you may run
VF without sockets. When VF starts it tries to establish a socket to allow data and commands to be sent to it from the
instrumentation program. This message can appear because:
1) VF is already running on the machine.
2) The operating system has not cleared the socket a previous version was using. If you just exit the program, it will
take the operating system a few minutes to destroy the socket. During this period, you cannot establish another VF
socket. Just wait 30 seconds and try again. (And maybe again).
8/16/94
Page 45
IRTF CSHELL User's Guide
The Base Frame
When VF starts a window called the base frame appears on your screen. Figure 1 is an illustration of the base frame.
The base window consist of the Main Menu, 4 Viewing Canvases, the Main Panel and a Feedback Panel.
Figure 1 - The Base Frame
The Main Menu - The main menu and its submenu selections are shown below with a summary their purposes.
Figure 2 - Main Menu
8/16/94
Page 46
IRTF CSHELL User's Guide
Description of Menus - Here is a description of the menuing hierarchy.
File - Brings up the file menu.
Read Data - Brings up the Read Data File dialog box.
Save Data - Brings up the Save Data File dialog box.
Save Setup - Brings up the Save Setup dialog box.
Math - Brings up the Math command window.
Options - Brings up the Options menu.
Stats Frame - Brings up the Stats window.
Execute 'Do'Files - Brings up thewindow to edit and execute DO files.
TCS Coordinates - Brings up the dialog box to send offset commands to the TCS.
Set Up - Brings up the Setup window.
Quit
The Color Map Canvas shows the current color map in use.
Four Canvases. Located on the base frame are 4 Canvases with horizontal and vertical scrollbars. They are used to
display the data stored in VF's data buffers.
The Main Panel. The main panel is used for control or changing the various display options.
The Feedback Panel. Selecting buttons or changing values of the various menu or panel item usually generates a
command to VF to manipulate the data or change the display. These commands and the error message from vf are
displayed in the Feedback Panel. In this way you can see the commands and responses generated by your actions.
8/16/94
Page 47
IRTF CSHELL User's Guide
The Canvas
The canvases are used to display the data. There are 5 canvases identified by the letters A, B, C, D and E. Canvases A to
D are 256 by 256 pixels in size and are located on the base frame. Canvas E is located in a command frame window
which can be re-sized. To bring up Canvas E, select its panel button on the main panel. An example of a canvas shown
in figure 3.
The information area shows some textual information about the data. The left hand side shows the buffer, the
filename, and the divisor variable. For example, "B1=01jan0092.fts / 6" means this canvas is displaying the data in
Buffer B1, which contains the file "01jan0092.fts", and that the data is represented at 1/6 of its true value. On the right
side, additional information about the data or display is shown. This information depends on the display type and is
described in Table A.
The vertical and horizontal scrollbars allow you to scroll the display if the image is larger than the canvas. Only
the image and header display types can be scrolled. All other display types are scaled to the size of the canvas.
The Canvas is used to show a representation of the data according to the display parameters. In addition the canvas can
capture mouse and keyboard events which can affect the display. See Table A - Description of Canvas Events for a
description of the types of events for each display type.
Image Canvas event
Action
Display the x,y location and value fo the pixel in the information area.
The text is usually displayed in black. However, if the pixel is bad and
the bad pixel mask is on, the text is colored red.
Cursor Movements
Dragging the cursor and pressing the
menu (right) mouse button.
This causes the colormap to be stretched and shifted. Vertical
movements affect the strech. Horizontal movements shift the color
map.
Dragging the cursor and pressing the
adjust (middle) mouse button.
The dragging motion rubberbands a group of pixels. These pixels are
known as the Object Box.
Dragging the cursor, pressing the adjust
(middle) button & holding down the
shift key.
Draws a line from he starting pixel until the dragging motion is
completed. The end points of this line is copy to the 'From' and 'To'
prompts in the TCS coordinates frame.
Pressing the select (left) mouse button.
Center the Object Box at the cursor's x,y location.
Press "F" or "T" in the image display
If the current active canvas is display an image, pressing 'F' or 'T'
will update the From or To coordinates in the TCS coordinates
frame.
Press "L" in the image display
If the current active canvas is displaying a linecut from the same buffer
as the image, pressing "L" will set a new X,Y axis for the line cut.
Table A - Description of Canvas Events
8/16/94
Page 48
IRTF CSHELL User's Guide
The Main Panel
The main panel contains buttons, prompts and menu items to control the display type and their options. For each
canvas there is a main panel as shown below: Selecting the Display menu gives the following options: Image,
SpectraA, SpectraB, Header, Histogram, LineCut, and XLineCut.
Figure 4 - The Main Panel
The panel items display in figure 5 will never change. These are described below:
Figure 5
Active Canvas Buttons - The selected button identifies the active canvas. The remaining panel items reflect the set
up of the active canvas. Changing the values of any of the panel items only affects the active panel items.
Command Line - This text panel item allows you to type commands to vf. The vf commands are listed in the VF
Command Dictionary.
Colormap - This list item allows you to select one of the may predefined colormap defintions.
Inverse ColorMap - This button inverse the current colormap.
Display - This pop-up menu item selects the display type for the active canvas. The display types are Image, SpectrA,
SpectraB, Header, HistoGram, Linecut, and XLinecut.
Buffer - Each canvas will display the data from this buffer. You can view the data in a different buffer by changing this
panel item.
However, the rest of the panel may change depending on the Display parameter.For each display type a different set of
parameters is displayed. These panel items reflect the parameters of the current active canvas and display type. A
description of the panel items for each display type is given below with an illustration of its panel.
The Image Display options has of the following item:
8/16/94
Page 49
IRTF CSHELL User's Guide
Figure 6 - The Image display & panel items.
Image Scale - The scale options are fixed or auto. When auto is selected the Image Range is automatically adjusted to
the minimum and maximum values of the data displayed in the canvas. This adjustment occurs whenever the data in the
buffer changes. For fixed scale, the program will never change the Image Range.
Image Zoom - The zoom sets the zoom factor for the display. Select x1, x2, x4, or x8 to set the zoom to 1:1, 1:2,
1:4 or 1:8 data pixels per screen pixels.
Zoom on box - This button sets the zoom and adjust the scroolbars of the canvas so that the Object Box is centered
in the canvas and all the pixels within the Object Box is display at the highest zoom level.
ShowScale - Determines if an arcsecond scale is displayed along with the image. Note that the necessay information is
also needed in the fits header or else the scale cannot be displayed.
Image Range - The color to the pixels are found by mapping the colormap to the minimum and maximum values of
the Image Range.
ImageOffset X & Y - Indicates which pixel is display on the upper-left corner of the canvas.
Print Image - Select this button to get a hardcopy from the laser printer.
The SpectraA Graph is produced by grouping columns of pixels and producing a set of points where each point is the
mean value of a row. These points are graphed as a line. The SpectrA panel consist of the following items.
Figure 7 - The SpectraA display & panel items
SetObjBin - Pressing SELECT on this button will cause the beginining and ending rows of the Object Box to be
entered into the ObjBin parameters. To the right of this button are text panel items which allow manual entry. The
number in parentheses equal to the number of rows in the ObjBin.
SetSkyBin - Pressing SELECT on this button will cause the begining and ending rows of the Object Box to be
entered into the SkyBin parameters. To the right of this button are text panel input prompts which displays these
values. The number in parentheses equal to the number of row in the SkyBin.
RowPerBin - This number represent the number of rows to bin together. Each bin is used to create 1 line in the
graph.
8/16/94
Page 50
IRTF CSHELL User's Guide
Subtract Sky - When the subtract sky option is on, each spectra line graph is the result of the object lines minus the
sky line. Note that the summing of columns in the ObjBin and SkyBin occurs before the subtraction.
Shift - Enter a positive (shift to the right) or negative (shift to the left) number to shift the x axis in the graph.
Stats - When the stats flag is on, the graph is replaced by a table. This table displays, for each bin, the row making up
the bin, the number of data point in the bin, the mean value of those points, the standard deviation of the point, and the
ratio of the mean and standard deviation.
YAutoScale - Y Autoscale , whichcan be fixed, local, or globol, indicates how the scale for the Y axis of the graph is
determined.
Y Scale (Fixed) - This is the range of the Y axis when YAutoScale is fixed.
X Scale - These values control the minimum and maximum values of the X Axis.
Print SpectraA Graph - Select this button to prints the Spectra A graph.
The SpectraB Graph is produced by binning two rows of pixels. One bin is the Object and the other is the Sky. The
mean value for each column can be displayed. The Object graph is the mean column value of the object bin. The
Difference graph is the mean column value of the object bin minus the sky bin. The SpectraB panel consists of the
following items.
Figure 8 - The SpectraB display & panel items
SetObjBin - Pressing SELECT on this button will cause the begining and ending rows of the Object Box to be
entered into the ObjBin parameters. To the right of this button are text panel input prompts which displays these values.
SetSkyBin - Pressing SELECT on this button will cause the begining and ending rows of the Object Box to be
entered into the SkyBin parameters. To the right of this button are text panel input prompts which displays these
values.
Show - You may specify the data to be plotted for the SpectraB graph.
Y AutoScale - This switch determines whether to autoscale the Y axis or use the fixed scales for the appropriate
graph.
DiffYRange - These values provide the fixed scale of the Y axis for the graph of the Difference.
DataYRange - These values provides the fixed scale of the Y axis for the object and sky graphs.
Set XScale - Selecting the 'Set XScale' button sets the x axis to the begining and ending columns of the object bos.
Your may also type the pixel value in the prompt to set the range for the X axis.
Print SpectraB Graph - Select this button to print the Spectra B graph.
The Header display shows the text of the fits header in the canvas. The Header panel consists of the following items.
8/16/94
Page 51
IRTF CSHELL User's Guide
Figure 9 - The Header display & panel items
Starting Row & Column -- Identifies the first character and line to be display in the upper-left corner of the canvas.
It's more convenient to use the scrollbars rather than change these values.
The Histogram display draws a histogram on the canvas and its panel consist of the following items.
Figure 10 - The Histogram display & panel items
Range - These values determine the minimum and maximum values of the X axis of the histogram, and will be equal
to the ImageRange. Changing the histogram range will change the ImageRange and vice versa.
Num of Bins - This is the number of bars on the histogram. The size of bin is determined by dividing the range by
the number of bins.
Area - These control allow you to indicate the pixel used in creating the histogram. You may use the entire image (All)
or just the pixel specified by the ObjBox (Box).
Print Histogram - Select this button to produce a hardcopy of the histogram.
The Linecut display will show a graph of the pixel values along the x and y axes. The Linecut panel consist of the
following panel items.
Figure 11 - The LineCut display & panel items
8/16/94
Page 52
IRTF CSHELL User's Guide
X Axis - Identifies the X axis used to draw the line cut.
Y Axis - Identifies the Y axis used to draw the line cut.
AutoScale - This switch determines whether to autoscale the graph or use Range to determine the scale.
Range - These values determine the minimum and maximum values of the scale when autoscale if off.
Area - The area along with the X & Y Axis variables defines the pixel domain for the graph. The options are All and
Box. When All is selected, the entire frame is plotted. When Box is selected, the Object box is used to define the region
to be plotted.
Print LineCut - Select this button to produce a hardcopy of the graph displayed in the canvas.
The XLinecut displays a single linecut graph between 2 points or pixels. The XLinecut panel consist of the following
panel items.
Figure 12 - The XLineCut display & panel items
Set Endpoints from line - SELECT this button to use the coordinates of a line drawn on the image to be entered
as the endpoints of the graphs.
AutoScale - This switch determines whether to autoscale the graph or use the range to determine the scale.
Beg to End - These coordinates identify the endpoints of the line of pixels used to construct the XLineCut graph.
Range - When autoscale is off, these values define the scale on the data axis.
Print XCut - Select this button to produce a hardcopy of the graph.
The Noise display is an engineering tool to display statistic on a group of pixels organized by columns. The mod
parameter would indicate the number of output in the system. The min, max, mean, and standard deviation could then be
displayed for each output. Graph 1 display the Min, Max, and Mean of the pixels. The I bar shows the min and max
while the point represents the mean pixel value. Graph2 display the standard deviation for each mod.
Figure 13 - Noise display & panel items
Mod - control how columns are group together. For example 4 would group every 4th colmun giving stats on 4
different groups of pixels.
8/16/94
Page 53
IRTF CSHELL User's Guide
Area - This control allow you to indicate the pixels used in creating the graph. You may use the entire image (All) or
just the pixel specified by the ObjBox (Box).
AutoScale - The Y axis is automatically scaled when on, or scaled using the range values when off.
Graph1 Range - When autoscale is off, these values define the Y scale for the Min, Max, Mean graph.
Graph2 Range - When autoscale is off, these values define the Y scale for the standard deviation graph.
8/16/94
Page 54
IRTF CSHELL User's Guide
The Read Data Frame
Selecting Read Data from the File submenu will causes the Read Data command frame to appear on the screen. This
command frame enables you to read data into the data buffers.
Figure 13 - The Read Data frame
There are two lists on this window. On the left is the file list, which list all the files in the Path matching the Filemask
string pattern. You may select filename with the mouse to identify the file you wish to read. On the right is the
directory list. The directory list display the name of the directory in the current path. Using the mouse you can double
click on these name to change the Path.
The other Panel items inside this command frame are:
Path - This text panel item identifies the subdirectory containing the file you wish to read. You may change the
Directory by editing this text panel item.
Filemask - This filemask determines which filename from the Directory are displayed in the list panel item. Filemask
is normally set to a regular expression to allow only those filenames matching the pattern to be included in the list. For
example,'*.fts' will allow any filename that ends with '.fts' to be include in the filelist. You may change the filemask by
editing this panel item. Use the cursor to select the file you wish to read.
Buffer - The data will be read into the buffer idenified by this panel item. Select the desired buffer from the menu.
Load Fits - Clicking on the 'Load Fits' button will command VF to read in the select FITS image.
Load Mem - Protocam mem files may also be loaded. Selecting this button will load the highlighted mem file.
Update List - This button will update the filelist. (This is necessary because UNIX is a multitasking operating
system and a file can be created or deleted or renamed without the knowledge of the VF program).
Hide - Selecting this button will cause the command frame to disappear.
8/16/94
Page 55
IRTF CSHELL User's Guide
The Save Data fame
Selecting Save Data from the File submenu will cause the Save Data command frame to appear on the screen. This
command frame enables you save or write the data from a buffer to a file.
Figure 14 - The Save Data frame
The Panel items inside this command frame are:
Buffer - This panel menu item identifies the buffer holding the data to be written. Select the buffer you wish to save.
Directory - This text panel item identifies the subdirectory containing the file you wish to write to. You may change
the Directory by editing this text panel item.
Filename - The data will be written to this filename. You may change the filename by editing this field.
Save - Selecting this button commands VF to write the data to the file.
Hide - Selecting this button will cause the command frame to disappear.
8/16/94
Page 56
IRTF CSHELL User's Guide
The Math Frame
Selecting the Math button from the Main menu will cause the Math command frame to appear on the screen. This
command frame allows 3 types of operations: 1) Arithmetic on the pixel values, 2) Transferring data between buffers,
3)Deleting data from a buffer, and 4) Rotating an image. Note that there are buttons labeled 'Math', 'CopyBuf' , 'Clear'
and two icons while contain rotation directions. These icon performs the operations. Near these buttons are various
panel items used to identify the buffer or other parameters for each operation.
Figure 15 - TheMath frame
For buffer Arithmetic, form an expression by selecting a destination buffer, operation (+-*/), and the operands. The first
operand is always a buffer index, the second can be a buffer index or a constant. Selecting 'constant' from the menu
allows you to enter a value for the second operand. Two examples of math expressions are shown.
`b2 = b0 - b1' will subtract buffer 1 from buffer 0 and store the results in buffer 2.
'b2 = b2 * 100' will multiply every pixel in buffer 2 by 100 and place the results in buffer 2.
When you are done forming your expression, selecting the Math button to perform the operation.
To copy data from one buffer to another use the middle set of panel items. First select the destination and source
buffers. Select the CopyBuf button to perform the transfer.
To clear a buffer data in the buffer, identify the buffer by selecting a button to the right of the clear button, then
SELECT the Clear button to delete.
The rotate operation allows you to rotate the data to the left or right. Select the desired buffer, then press one of the
rotate buttons to rotate in the desired direction.
The Hide button will cause the command frame to disappear from the computer's screen
.
8/16/94
Page 57
IRTF CSHELL User's Guide
The Stats frame
The stats command frame provides the means for you to view elementary statistical information on groups of pixels and
calculate box photometry values.
Figure 16 -The Stats frame
The stats command frame consists of an information area and a panel area. The information area displays the sum, mean,
and standard deviation of the data display in a canvas. The mean, variance, and standard deviation for the entire frame is
displayed on the top row. Below this are 3 columns labeled 'Object', 'Sky', and 'Object-Sky', with statistical values for
each column. The object column displays the value on the object box. The sky column displays statistics on the sky
box. If the object and sky box are of equal dimension, the object-sky column will display statistics on the pixel values
obtained by subtracting the object box from the sky box. The Stats frame's panel contains the following control items.
The Canvas button identifies the canvas. The data display in this canvas is used to generate the statistical information.
Selecting the Set Sky button sets the location and size of the sky box to be equal to the object box.
Clicking on the Hide button will cause the frame to disappear.
On the bottom row are special button used with NSFCAM. There button allow a user to set the size and position of the
subarrays used in the various mode of NSFCAM. The position and size of the ObjectBox is sent to NSFCAM's Guide
array or SubArray #1, 2, or 3 when you select the Guide, Array1, Array2 or Array3 bottons.
8/16/94
Page 58
IRTF CSHELL User's Guide
The Edit and Execute Command Files frame
VF provides a way of creating and executing Do files. A Do (or macro) file is a text file containing commands. There
should be 1 command per line and the syntax for commands are defined inthe VF Command Dictionary. In the Options
submenu, the choices 'Execute Do files' brings up a window to allow you to create, edit, and execute Do files. This
frame contains a text edit window. a feedback window, and a group of panel items.
Figure 17 - The DO Files frame
The following panel items will help you read, edit, and save the contents of DO file:
DoPath - This text panel identifies the subdirectory where your macro files are stored.
DoFileMask - The filemask is a regular expression used with the path to determine the names of the files displayed in
the filelist. Selecting Update File List will re-initialize the list.
Load File - Selecting this reads the file selected in the filelist and places the text in the edit window.
Clear text - Clear the edit windows buffer.
Save as - Selecting this button writes the current text in the edit window into the filename shown in the text panel
item.
Record - This check box panel item controls the recording function. When the box is checked, any commands executed
by VF will also be written to the edit window. This allows you to create macro files using the mouse and panels items.
To execute a macro file, select the file in the list then click on the Execute button. VF will read the file and execute
each line. The commands and its error message ('Error None' when successfully executed) will be written to the Feedback
area located on the bottom of this frame. If you wish to abort a macro file in progress, click on the Cancel button.
8/16/94
Page 59
IRTF CSHELL User's Guide
The TCS Coordinates
The TCS Coordinates frame allow you to calculate the relative offsets in RA and DEC between 2 pixel in an image.
This offset can be transmitted to the Telescope Control Sytem, thus providing a convient way to position objects on the
array. To bring the frame up, select the 'TCS Coordinate' menu item from mainmenu's 'Options' button
Figure 18 - The TCS Coordinates frame
The following steps outline the procedures for offsetting the TCS.
1. Enter the Angle and PlateScale information. This information varies with the array and instrument used. The
following table contains the value for the IRTF Facility Instruments. Please confirm these values with the Telescope
operator during your run.
Instrument
Angle
CSHELL
270
NSFCAM
?
PlateScale
0.20
0.3, 0.15 or 0.06
User definable
2. Identify the From and To points in terms of their x,y pixel location on the image. This can be accomplisted by the
following method:
a. Manual type in the coordinated values.
b. Drawing the XOR line on the image. First, place the cursor in the image at the From pixel location. While
pressing the SHIFT key, press the middle mouse button and drag the cursor to the To location. While you are
dragging the mouse a line should be drawn between the two points. The act of drawing this line updates the
From and To coordinates values in the TCS Coordinates frame.
c. Place the cursor in the image. Click the left or SELECT mouse button to focus keyboard input into the
canvas. Now when you press the 'F' to 'T' key on the keyboard, the coordinates of the cursor will be written to
the From or To prompts in the TCS Coordinates frame.
3. Press the Calculate Offset button. Using the From, To, Angle and Plate Scale information, the RA and DEC
offsets are calculated. The results as display in the Offset is (ra,dec) prompt.
4. If you agree with the offset coordinates in the Offset is (ra,dec) prompt, press Offset TCS button. Pressing this
button will sent a command to the TCS to offset its position by the indicated coordinates.
Note: The TCS command issued by VF to perform the offset is " 0 ra dec 0 C.PEAK".
8/16/94
Page 60
IRTF CSHELL User's Guide
The Set Up frame
The Set Up Parameters frame contains panel items which are not likely to be changed very often. The item are usually
self-explanatory. For a detailed explaination of each option, refer to the VF Command Dictionary.
Figure 19 - The Set Up frame
Special Notes:
To set up a bad pixel mask, read in the fits file representing your bad mask into any buffer. Pixels with a value of zero
are considered good pixels, while non-zero values represent bad pixels. Indicate the buffer holding the bad pixel mask by
selecting its buffer index from items to the right of the 'Set Bad Mask' button. Selecting the 'Set Bad Mask' will cause
VF to scan the buffer and initialize the bad pixel mask. Once the bad pixel mask is installed, its effects can be turned off
or on using the BadMask buttons. See the command 'BadMask' for more information.
VF Source and Docs from IRTF-online
An anonymous FTP site has be setup at the Institute for Astronomy at the University of Hawaii. The IRTF has made
available to the community various manuals, forms, programs, etc via this FTP site. This has come to be know as
IRFT-Online. A copy the this manual and the source code to VF is available from IRTF-online. To access IRTFOnline:
1. Perform an anonymous FTP to irtf.ifa.hawaii.edu.
2. cd to pub/IRTF
3. Download and review the README.txt file. This contains a brief description of all files in IRTF Online.
In the directory pub/IRTF/VF are the files related to the VF application. Here is the README.txt file
from this directory.
Hello, this readme file contains note for those IRTF-online users who are
interested in VF. VF is a simple FITS viewer. it was developed by the
NASA Infrared Telescope Facility for use with their data acquistion systems.
We are making the binaries and source code available on IRTF-online.
IRTF-online is an anonymous ftp site. Irtf-online is located on
irtf.ifa.hawaii (128.171.79.135).
The pub/IRTF/VF in this directory are:
8/16/94
Page 61
IRTF CSHELL User's Guide
REAME.txt - This file.
vf.source.tar.Z - The source code necessary to compile vf.
vf.doc.tar.Z - The user guide to vf in MS Word (MAC) and a
Postscript format.
Notes on VF's Docmentations
===========================
The file vf.doc.tar.Z contains a copy of VF User's Guide in MS Word for the
MAC and postscript format.
1. ftp the vf.doc.tar.Z to your home directory.
2. uncompress and un-tar this file. ie:
% uncompress vf.source.tar.Z
% tar xvf vf.source.tar
3. A vf/doc directory will be created with the following files:
vf.rtf - Rich Text Format copy of the User's Guide.
vf.ps - A postscript version of the User's Guide.
Notes on VF's Source Code
===========================
The file vf.source.tar.Z contains the sources to the View Fits (VF) program.
I have made the source code available to those who are interested in porting
or running VF at their home institution. And for those who are curious
to seeing how the software is written.
VF wase developed on a SPARC station running Openwindows.
They are compiled using sun's acc compiler and XVIEW. It was not intended
to be very portable, but if your workstation has an ANSI compiler and
the XVIEW libraries you should be able to compile these programs.
These instruction assume you have some knowledge in developing programming
in an unix enviroment. If not, you will probably need assistance from
a programmer-type.
To install and compile the source:
1. ftp the vf.source.tar.Z to your home directory.
2. uncompress and un-tar this file. ie:
% uncompress vf.source.tar.Z
% tar xvf vf.source.tar
The following files/directories should be created in you home directory:
.vf-init
mylib/
vf/
8/16/94
- startup file for VF
- This directory contains the source to libraries
needed to compile the IC, XUI, and Vf.
- This directory contains the source the VF.
Page 62
IRTF CSHELL User's Guide
3. Make the libraries.
There are 2 set of libraries:
/mylib/addlib - additional libraries
/mylib/fitslib - fits libraries
In each of these directories there is a makefile. Use the make utility
to compile these libraries. Currently there are 3 different makefile
depending on your OS (makefile.sun, makefile.lynx, makefile.linux).
If you are compiling these programs on a SUN, there command would
do the job:
%
%
%
%
cd ~/mylib/addlib
make -f makefile.sun
cd ~/mylib/fitslib
make -f makefile.sun
4. After the libraries are done. You can compile the VF application. Go to
the VF directory and type make to compile the program. Note: You may
need to modify the makefile to compile in your enviroment.
% cd ~/vf
% make
5. Edit the following startup files for each application:
~/.vf-init
- VF's startup file.
Please refer to the VF user manual for further details.
If you have question/comments, please contact me. I would be happy to
help you.
Tony Denault
IRTF Programmer
email: [email protected]
Telephone: 808-956-8101
Mail: Institute for Astronomy, 2680 Woodlawn Drive, Honolulu, HI 96822
8/16/94
Page 63
IRTF CSHELL User's Guide
VF Command Reference
Prompt 'Clear' button on Math frame.
Range b0 to b7
Active - Sets the active canvas..
Prompt (None). Buttons on the base window allows
you to change the active canvas.
Initial Undefined
Syntax
CLEAR B#
Range A, B, C, D, or E
cminverst - Inverse the current colormap definitions.
Initial A
Syntax
ACTIVE id
Prompt
'Inverse Colormap' prompt on base window.
Syntax
CMINVERSE
BadMask - Enables/disables the Bad Pixel Mask.
ColorMap - Reads in a colormap definition from a file.
Prompt 'Colormap' on the main panel.
Prompt BadMask
Range Standard colormap files are ...
Range OFF or ON
Initial a.cm
Initial OFF
Syntax
Syntax
BadMask { OFF | ON }
COLORMAP filename
Comments
Events/Display Modes
Tracking cursor in
image window
Display Type: canvas
Display Type:
SpectraA, SpectraB,
Histogram, Line Cut
XLine Cut
Frame and box
statistics
BadMask ON
Estimate bad pixel
values.
Display text in red.
Estimate bad pixel
values.
Estimate bad pixel
values.
BadMaskOFF
Display actual pixel
values.
Display text in black.
Display Actual pixel
values.
Mark Bad pixles with
‘X’
Use actual values.
CopyBuf - A command to copy data from one buffer to
another.
Prompt 'Copy' button on Math sub-window
Range B0 to B7
Initial (Undefine)
Syntax
COPYBUF B# to B#
DarkFlat - A command to compute dest = (src - DARK) *
mean(FLAT) / FLAT, where DARK is buffer 5 and FLAT is
buffer 6.
Prompt N/A
Estimate bad pixel
values.
Use actual values.
Range b# must be gereral buffer, b0 to b4.
Initial N/A
Syntax
DarkFlat b# to b# [DF]
Note: the DF flags are specified to prevent
processing.
Boxzoom - Set the Image Zoom on the active canvas so
that the object box fills as much as the canvas as
possible..
Prompt 'Zoom on ObjBox' on main panel.
Range N/A
DisplayType -Determines what is display in the active
canvas.
Prompt `Display' on main window.
Range I
Initial N/A
Syntax
SA
BOXZOOM
Buffer - Changes the data buffer associated with the
active canvas..
Prompt 'Buffer' on the main panel
Range b0 to b7
Initial Canvas A displays Dframe 0, Canvas B
displays Dframe 1, ect...
Syntax
Spectra A Graph
SB
Spectra B Graph
H
Fits Header
G
histoGram
L
Line cut
X
XLineCut
N
Noise Image
Initial I
Syntax
DisplayType { I | SA | SB | H | G | L | X}
Buffer B#
Clear - A command to set a data buffer to empty.
8/16/94
Image
DivByCoadd - Enables/disables the divide by coadd
option. Enabling the option cauxe the representation of
Page 64
IRTF CSHELL User's Guide
the data to be divide by the number of coadds in the the
data frame (DFrame).
Prompt `DivByCoadd' on the Math sub-window.
Range OFF or ON
Prompt (none)
Range 0 to 50
Initial 0
Syntax
HeaderRow num
Initial OFF
Syntax
DivByCoadd {OFF | ON}
DoFile - Execute command from a file.
Prompt The subwindow 'CommandFile' allows
selection and execution of a macro file.
HistArea - Sets the range of pixels to be included in the
histogram.
Prompt 'HistArea' on main panel.
Range All - All the pixels in the frame are used.
Box - The pixels include in the ObjBox are
used.
Range N/A
Initial N/A
Syntax
DoFile filename
DoFileMask - Set the filemask variable for the filelist
showing in the Execute Command File and Edit Command
File Frames.
Prompt 'Filemask' on the Execute Command File
Frame.
Range Any string.
Initial '*'
Syntax
DoFileMask string
DoPath - The Dopath identifies the subdirectory where
you will read and wirte command or macro files. The filelist
on the Execute Command File and Edit Command file
Frames is build using this directory.
Prompt 'Path' on the Execute Command File Frame..
Range Any legal unix subdirectory
Initial N/A
Syntax
DoPath string
FileMask - Set the filemask variable for the File - Read
subwindow.
Prompt Filemask
Range Any string.
Initial '*.fts'
Syntax
FileMask string
HeaderCol - For the Active Canvas, it sets the starting
column of the fits header to be displayed.
Prompt (none)
Range 0 to 50
Initial 0
Syntax
HeaderCol num
Initial All
Syntax
HistArea {All | Box}
HistBin - For the Active Canvas, it sets the number of
bins for a hisogram display.
Prompt Histbin
Range 1 to 100
Initial 20
Syntax
HistBin num
ImageOffset - For the Active Canvas, it determines
which pixel is displayed the the upper-left corner for a
image display. 0, 0 identifies the first pixel of the fits data.
Prompt 'Offset X' and 'Y'. Also these values can be
controlled a canvas's scrollbar.
Range 0 to size of axis in the fits frame.
Initial 0, 0
Syntax
ImageOffset offx offy
ImageRange - For the Active Canvas, it sets the
minimum and maximum values for the colormap.
Prompt 'Range`
Range -2^31 to 2^31-1
Initial 0 to 65000
Syntax
ImageRange min max
ImageScale - For the Active Canvas, it set the
autoscaling on or off. When autoscale is on the
ImageRange is automatically adjusted to the minimum and
maximum values of the data displaying in the canvas. This
adjustment occures whenever new the data in the buffer
changes.
Prompt 'Scale' on the main panel for Image display.
Range A (autoscale) or F (fixed scale)
Initial F
Syntax
ImageScale {A | F}
HeaderRow - For the Active Canvas, it sets the first lint
of the fits header to be displayed.
8/16/94
Page 65
IRTF CSHELL User's Guide
ImageShowScale - For the Active Canvas, it indicates
whether to display an arcsecond scale along side the
image display.
Prompt 'ShowScale' on the main panel for Image
display.
NoiseArea - Sets the range of pixels to be included in
the Noise Display.
Prompt
Range
Range OFF or ON
Initial OFF
Syntax
ImageShowScale { off | on }
Initial
Syntax
ImageZoom - For the Acitve Canvas, it sets the zoom
factor for an image display. This value determines the
number of screen pixels each array pixel occupies. For
example, a value of 4 will draw each array pixel on a 4x4
area in the canvas.
Prompt 'zoom' on the main panel for Image display.
Range 1 to 20.
Initial1
Syntax
ImageZoom num
LineCutArea - Set the range of pixels to be include in
the line cut graph.
Prompt 'Area' on the main panel for LineCut display.
Range All - The entire array is used.
Box - The subarray defined by the object box
is used.
Initial All
Syntax
LineCutArea { All | Box }
LineCutScale - Turns the automatic autoscaling
feature off or on for line cut graphs.
Prompt 'AutoScale' on the main panel for LineCut
display.
'Area' on the main panel Noise display.
All
- Include all the pixel in the image
Box
box.
- Select the pixels in the object
All
NOISEAREA { All | Box }
NoiseAutoScale - Sets the autoscale option of the
noise graph.
Prompt
Range
Initial
Syntax
'AutoScale' on the mail panel Noise display.
{ off | on }.
Off
NOISEAUTOSCALE { off | on }
NoiseMod - Sets the modual value for the noise display.
This value control how the columns are grouped together..
Prompt
Range
Initial
Syntax
'Mod' on the mail panel's Noise display.
1 to 256.
4
SYNTAX
NoiseG1Range - Sets the range of the Y axis for the
Max/Min/Mean Noise Graph.
Prompt
Range
Syntax
'Graph1Range' on the main panel's Noise
display.
-2^31 to 2^31-1.
NOISEG1RANGE min max
Range Off or On
Initial Off
Syntax
LineCutScale {off | on}
LineCutXY - For the Active Canvas, it determines the X
and Y axis for a line cut graph..
Prompt 'X Axis' and 'Y Axis' on the main panel for
LineCut display.
Range X and Y must be from 0 to 255..
Initial 0
Syntax
LineCutXy x y
Math - Performs simple artimetric on the images.
Prompt 'Math' button on the Math subwindow
Range N/A
Initial N/A
Syntax Math B# = B# { * | / | + | - } { B# | num }
8/16/94
NoiseG2Range - Sets the range of the Y axis for the
Standard deviation Noise Graph.
Prompt
Range
Syntax
'Graph2Range' on the main panel's Noise
display.
-2^31 to 2^31-1.
NOISEG2RANGE min max
Path - The path identifies the subdirectory where you will
read and wirte data files..
Prompt 'Path' on read subwindow.
Range Any legal unix subdirectory
Initial 'data'
Syntax
Path string
Print - This command produces a postscript file of the
graph or image in a canvas window and sent this file to the
Page 66
IRTF CSHELL User's Guide
printer specified by the printer variable. This postscript file
is named 'lastprint'.
Prompt Each printable graph has a 'Print' button on
the main panel.
Range A to E
Initial (N/A)
Syntax
Print {A | B | C | D | E }
Printer - Identifies the printer used by the print
command.
Prompt 'Printer' on the setup subwindow
Range Enter the name of a postscript printer on the
network.
Initial (N/A)
Syntax
Printer name
ReadSock - Read a fits file from the current socket
connection.
Prompt N/A
Range B# - Any valid buffer, for example 'b0'
Initial N/A
Syntax
RotateBuf - Rotate s the data in a buffer by translating
the X and Y axis. The buffer can be rotated in the
clockwise or counter-clockwise direction.
Prompt Rotate CW & CCW buttons on the Math
frame.
Range N/A
Initial N/A
Syntax
PrinterType - For hardcopy of image, this command
specifies either a color or black&white postscript output.
Prompt 'Printer Type' on the setup subwindow
Range 0 - B&W Postscript printer
1 - Color Postscript printer.
Initial 0
Syntax
PRINTERTYPE { 0 | 1 }
Quit - Exits the vf program.
Prompt 'Quit' on the main menu.
Range N/A
Initial N/A
Syntax
Quit
ReadSock buffer#
RotateBuf B# {cw | ccw}
SAObjBin - Sets the range of rows to be used as the
object bin in the Spectra A graph.
Prompt 'OBjBin' on main panel for SpectraA display.
Range 0 to 255
Initial 0
Syntax
SAObjBin min max
SARowPerBin - Sets the number of rows per bin for a
Spectra A graph.
Prompt 'RowPerBin' on the main panel for SpectraA
display.
Range 1 to 255
Initial 10
Read - Read a fits file from the current path into the
buffer.
Prompt The 'Load Fits' button on the Read Data File
frame.
Range filename - Name of file to read. This file must
exist in the subdirectory defined by PATH.
B# - Any valild buffer, for example 'b0'
Initial N/A
Syntax
Read filename B#
ReadMem - Reads a ProtoCam .mem file from the
current path into the buffer.
Prompt The 'Load Mem' button on the Read Data File
frame.
Range filename - Name of file to read. This file must
exist in the subdirectory defined by PATH.
Syntax
SARowPerBin num
SAShift - Specifies the amount of shift in the x axis to
be applied when converting pixel columns to wavelenght.
Prompt 'Shift' on the main panel for SpectraA
display.
Range -25 to 25 pixel units
Initial 0
Syntax
SaShift num
SASkyBin - Sets the range of rows to be used as the
sky bin in the Spectra A graph.
Prompt 'SkyBin' on main panel for SpectraA display.
Range 0 to 255
Initial 0
Syntax
SASkyBin min max
B# - Any valild buffer, for example 'b0'
Initial N/A
Syntax
8/16/94
ReadMem filename buffer#
SAStats - Indicated whether to show the graph or a
table of statistical information for each line.
Page 67
IRTF CSHELL User's Guide
Prompt 'Stats' on the main panel for SpectraA
display.
Range OFF - Displays the graph.
ON - Display the table.
Prompt 'Save Setup as a Marco File' Frame.
Range Setup can be save using an legal filename.
Initial N/A
Syntax
SaveSetup filename
Initial OFF
Syntax
SAStats { off | on }
SASubtractSky - This flag indicates whether to
subtract the mean sky values from each object bin in the
SpetraA graph.
Prompt 'SASubtractSky' on the main panel for
SpectraA display.
Range Off or ON
Initial ON
Syntax
SASubtractSky { off | on }
SAXScale - Sets the range of the X axis of a Spectra A
graph
Prompt 'XScale' on the main panel for SpectraA
display.
SBDataYRange - Sets the range of the Y axis of a
Spectra B graph of the object and sky bin data.
Prompt P
Range -2^32 to 2^32-1
Initial V
Syntax
SBDataYRange min max
SBDiffYRange - Sets the range of the Y axis of a
Spectra B graph of the difference between the obj and sky
bins.
Prompt 'DiffYRange' on the main panel for SpectraB
display.
Range -2^32 to 2^32 -1
Initial V
Syntax
SBDiffYRange min max
Range 0 to 255
Initial V
Syntax
SAXScale min max
SAYAutoscale - Select which option is used for
determining the maximum and minimum values of the Y
scale.
Prompt 'YAutoScale' on the main panel for SpectraA
display.
Range Fixed - Used the asYScale values.
Local - Each spectra graph used its own
maximum and minimum value to set the y
scale.
Globol - A maximum and minimum value from
all the spectra lines is found and is used for
the Y ax.s
SBObjBin - Sets the bin range of the object data for a
Spectra B graph.
Prompt 'ObjBin' on the main panel for SpectraB
display.
Range 0 to 255
Initial N/A
Syntax
SBShow - Specifies the data to be ploted for a Spectra B
graph.
Prompt 'Show' on the main panel for SpectraB
display.
Range D
Display a plot of the difference
(object-sky) bin.
Initial Globol
Syntax
SAYAutoscale {Fixed | Local | Globol }
SAYScale - Sets the range of the Y axis of a Spectra A
graph when the autoscale option is fixed.
Initial N/A
Syntax
SAYScale min max
SaveSetup - Saves some setup information to a file in
the DoPath directory. This file consisted of macor
commands.
8/16/94
O
Display a plot of the Object bin.
S
Display aplot of the Sky bin.
InitialDOS
Syntax
SBShow { D | O | S }
Note: The letter DOS can be ORed
inclusively.
Prompt 'Y Scale (Fixed)' on the main panel for
SpectraA display.
Range 0 to 255
SBObjBin min max
SBSkyBin - Sets the bin range of the sky data for a
spectra B graph.
Prompt 'SkyBin' on the main panel for SpectraB
display.
Range 0 to 255
Initial V
Syntax
SBSkyBin min max
Page 68
IRTF CSHELL User's Guide
Initial 0, 0, 1, 1
SBXRange - Sets the range of the X axis of the Spectra
B graph.
Prompt 'XRange' on the main panel for the SpectraB
display.
Range 0 to 255
Initial V
Syntax
SBXRange min max
Syntax
StatsSetSky - This command sets the SkyBox position
and skze to be equal to the ObjectBox.
Prompt N/A
Range N/A
Initial N/A
Syntax
SBYAutoScale - Sets the Y axis autoscale flag for the
spectraB graph
Prompt 'YAutoScale' on the main panel for SpectraB
display.
Range OFF - Use DiffYRange and DataYRange to
set scales.
ON - Auto scale the graph using max and min
of data.
Initial off
Syntax
SBYAutoScale { off | on }
SetBadMask - Exams a frame and builds the bac pixel
mask definition from it. Good pixel are represented by 0's,
the rest are bad pixels.
Prompt GetBadMask
StatsObjBox x, y, wid, hgt[, dframe]
StatsSetSky
StatsXORLine - Set the XOR line postion on the image
canvas.
Prompt N/A
Range X and Y must be from 0 to 255
Initial 0,0 to 1,1
Syntax
StatsXORLIne x1, y1, x2, y2
TCSHostname - Identifies the host used to handle
communications to the TCS.
Prompt 'TCSHostname' on the Setup Frame.
Range Enter a valid hostname
Initial N/A
Syntax
TCSHostname host
Range Index to Dframe. 0 thur 4.
Initial All pixels are good
Syntax
GetBadMask num
SetPixel - Changes the value of the pixel located at
[x,y] in the buffer on the active canvas.
Prompt N/A
Range N/A
Initial N/A
Syntax
SetPixel x y value
StatsCanvas - Identifies the buffer used to in
calculating the stats values by selecting the canvas
holding the data.
Prompt N/A
Range 0 to 4
Initial 0
Syntax
StatsCanvas {A|B|C|D|E}
StatsObjBox - Set the size and position of the
rectangle area which identifies the pixels call the
ObjectBox.
Prompt N/A
Range 0 to 255 for x, y, wid, and hgt.
0 to 4 for dframe.
8/16/94
UseHex - The pixel values are display on the upper
right corner of the canvas on Image display mode. These
values can be based in decimal or Hexadecimal.
Prompt
Range
None. Type command a command prompt.
Off - Show values as decimal
ON - Show values as Hexadecimal.
Initial
Syntax
Off
USEHEX { off | on }
Write - Writes the content of a buffer to a fits file in the
current Path. Specifying a filename is optional. If a
filename is not specified, the program will the name
assigned with the data.
Prompt P
Range N/A
Initial N/A
Syntax
write buf# [filename]
XCutAutoScale - Sets the autoscale flag of the
XLineCut graph.
Prompt 'AutoScale' on the main panel for XLineCut
display.
Range OFF - Use Range for scale
ON - Autoscale the range based on data.
Initial Off
Page 69
IRTF CSHELL User's Guide
Syntax
XCutAutoScale { off | on }
XCutSet - This command identifies the endpoints of the
line of pixels used to construct the XLineCut graph.
Prompt 'Beg' and 'End' on the main panel for
XLineCut display.
Range x & y must be from 0 to 255
Initial N/A
Syntax
8/16/94
XCutSet x1, y1, x2, y2
Page 70
IRTF CSHELL User's Guide
B. Turning CSHELL and its CCD Camera On and Off
The day crew should power on the instrument and run checks. Power is left on continuously
except for conditions that may lead to abandonment of the summit or lightning. The cshellic software
is usually left running on the IC computer. These procedures are for the Telescope Operators and
support scientists. Observers should not attempt to power CSHELL on or off.
All software can be started up from your user account on an IRTF Sun workstation at the
summit (planck) or HP (wien). Remember to type "xuihostname wien" in the command
line of the CSHELL XUI program if running from that HP workstation. The CSHELL
and CASSPC (the guider pc) Instrument control (IC) Intel architecture computers can also be logged
into from their directly connected keyboard / monitor consoles. The new calibration lamp program is
called cal_lines which should be typed in from a UNIX prompt.
A. CSHELL Startup
0) Turn on CSHELL boxes #2 - #5 in numerical order (done at start of run by day crew)
1) Log into your Guest Account (IRTF staff can use cshell account)
2) Type "openwin" and <CR> at the UNIX prompt
3) Hold down the right mouse button on the blue desktop
4) If the IC program is not already running (ASK a T.O. or Support Astronomer), Either:
i) Select "Start CSHELL IC Software!" from the CSHELL menu
or ii) Log into CSHELL IC console as "cshellic"
5) Select "Cshell XUI" from the CSHELL menu
6) Select "VF" from the CSHELL menu
7) Turn on the CSHELL Array Power Supplies (left on if cshellic is running)
8) Set Programmable Voltages in Setup Parameters XUI Window
B. CSHELL Shutdown
1) Quit VF
2) Move Shutter, Slit, and Filter to "Blank" Position. Spectroscopic mode, turn lamps off.
3) Quit XUI software
4) Leave in this configuration unless powering off (proceed further only if powering off)
5) Turn off the CSHELL Array Power Supplies
6) Type "die" and <CR> in CSHELL IC window. Halt Lynx by logging in as "shutdown";
login as "reboot" if you only want to reboot the IC computer.
Startup:
Shutdown:
8/16/94
C. CCD Guider Camera
1) Follow Steps A0 - A3.
2) Select "Login to CASSPC Guider PC" from CSHELL menu
3) Type "gic" and <CR> in the casspc window
4) Select "Guider XUI" from CSHELL menu
1) Quit Guider XUI
2) Type "die" and <CR> in GIC (casspc) window; exit window
3) Power Off Only: Login as oroot or sroot and type "reboot -ah"
before power off or just type "reboot -a" to reboot only.
Page 71
IRTF CSHELL User's Guide
C. Observing Techniques
1. Setting IR Array Bias Voltages
The IR detector bias must be programmed to match the observing application. Using a single
fixed bias (as done with the old NICMOS array) is inappropriate because of non-linearities and icky
pixel artifacts in the SBRC 256 x 256 InSb arrays. Larger biases allow more electrons to be collected
before saturation, but they also cause increased numbers of high dark current pixels (icky pixels) and
low-level non-linearities. Fortunately, the icky pixels mostly disappear when object and sky frames
are subtracted. Dark frames with exposure times equivalent to flat fields should be taken to subtract
these pixels from your flats. The SBRC InSb arrays are not particularly linear near the tops or the
bottoms of their integrating wells (see Appendix F), but linearity problems can be avoided if you
expose your flats so that they have similar data counts to your object frames. You may coadd many
flats to achieve high S/N. I recommend that you pick one of four following detector bias settings for
you observations:
Observation
Bias (mV)
Well
VDDUC
VDET
XUI Do File
Most Spectroscopy
Bright Thermal Spectroscopy
Bright or Thermal Imaging
Thermal Imaging with very
high backgrounds
325
500
800
1000
5000
8400
15,500
21,300
-3.7
-3.7
-3.7
-3.7
-3.375
-3.200
-2.900
-2.700
small
medium
large
huge
Notes:
Well: The maximum number of ADU counts (1 ADU = 11.0 electrons) that can be collected while
not departing more than 1% from the linearity relation of the mid-well range.
VDET & VDDUC are detector biases (Volts) that can be typed into the SETUP Parameters frame of the
CSHELL XUI Application.
XUI Do File is the name of a command file that can be executed from the Options menu of
the CSHELL XUI application. These files automatically set the indicated bias levels.
The bias voltages must also be set (execute DO File or push button in Setup
Parameters Window) when the software is started. You must also use blockers if
you ovbserve with the 1.10 - 1.57 µm CVF (see #9 this section).
2. Check For Read-Noise Limit and Saturation
The minimum background-limited data value of each array is equal to the square of its read
noise (in electrons) divided by the number of electrons per ADU. This value is approximately 100 for
the SBRC InSb array in CSHELL as listed in § I Table 3. Try to keep your data numbers above these
values to avoid being limited by array read noise.
The SBRC InSb array saturates at a level that is a function of detector bias as listed in the
above table. Try to keep raw data values below the listed 1% linearity departure levels. It is good
practice to check unsubtracted exposures for saturation. This may occur in frames with low mean
counts if there is a bright OH line or thermal telluric line that is not seen in the A-B images.
8/16/94
Page 72
IRTF CSHELL User's Guide
NOTE: When using the Direct Imaging Mode, you may find a black spot in the center of a bright star.
This is a manifestation of gross saturation, and the numbers in the black area are meaningless.
3. Flat-fielding
Flat-fielding is accomplished by taking spectra of a continuum source (usually a light bulb)
that illuminates an integrating sphere (the same one that is used for the calibration lamps). One
typically should obtain flats at the beginning of the night, whenever standards are measured, and at
the end of the night. Flat fields should be taken for each observed wavelength observed. The
grating and the CVF should not be moved between observing objects and flats in
order to minimize wavelength shifts and ripples in spectra caused by interference in the CVFs. For
most work, obtaining about 10 flats at an exposure of 1000 counts should suffice. They have similar
data counts to your object frames if you are very concerned about linearity. For work requiring S/N &
100 one should strive to get 25-30 flats at a time. Flats must be acquired with the same detector bias
setting as your object data.
We usually use the continuum lamp to generate flat fields at wavelengths # < 2.5 µm. The
lamp does not produce many photons in the # ~ 3.5 µm range (due to opaque glass) but it usable. Its
glass bulb is warm enough to provide an abundance of photons in the # > 4 µm region. You may also
wish to try taking flats at # > 4 by using the thermal emission of the dome or mirror covers. You can
try either taking long exposures of the continuum lamp or mirror covers for 3 µm < # < 4 µm, or else
observing the dome target with the dome lights on. We do not yet have much experience in acquiring
good flats at # > 3 µm wavelengths.
4. Focus And Collimation
The collimation settings should be the same as that used for NSFCAM. Check with the T.O.
to make sure that this is the case. The focus should be checked on a 7 - 9th magnitude star which the
T. O. can find in the on-line SAO catalog. Use the Direct Imaging Mode, slit in the "open" position,
and a few seconds of exposure time - using several coadds of shorter integrations if necessary - to
integrate over seeing. At the beginning of the night, the focus is usually about +270 with the
“chipped” secondary (~ +2.10 with the milled secondary) and it systematically drops (as the
temperature drops) to about +2.30 (+1.85 with milled secondary) by the end of the night. The stellar
image is typically less than 1 arcsec full-width-half-maximum (less than 5 pixels FWHM).
5. Tweaking the CVF for a Flatter Flat
Whenever a new wavelength is entered, the grating and CVF are moved. The CVF suffers
from internal reflections which cause an interference pattern in all spectra. The amplitude of this
pattern varies from about 10 - 20% peak-to-peak, and it is quite sensitive to small changes in CVF
position. If this fringing is particularly bad in your object or flat field data, you can try to minimize it
by moving the CVF wheel (no more than ±40 steps total) in small increments (5 or 10 steps). Be
sure, however, to acquire all data (object and flats) for each wavelength at the exact same CVF and
grating positions - do not move the grating or CVF in between data frames unless changing
wavelengths.
8/16/94
Page 73
IRTF CSHELL User's Guide
The CVF position can be seen in the “Motors” frame of the main cshellxui window. The
CSHELL command Filterpos can be issued to move the CVF filter wheel a small amount. Consult the
Hardware Reference (Appendix B) for the command syntax and to determine which CVF and wheel
should be moved.
6. Darks
Darks should be taken whenever flats are taken and the exposure time should be the same as
the flats. Dark current is normally subtracted from object data when differencing object and sky
frames acquired in Nod mode. Flat fields must have their dark current (and icky pixels) removed
during the reduction process by subtracting separate dark frames. Darks must be acquired with the
same detector bias setting as your object and flat field data. Close the shutter before taking dark
frames.
7. Acquiring Objects
To acquire objects, first determine the position of the slit on the array that you are using. Take
an image of the slit in the Direct Imaging Mode looking at the sky or a discharge lamp (Kr or Ar).You
should get an image of the slit with an integration time of a few seconds or less. Record the central
column of the slit. It will change at each cool-down of the CSHELL, but it is usually near column
100.
Move the telescope to the object you wish to acquire. Move the slit to the "open" position.
Take an image of the field, and note the position of your object on the array (x,y coordinates). Use
the Options menu of the VF program and select TCS. Use this window to compute the telescope
offsets you need to center the object on the slit (the center of the slit will be near row 100). Note the
position of the object in the CCD camera field when it is centered in the slit. You may mark this
position on the TV monitor. Remember to insert the CCD filter (VCCD icon in CSHELLXUI) if the
CCD bleeds due to excessive object brightness.
8. Slit Rotation
The slit is normally positioned in the East-West direction. The primary reason for this is that
tracking errors will not usually lead to a loss of signal. To obtain any other rotation angle, the entire
instrument must be rotated using the IRTF instrument rotator. This requires manually rotating the
instrument, a procedure taking at least 15 minutes and not something to do often. The default EastWest slit position causes North to be located to the left and East down in the VF image display on the
Sun workstation. The top of the slit (as seen in VF) is then rotated 270° East of North, and this angle
is the default value in the VF TCS Coordinates frame. The slit location in the VF coordinate system is
drawn on the bottom of the CSHELL cryostat for easy reference while rotating the instrument. Once
the slit is rotated, enter the angle as defined in this convention in the TCS Coordinates frame of VF.
This will allow you to easily position any object in the imaging field onto the slit by pushing the
mouse buttons (see § II.B and § III.A for details). Please consult with your Support Scientist or
Telescope Operator if you need to rotate the instrument.
8/16/94
Page 74
IRTF CSHELL User's Guide
9. Integrations and Nodding
Prior to integrating, check the XUI path for the proper data location and change all of the
appropriate parameters in the Setup Parameters window frame. These items need be checked only
once each time the cshellxui software is started up.
Next check and change (if necessary) the following parameters:
•Integration time:
•Coadds:
•Cycles:
•Observing Mode:
•LastFrame Buffer:
•MeanFrame Buffer:
•AutoSave:
Seconds per exposure
Number of exposures per beam
Number of iterations of the selected observing mode
Stare or Nod
Buffer into which the last exposure is stored
Buffer into which the average of the cycles are stored
Check to have data stored into XUIpath directory
EXAMPLE: Take the case of:
•Integration time:
•Coadds:
•Cycles:
•Observing mode:
•LastFrame Buffer:
•MeanFrame Buffer:
2.0
1
4
Nod
b0
b1
This will generate 2.0 sec exposures, one exposure per beam, and 4 AB pairs (for a total of 8
separately stored exposures in ABBAABBA sequence). The last exposure is in buffer b0 and the
running average of the AB pairs will appear in buffer b1. For each AB pair the telescope "nods" from
position A to position B on the sky. The amount the telescope nods is set by the Telescope Operator,
so inform him about how far you wish to nod (in arcsec). Motion E/W or N/S or both directions is
possible for the nod. We recommend that you nod point sources along the slit with a throw of about
15'' in order to acquire object data in both the A and B frame positions.
You must select the CVF/Blocker Option and also use the shutter wheel blocker (SPF) when
observing with the 1.1 - 1.57 µm CVF! This CVF transmits # > 2.5 µm radiation, causing
significantly increased background in your data if not blocked as prescribed. The blockers impart
about a 10% reduction in flux over the 1.1 - 1.6 µm region.
NOTE: Every exposure is stored onto the disk if the Autosave is enabled. The exposures are
automatically named by the filename and the image number. For example if the filename is set to
"data" and the image number is "0010", then the above example produces 8 files named "data0010.a",
"data0011.b", "data0012.a", ..., "data0017.b". The extensions ".a" and ".b" refer to the A and B
beams.
8/16/94
Page 75
IRTF CSHELL User's Guide
10. Observing Extended Objects
When observing extended objects there will be additional concerns. First if the object fills the
slit, the object must be moved off the slit for observations of the sky. Note that the sky exposure also
contains ark current and other detector artifacts. These must be removed and therefore sky
measurements are required. However, one loses about half of the total available observing time
because of this.
Second, any standard star measurement will cover only a few of the rows that the extended
object covers. Hence the quality of the results may depend more on the quality of the flat-fields than
anything else. It may be advantageous to use the Moon as a flat-field source if it is an appropriate
standard, and you might want to drift-scan over it during exposures to smooth over any spatial
features. However, keep in mind that the Moon has many solar absorption lines and it has albedo
variations along the slit. It is far from being a satisfactory flat-field, but it may be handy for spectral
regions that are relatively free of solar lines if you can find a relatively uniformly illuminated patch of
the Moon. The moon should make a good telluric calibration source in the thermal IR (# > 3 µm).
It is possible to automatically move the telescope a specified amount between exposures in
order to map extended objects. For example, you can move in a vector parallel to the slit and 1 slit
width in size between each exposure. This is done by writing CSHELLXUI macros (Do Files) that
include TCS commands. Consult your support scientist or T.O. for help with this.
11. Command Files
After taking data with the CSHELL you will find that many tasks are repetitive, such as switching to
the imaging mode and back to the spectroscopic mode, setting up to peak up, setting up to observe,
etc. These repetitive tasks can be put into an cshellxui "command file" and executed, thus saving
time. More than saving typing, these command files can prevent loss of data by not having an
important parameter set properly (like turning on auto save). See the CSHELLXUI and VF software
guides (§III.A) for more information on using command files.
EXAMPLE: The following command files switch between imaging and spectroscopic modes and set
the detector bias appropriately. They are the default image and spect macros:
8/16/94
image
spect
PVoltages -3.700 -3.200
ITIME 0.1
Cycles 1
Coadd 10
InstMode D
Slit Open
AutoSaveXUI Off
PVoltages -3.700 -3.375
InstMode S
Slit 1.0
ITIME 10
Coadd 1
Cycles 20
AutoSaveXUI On
Page 76
IRTF CSHELL User's Guide
Other commands may be included in command files, such as a Go command to actually start a
sequence of exposures. The most commonly used command files, image, spect, goflat, and godark
are in the directory ~cshell/macro/cshellxui . These files configure CSHELL to take images, take
spectra, take flats, and take dark frames, respectively. The goflat and godark files contain a Go
command, so they actually start a sequence of exposures once they are executed. Be sure to review
the contents of a command file (by Loading it) before execution to make sure that it configures
CSHELL properly and does exactly what you want.
Commands to move the telescope (TCS commands) can also be included in CSHELLXUI Do
Files. See the IRTF document, Computer to TCS ASCII Communications for a complete listing of
TCS commands. As an example, the following macro will take an exposure, offset the telescope 1"
N, expose again, offset again, expose again, and then return to the original position:
tcs ABEAM
tcs 1 0.0 0.0 -1 C.SCN
echo Base Position
go
tcs 1 0.0 1.0 1 C.SCN
wait 2
echo Moved 1 arcsec N of Base
go
tcs 1 0.0 2.0 1 C.SCN
wait 2
echo Moved 2 arcsec N of Base
go
tcs 1 0.0 0.0 1 C.SCN
echo Done; Returned to Base
8/16/94
Page 77
IRTF CSHELL User's Guide
D. Observing Spectral Lines
1. Popular Astronomical Line List
The following table lists the vacuum rest wavelengths of some commonly observed near-IR lines and
band heads:
Material
HI
HI
HI
HI
HI
H2
HeI
HeI
H2
HI
HeII
H2
H2
CO
H2
HI
HeII
H2
HI
HI
H2
H2
HeI
HI
HI
H2
8/16/94
Transition
5-3
10-4
9-4
4-3
8-4
1-0
2P-2S
4S-3P
1-0
7-4
10-7
1-0
2-1
2-0
1-0
10-5
7-6
1-0
9-5
8-5
1-0
0-0
5-4
5-4
7-5
0-0
Name
P)
P*
B+
S(2)
S(1)
B!
S(0)
S(1)
bh
Q(3)
O(5)
Pf+
Pf!
O(7)
S(13)
B*
Pf)
S(9)
# (µm )
1.2822
1.7367
1.8179
1.8756
1.9451
2.0388
2.0587
2.1126
2.1218
2.1661
2.1891
2.2233
2.2477
2.2935
2.4237
3.0392
3.091
3.2349
3.2970
3.7406
3.8074
3.8462
4.0490
4.0522
4.6538
4.6946
Page 78
IRTF CSHELL User's Guide
2. Night Sky OH Lines
The following table list some night sky OH- lines in the J, H, and K windows that might be useful for
wavelength calibration or other checks. Observed wavelengths are in vacuum, bl denotes a blend,
and intensities are in units of photons s-1 arcsec-2. These data are taken from Ramsay, Mountain, and
Geballe, 1992, M.N.R.A.S. 259, 751. Also see this reference for more lines.
#
(µm)
1.0063
1.0263
1.0824
1.1430
1.2092
1.2660
1.3072
1.4501
1.4582
1.4818
1.4873
1.5170
1.5235
1.5319
1.5403
1.5524
1.5578
1.5622
1.5814
1.5946
1.6018
1.6059
1.6108
1.6217
1.6330
1.6434
8/16/94
Transition
v '' - v'
Q
Q
Q
Q
Q
R branch
P(2) bl
P(1) bl
P(2) bl
P(4) bl
R(1)-R(7)bl
P2(1)
P1(1)
P(2) bl
P(3) bl
P(4) bl
R(2) bl
R(1) bl
Q
P2(1)
P1(1)
P2(2)
P1(2)
P(3) bl
P(4) bl
P(5) bl
9-5
4-1
5-2
6-3
7-4
8-5
8-5
2-0
2-0
2-0
3-1
3-1
3-1
3-1
3-1
3-1
4-2
4-2
4-2
4-2
4-2
4-2
4-2
4-2
4-2
4-2
Intensity
3399.6
2276.3
676.9
825.7
758.7
801.1
602.5
937.4
929.9
825.8
1123.3
1082.9
3884.0
3556.2
2572.8
2259.9
1708.6
2483.4
6715.0
1038.2
3749.9
1634.2
4375.7
2960.2
1678.8
1574.5
#
(µm)
1.6489
1.6692
1.6891
1.6944
1.6992
1.7061
1.7101
1.7235
1.7367
1.7418
1.7639
1.9685
1.9756
1.9845
2.0270
2.0315
2.0400
2.0897
2.1110
2.1183
2.1250
2.1518
2.1792
2.1938
2.2108
2.2309
Transition
v '' - v'
Intensity
R branch
Q
P1(1)
P2(2)
P1(2)
P2(3)
P1(3)
P(4),R bl
P(5), R(2)
R(1) bl
Q
R(1) bl
R1(0)
R2(0)
P1(1)
P2(2)
P1(2)
P1(5)
R(2) bl
R(1) bl
R1(0) bl
Q
P1(1)
P1(2)
P1(3)
P1(4)
5-3
5-3
5-3
5-3
5-3
5-3
5-3
5-3,6-4
5-3,6-4
6-4
6-4
8-6
8-6
8-6
8-6
8-6
8-6
8-6
9-7
9-7
9-7
9-7
9-7
9-7
9-7
9-7
2021.5
6461.6
3466.8
1366.0
3839.3
1217.0
2706.9
1649.0
1917.2
1917.2
5821.0
1031.6
1638.8
620.8
2162.8
1019.6
2710.5
811.3
853.5
883.2
1044.0
2201.2
1533.7
1550.6
1461.3
1081.7
Page 79
IRTF CSHELL User's Guide
3. Using Calibration Lamps and cal_lines
CSHELL has three discharge lamps, Argon, Krypton, and Xenon. The Xenon lamp is mounted
behind one of the other lamps, so its lines are very faint. Therefore the Ar and Kr calibration lamps in
CSHELL are most useful for wavelength calibration of spectra. The following table lists their stronger
lines (s = strong and m = medium intensity):
Lamp
Ar
Ar
Ar
Ar
Ar
Ar
Ar
Kr
Kr
Ar
Kr
Ar
Ar
Ar
Kr
# (µm )
1.2706m
1.2806m
1.2960s
1.3012s
1.6945s
1.7450m
1.7920s
1.8172s
1.8701m
1.9823m
2.0215m
2.0323m
2.0622s
2.0992s
2.1171s
Lamp
Ar
Kr
Ar
Kr
Ar
Ar
Ar
Ar
Kr2
Kr2
Ar2,H
Ar2
Kr2
Kr2
Ar2
# (µm )
2.154m
2.1908s
2.2083m
2.2492m
2.3140s
2.3852s
2.3973s
2.5132s
2.8861s
2.9477s
3.0101m
3.0354m
3.0488s
3.0678s
3.1808m
Lamp
Ar2
Ar2
Ar2
Ar2
Ar2
Ar2
Kr2
Ar3
Ar3
Ar3
Ar3
Ar3
Ar2
Kr2
Ar2
# (µm )
3.1988m
3.2882m
3.3489m
3.3890s
3.490m
3.5839s
3.6345s
3.8117m
3.8419m
4.0112s
4.0524s
4.0879s
4.6279s
4.6694m
4.7703s
Beware that the discharge tube quartz envelopes absorb much of the radiation long-ward of 3 -4 µm;
lines in the above table with wavelengths greater than 3 µm are difficult to detect due to this
absorption as well as thermal emission by the envelopes.
An auxiliary program, cal_lines, is used to determine which calibration lamp lines are to
be used at a given wavelength selected for observation. The narrow spectral range of CSHELL
usually prevents observing a calibration lamp in the same order as your object spectra, and
cal_lines determines which order the lamp lines must be observed in. Position the mouse pointer
in a UNIX text window on the Sun XUI computer, selecting it with the left button and bringing it
forward if necessary. Type the following command in this window to display a list of calibration lamp
lines which can fall on the InSb array when the grating is positioned for observing your astronomical
line:
cal_lines #(µm) | more
where # (µm) is the desired central wavelength on the array. The list of available lines can be scrolled
through by pressing the space bar on the keyboard. Alternately, this list can be printed by the laser
printer with the following command in the UNIX window:
cal_lines #(µm) | lpr
These commands are also available on IRTF the workstation at H.P. One can print calibration line
lists at H.P. by specifying the name of the H.P. laser printer (uh88pr) :
8/16/94
Page 80
IRTF CSHELL User's Guide
cal_lines #(µm) | lpr -Puh88pr
Now consider an example of using these commands to determine which calibration lines to observe if
one is using the UNIX window on the Sun XUI computer. If we wish to observe HI Br !, # =
2.16609 µm wavelength, we issue the command:
cal_lines 2.16609 | lpr
which prints the following cal_lines table on the system printer:
Central Vacuum Wavelength = 2.166090 microns:
waveno
line(vac. um) obs(um)
order
4616.613 cm-1;
CVF(um)
order = 26
col(SBRC 256)
Argon lines
6040.898 1.655383
6040.500 1.655492
7287.392 1.372233
7457.021 1.341018
7456.983 1.341025
2.164732
2.164874
2.163906
2.166260
2.166271
34
34
41
42
42
1.6564
1.6564
1.3736
1.3409
1.3409
56
63
15
133
134
Krypton lines
5321.816 1.879058
5321.150 1.879293
5502.887 1.817228
5502.884 1.817229
5856.639 1.707464
5856.272 1.707571
5856.275 1.707570
6032.254 1.657755
6393.989 1.563969
6573.027 1.521369
6929.652 1.443074
6929.652 1.443074
7276.638 1.374261
7276.638 1.374261
2.168144
2.168415
2.166695
2.166696
2.167166
2.167302
2.167300
2.167833
2.165496
2.165025
2.164611
2.164611
2.167104
2.167104
30
30
31
31
33
33
33
34
36
37
39
39
41
41
1.8773
1.8773
1.8167
1.8167
1.7066
1.7066
1.7066
1.6564
1.5644
1.5221
1.4441
1.4441
1.3736
1.3736
228
242
155
155
179
186
185
212
95
71
50
50
176
176
Xenon lines - Very Faint!
5321.059 1.879325
2.168452
5856.272 1.707571
2.167302
5856.275 1.707570
2.167300
6039.008 1.655901
2.165409
30
33
33
34
1.8773
1.7066
1.7066
1.6564
243
186
185
90
The first line of the output lists the central (vacuum) wavelength and wave number as well as
the corresponding grating order for the astronomical line. The ensuing table lists the wave number,
actual wavelength, apparent wavelength, grating order, CVF (order sorting filter) central wavelength,
and approximate SBRC array column of each calibration lamp line. Note that no lines in the above
example list fall in the same order (26) as the desired astronomical spectrum. We can observe lines in
other orders by simply changing the CVF wavelength as explained in §II.A.
8/16/94
Page 81
IRTF CSHELL User's Guide
E. IRTF Computer Services
1. IRTF Mauna Kea Computer Facilities
The current IRTF computer facilities on Mauna Kea include a Sun workstation, several PCs,
and a PostScript laser printer on an ethernet network at the summit. These machines are also on a
summit network that includes other Mauna Kea telescopes and the machines at Hale Pohaku.
Currently the IRTF has a Sun workstation at Hale Pohaku that is available for data archiving,
reduction, etc. during your run. These machines on the summit network are only reachable through
U.H. Manoa machines via Internet, so you must make arrangements with your support astronomer if
you need access to them before or after your CSHELL observing run. You should obtain a guest
observer account when you arrive at Hale Pohaku by logging into the IRTF workstation as guests.
Use this account for all activities while at the IRTF. It will expire 3 days after your run.
2. Archiving Your Data
The recommended data archiving procedure is to copy each night's data files onto a separate 4
mm or 8 mm tape. Additionally, we recommend that you archive the data from all nights of your run
onto a single tape if you have time at the end of your last night. This will ensure redundancy of your
data in case some of your tapes are unreadable at your home institution. Our current housekeeping
procedure is to keep data on the Sun computer's (herschel.ifa.hawaii.edu) disk for 1 week, then
compress the data (UNIX format) and retain it for another week before erasing it. Be sure to read
your data tapes as soon as you get back to your institution; your data will be completely erased from
our computer two weeks from the date it was taken! Be sure to bring plenty of tapes (at least 1 per
night + 1) for your run.
We use the UNIX tar command (Tape ARchive) to transfer CSHELL data onto the tapes. Data
are stored in FITS format and are readable by IRAF. The following procedures for data archiving,
listing tape contents, and restoring tapes require that you issue their proper UNIX commands from the
Sun console or other UNIX window. The 8 mm tape drive is located adjacent to the IRTF
workstation named wien at Hale Pohaku, so 8 mm tapes must be written from Hale Pohaku. Wien's
UNIX device name for the 8 mm tape drive is /dev/rst0 (or /dev/nrst0). The 4 mm tape drive is
located adjacent to the IRTF summit workstation named Herschel, so 4 mm tapes must be written on
the summit. Herschel's UNIX device name for the 4 mm tape drive without compression is /dev/rst0
(or /dev/nrst0). Tar writes data into 20 block records by default. The following examples show how
to archive your data onto either drive. Sometimes we store data in other directories besides
/scr1/cshell/data illustrated below; if your data is in a different directory you must substitute its
name in the following commands.
ARCHIVING 1 NIGHT'S DATA
Commands:
8/16/94
cd /scr1/cshell/data
ls
tar -cvf /dev/rst0 directory
Page 82
IRTF CSHELL User's Guide
These commands will switch to the CSHELL data directory, list the nights there, and copy your
night's data onto the tar tape. You must substitute your night's data directory name for directory in
the above tar command. You should see the name of this directory when you execute the above ls
command. These directory names are usually of the form ddmon, e.g. 30aug .
ARCHIVING SEVERAL NIGHTS' DATA
Commands:
cd /scr1/cshell/data
ls
tar -cvf /dev/rst0 date1 date2 ...
PRINTING A TAPE'S TABLE OF CONTENTS
Commands:
or:
tar -tvf /dev/rst0
tar -tvf /dev/rst0 | lpr
The first command will list the names of the files of a tape archive to the Sun computer screen. The
second command will print the names of the files on the system (laser) printer. The second command
may take 10 - 20 minutes to execute without any confirmation until the pages are printed and the tape
is rewound - be patient!
SEVERAL ARCHIVES ON 1 TAPE
You may append data onto a pre-existing data tape, but this creates a new archive at the end of the
existing one rather than appending the old one. This makes the tapes more confusing to write and
read, and we do not recommend using his technique unless you must. It is most convenient to use the
drive without rewinding it (use the /dev/nrst0 device name) if you go this route. Sequentially enter
any of the above commands (once for each archive) using /dev/nrst0 instead of /dev/rst0. Rewind the
tape manually when you are done:
mt -f /dev/nrst0 rewind
READING YOUR DATA TAPES
You can usually read your data onto your home UNIX computer with the command:
tar -xvf /dev/rstx
where /dev/rstx is the device name of your 8 mm tape drive.
8/16/94
Page 83
IRTF CSHELL User's Guide
3. Anonymous FTP and WWW Site Information
The IRTF maintains an anonymous FTP site called IRTF On-line, providing remote access to
documentation and data reduction aids for IRTF observers. This site is on the machine
irtf.ifa.hawaii.edu (128.171.79.135), and the information on it is accessible through the FTP (File
Transfer Protocol) service of the Internet. If you have access to a machine on the Internet, then you
may retrieve copies of this information. This archive is also reachable through the IRTF World Wide
Web (WWW) home page (http://irtfweb.ifa.hawaii.edu/). Check it out!
All CSHELL information is kept in the directory /pub/IRTF/CSHELL . This directory
contains instrument documentation (including this manual), data reduction information, and some
IRAF scripts and bad pixel masks that are useful in reducing CSHELL data. The current directory
contents are kept in the README.txt file. Currently the CSHELL directory contains two directories,
one for documentation and one for IRAF data reduction aids. The Docs directory contains the files:
starting.ps
swref.ps.Z
data.txt
line_form.ps
logsheet.ps
manual_v2.ps.Z
manual_v2.word.Z
§ I and II of this CSHELL User's Manual
CSHELLXUI and VF documentation (§ III.A of this manual)
Text of Data Reduction Guide in § III.F.2 of this manual
CSHELL Line Set Up Form (from Appendix A of this manual)
CSHELL Logsheet (from Appendix A of this manual)
This entire CSHELL User's Manual
CSHELL User's Manual in MS Word format (Macintosh 5.1)
Here is how to access the information in IRTF On-line. First log on to IRTF On-line by typing the
following commands on your Internet host:
ftp irtf.ifa.hawaii.edu (or ftp 128.171.79.135)
(use "anonymous" when prompted for "Name" and use your email address as a password)
Now switch to the CSHELL directory:
cd /pub/IRTF/CSHELL
List the files in the directory:
ls
Retrieve the README.txt file which describes the CSHELL archive contents:
get README.txt
End your session:
quit
You may read the README.txt file on your local machine to see what is in the archive, and then FTP
back to hubble.ifa.hawaii.edu to get the files you want. We plan to update the archive contents
regularly, and we welcome your submissions.
8/16/94
Page 84
IRTF CSHELL User's Guide
F. CSHELL Data and its Reduction
1. CSHELL FITS File Header Example
SIMPLE =
BITPIX =
NAXIS
=
NAXIS1 =
NAXIS2 =
DATAMIN =
DATAMAX =
DATAMEAN=
ASEC_PIX=
DIVISOR =
ORIGIN =
TELESCOP=
INSTRUME=
OBSERVER=
OBJECT =
COMMENT =
IRAFNAME=
BEAM
=
IMAGETYP=
TIME_OBS=
DATE_OBS=
ITIME
=
CO_ADDS =
OBSMODE =
CYCLES =
INSTMODE=
GPOS
=
GANGLE =
ORDER
=
GWLEN
=
FILTER =
CVFWLEN =
FILTERA =
FILTERB =
SLIT
=
LMIRROR =
LAMP
=
SHUTTER =
VCCD
=
ARRAY
=
SAMPLES =
SAM_MODE=
FRM_RATE=
RESET_MS=
TEMP01 =
TEMP02 =
TEMP03 =
TEMP04 =
TPD
=
RA
=
8/16/94
T / DATA IS IN FITS FORMAT
16 / bits per pixel. Two comp. Integers
2 / NUMBER OF AXIS
256 / PIXELS ON 1st MOST VARYING AXIS
256 / PIXELS ON 2nd MOST VARYING AXIS
-82 / MIN DATA VALUE IN FILE
2795 / MAX DATA VALUE IN FILE
12 / MEAN DATA VALUE IN FILE
0.20 / PLATE SCALE in arcseconds/pixel
1 / Normalization value
'Institute for Astronomy'
'NASA IRTF'
'CShell Spectrograph'
'Your Name'
'HD129653 K=6.92'
'Comment for fits frame'
'hd1290019.a'
'A' / Object(A) or sky(B)
'object' / Type of image
'11:50:38.06' / UT TIME OF ACQISTION ('hh:mm:ss.ss')
'07/05/94' / UT DATE OF ACQUISITION ('dd/mm/yy ')
60.0000 / INTEGRATION TIME IN SECONDS
1 / NUMBER OF INTEGRATIONS
1 / obsmode is Nod (AB)
1 / Number of cycles
0 / Instrument Mode is S
235523 / Grating step position
63.509 / Grating Angle
26 / User's Order
2.17000 / Grating's wavelength
0 / Filter is CVF Wlen/Open
2.1700 / CVF Wavelength
'AF4 (Open)' / StepPos 1166
'BCVF1 (1.33 to 2.449 CVF)' / StepPos 4540
3 / Slit Wheel is 2.0
0 / Lamp Mirror is Out
0 / Lamp is Off
1 / Slit Wheel is Open
0 / VCCD is Out
0,0,256,256 / x,y,wid,hgt of data array
6 / Number of Samples
2 / 1=SINGLE, 2=DOUBLE
6 / In msec. Fastmode=Off SlowCnt=1 Samples=6
1000 / Idle Resets in msec.
30.00 / A_T1 InSb Array Temp
72.20 / A_T2 Grating Temp
180.00 / B_T1 CCD Temp
71.40 / B_T2 ColdBox Temp
' 14:40:38.81 36:58:26.5 01:49:28.21 1.143 1950.0 -O'
14:40:38.81 / Right Ascension
Page 85
IRTF CSHELL User's Guide
DEC
=
36:58:26.5 / Declination
HA
=
01:49:28.21 / Hour Angle
AIRMASS =
1.143 / Air Mass
EPOCH
=
1950.0 / Epoch
VDDUC
=
-3.700 / Programmable voltage VVDUC
VDET
=
-3.375 / Programmable voltage VDET
END
=
/ the end
2. Data Reduction Guide with IRAF Examples
Point Source Data Reduction
Note: Data should have been taken in nod mode (AB or ABBA, object is in both A and B beams and
nodding along the slit)
1) Flat Fields
a) combine the flat-field images: e.g. IRAF function 'imcombine' with avgsigclip
b) combine dark images: e.g. IRAF 'imcombine'
c) flat = a) - b) : e.g. IRAF 'imarith'
d) fix badpixels using the badpixel mask: e.g. use fix.cl IRAF script
e) normalize the flat-field, producing a frame called 'normflat'
2) Object Data
a) form differences A1-B1, A2-B2, ...B1-A1, B2-A2, ...: e.g. IRAF 'imarith'
b) combine the differences for each beam to give an A image and a B image:
e.g. IRAF 'imcombine'
c) divide each by the normalized flat-field: e.g. IRAF 'imarith'
d) correct for badpixels with the mask: e.g. use fix.cl IRAF script
e) Examine the images for any additional bad pixels or other problems
f) You may save disk space by stripping out NICMOS image areas where there is no data
e.g. use strip.cl IRAF script
3) Do the same for the standard star data, if any.
4) Extract the Spectra
The IRAF noao.twodspec.apextract package is well-suited to this. The three extraction steps can be
done interactively at once with the APALL task (dispaxis = 1) :
a) EDIT the aperture and width (and any background regions subtract)
b) TRACE the aperture, defining its position as a function of position across the frame
c) EXTRACT the one-D spectrum from the frame
5) Extract Calibration Spectra (based on spectral lamp data)
Assuming n>=1 images with n>=2 lamp lines (often in different orders):
a) combine the images to be used: e.g. IRAF 'imcombine' or 'imcopy'
8/16/94
Page 86
IRTF CSHELL User's Guide
b) extract a calibration spectrum for each beam (A,B) such that the calibration data are
extracted from the same part of the image as the object data. Do this using APALL,
setting 'referen' and 'profile' to the object data image, and do not edit or trace the
aperture.
We now have 1-dimensional spectra
6) Wavelength Scale Data (using noao.onedspec IRAF tasks)
a) for each line in calibration spectra, convert the line wavelength to the equivalent
wavelength in that order (done in cal_lines program)
b) use 'IDENTIFY' to fit a wavelength scale to the spectrum
c) use 'REFSPEC' to assign that wavelength scale to object spectrum
(careful to apply the A calibration to the A spectrum, etc.)
d) use 'DISPCOR' to produce a dispersion correct spectrum for each beam
7) Reduce the standard star data in the same way
8) Divide each object spectrum beam by the appropriate standard star beam
9) Combine All Spectra
Since the A, B beams will have, in general, different wavelength scales, use the function
'COMBINE' (noao.onedspec IRAF task), which will resample the spectra and average them. This is
the final spectrum.
10) Plot the final spectrum using SPLOT (noao.onedspec IRAF task), which can compute equivalent
widths, display wavelenght and intensity units, etc.
Extended Emission
If your object is extended along the length of your slit, then the standard point source spectral
extraction technique outlined above will probably not work optimally. First perform the frame
arithmetic outlined in steps 1) - 3) above. Divide the object and standard star data by the normalized
flat. Telluric correction: you may divide the flat-fielded object data by a flat-fielded standard star frame
which has been artificially extended along the slit direction, but it is best to rotate the images first so
that the slit is exactly perpindicular to the dispersion axis. Additional background subtraction can be
done with BACKGROUND (IRAF noao.twodspec.longslit task), and then you should register all
frames by moving them along the slit direction. IDENTIFY (IRAF noao.twodspec.longslit task) will
allow you to measure the centroid of flux peaks interactively, and IMSHIFT (IRAF images task)
allows you to shift the images to a common center. Combine all shifted images with IMCOMBINE
(IRAF images task). What you do from here depends on what you want to get out of the data as well
as its morphology.
8/16/94
Page 87
IRTF CSHELL User's Guide
G. Using the CSHELL CCD Guider Camera
The CSHELL CCD is now a scientific-grade Tektronix 512 x 512 pixel CCD which is
operated via IC and XUI programs like other IRTF instruments. Its startup and shutdown
instructions are given in § III B. It can be operated in a continuous mode for acquisition, a single
exposure mode, or an auto-guide mode. The CCD is clocked at a rate of 333,000 pixels / sec, so it
takes just under 1 second to read a frame; this limits the minimum exposure time also.
The CCD views the same field as the IR array and is not obstructed by the slit or other
apertures. It looks through an IR-reflecting dichroic which has a pass band similar to an R-band filter.
A 1000x attenuation filter can be switched in front of the CCD for observing bright objects (VCCD
icon in CSHELLXUI). Pixels can be binned in software (1x1, 2x2, 4x4, or 8x8) to improve signalto-noise. N is up and E is to the left on the CCD monitor (or in VF) when CSHELL is mounted in its
normal E-W slit configuration. The CCD has a 55" (E-W) x 65" (N-S) FOV, 0.15"/pixel plate scale,
and V=17 mag limit.
CCD images can be automatically sent to VF for display by selecting the View IC Data
checkbox. Once in VF, they can be saved as FITS files via the VF Save Data menu choice. It takes
several seconds to send each frame to VF, so continuous readout mode will slow considerably if this
option is selected. The guider should be operated as follows.
1) The TO should start the gic program (on max) at the start of each night. The observer should not
start the gic. Starting the gic is done by logging into casspc with the login "guider" (no password).
Then type "gic" and a carriage return to start the gic.
2) The observer should start the Guider XUI software (by selecting "Guider XUI" from the CSHELL
OpenWindows menu) whenever he wishes to take images with the CCD for guider acquisition. He
should optimize exposure time, set the proper binning (e.g. 2x2 or 4x4 for better sensitivity in bad
seeing or 8x8 to be able to guide on Jupiter's or Saturn's large disk), select the 1000x CCD filter if
needed (Cshell XUI), return the software to "Single Shot" frame mode, and then QUIT the Guider
XUI before asking the TO to View or automatically guide with the CSHELL CCD. The observer
should repeat this step whenever a new object is acquired. The observer will not be notified of CCD
hardware timeouts or be annoyed by guider frame beeps when the Guider XUI is not running. This
is a good thing!
3) The TO should use the IRTF guide program to autoguide with CSHELL. The rotation angle for
the CSHELL CCD guider should now be approximately (within 3 degrees) the same as the CSHELL
IR slit rotation angle entered into the VF TCS Coordinates Window by the observer. This angle is the
position angle on the sky of the top of the CSHELL slit as seen in VF.
4) If the gic software has a hard failure (e.g. unrecoverable socket errors), then the TO should shut
down the gic software (type "die" and a <CR> in the gic window) and restart the gic. If errors recur,
then shut down the gic, exit from cass pc, login to cass pc as oroot, and then reboot casspc with the
"reboot -a" command. Wait a minute or so and then login to casspc as guider and restart gic.
The guider software commands follow:
8/16/94
Page 88
IRTF CSHELL User's Guide
GIC / GUIDER XUI Command Reference
do_stats() - Sets the calculation of stats on the DSP
Syntax: stats { Off | On }
do_range() - Sets the range for fixed scaling
Syntax: range {min} {max}
do_array() - Sets the array type
Syntax: array { 64 | 512 }
ddo_senddata8() - Asks guider to send 8 bit data. Writes
data to file "guider.img"
Syntax: Senddata8
do_scale() - Sets the type of scaling on the DSP
Syntax: scale { None | Fixed | Auto | Slice}
do_autodata() - Sets the transfer of 32 bit data from the
DSP
Syntax: autodata { Off | On}
do_cammode() - specify clocking and readout program.
Syntax: cammode {singleshot | simulation}
do_coadd() - Set number of coadds on DSP
Syntax: coadd {n}
do_color - determine what character attributes the kbio
process uses to update the parms window on stdout.
syntax: color { no | yes }
do_sendinfo() - Send status information. Just a dummy,
since info is always sent.
Syntax: Sendinfo
do_register() - Set up the array control signals
Syntax: register {0xnn}
do_sync() - Synchronizes the DSP and TEK DEV.
Syntax: sync
do_slice() - Sets the LSB for slice.
Syntax: Slice {bitslice}
do_simulate() - Set the simulation on the DSP
Syntax: simulate { Off | On }
do_cycles() - Set the number of image cycles on the DSP do_status()
Syntax: cycles {n}
do_stop() - Stop the latest integration
do_die() - quits the program.
Syntax: stop
Syntax: die
do_tcs() - Send a string to the TCS computer. This
do_go() - Performs a GO. (starts integration sequence)
string is assumed to be a correct TCS Command w/ 40
syntax: go
chars max. This command uses the GO task to
communication with the TCS. Thus the GO task must
do_goinit() - send a init message to the GO task. GO
be ready before continuing.
can be initialized at anytime.
Syntax: tcs {command string}
syntax: GOInit
do_tcshostname() - the host providing the data socket
do_goreset() - send a RESET message to the GO task.
port.
syntax: GoReset
Sytnax: tcshostname {hostname}
do_itime() - Set integration time in seconds
Syntax: itime {seconds}
do_zoom() - Sets the display window zoom factor
Syntax: Zoom {mag}
o_window() - Sets the size and location of the
stats/display window. Only this part of the array will be
scaled and displayed.
Syntax: Window xoffset xsize yoffset ysize
8/16/94
do_viewicdata() - Sets the viewicdata mode for the IC
program
Syntax: viewicdata { Off | On }
do_wait() - Sets the acq task busy for N seconds.
Syntax: wait {seconds}
do_xuihostname() - the host providing the data socket
port.
Syntax: xuihostname {hostname}
Page 89
IRTF CSHELL User's Guide
IV. Appendices
A. Observing Log Sheet and Line Settup Form
8/16/94
Page 90
File Name
Observers
Directory
Number Object
# or ,
Slit
Mode Exposure U. T. Airmass Comments
CSHELL LOGSHEET
U.T. Date
Page Number
CSHELL Line Setup Form
Line Name _________________
# __________ µm
, __________ cm - 1
Order __________
(g
__________
Ng
__________
Filt. Pos. ______________
Lamp
, (cm-1 )
# (µm )
# obs (µm ) Order
# CVF (µm )
col pred col o b s
________ _________
________ ________ _ _ _ _
________
_____
_____
________ _________
________ ________ _ _ _ _
________
_____
_____
________ _________
________ ________ _ _ _ _
________
_____
_____
________ _________
________ ________ _ _ _ _
________
_____
_____
________ _________
________ ________ _ _ _ _
________
_____
_____
________ _________
________ ________ _ _ _ _
________
_____
_____
________ _________
________ ________ _ _ _ _
________
_____
_____
________ _________
________ ________ _ _ _ _
________
_____
_____
Other Lines
Line (telluric, object, or sky) # (µm )
col o b s
_______________________
_________
_____
_______________________
_________
_____
_______________________
_________
_____
Dispersion:
_________________ (µm/pixel)
_________________ (km/sec/pixel)
Comments: _______________________________________________________________
________________________________________________________________________
IRTF CSHELL User's Guide
B. CSHELL Hardware Reference
8/16/94
Page 93
IRTF CSHELL User's Guide
AF5 - Blank
Filter Wheel #1 (A)
AF6 - 4.1 µm SPF
AF4 - Open
0
1166
12833
AF7 - 2.5 µm SPF
330˚
0˚
AF3 - HI 2.166 µm
30˚
11666
2100
54˚
300˚
70˚
10966 282˚
AF2 - He I 1.083 µm
2722
86˚ 3344
AF1 - Unused (Blank)
102˚ 3966
ACVF1 - 1.1 to 1.57 µm CVF
BF5 - Blank
Filter Wheel #2 (B)
BF4 - Open
BF6 - 2.5 µm SPF
0
BF3 - Unused (Blank)
12833
330˚
11900
306˚
BF2 - 4.05 µm NBF 11277
1166
0˚
30˚
2022
52˚
290˚
BF1 - 2.35 µm
NBF10636 273.5˚
10033
BCVF1 - 4.27 to
5.6 µm CVF
BCVF1 - 1.33 to
2.449 µm CVF
258˚
228˚
255˚
8860
8750
136˚
143˚ 5288
5561
BCVF1 - 2.46 to 4.54 µm CVF
Figure 1. CSHELL Filter Wheels. Inner numbers are degrees, outer ones are motor step positions.
8/16/94
Page 94
IRTF CSHELL User's Guide
The filter wheel are controlled from the PC-38.
Filter A is on the 'r' axis.
Filter B is on the 's' axis.
The following tables display the name and position of the filters on Filter A and FilterB:
.
Filter B
To
ot. Steps= 14000
Filter A
Name
AF1
AF2
AF3
AF4
AF5
AF6
AF7
ACVF1
To
ot. Steps= 14000
Description
Degrees Step Pos
Unused
8 6 3344.4
He I 1.083
7 0 2722.2
Unused
5 4 2100.0
Open
3 0 1166.7
Blank
0
0.0
4.1 um SPF
330 12833.3
2.5 um SPF
300 11666.7
1.10 to 1.57 CVF
102 3966.7
282 10966.7
Name
BF1
BF2
BF3
BF4
BF5
BF6
BCVF1
BCVF2
BCVF3
Description
Degrees
2.35 NBF
273.5
4.05 NBF
290
Unused
306
Open
330
Blank
0
2.5 um SPF
30
1.33 to 2.449 CV
52
136
2.46 to 4.54 CVF
143
225
4.27 to 5.60
228
258
Step Pos
10636.1
11277.8
11900.0
12833.3
0.0
1166.7
2022.2
5288.9
5561.1
8750.0
8866.7
10033.3
The filter menu selection and the position of wheel A & B are indicated by this table.
Menu Index
0
1
2
3
4
5
6
7
8
9
10
11
Description
CVF & Open
2.35um NBF/Open
4.05um NBF/Open
He 1.083/Open
HI 2.167/Open
Blank
Open
CVF & Blocker
2.35um NBF/Blocker
4.05um NBF/Blocker
2.5um Blocker
4.1um Blocker
Filter A position
See CVF Position
AF4
AF4
AF2
AF3
AF5
AF4
See CVF Position
AF7
AF6
AF7
AF6
Filter B position
Table
BF1
BF2
BF4
BF4
BF5
BF4
Table
BF1
BF2
BF4
BF4
When menu index 0 or 7 are select in order to use the CVFs, the positions of the wheels are calculated from the
following tables. Search the table until you found the first row which include the wavelenght you are using. The "CVF
Used" column indicated which filter is used. The step position are calculated from the coefficients found in the columns
"Motor Position Equations Terms". For the other filter, the Blocker or Open position is given by the "Position of
Other Wheel" column.
From To
1.100 1.570
1.570 2.449
2.460 4.100
4.100 4.350
4.350 5.600
8/16/94
CVF Used
ACVF1
BCVF1
BCVF2
BCVF2
BCVF3
Position of Otther Wheel
Blocker
Open
BF6
BF4
AF7
AF4
AF6
AF4
AF4
AF4
AF4
AF4
Motor Positio
on Equations Teerms
-10609.83
13495.61
-1625.66
2838.23
2450.57225 1380.7596
Same as abovee
5354.37862
860.7481
0
1.48
0
0
Page 95
IRTF CSHELL User's Guide
Figure 2. CSHELL Slit Wheel. Inner numbers are degrees, outer ones are motor step positions.
0.5
Blank
0.5s
Open
54698
H
4925
51587
1.0
8031
48487
331.6
4.0
1181
351.6
7.6
31.7
45362
K
11142
51.6
311.7
71.6
291.6
Open
17365
39143
2.0
L’
131.6
231.7
211.6 191.6
171.7
36035
L
111.6
251.6
1.5
14254
91.6
271.6
42254
151.8
20476
M
23607
32920
29809
Open
Blank
26702
Pinhole
Pattern
The Slit wheel is control from the PC-38 from the 't' axis. Note the slit wheel has multiple Blank and Open positions.
When selecting a Blank or Open, the software will move the wheel to the nearest Blank or Open.
Wheel Size = 56000
Menu Index
0
1
2
3
4
5
5
6
6
6
7
8
9
10
11
12
13
14
8/16/94
Description
0.5
1.0
1.5
2.0
4.0
Blank
Blank
Open
Open
Open
H
K
L
L'
M
0.5s
Pattern
Pinhole
Step
54698
48487
39143
36035
45362
1181
29809
32920
42254
51587
8031
11142
14254
17365
20476
4925
26702
23607
Degrees
351.6
311.7
251.6
231.7
291.6
7.6
191.6
211.6
271.6
331.6
51.6
71.6
91.6
111.6
131.6
31.7
171.7
151.8
Page 96
IRTF CSHELL User's Guide
Shutter Wheel
Switch
4. Blocker
Light path
Light path
3. Blank
1. Initial (Blank)
2. Open
Shaft
SBRC
Array
Unused
Bay
1. View is from side in whcih filters are installed
2. Switch engaged at postion 1 (Both blank).
3. Blank in position 3 is used to blank off instrument.
4. Motor shown is direction moved when motor turns shaft
clockwise.
The Shutter wheel is controlled from the PC-38 from the 'v' axis.
Wheel Size = 5000
Menu Index
0
1
2
8/16/94
Description
Blank
Open
2.5 SPF
Step
Degrees
125
1375
3875
9.0
99.0
279.0
Page 97
IRTF CSHELL User's Guide
RS-232 Devices
To communication with serial devices the CSHELL IC computer is equipped with a 4-COM Serial Port Adapter by
STB Systems, Inc (214-234-8750). The configuration of the serial board is as follows:
Port
COM1
COM2
COM3
COM4
I/O Base
0x3f8
0x2f8
0x3e8
unassigned
IRQ
IRQ4
IRQ3
IRQ10
Comments
Atttached to TC#1
Attached to TC#2
Attached to Encoder
Temperature Controller
CSHELL uses two series 9620 Temperature Controller by Scientific Instruments, Inc. The controller communicates to
the IC computer via the serial ports. The TempCmd command allows you to communicate with the temperature
controller using its native instructions outlined in its manual. These instructions are summaried here for your
convinence.
FUNCTION
Input the Setpoint
Input Proportional Term
Input Integral Term
Input Derivative Term
SYNTAX
Snnn
Pnn
Inn
Dnn
EXAMPLE
'S400' sets the setpoint to 40.0 Kelvin.
'P50' sets the proportional term to 50.
'I20' sets the integral term to 20.
'D20' sets the derivative term to 20.
Get Temperature Setpoint
Get Proportional Term
Get Integral Term
Get the Derivative Term
Get Heater Ouput
Get Temperature T1
Get Temperature T2
Toggle Control Mode
S
P
I
D
H
T
t
X
'S' will return the Setpoint.
'P' will return the proportional term.
'I' will return the integral term.
'D' will return the derivative term.
'H' will return the heater output.
'T' will return the T1 temperature.
't' will return the T2 temperature.
'X' will toggle the heater off/on.
Please note that the syntax is case senitive.
The syntax for the command to the IC to sent temperature commands is: TEMPCMD {A | B} command
Encoder
The default encoder parameters are:
SN
SP
SE
AR
SD
SO
SF
8/16/94
=
=
=
=
=
=
=
0
01
0
0
0
0
025000
Page 98
IRTF CSHELL User's Guide
CSHELL's RACKMOUNT SETUP
CSHELL Instrument Control computer is a 20 slot 386/20 Rackmount PC-AT computer. This section attempts to
documents the setup the various peripheral board install in the PC.
Ethernet Card
The ethernet card for the PC is a SMC EtherCard Plus Elite16. This is the default card supported by lynxOS. We have
configured the board to be compatiable with Lynx. The board is setup as follows:
A
1
Adapter
WD EtherCard Plus Elite
B
I/O Base Addr
0x240-0x25f
C
DMA Channel
N/A
2
D
IRQ
E
Other Notes
ROM Based addr = None/Disabled.
Shared RAM at CC000.
5
MM-96 Detailed Setup
CSHELL uses two MM-96 DSP to provide clocking and buffer board functions. The clock DSP make no use of any
DRAM. While the BCARD DSP uses the additional DRAM (up to 16Mwords) in speckle and movie mode.
A
B
Clock DSP
C
Bcard DSP
PC I/O Address
0x148 (NFNFNNFN)
0x158 (NFNFNFFN)
DMA
No DMA - H1 & H2
Unlinked
No DMA - H1 & H2
Unlinked
4
H3 - IRQ
11 (Connect 7 & 8)
12 (Connect 5&6 )
5
H4 - DSPnet Address
0 (connect pins 5 & 6)
0 (connect pins 5 & 6)
6
H5 - Hyperbus Port A
Delay = 0. ( ] ] ] )
Delay = 0. ( ] ] ] )
7
H6 - Hyperbus Port B
Delay = 0. ( ] ] ] )
Delay = 0. ( ] ] ] )
H7 - Real-time
Clock/DRAM Speed
No clock int. Slow
DRAM mem. ( : : : )
No clock int. Slow
DRAM mem. ( : : : )
M1/M2 - Outer SRAM B
64k x 4
64k x 4
1 0 M3/M4 - Outer SRAM A
1 1 M5/M6 - Inter SRAM
64k x 4
64k x 4
64k x 4
64k x 4
1
2
3
8
9
The CSHELL project purchased the following DSP boards. Two full boards were initially purchased.
1
2
3
A
Serial NUMBER
1052
B
Use
Clock
C
D
SRAM configuration DRAM configuration
64 K words in all 3 banks 256 Kwords or 1 MBtye
1054
Buffer
64 K words in all 3 banks
256 Kwords or 1 MBtye
4
8/16/94
Page 99
IRTF CSHELL User's Guide
PC-38 Stepper Motor Controller
An Oregon Micro System's PC38-8 board is installed to control the stepper motors for NSFCAM. The board is
configured as follows:
1
A
Adapter
B
I/O Base
C
DMA Channel IRQ
2
PC-38
0x0320
n/a
J47 Limit sense jumpers:
[:]
:
:
J15 Address Select Jumbers:
[:] [:] [:]
D
n/a
:
:
:
:
[:] [:]
[:] [:]
:
: =
J17 Interrupt and DMA Jumpers:
:
:
:
:
:
:
:
: No
J67 User I/O Pull-up Jumpers:
:
:
:
:
:
:
:
:
J57 I/O Configuration Jumpers:
[:]
:
[:]
0x320
Ints.
0-3 inputs
8-11 outputs
4-7 inputs
DIO48
CSHELL make use the the DIO48 Digital I/O board to provide additional I/O bits. Cshell only utilities/programs 1 or
the 2 available 8255 for digital I/O. The timera are not used. (Note: The wire wrap between the timer and some DIO
lines are left in place from the echellc I project (NICMOS & SBRC 64 control).
I/O Base: 0x280
Interrupts: None
The 8255 #1 connected to J0 is initilaized using Mode 0x82.
Port A - Output
Port B - Input
PB0 - Lamp_limit_off
PB1 - Lamp_limit_on
PB2 - vccd_limit_off
PB3 - vccd_limit_on
PB4 - dimirror_limit_off
PB5 - dimirror_limit_off
Port C - Output
PC0 - Lamp_mirror_cntl
PC1 - vccd_cntl
PC2 - dimirror_cntl
PC3 - UNUSED
PC4 - AR Lamp*
PC5 - KY Lamp*
PC6 - Xe Lamp*
PC7- Cont. Lamp*
* Note currently the DIO48 is onlu used on control the Lamps. The additional
definition are specified incase we switch the DC motor control from the PC-38 IO
bits to the DIO48.
SVGA Board
CSHELL uses the SVGA board as a text only output device. Any generic VGA board will do.
8/16/94
Page 100
IRTF CSHELL User's Guide
C. Troubleshooting
CSHELL is a mighty instrument but is not immune to failure. We have attempted to identify
common possible failures, and here we list their modes and possible fixes. Always get help from your
support scientist, telescope operator, or other IRTF staff person. We now examine some possible
failures and their fixes.
Mojo Motor Madness
Each CSHELL mechanism is controlled by a stepper motor or other actuator. Sometimes
these motors, their mechanisms, or their electronics fail in various ways. Sometimes a mechanism
will never become READY at startup of the cshellic software; it will stay in the INIT or ERROR
modes instead. Most mechanisms may be initialized by commands typed in from the cshellic or
cshellxui machine keyboards; see § III.A for details. For example, if the Slit process shows an
ERROR or INIT condition that never clears in the cshellxui status window at startup, then you can
attempt to clear the condition by issuing the SlitInit command. Sometimes such initialization
commands must be repeated several times to clear an ERROR or INIT state.
These initialization commands may also be executed if a mechanism generates an ERROR or
continuous INIT state during normal operation. INIT states sometimes take 2 or 3 minutes to clear to
READY; wait some time before attempting to re-initialize the mechanism. If a more serious errors
occurs, such as the filter or slit wheels not moving to the correct locations, the shut down and restart
CSHELL as directed in § III.B. If this clears your errors, then CSHELL is safe to operate. If it does
not clear your errors, then you can force CSHELL to ignore the problem by issuing a setmotorrdy
command (see III.A). CSHELL will be OK to use if you do not need to move the offending
mechanism. The nature of a failure should be reported, investigated and documented
Filter and Slit Wheels
Positions of filter wheels and the grating can be examined from the cshellxui Motors frame of
the program's main window pane. Motors can be commanded to go to specific step positions (see
commands in § III.A). It is useful to try to move them forward as well backward in order to isolate
the failure. Beware that filter wheel A is labeled wheel 1 and filter wheel B is labeled wheel 2 on the
CSHELL dewar. See Figure 1 in the CSHELL Hardware Description (Appendix B) for positions of
the various filters on each wheel (also see the CSHELL Filters notebook), and see Figure 2 in the
CSHELL Hardware Description (Appendix B) for positions of the slit wheel. The conversions
between wavelength and step position are given for each CVF in the following table:
8/16/94
Page 101
IRTF CSHELL User's Guide
CSHELL CVF Position Table
CVF
Wavelength Range
Wavelengths Used
Motor Position Equation
ACVF1
1.10 - 1.57 (µm)
1.10 - 1.569 (µm)
13495.61·#(µm) - 10609.83
BCVF1
1.33 - 2.50 (µm)
1.57 - 2.449 (µm)
1.480·#2(µm) + 2838.225·#(µm) - 1625.656
BCVF2
2.46 - 4.54 (µm)
2.46 - 4.35 (µm)
BCVF3
4.27 - 5.60 (µm)
4.35 - 5.60 (µm)
1570.229 % # (µm) + 1674.65
#(µm ) + 6.22061
1.16178 × 10 -3
Other Problems
CSHELL can experience other problems also. The following table lists some possible
problems and suggested remedies.
Symptom
Solution
Manual Sect.
Array or Cold box Temperature
is wrong
Check dewar for liquid nitrogen,
make sure closed-cycle cooler is
on, check controllers.
§ II.A,
Appendix D
No Calibration Lamp lines
Check cshellxui status window,
check filter wheel positions in
Motors window, make sure lamps
are on (look in holes in cal box),
check instrument power and cables
IR Array Data Values are Funny
or near-zero
Excessive or Intermittent Noise
Program bias voltages with Set
Programmable Voltages (Setup)
Check cable connections, re-route
data cables away from stepper
motor cables.
8/16/94
§ II.C
Page 102
IRTF CSHELL User's Guide
CSHELL Grating Equations
1. Grating Step N as a function of angle (:
N = -1,056,268 + 18,634.80%( + 26.85632%(2
( ~ 22 steps / IR array pixel)
2. Wavelength to grating angle:
# (µm) = 2%.%sin( ;
n
n = order; . = groove spacing: 31.5195 µm cold
3. Order Calculation:
n = 2%.%sin(
# (µm)
nopt = 2%.%sin(/
# (µm)
(nearest integer);
= 56.416 cold
# (µm)
(Integer Order closest to Blaze angle (/ = 63°.5)
4. Dispersion:
$# (µm/pixel) = C%# (µm)
2%tan (
Verifying CSHELL Throughput
CSHELL is measured to have 16.5% total throughput (including telescope & atmosphere) at 1.25 2.2 µm (2% CVF), and 12% throughput at 3.4 (1% CVF) - 4.8 µm (2% CVF) in spectroscopic
mode. You can use an Elias standard or the continuum lamp flux as a more convenient check.
Image (* - sky ADU)
55558 in 2 sec
101,981 in 2 sec
40,500 in 0.25 sec
8970 in 0.1 sec
spec (10w x20pxl)
3864 ADU in 60 sec
2906 ADU in 60 sec
26,400 ADU in 30 sec
4323 ADU in 10 sec
# (µm)
1.2537
2.1698
3.526
4.701
Elias Std (2" slit, 63°.5 gr)
HD 161903 J= 7.17
HD 161903 K=7.02
HR 8143 L= 3.71
HR 8143 M=3.72
# (µm)
1.2537
1.6593
2.1698
3.5260
4.701
Max ADU/pixel in 5 sec Spect of Continuum Lamp (1" slit)
1300 (with blockers in)
2709
2906
635
3807
8/16/94
Page 103
IRTF CSHELL User's Guide
D. Temperatures and Controllers
The CSHELL dewar and optics are cooled by a liquid nitrogen bath which must be filled once
per day, usually at the start of each night. A closed cycle cooler provides additional cooling for the
arrays. The arrays are maintained at their optimal operating temperatures by temperature controllers
which apply small amounts of resistive heating to the devices. It is the user's responsibility to keep
an eye on the array, cold box, and grating temperatures. The temperatures will drift if CSHELL runs
out of liquid nitrogen, if the controllers get reset, or if the closed cycle cooler fails. The cold box
should be 72.5 ± 2 K. Temperatures any higher will cause focus and dispersion changes. The grating
is cooled by the same bath as the cold box, so its temperature will usually follow the cold box.
Follow the troubleshooting procedures in Appendix B if the cold box temperature is out of its range.
The following procedures for resetting the temperature controllers should be performed by an IRTF
operator or staff member only:
The detector array temperature controllers are located on the front side of Box 5 which is
mounted on the telescope along with CSHELL. The controllers usually have their set points reset to 0
K when powered off, and their heaters are off when the controllers are initially powered on. The
arrays will cool to 20 K and will not be operational if the set points are not set and if the heaters are
not turned on. The day crew properly sets the array temperatures and powers on the heaters when
they mount CSHELL on the telescope, but you must set up the controllers if you have powered down
Box 5 due to approaching lightning or as part of a troubleshooting procedure. The following
procedure illustrates how to read the array temperatures, set the set points, and turn on the heaters.
Controller A controls the SBRC InSb array temperature (30.0 K set point) and Controller B controls
the TEK CCD array temperature (175 K set point). The controllers may be set up either via their front
panel controls (Procedure A) or else via software (Procedure B).
Procedure A: Front Panel Configuration
Read Array Temperature on controller front panel LCD display (T1 probe).
Press ENTER button until set point field is selected (S xxx.x on display)
Press ENTER to change the set point temperature
Press SCROLL to change current digit, press ENTER to accept and move to next digit
Press RETURN to enter the displayed temperature as the set point.
Press RETURN to activate the heater. The green HEATER LED should light.
Procedure B: Software Control
Alternatively, you can read and set the array temperatures via the cshellxui software:
•Read the array temperatures and set points in the cshellxui main window
•Change the set points by typing the “tempcmd A S300” or “tempcmd B S1750” commands
on the cshellxui command line for the IR array and CCD, respectively. See § III.A for details.
•Turn the heaters on or off by typing the “tempcmd A X” or “tempcmd B X” (see p. 98)
command on the cshellxui command line. Heater status in the cshellxui window will display
“ERROR” if the heater is off or the heater voltage if it is on. See § III.A.
8/16/94
Page 104
IRTF CSHELL User's Guide
E. Summary of Upgrade Changes for Previous CSHELL Users
CSHELL Upgrade User Documentation Addendum
I. New InSb Array
CSHELL now has a single IR detector array, a 256 x 256 pixel Hughes SBRC InSb device. It performs at least as well
as the old NICMOS-3 array in nearly all respects, while it also has increased spectral response, better quantum
efficiency, and reduced artifacts (less residual image and no corner glow). The new array results in the following
performance parameters:
- 1 - 5.6 µm response; 16.5% total spectroscopic throughput @ 2.2 µm
- 700 km/s spectral range per exposure when grating at blaze angle
- 0.20 arcsec/pixel and 2.7 km/s/pixel
- R.N. ' 33 e- Idark 0 0.5 e-/ADU
The new array also requires some operational changes. Foremost, the detector bias must be programmed to match the
observing application. Using a single fixed bias (as done with the NICMOS array) is inappropriate because of nonlinearities and icky pixel artifacts in the SBRC 256 x 256 InSb arrays. Larger biases allow more electrons to be
collected before saturation, but they also cause increased numbers of high dark current pixels (icky pixels) and low-level
non-linearities. Fortunately, the icky pixels mostly disappear when object and sky frames are subtracted. Dark frames
with exposure times equivalent to flat fields should be taken to subtract these pixels from your flats. Linearity
problems can be avoided if you expose your fats so that they have similar data counts to your object frames. You may
coadd many flats to achieve high S/N. I recommend that you pick one of four following detector bias settings for you
observations:
Observation
Bias (mV)
Well
VDDUC
VDET
XUI MACRO
Most Spectroscopy
Bright Thermal Spectroscopy
Bright or Thermal Imaging
Thermal Imaging with very
high backgrounds
325
500
800
1000
5000
8400
15,500
21,300
-3.7
-3.7
-3.7
-3.7
-3.375
-3.200
-2.900
-2.700
small
medium
large
huge
Notes:
Well: The maximum number of ADU counts (1 ADU = 11.0 electrons) that can be collected while not
departing more than 1% from the linearity relation of the mid-well range.
VDET & VDDUC are detector biases (Volts) that can be typed into the SETUP Parameters frame of the CSHELL XUI
Application.
XUI MACRO is the name of a command file that can be executed from the Options menu of
the CSHELL XUI application. These files automatically set the indicated bias levels.
There are also some other operational changes resulting from the new array. Most importantly,
you must select the CVF/Blocker Option and also use the shutter wheel blocker (SPF) when observing with the 1.1 1.57 µm CVF! This CVF transmits # > 2.5 µm radiation, causing significantly increased background in your data if
not blocked as prescribed. The blockers impart about a 10% reduction in flux over the 1.1 - 1.6 µm region. Now
exposures can be as short as .076 s or even less. The bias voltages must also be set (DO File or push
button in Setup Parameters Window) when the software is started.
8/16/94
Page 105
IRTF CSHELL User's Guide
II. New Tek 512 x 512 Acquisition & Guide CCD
The old surveillance CCD has been replaced with a scientific-grade Tektronix 512 x 512 pixel CCD. The CCD is
operated via IC and XUI programs like other IRTF instruments. It can be operated in a continuous mode for acquisition,
a single exposure mode, or an auto-guide mode. Use of the guider software is described in § III. G of this manual. The
CCD is clocked at a rate of 333,000 pixels / sec, so it takes just under 1 second to read a frame; this limits the
minimum exposure time also. A 1000x attenuation filter can be switched in front of the CCD for observing bright
objects. Pixels can be binned (1x1, 2x2, 4x4, or 8x8) to improve signal-to-noise. N is up and E is to the left on the
CCD monitor (or in VF) when CSHELL is mounted in its normal E-W slit configuration. The CCD has a 55" (E-W) x
65" (N-S) FOV, 0.15"/pixel plate scale, and V=15 mag limit. CCD frames may be viewed in VF and saved as FITS
files. The CCD looks through an IR-reflecting dichroic which has a bandpass similar to an R band filter.
III. Startup and Shutdown Software Notes
All software can be started up from your user account on an IRTF Sun workstation at the summit (planck) or HP
(wien). Just remember to type "xuihostname wien" in the command line of the CSHELL XUI program if running from
that HP workstation. The CSHELL and CASSPC (the guider pc) Instrument control (IC) Intel architecture computers
can also be logged into from their directly connected keyboard / monitor consoles. The new calibration lamp program is
called cal_lines which should be typed in from a UNIX prompt.
A. CSHELL Startup
0) Turn on CSHELL boxes #2 - #5 in numerical order
1) Log into your Guest Account
2) Type "openwin" and <CR> at the UNIX prompt
3) Hold down the right mouse button on the blue desktop
4) If the IC program is not already running (ASK a T.O. or Support Astronomer), Either:
i) Select "Start CSHELL IC Software!" from the CSHELL menu
or ii) Log into CSHELL IC console as "cshellic"
5) Select "Cshell XUI" from the CSHELL menu
6) Select "VF" from the CSHELL menu
7) Turn on the CSHELL Array Power Supplies
8) Set Programmable Voltages in Setup Parameters XUI window
B. CSHELL Shutdown
1) Quit VF
2) Move Shutter, Slit, and Filter to "Blank" Position. Spectroscopic mode, turn lamps off.
3) Quit XUI software
4) Leave in this configuration unless powering off (proceed further only if powering off)
5) Turn off the CSHELL Array Power Supplies
6) Type "die" and <CR> in CSHELL IC window. Halt Lynx by logging in as "shutdown";
login as "reboot" if you only want to reboot the IC computer.
7) Turn off boxes #2 - #5 in reverse numerical order
C. Guider Software
8/16/94
Startup:
1) Follow Steps A0 - A3.
2) Select "Login to CASSPC Guider PC" from CSHELL menu
3) Type "gic" and <CR> in the casspc window
4) Select "Guider XUI" from CSHELL menu
Shutdown:
1) Quit Guider XUI
2) Type "die" and <CR> in GIC (casspc) window; exit window
Page 106
IRTF CSHELL User's Guide
F. IR Array Linearity Data
14 April 1994 lab data: CSHELL SBRC InSb SCA #052 Science Grade Array
VDET = -3.4
BIAS= -300
-3.7
-2.9
VGG
11.0
-1.5/-1.0
e-/ADU
switched off between rows
mV
t (sec)
0.1
0.25
0.5
0.75
1
1.25
1.5
1.75
2
2.25
2.5
3
5
ADU
231.6
575.8
1144
1706
2263
2811
3346
3863
4343
4737
5004
5256
5238
%
86.5
96.4
99.8
100.6
100.8
100.6
100.1
99.3
97.8
95.0
90.4
79.2
47.5
slope
offset
r
2196
48.03
1
ADU/s
Charge Dump:
178
VDET= -3.38
BIAS= -325
mV
e2539.55
6313.77
12538.7
18706.7
24808.8
30823.2
36689.6
42358.6
47622
51942.3
54870
57633.2
57435.8
Bias = 300 mV
6000
5000
4000
ADU
Vdduc
V3
3000
2000
1000
0
0
0.5
1
1.5
t
2
2.5
3
(s)
mV
325 mV Linearity
t (sec)
0.1
0.25
0.5
0.75
1
1.5
2
2.25
2.5
3
5
slope
offset
r
8/16/94
ADU
224.7
559.5
1114
1659
2203
3266
4307
4807
5271
5987
6254
2124
55.93
1
%
83.7
95.3
99.6
100.6
101.1
100.7
100.1
99.4
98.2
93.1
58.6
ADU/s
e2463.89
6135.04
12209.8
18193.5
24156.4
35812.4
47227.2
52709.8
57797.7
65648.8
68576.5
6000
5000
4000
3000
2000
1000
0
0
0.5
1
1.5
2
2.5
3
Page 107
IRTF CSHELL User's Guide
VDET=
BIAS=
t (sec)
0.1
0.5
1
1.5
2
2.5
3
3.5
4
5
10
slope
offset
r
-3.2
-500
ADU
255.3
1261
2501
3723
4928
6107
7273
8421
9544
11710
13471
2405
90.53
1
VDET=
BIAS=
t (sec)
0.1
0.5
1
2
3
4
5
6
7
15
slope
offset
r
-3.1
-600
ADU
264.6
1308
2593
5113
7567
9943
12252
14469
16507
17590
2448
148.8
1
8/16/94
%
85.9
96.0
99.6
100.9
100.8
100.2
99.5
98.6
97.8
82.0
40.6
ADU/s
mV
%
77.1
97.5
100.2
100.7
100.6
100.1
99.6
99.0
98.3
96.7
55.8
ADU/s
mV
%
67.2
95.2
99.8
101.3
101.0
100.0
98.9
97.5
95.5
47.7
ADU/s
e2682.09
6662.47
13260.2
26283.6
39102
51591.4
63927.2
75912.2
87699.8
104882
103621
400 mV Linearity
ADU
ADU
244.6
607.6
1209
2397
3566
4705
5830
6923
7998
9565
9450
2323
52.43
1
8000
7000
6000
5000
4000
3000
2000
1000
0
0
1
2
t
e2799.42
13827.1
27424
40823.5
54036.6
66964.6
79750.1
92338.1
104652
128403
147712
3
4
(s)
500 mV Linearity
12000
10000
8000
ADU
t (sec)
0.1
0.25
0.5
1
1.5
2
2.5
3
3.5
5
10
slope
offset
r
mV
6000
4000
2000
0
0
1
2
3
t
4
5
(s)
600 mV Linearity
e2901.4
14339.2
28427.3
56065.2
82973.8
109027
134346
158656
181003
192878
ADU
VDET= -3.3
BIAS= -400
16000
14000
12000
10000
8000
6000
4000
2000
0
0
2
4
t
6
(s)
Page 108
IRTF CSHELL User's Guide
mV
t (sec)
0.1
0.25
0.5
0.75
1
1.25
1.5
1.75
2
2.25
3
ADU
1076
2670
5280
7814
10304
12719
15053
17289
19369
20884
23580
%
83.3
96.1
100.4
101.0
100.9
100.2
99.2
98.0
96.3
92.4
78.5
slope
offset
r
9911
300.9
1
ADU/s
VDET=
BIAS=
-2.7
-1000
mV
t (sec)
0.1
0.5
1
1.5
1.75
2
2.25
2.5
5
ADU
1217
5907
11245
16260
18678
20667
21902
22973
25866
%
112.1
112.4
110.1
107.2
105.9
102.7
96.9
91.6
51.9
slope
offset
r
10861
0
0.995
ADU/s
800 mV Linearity
e11798.6
29277.1
57892
85682.2
112986
139467
165059
189578
212385
228998
258560
25000
20000
ADU
-2.9
-800
15000
10000
5000
0
0
0.5
1
1000
e13344.7
64771.6
123304
178294
204808
226618
240160
251904
283626
1.5
t
mV
2.5
2
2.5
(s)
Linearity
20000
15000
10000
5000
0
0
0.5
1
1.5
t
8/16/94
2
25000
ADU
VDET=
BIAS=
(s)
Page 109