1
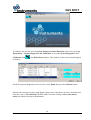
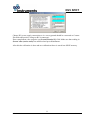
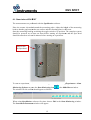
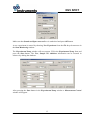
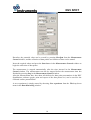
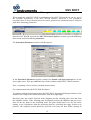
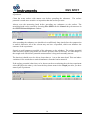
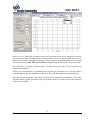
User’s Manual
Surface Potential Meter
Revision 1.0
KSV SPOT
1. INTRODUCTION
3
2. TECHNICAL SPECIFICATIONS
4
3. GENERAL INTRODUCTION
5
4. KSV SPOT PRINCIPLE OF MEASUREMENT
6
5. INSTALLING THE KSV SPOT
7
5.1. Installation steps
7
5.1.1. KSV SPOT software
7
5.1.2. Connecting cables
7
5.1.3. Using KSV SPOT with third party devices
9
5.1.4. Calibration of the KSV SPOT
9
6. MEASUREMENTS
12
6.1. Stand-alone KSV SPOT
12
6.2. KSV SPOT connected to a KSV trough
15
7. EXAMPLE MEASUREMENTS
18
2
KSV SPOT Manual
Rev. 1.0
KSV SPOT
1. Introduction
KSV SPOT is a small computer controlled stand alone surface potential measuring
instrument. It is based on the non-contact and non-destructive vibrating plate capacitor
method. KSV SPOT has a high accuracy, minimal drift and high reproducibility, which
guarantee a high sensitivity and stability for the measurements.
KSV SPOT is mainly designed for monolayer measurements, but due to its stand-alone
property it is also suitable for surface potential measurements over a range of solids and
liquids.
KSV SPOT enables you to complement surface pressure - area data with the more sensitive
surface potential data. Thus, giving you for example the following additional information
about your monolayers.
• Composition
• Dissociation degree
• Orientation
• Interaction
• Adsorption
The software included with this instrument allows you to perform the experiments and further
to graph and print test results. The data is stored to the computer hard disk and can easily be
retrieved and analyzed later. The data can be exported in a form that is understood by the
most common data reduction software.
This manual provides information how to install and use the KSV SPOT. In order to obtain
the maximum performance from the instrument read this manual and keep it available for
reference.
The hardware for the KSV SPOT is manufactured to the highest quality standards, and when
used properly it should yield a trouble free use for a long time.
3
KSV SPOT Manual
Rev. 1.0
KSV SPOT
2. Technical Specifications
Measuring principle
Vibrating plate capacitor method
Dynamic range
-4 to +4 V
Sensitivity
1 mV
Response time
2 seconds
Inaccuracy
± 3 mV
Height dependency
10 mV/mm
Drift
Negligible in air, ± 3 mV/h with
subphase
Probe diameter
16 mm
Sensor head dimension
130 × 43 × 95 mm
Mounting
Height adjustment ± 100 mm
Computer requirements
IBM compatible running
Windows™ 2000/XP/Vista
4
KSV SPOT Manual
Rev. 1.0
KSV SPOT
3. General introduction
If there exists a difference in the electrostatic potential between two surfaces and these are put
in movement relative to each other there will be a current flowing through an external circuit.
This kind of “condensator” was used by Volta and Kelvin to study the differences in Volta
potential between various metals. This “condensator” is often also called the Kelvin probe.
Yamins and Zisman applied this method to study monomolecular films.1 Since then this
method has widely been used for determining the surface potential of monolayers. The design
of KSV SPOT is based on these main ideas. The main application area for KSV SPOT is in
monolayer studies, but due to its stand-alone property it is also suitable for other areas where
surface potential measurements are required.
Insoluble monolayers at the gas/liquid interface are generally characterized by measuring the
surface pressure (π)- area (A) isotherm. The π - A isotherm is characteristic for any given
ampiphile2 or mixtures of ampihphilic molecules. Many substances show a variety of
different monolayer phases.3,4 The major phases are easily recognized in the isotherm as
sharply separated regimes with different compressibility. Although the measurement of π as a
function of A can give valuable information about monolayers (area per molecule, collapse
pressure, phase transition pressures and temperatures, mixing behavior of two or more
amphiphiles etc) it may not reveal all of the desired information.
A complementary and a more sensitive way to characterize a floating monolayer is to measure
the changes in the surface potential, ∆V.5 This is possible due to the fact that an insoluble
monolayer at the gas/liquid interface changes the surface potential through this interface. This
change equals the Volta potential between the surface of the liquid and that of the metal
probe. Normally only the changes in ∆V due to the presence and changes in the state of the
monolayer are measured. In this case the clean liquid surface is fixed to the value 0 mV, and
the spread monolayer gives the obtained ∆V. ∆V can be used to determine the composition of
the monolayer, the dissociation degree of an ionisable monolayer, the orientation and
reorientation of the monolayer molecules at the interface during compression.3,5,6,7,8 By
measuring ∆V one can also reveal the interaction between the molecules in the monolayer
much earlier than by measuring π. The type of deposition that has occurred for LB films (X,
Y or Z deposition) has also been determined by measuring the ∆V.9
1
Yamins, H.G. and Zisman, W.A.,J. Chem. Phys. (1933), 1, 656.
Amphiphile = A substance containing a hydrophilic (water loving) and a hydrophobic (oil loving) part. The
hydrophilic part can for example consist of an alcohol, carboxylic acid, amine or phosphorylcholine groups, and
the hydrophobic group(s) is generally composed of hydrocarbon chains.
3
Binks, B.P. Adv. Coll. Interf. Sci. (1991), 34, 343.
4
Roberts, G.G. Langmuir-Blodgett Films, Plenum Press (1990).
5
Gaines, G.L. Insoluble Monolayers at the Liquid-Gas Interface, Wiley-Interscience (1966).
6
Lindén, M. PhD thesis, Åbo Akademim Univerity, Finland (1996).
7
Vogel, V. And Möbius, D. J. Coll. Interf. Sci. (1988), 126, 408.
8
Phillips, M.C., Cadenhead, D.A., Good, R.J., King, H.F. . J. Coll. Interf. Sci. (1971), 37, 437.
9
Christie, P., Jones, C.A., Petty, M.C., Roberts, G.G. J. Phys. D. (1986), 19, L167.
2
5
KSV SPOT Manual
Rev. 1.0
KSV SPOT
4. KSV SPOT principle of measurement
The block diagram of the measuring circuit of KSV SPOT meter is shown below.
The upper electrode (vibrating plate) of the capacitor is set to vibrate with a frequency
between 100-180 Hz. The upper electrode of the capacitor is placed a couple of mm from the
test surface (solid or air/liquid interface depending on which type of measurement is
performed). As the upper electrode vibrates, the capacitance between the electrode and the
test surface changes. This change in capacitance induces an AC current to the circuit due to
the fact that there exists a potential difference between the electrode and the test surface. This
current is amplified and analyzed by together with the signal from the oscillator. Thereafter
the control electronics adjusts the DC current controlling the potential of the feedback
capacitor until the compensating voltage equals the surface potential and no currents occur.
6
KSV SPOT Manual
Rev. 1.0
KSV SPOT
5. Installing the KSV SPOT
Make sure that all parts needed to install KSV SPOT have been received. Use the checklist
below.
•
•
•
•
•
•
KSV SPOT measuring head
Counter electrode made of stainless steel
Stand for SPOT
Cable for connecting the measuring head and counter electrode (crocodile clip – RCA
cable)
15-pin device cable for connecting SPOT measuring head to LayerBuilder unit
CD-ROM disk for installing the SpotMonitor software and User’s Manual in pdf
format
5.1. Installation steps
The KSV SPOT measuring head is controlled by a Window 2000/XP/Vista compatible
software.
5.1.1. KSV SPOT software
The SpotMonitor software is supplied on a CD-ROM disk. Load the software onto the desired
drive using normal Windows procedures.
NOTICE! This software needs to be installed only if the KSV SPOT is intended to be used as
a stand-alone unit.
If the KSV SPOT is intended to be used in combination with KSV´s monolayer troughs the
software for controlling the KSV SPOT will be integrated in the LB software. In this case
there is no need to install KSV SPOT Monitor software. Measurement procedures will be
described in section 6.2.
5.1.2. Connecting cables
The KSV SPOT measuring head is connected to the LayerBuilder Unit with 15-pin cable and
to the counter electrode with a crocodile clip - RCA cable. The image below shows where the
15-pin cable and the crocodile clip – RCA cable should be connected.
7
KSV SPOT Manual
Rev. 1.0
KSV SPOT
15-pin connector
for device cable
RCA connector for
Counter Electrode
Installed KSV SPOT measuring head is shown below.
Counter Electrode
Crocodile clip
Now the KSV SPOT1 should be properly installed and ready for measurements.
8
KSV SPOT Manual
Rev. 1.0
KSV SPOT
5.1.3. Using
ing KSV SPOT with third party devices
input +12Vdc
15
5
4
2
6
11
1
D15HD male
KSV SPOT has also an analog output for third party devices with analog input.
Analog output is from -5V
5V to +5V. The KSV SPOT requires +12Vdc operating voltage.
Connection diagram is shown below.
7
input GND
output
output GND
5.1.4.. Calibration of the KSV SPOT
NOTICE! The KSV SPOT is factory calibrated and there should be no need for re-calibrating
re
it.
Below is described the calibration procedure in case calibration is needed.
Connect a DC-power
power supply between Counter Electrode and the RCA connector on SPOT
front panel. The
he positive voltage should be connected to Counter Electrode and ground to
RCA connector. The voltage should be between 2.0 – 3.5Vdc.
Start SpotMonitor or KSV WinLB
Win
software.
9
KSV SPOT Manual
Rev. 1.0
KSV SPOT
To calibrate the devices enter the System Diagnostics and Calibration software by choosing
Experiments →System Diagnostics and Calibration or press the System Diagnostics and
Calibration icon
as follows:
in the Main Menu window. The window for this section should appear
Scroll the Systems Diagnostics devices list to select Spm0 and press the Calibrate button.
Measure the connected voltage with digital voltage meter (that shows at least 3 decimals) and
enter the value to First Potential (V) field. Make sure that reading in First value (native
units) has stabilized and press Next button.
10
KSV SPOT Manual
Rev. 1.0
KSV SPOT
Change DC-power supply connection to vice versa (ground should be connected to Counter
Electrode and positive voltage to RCA connector).
Enter complement value (negative) to Second Potential (V) field. Make sure that reading in
Second value (native units) has stabilized and press Next button.
After this the calibration is done and new calibration factor is stored into SPOT memory.
11
KSV SPOT Manual
Rev. 1.0
KSV SPOT
6. Measurements
6.1. Stand-alone
alone KSV SPOT
The measurements are performed with the SpotMonitor software.
Place the counter electrode beneath the measuring probe. Adjust the height of the measuring
head so that the gap between the test surface and the vibrating plate is a few mm.
Start the measuring head by switching the toggle switch
itch to up position. The complete system
should be powered on at least one hour before starting an experiment and the Spot head
should be turned on at least 10 minutes before starting an experiment.
Start switch
for Spot head
To start an experiment, enter the Data Monitoring software by choosing Experiments →Data
Monitoring Software or press the Data Monitoring icon
The window for this section should appear as follows:
in the Main Menu window.
When using SpotMonitor software first time choose Edit in the Data Monitoring window.
The Instrument Parameters window will appear.
12
KSV SPOT Manual
Rev. 1.0
KSV SPOT
Make sure that Sound card Spm connected box is unchecked and press OK button.
A new experiment is started by choosing New Experiment from the File drop down menu in
the Data Monitoring window.
The Experimental Setup window will now appear. Fill in the Experimental Setup form and
press the Start button. The User, Sample and Additions information can be inserted in
advance by editing the database.
After pressing the Start button in the Experimental Setup window a Measurement Control
window will appear.
13
KSV SPOT Manual
Rev. 1.0
KSV SPOT
Hereafter, the potential value can be zeroed by pressing ZeroSpm from the Measurement
Control window, and the collection of data points as a function of time can be started.
Insert the required values and press the Start button in the Measurement Controls window to
begin the collection of data points.
The measurement is stopped automatically after the time inserted in the Measurement
Control window. The measurement can also be stopped before the measurement time has
finished by pressing Stop in the Measurement Control window.
After the measurements have been done all facilities for data point presentations in the KSV
SpotMonitor software (graph, print and export of the data points etc.) can be used for the
collected surface potential data.
A new experiment is simply started by choosing New experiment from the File drop down
menu in the Data Monitoring window.
14
KSV SPOT Manual
Rev. 1.0
KSV SPOT
6.2. KSV SPOT connected to a KSV trough
When measuring with KSV SPOT in combination with a KSV LB trough one can use any of
the available experiments in the KSV WinLB software. However, a few preparative
procedures have to be performed before the surface potential can simultaneously be collected
with other measuring parameters.
Start the KSV WinLB and from the KSV LB Control Software window open the Edit drop
down menu and choose Device parameters.
The Instrument Parameters window will then appear.
In the Instrument Parameters window uncheck the Sound card Spm connected box in the
lower right corner. Then press OK and close all the windows and the KSV WinLB software.
Now, everything is set for surface potential measurements.
For a measurement start the KSV WinLB software.
To continue with the measurement place the KSV SPOT measuring head approximately in the
middle of the trough with a sufficient distance from the trough edges.
Hereafter, place the counter electrode in the subphase and the vibrating plate a few mm from
the subphase surface. If the vibrating plate accidentally touches the subphase and gets wet it
does not do any harm to the measuring head. The plate should just let to dry out before
starting a new experiment. Start the measuring head by switching the toggle switch to up
position. The complete system should be powered on at least one hour before starting an
15
KSV SPOT Manual
Rev. 1.0
KSV SPOT
experiment and the Spot head should be turned on at least 10 minutes before starting an
experiment.
Clean the water surface with utmost care before spreading the substance.
potential is much more sensitive to impurities than the surface pressure.
The surface
Always zero the measuring head before spreading any substance on the surface. The
measuring head can be zeroed by choosing Zero SPM from the Controls drop down menu in
the KSV LB Control Software window.
After spreading the substance one should wait a sufficiently long time before the compression
is started. Otherwise all of the solvent may not have evaporated, which can influence the
outcome of the experiment.
Spread as small amount as possible of the substance on the subphase. The surface potential
often increases rapidly long before the surface pressure starts to increase. An ideal shape of
the trough used with surface potential measurements is long and reasonably narrow.
The barrier(s) should never be driven closer than ca. 1 cm to the meter head. This can induce
variations in the results due to static disturbances from the barrier material.
If the surface potential values have to be shown on the screen during the real time experiment
select SP [V] as the other y-axis from the drop down menu in the Graph just after you have
started your experiment.
16
KSV SPOT Manual
Rev. 1.0
KSV SPOT
However, even if the surface potential values are not shown on the screen during the real time
experiment the surface potential data is automatically recorded to the hard disk and it can be
displayed afterwards. Presupposed that the surface potential measuring head has been started
and zeroed from the KSV LB Control Software, and the control window has not been closed.
The collection of surface potential data is stopped when the chosen LB experiment is
completed or stopped.
When a new measurement is performed the only thing to remember is to zero the surface
potential again before any substance is spread on the fresh and cleaned gas/liquid interface.
After the measurements have been done all facilities for data point presentations in the KSV
WinLB software (graph, print and export of the data points etc.) can be used for the collected
surface potential data.
17
KSV SPOT Manual
Rev. 1.0
KSV SPOT
7. Example measurements
Stearic acid has been used as the monolayer forming substance because it has been studied by
a large number of research groups and its characteristic properties are largely known. In these
example measurements a pure water subphase with pH = 4 have been used. The obtained
surface potential values are 349 ± 2 mV. This is in good accordance with the literature values.
The reproducibility of the KSV SPOT measuring head is very good which is seen from the
low standard deviation of the results.
0.4
60
0.3
40
0.2
30
20
0.1
10
∆V
Surface potential [mV]
Surface pressure [mN/m]
50
0.0
π
0
10
20
30
40
50
Mean molecular area [Å 2 /molecule]
Surface pressure and Surface potential isotherm of´ Stearic acid on a subphase with pH = 4.
0.4
Surface potential [m V]
0.3
0.2
0.1
0.0
10
20
30
40
50
Mean molecular area [Å 2 /molecule]
Three separate measurements of Stearic acid monolayers on a water subphase (pH = 4)
demonstrating the reproducibility of the KSV SPOT surface potenital measuring head.
18
KSV SPOT Manual
Rev. 1.0