1
( Revised January 15 2009 )
INSTRUCTION MANUAL
MODEL 4200- S/21
RF MICROWATTMETER
SERIAL NUMBERS 975 AND ABOVE
/
BOONTON
ELECTRONICS CORPORATION
791 ROUTE 10, RANDOLPH, NJ 07869
TELEPHONE: 201 — 584-1077 TWX: 710-986-8215
7/87
P/N 99100600D
Printed in U.S.A.
SAFETY SUMMARY
The following general safety precautions must be observed during allphases of operation and maintenance
of this instrument. Failure to comply with these precautions or with specific warnings elsewhere in this
manual violates safety standards of design. manufacture, and intended use of the instrument. Boonton
Electronics assumes no liability for the customer's failure to comply with these requirements.
THE INSTRUMENT MUST BE GROUNDED
To minimize shock hazard the instrument chassis and cabinet must be connected to an electrical ground.
The instrument is equipped with a three conductor, three prong a.c. power cable. The power cable must
either be plugged into an approved three-contact electrical outlet or used with a three-contact to a
two-contact adapter with the (green) grounding wire firmly connected to an electrical ground at the power
outlet.
DO NOT OPERATE THE INSTRUMENT IN AN EXPLOSIVE ATMOSPHERE.
Do not operate the instrument in the presence of flammable gases or fumes.
KEEP AWAY FROM LIVE CIRCUITS.
Operating personnel must not remove instrument covers. Component replacement and internal adjustments must be made by quailfied maintenance personnel. Do not replace components with the power cable
connected. Under certain conditions dangerous voltages may exist even though the power cable was
removed, therefore: always disconnect power and discharge circuits before touching them.
DO NOT SERVICE OR ADJUST ALONE.
Do not attempt internal service or adjustment unless another person. capable of rendering.first aid and
resuscitation, is present.
DO NOT SUBSTITUTE PARTS OR MODIFY INSTRUMENT.
Do not install substitute parts or perform any unauthorized modification of the insturment: Return the
instrument to Boonton Electronics for repair to ensure that the safety features are maintained.
SAFETY SYMBOLS.
This safety requirement symbol (located on the rear panel) has been adopted by the
International Electrotechnical Commission. Document 66 (Central Office) 3. Paragraph 5.3. which directs that and instrument be so labeled if. for the correct use of the
instrument, it is necessary to refer to the instruction manual. In this case it is
recommended that reference be made to the instruction manual when connecting the
instrument to the proper power source. Verify that the correct fuse is installed for the
power available, and that the switch on the rear panel is set to the applicable
operating voltage.
The CAUTION sign denotes a hazard. It calls attention to an operation procedure.
practice, or the like, which, if not correctly performed or adhered to. could result in
damage to or destruction of part or all of the equipment. Do not proceed beyond a
CAUTION sign until the indicated conditions are fully understood and met.
WARNING
The WARNING sign denotes a hazard. It calls attention to an operation procedure.
practice. or the like. which. if not correctly performed or adhered to. could result in
injury or loss of life. Do not proceed beyond a WARNING sign until the indicated
conditions are fully understood and met.
Indicates dangerous voltages.
TABLE OF CONTENTS
SECTION I - INTRODUCTION
Paragraph
1 I
Introduction
1-3
Description
Accessories
1-7
Options
1-11
1-15
Specifications
1-17
Outline Dimensions
Page
-
1-2
1-2
1-3
1-3
SECTION II - INSTALLATION
Paragraph
Introduction
2-1
Installation
2-3
Unpacking
2-4
Mounting
2-5
Power Requirements
2-6
Cable Connections
2-7
SECTION III
Paragraph
Introduction
3-1
Operating Controls. Indicators and Connectors
3-3
Sensor Calibration Data
3-5
Power Application
3-7
Preliminary Checkout
3-9
Operating Instructions
3-11
Measurement Parameters
3-12
Use of Numerical Keys
3-13
SELECT Function
3-14
MODE Selection
3-15
RANGE Selection
3-16
LIMITS dB Selection
3-17
CAL FACTOR Selection
3-18
REF LEVEL dB Selection
3-19
Entry Limits
3-20
Recall of Entered Values
3-21
Zeroing the Instrument
3-22
Calibrating the Instrument
3-23
Error Messages
3-24
Measurements
3-25
Making Power Measurements
3-26
Low-Level Measurements
3-27
High-Level Measurements
3-28
High-Frequency Measurements
3-29
Temperature Effects
3-30
SWR Measurements
3-31
Shielding Recommendations
3-32
Analog Output
3-33
Minimum Performance Standards
3-34
Test Equipment Required
3-35
Preliminary Setup
3-36
Automatic Zero Function Test
3-37
Autoranging Mode Test
3-38
Range Hold Function Test
3-39
Basic Instrument Accuracy Test
3-40
Power Mode Test
3-41
Calibration Test
3-42
Page
2-1
2-1
2-1
2- I
2-1
2-1
-
OPERATION
Page
3- I
3-I
3-I
3-I
3-I
3-5
3-5
3-5
3-5
3-6
3-6
3-6
3-6
3-7
3-7
3-7
3-8
3-8
3-.9
3-9
3-9
3-9
3-9
3-9
3-9
3-9
3-1 I
3-1 I
3-12
3-12
3-12
3-12
3-12
3-12
3-13
3-13
3-13
SECTION III - OPERATION (Cont.)
Page
Paragraph
Sensor Selection Test
dB Reference Level Function Test
dB Limit Test
Calibration Factor Test
3-43
3-44
3-45
3-46
3-14
3-14
3-14
3-14
SECTION IV - THEORY OF OPERATION
Page
Paragraph
4-1
4-4
4-5
4-6
4-7
4-8
4-9
4-10
4-11
4-12
4-15
4-26
4-34
4-41
4-44
Introduction
Overall Block Diagram
Sensor
Input Module
Control Module
Display Module
Power Reference
Power Supply Module
Optional Modules
Detailed Theory of Operation.
Detailed Theory of Operation.
Detailed Theory of Operation,
Detailed Theory of Operation.
Detailed Theory of Operation,
Detailed Theory of Operation,
Sensor Circuits
Input P.C. Board Circuits
Control P.C. Board
Display P.C. Board
Power Reference P.C. Board
Power Supply P.C. Board
SECTION V
-
MAINTENANCE
Paragraph
5-1
5-3
5-5
5-7
5-9
5-15
5-16
5-17
5-18
5-19
5-20
5-22
5-24
5-25
5-26
5-27
5-28
5-29
5-30
5-31
5-32
5-33
5-34
5-35
5-36
5-37
5-38
5-39
5-40
5-41
4-1
4-1
4-1
4-1
4-1
4-1
4-1
4-1
4-1
4-2
4-2
4-4
4-10
4-10
4-13
Introduction
Safety Requirements
Test Equipment Required
Troubleshooting Concept
Signature Analysis
Trouble Localization
Gaining Access to Internal Component
Visual Inspection
Use of Block Diagrams
Systematic Troubleshooting
Signature Analysis Free-Running Test Procedures
Signature Analysis Programmed Test Procedures
Non-Volatile RAM Circuit Tests
Non-Volatile RAM Test
Non-Volatile RAM Cell Test
Non-Volatile RAM Cell Replacement
Instrument Adjustments
General
Power Supply Adjustments
Input Module Adjustments
DC Calibration
AC Calibration
Display Board Recorder Output Adjustment
Power Reference Adjustment
Entry of Sensor Calibration Factors Versus Frequency
Sensor Calibration
General
Bit Switch Setting for Additional Sensor
Calibration of Model 4200-4C Sensor
Calibration Notes. rvIodel 4200-6 Sensor +30 dBm Range
Page
5-1
5-1
5-1
5-1
5-1
5-2
5-2
5-2
5-2
5-2
5-3
5-3
5-10
5-10
5-17
5-17
5-18
5-18
5-18
5-18
5-20
5-21
5-22
5-25
5-25
5-26
5-26
5-26
5-26
5-27
SECTION VI - PARTS LIST
Paragraph
Page
Table of Replaceable Parts
6- I
SECTION VII - SCHEMATIC DIAGRAMS
Page
Pa rag ra p h
Schematic Diagrams
7-1
APPENDIX A — IEEE-488 BUS INTERFACE OPTION 4200-01A
APPENDIX B — IEEE488 BUS INTERFACE OPTION 4200-01B
APPENDLX C — INPUT CHANNEL 2 OPTION 4200-03
APPENDIX D — REAR INPUT OPTION 4200-04
APPENDIX E — INTERNAL TMA (NIATE) OPTION 4200-06
APPENDIX F — REAR INPUT OPTION 4200-S/17
LIST OF II.LUSTRATIONS
Figure
Model 4200 RF Microwattmeter
I-I
1-2
2-1
3-1
3-2
3-3
3-4
3-5
4- I
4-2
4-3
4-4
4-5
4-6
4-7
5- I
5- I
5-2
5-3
5-4
5-5
5-6
5-7
5-8
Outline Dimensions
Packaging Diagram
Front View of Instrument
Rear View of Instrument
Typical Temperature Characteristics of Series 4200 Sensors
Typical Combined Temperature Characteristics of Instrument and Sensor
dB-SWR Conversion Chart
Overall Block Diagram
Typical Series 4200 Sensor. Schematic Diagram
Input P.C. Board. Detailed Block Diagram
Control P.C. Board. Detailed Blot:k Diagram
Display P.C. Board. Detailed Block Diagram
Power Reference P.C. Board. Detailed Block Diagram
Power Supply P.C. Board. Detailed Block Diagram
Location of Major Assemblies (Sheet I of 2)
Location of Major Assemblies (Sheet 2 of 2)
Input P.C. Board. Voltage and Wavetbrm Data
Control Board Bit Switch Settings
Non-Volatile RAM Cell Test and Connection Points
Test Setup for Input Module Offset. Chopper. and A/D Converter Adjustments
Test Setup for Recorder Output Adjustment
Test Setup for Determination of Attenuation Value
Calibration Test Setup. Model 4200-6 Sensor, +30 dBm Range
Page
vi
I-I I
2-1
3-2
3-2
3-10
3-10
3-1 I
4-2
4-3
4-5
4-7
4-1 I
4-13
4-15
5-4
5-5
5-6
5-7
5-18
5-20
5-21
5-28
5-28
LIST OF TABLES
Page
Table
1-2
I -3
3-I
3-2
5-1
5-2
5-3
5-4
5-5
5-6
5-7
5-8
5-9
5-10
5-11
5-12
5-13
5-14
5-15
5-16
5-17
5-18
5-19
5-20
5-21
5-22
5-23
5-24
5-25
5-26
5-27
5-28
iv
Performance Specifications
Sensor Characteristic •
Maximum Response Chart for Series 42(X)-A Sensors
Operating Controls. Indicators and Connectors
Instrument Zeroing Time
Test Equipment List
Control Board Address Field Test
Control Board Memory Decodine Test
Control Board I/O Decoding Test
Control Board ROM 0 Test
Control Board ROM I Test
Interface Board ROM 2 Test
Control Board 4ABIO Test
Control Board 400 Test
Control Board 4D10 Test
Display Visual Test
Control Board Display Test
Control Board Display Scan Test
Keyboard Visual Test
Control Board RAM Test
Input Module. Channel I OAIO Test
Input Module. Channel I OBIO Test
Input Module. Channel 1 000 Test
Input Module. Channel I ODIO Test
Input Module. Channel 2 I A10 Test
Input Module. Channel 2 I BIO Test
Input Module. Channel 3 ICIO Test
Input Module. Channel 2 I DIO Test
DC Calibration Test
Full Scale Sensor Calibration Data for 4A, 4B, 4C, 4E, 5B*, 5E*, 5G, 6E*, 7E. and 8E* Series Sensors •
Down Scale Sensor Calibration Data for 4A, 4B, 4C, 4E. 5B*, 5E*, 5G, 6E*, 7E, and 8E* Series Sensors •
Down Scale Connection Data
Typical Calibration Data for Model 4200-6 with Model 4200
1-3
1-8
1-9
3-3
3-8
5-I
5-8
5-8
5-9
5-9
5-9
5-10
5-11
5-I I
5-11
5-12
5-12
5-12
5-13
5-13
5-14
5-14
5-15
5-15
5-15
5-16
5-16
5-17
5-22
5-23
5-24
5-24
5-26
Figure 1-1 Model 4200 RF Microwattmeter
v
Section I
Introduction
SECTION I
INTRODUCTION
1-1. INTRODUCTION.
1-2. This instruction manual provides general information, installation and operating instructions, theory of
operation, maintenance instructions and parts list for the
Model 4200 RF Microwattmeter.
1 3. DESCRIPTION.
-
1-4. The Model 4200 is a microprocessor-based solid state
RF microwattmeter. The instrument is capable of measuring RF power levels from 1 nW (-60 dBm) to 1W (+30
dBm) for a frequency range of 0.2 MHz to 110 GHz. The
instruments calibrated power level and frequency range is
determined by the Series 4200 sensor used with the instrument. The Series 4200 sensors are accessories and must be
ordered per application. Refer to Table 1-2 for the Series
4200 sensor characteristics.
1-5. The Model 4200 is designed to perform the following
operations:
a. Low-power transmitter, signal generator, and oscillator measurements.
When measuring pulsed signals, the power indications are
accurate up to 20 microwatts peak power (200 microwatts
with Series 4200-5 sensors). External attenuators may be
used to extend the measurement range of the instrument.
c. Low Noise. The instrument has been designed and
constructed to minimize noise from all sources. The sensor
cable is of a special low-noise design; vigorous flexing
causes only momentary minor deflections on the most
sensitive range of the instrument. The sensors are insensitive to shock and vibration: even sharp tapping on the
sensor barrel causes no visible deflection on any range.
Internal signal amplification occurs at approximately 94
Hz thereby reducing susceptibility to 50 or 60 Hz fields. A
low-noise solid-state chopper is used.
d. LED Display. Measured power levels are displayed
by a 4 digit, LED type readout with decimal points and
minus sign. Annunciators associated with the LED display
indicate the units of measurement. The result is a clear,
unambiguous readout that minimizes the possibility of
misinterpretation. The display is also used to show data
being entered into non-volatile memory and to display data
recalled from non-volatile memory; the display and annunciators blink on and off during data entry and recall to
b. SWR and return-loss measurements with directional
couplers and slotted lines.
c. Gain and insertion loss measurements.
d.
RF attenuation and SWR measurements.
indicate that displayed values are not measured values.
e. Analog Indications. A front-panel analog meter provides relative power indications for peaking or nulling
applications. A dc voltage proportional to the measured
power level is available at a rear-panel connector for application to a recorder or other external device.
e. Antenna measurements.
1-6. The Model 4200 design features are as follows:
f. Pushbutton Measurement Mode Selection. A choice
of measurement modes is available to the operator. Indica-
a. Wide Frequency Range: 0.2 MHz to 110 GHz. The
calibrated frequency range of the instrument is determined
tions in terms of power or dBm can be selected by pressing
the appropriate front-panel key switch. A dB reference
level can be entered through the keyboard and a display
by the sensor utilized. Refer to Table 1-2.
mode selected to indicate power levels in dB, relative to a
dB reference level.
b. Wide Power Range. Depending on the selected sensor, the instrument will measure R F power from I nW up
to I W. Temporary overloads up to 300 mW with Series
4200—i sensors and up to 2W with Series 4200-5 sensors will
do no permanent harm to the instrument or the sensor.
g. Automatic Ranging. Autoranging under control of
the microprocessor eliminates the need for manual ranging.
Alternately, a measurement range can he retained for all
measurements, if desired, by selecting the range hold mode.
Section
Introduction
Applications of power levels that exceed the maximum or
minimum measurement capability of the instrument (or
range in the hold mode) results in an error indication on the
LED display.
h. Automatic Zeroing. An automatic zeroing circuit
eliminates the need for tedious, often inaccurate, manual
zeroing. With zero input to the sensor, pressing a frontpanel key switch directs the microprocessor to compute
and store zero corrections for each range, and the instrument is thereafter corrected on each range in accordance
with the stored data. This method is considerably simpler,
faster, and more accurate than manual zeroing.
i. Automatic Sensor Compensation. Calibration factors for up to eight sensors may be stored in the microprocessor. Calibration data is written into non-volatile storage
at the factory for sensors ordered with the instrument;
calibration data may also be written into storage in the
field. When the sensor being used and the measurement
frequency are specified through front-panel keyboard
entry, measurement values are corrected automatically
with calibration factors. Alternately, the calibration factor
in dB for a particular sensor being used may be entered
through the keyboard, and the measurement values are
then corrected automatically in accordance with the correction factor. Both power and dB values are corrected.
j. Built-in Power Reference. An accurate, 1.000 milliwatt, 50 MHz signal for instrument calibration is provided
by a built-in power reference. Calibration is simply a matter
of connecting the sensor to the power reference, and pressing a key; the calibration correction is computed automatically by the microprocessor. The calibration circuit has
built-in protection against inadvertent key actuation when
the sensor is not connected to the power reference: calibration correction is limited to approximately 7.5% from the
original factory set value. Computed calibration corrections
that exceed this range are rejected automatically. and the instrument returns to its previous sensitivity. If the instrument
is supplied with a 75-ohm sensor (4200-4C) an adapter
(P/N 950006) is also supplied. This adapter is used between
the power reference and the sensor to convert the Type N
power reference connector to a 75-ohm Type N. Before
calibration, a 0.17 dB CAL FACTOR should be entered to
compensate for the mismatch error that is introduced by the
75-ohm sensor.
I. Solid-state Chopper. Signal amplification in the
instrument occurs at approximately 94 Hz. Input signals
from the sensor are converted into a 94 Hz signal by a
solid-state, low-level input modulator (chopper), which
represents a distinct improvement over electromechanical
choppers. Extended service life is assured through the elimination of contact wear, contamination, and other problems
associated with electromechanical choppers.
m. Signature Analysis Maintenance. Connection facilities to permit signature analysis maintenance are incorporated. Digital circuit troubles can be localized rapidly and
accurately using the signature analysis maintenance technique, thereby reducing instrument down-time. A diagnostic ROM (P N 961003) is available from Boonton Electronics Corporation for signature analysis maintenance.
1 7. ACCESSORIES.
-
1-8. The following accessories are supplied with the
instrument:
a. AC power cord
b. Sensor cable
1-9. The Series 4200 sensors are not supplied with the
instrument and must be ordered. Refer to Table 1-2 for the
sensor characteristics.
1-10. If the instrument is ordered with sensor(s) the sensor
calibration data is programmed into the instrument at the
factory. If additional sensor(s) are required after the
instrument is in the field, the new sensor calibration data
can be field installed.
1 11. OPTIONS.
-
1-12. The following options are available for the
instrument:
a. Rack mount hardware kits.
b. -01A IEEE Bus Interface.
c. -01B IEEE Bus interface.
d. -03 Second Input Channel.
e. -04 Rear Input.
f. -06 Internal TMA (MATE). Requires -01B Option.
-S/17 Two Inputs On Front Panel. Requires -03
Option.
g•
k. Pushbutton High/Low dB Limit Selection. High/
low d 13 limits may he entered through the front-panel
keyboard. A front-panel annunciator indicates when measured d 13 levels are outside the preset limits. Signals are also
activated at a rear-panel connector to provide remote indications of out-of-limit measurements.
1-13. Information concerning the Option is included in the
Appendices of this manual.
1-14. Please direct all special instrument applications
questions to the Applications Engineering Department of
Boonton Electronics Corporation.
Section I
Introduction
1-15. SPECIFICATIONS.
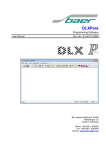
1-17. OUTLINE DIMENSIONS.
1-16. Performance specifications are listed in Table 1-1.
1-18. Outline dimensions of the instrument are shown in
Figure 1-2.
TABLE 1-1. SENSOR CHARACTERISTICS
////// ,' ,'/ /,'I
,\ \ \ \\\.
/200'kHz -)2.4 GHz. 50,O.Cdax"\ \
48
(51011)
o
ct
(-)
,
'
a
10 kHz,1Glri.\75\
Coax.
'
\ I
1.4‘ .
\`
4C
(51012)
4E
(51013)
///, ///,,,
\
\ \ ,,
-', ,/100,kHr ,-)15GHz. 50 O'Coax • \
' /
\\,• \
4G
(51051)
// /// / // 4 \ \ \ .
I,AiTit-• 26:5 GHz, 50 II Coax SMA
A
// // ' ' /1 ," I OA
\ ,
5E
(51015)
'
k ' //1
. 861:/z/:I 50 "
-\. 0
oax\ \\\\\\
\ \ \
7'/
. '/7,37)77/
6E
(51033)
//
/100 kHz ,--113- GHz. 50 VI Coax \
•
/ //, '/ - / "/ //,' I
10 MHz- 18 GHz. /,50 9 Coax
•
7E
(51016)
-
10 //////, //' //1
.MHz -18 GHz: 50 2Coax
////// •- -'. -/,/./
r
8E
(51017)
/7////c/,,,
4K
(51035)
N., \ \
/
),
11 /H,,,,...y, r1z. Walv\ ,g\u\ride \ \
WRO-180
(51972)
11 /
4Ka
x4z. Way el\g4 \
/,/,,,,ii z" /4)),Hz.
(51036)
\.\\\\\\
wr\\
g
// 3 //
3/
-‘ff
ay,\gu \ \\,
z. (
/,4i
/ /w
(51037)
.,y.
i //. y
4U
(51045)
7/ /7/0/,z.
rfj
4V
N \\\\\\\
Wavrguide,.v
■
(51046)
;INz. Wa4O cle. - ‘ \
4),
4W
(51047)
I\':,\\,,,,
//////, i
,110, GHz. Waveguide
5,G1-!
w/
N/./,. .
s
-60
-50 -40 -30 -20 -10
0
.10
+20
+30 +40d8m
lnW 10nW 100nW 1.W 10.W 100.W 1mW 10mW 100mW 1W
Transition
Calibrated in RMS
*See Instruction-manual supplement
lOW
Peak. Calibrated
in RMS
1-3
Section I
Introduction
TABLE 1 - 1. PERFORMANCE SPECIFICATIONS (Cont.)
Parameter
Specifications
RANGING
Autoranging plus hold on range
BASIC MEASUREMENT
ACCURACY The total accuracy
of the Model 4200 system,
including sensor, is the sum of
the uncertainties noted in sections A, B, C and D. These
uncertainties may also be added
in an RSS fashion which represents the most probable total
uncertainty.
A. Basic Uncertainty (includes all instrumentation, noise, zero, and shaping errors and includes 0.7% power reference setting error)
>
6E
Co)"2
7E
8E
4K
•
4KA
4Q
10 nW
1.2% rde= 0.1% fs
1.5% rde :4-- 1.5% fs
1.2% rd.? = 0.1% fs
1.5% rde J..- 1.5% fs
1.2% rde =0.1% fs
1.5% rde 27.1.5% fs
1.2% rde=0.1% fs
1.0% rde =3.0% fs
1.2% rde = 0.1% fs
1.0% rdg = 3.0% fs
=6% rde
<10 nW
>100 nW
<100 nW
>1 p.W
<I p.W
>10 ILW
<10 .i.NA/
>100 1.1.W
<100 i.i.W
10 ILW ( - 20 dBm) at
22 GHz
10 p.W ( - 20 dBm) at
33 GHz
10 ILW ( - 20 dBm) at
40 GHz
10 nW to 10 mW at
40 GHz to 60 GHz
10 nW to 10 mW at
50 GHz to 75 GHz
10 nW to 10 mW at
75 GHz to 110 GHz
10 nW to 10 mW at
18 GHz to 40 GHz
5E
When operated as a dual-channel
instrument (option - 03), total
uncertainties of A must be multiplied by a factor of two.
Uncertainty
Power
Input Level
4U
4V
4W
WRD180
-
dBm
•
RSS = (A2 + B2 + C2 +
Sensor
4B/C/FJG
see
curves
below
=0.25*
±: 13% rde
=0.50*
= 13% rde
=0.50*
= 6% rde
=0.25*
=6% rde
=0.25*
±.6% rde
=0.25*
=6% rde
± 0.25*
* =0.01 dB/10 dBm relative to -20 dBm
-
t•
, •-• •
,
±-•
, , ,4-:-.-t-i-tt- ,-,
1 t ..t.t..tt•,...,.
„.,_ ■-■-•-•-z
i-.- •--•-•-1-- i- r.tr
-.--•-•.i--
l
moo
moo.
.-•-■ I-
•
.., l t
1-•••• ' '
-40
-30
____- -1
, ,
,
*** ; ** --,
, _ ...t____1_
,
, ,_,
,
'
.
' '' 1.,..'
f ',...• L.'' * !MEM=
=SC
,
rt
Senes 6 .
Senes 8
t,
-t:
--
.
Senes 5
,
*
„.._ II „ ..,. Inn
-..
I A., , -,--.1-1_,_ irt_.,
sw.:-.79i
NI ,..t_ ttr- : tr tl.,.:.
u -41
.L.L
t-r; ;
-50
1
t'Ll.:: '.. •`'.•;;:
_____,.....
_
• '--- ----
* :..:::-..-t•-d-r•---.. Series 6 .
• "•
;,': . ":
. I;• - . 1:;
, ,, ,
, .
..... . .
.. ,
Series 7
Series 8 , , --,-L.; „
• • • t_.
. -; '
" .
i
1-
. •
.
Senes •it,
Series 5
7
,ri
1-4
•
1,
, • • t• • •
---itti"
,■
.-•-
0
-60
t.--t-r:
• --,...
, 4-•.■-1 •
Series 4
.a
.
6,0
t:
05
't ,:t:
Series
L,
.,_,_,__,
•
. i 1. ._
-,
- "---..- s-1-:- • • , 71:-. .-4. . - - - . 1-- 4--.=
,
•
•
•
■
t.
.
'-
....,
L....
•••
---t-r-
.-.
::"...
: 1!
1
l
.4 •
"1
'
, . r,
.-:1- :-.
-' ' : -•-•
7,--,-" ,
• :-: . t ; 1
1. - r .---1 ,•••
t-:-- +-Lc.
t-"' , , -
-
:':11:::
I:
-h.-1-r
r
;- F
t ';
-±:
1%4-1i-r-i-,.- r , 4--
'
1-1-H"-•-•--
t -t :
M------"
•-r- , .
1±.144._I
,
,,_
.4--
.- '; .. •-•-
..-..-,4 wr.
...........
,....mm.
Ll
-11:1.6WIE
.-1.- • •
.
-10
-20
dBm
0
+10
+200
+30
Section I
Introduction
TABLE I-I. PERFORMANCE SPECIFICATIONS (Cont.)
Parameter
Specifications
B. Temperature Uncertainty (at 1 MHz)
Uncertainty
Temperature
Instrument
21°C to 25°C (reference)
0% (0 dB)
0% (0 dB)
irc to
0%(0 dB)
±2.32% (± 0.1 dB)
10°C to 40°C
±4.7% (±0.2 dB)
±4.7% (±0.2 d B)
0°C to 55° C
±5% (±0.25 d B)
30°C
All Sensors
C. Calibration Factor Uncertainity
Coaxial Sensor Calibration Factor Uncertainty
Sensor
4C (51012;
Max. %
RSS %
4E (51013)
Max. %
RSS %
46 (51051)
Max. %
RSS %
5E (51015)
Max. %
RSS %
6E (51033)
Max. %
RSS %
7E (51016)
Max. %
RSS %
8E (51017)
Max. %
RSS %
.05'
<2
2
3
4
5
6
7
8
9
10
11
12
0000000 000000000
48 (51011)
Max. %
RSS %
Frequency GHz
1.3
1.3
3.0
1.7
3.0
1.7
3.5
1.7
3.5
1.8
3.5
1.9
3.5
2.0
40
2.1
4.0
2.5
40
2.5
45
2.4
4.5
3.0
1.3
13
3.0
1.8
3.0
1.8
3.5
1.8
3.5
1.9
3.5
2.0
3.5
2.0
4.0
2.2
4.0
2.6
40
2.5
45
2.7
13
13
3.0
1.7
10
1.7
3.5
1.7
3.5
1.7
3.5
1.8
35
1.9
4.0
2.0
40
2.4
4.0
2.3
12
1.3
3.0
1.7
10
1.7
3.5
1.7
3.5
1.7
15
1.8
3.5
1.9
4.0
2.0
4.0
2.4
1.3
1.3
10
1.7
10
1.7
35
1.7
3.5
1.7
3.5
1.8
3.5
1.9
40
2.0
1.3
1.3
3.0
1.8
10
1.8
35
1.8
3.5
1.8
3.5
1.9
3.5
2.0
13
1.3
10
1.8
10
1.8
3.5
1.8
3.5
1.8
15
1.9
3.5
2.0
13
14
15
15
17
18
4.5
30
6.0
3.4
6.0
3.1
6.0
3.2
6.0
33
6.0
3.1
6.0
34
40
2.2
4.5
2.6
6.0
3.0
6.0
2.8
6.0
2.8
60
2.9
6.0
2.8
6.0
3.1
40
2.3
4.0
2.2
4.5
2.8
6.0
3.0
6.0
2.8
6.0
2.8
6.0
2.9
6.0
2.8
6.0
3.1
4.0
2.4
40
2.3
40
2.2
4.5
2.8
6.0
10
6.0
2.8
6.0
2.8
6.0
29
6.0
2.8
6.0
3.1
40
2.1
40
2.5
4.0
2.4
40
2.6
45
2.9
6.0
13
6.0
3.1
6.0
31
6.0
12
60
3.0
6.0
3.4
4.0
2.1
4.0
2.5
4.0
2.4
4.0
2.6
4.5
2.9
60
13
6.0
3.1
6.0
3.1
6.0
12
6.0
3.0
6.0
3.4
1926.5
1.3
1.3
6.0
3.4
• Reference Frequency 50 MHz. Note: CAL Factors are supplied at every 1 GHz.
Waveguide Sensor Calibration Factor Uncertainty
Sensor
4K (51035)
Max. 0%
Ref.
GHz
Max. %
ASS %
Freq.
Over
Sensor
BW
22
RSS %
4Ka (51036)
At
Ref.
Sensor
Ref.
GHz
40 (51037)
40
6
5
6
5
Max. %
RSS %
6
5
10
4U (51045)
Max. %
RSS %
33
7
At
Ref.
Fnm.
Over
Sensor
8W
10
6
13
7
10
6
13
8
Sensor
4V (51046)
Max. %
Max. %
RSS %
At
Freq.
Over
Sensor
BW
12
6
13
9
12
9
13
Ref.
Sensor
Ref.
GHz
At
Ref.
Freq.
Over
Sensor
BW
6
5
10
60
RSS %
4W (51047)
40
Ref.
GHz
94
WRD-180
(5.1972)
Max. %
RSS %
33
7
11
Note: For waveguide sensors. he reference calibration s at -20 dem.
D. Power Reference Uncertainty. Power reference accuracy is ±1.2%
worst case for one year (0° to 55°C). When calculating the sum of the
uncertainties, only include 0.5% for the power reference as the remaining
0.7% is included in A above.
1-5
Section I
Introduction
TABLE 1-1. PERFORMANCE SPECIFICATIONS (Cont.)
Specifications
Parameter
POWER REFERENCE
Source
Internal 50 MHz oscillator with Type N female connector on front panel.
Power output
1.00 mW, factory set to ±0.7%, traceable to National Bureau of
Standards, ±1.2% worst cast for one year (0° to 55°C).
CALIBRATION
Front panel key automatically calibrates instrument to power reference.
ZERO
Automatic, operated by front-panel switch.
CALIBRATION FACTOR
+ 3.0 dB to —3.0 dB ranges in 0.01 dB steps, entered through front panel
keys; alternately, stored calibration factors are interpolated linearly and
applied automatically to readings when the frequency is entered through front
panel keys. Up to 20 individual calibration factors for up to 8 power sensors
can be stored in non-volatile memory.
MEASUREMENT TIME
Diode sensors, typically 0.2 to 0.5 s except 2-6 s below -40 dBm.
Thermocouple sensors, typically 0.5 to 6 s for increasing levels, 0.5 to 14 s
for decreasing levels.
RECORDER OUTPUT
See Table 1-3.
1-6
Watt Mode
10 volts full-scale, proportional to indicated power over each range.
dB Mode
8 volts equivalent to 0 dBm for all sensors with a sensitivity of 1 volt per
10 dB change over the entire range.
DISPLAY
4-digit LED, 3-1/2 digit display of power, 4-digit display of dB with 0.01
dB resolution. Auxiliary analog display, uncalibrated, proportional to
recorder output.
dB LIMITS
Entered through front panel in dB only, operable in both dB and
power modes.
ANNUNCIATORS
LED display of mW, W, nW, dBm, or relatiNe dB (dBr); LED indication
of use of channel I (CH I), channel 2 (CH2, option -03), and channel 3
(CH 3 = CHI - CH2 in dB); out of dB limits; and condition of GP1B
activity (LSN, ATN, REM, AND TALK, option -01).
POWER CONSUMPTION
24 VA; 100, 120, 220, and 240 volts, 50 to 400 Hz.
WEIGHT
4.54 kg (10 lbs.) approximately.
DIMENSIONS
14.9 cm high x 21.1 wide x 34.9 deep (5.85 in. x 8.3 x 13.75).
ACCESSORIES FURNISHED
5 foot power sensor cable, Model 4I-2A, for each sensor ordered.
ACCESSORIES REQUIRED
One or more of the power sensors:
Refer to the Sensor Characteristics.
Section I
Introduction
TABLE I-I. PERFORMANCE SPECIFICATIONS (Cont.)
I
Parameter
Specifications
OTHER ACCESSORIES
AVAILABLE
Part No. 950000
Rack mounts one Model 4200, placed either right or left on 19-inch
spacing
Part No. 950001
Rack mounts two instruments, side-by-side
Part No. 950002
Rack mounts one Model 4200 with older Boonton half-rack units, right or
left
Part No. 950037
Rack mounts two instruments, side-by-side, with full extension and
locking chassis slides
Part No. 950038
Rack mounts one Model 4200, placed either right or left of an accessory
storage tray. Provision for front connection to dual-channel rear inputs.
Full extension locking slides
OPTIONS
-OIA and -01B Remote Operation to IEEE Bus Standard: All front panel controls except line
switch and power reference switch. In addition individual power and dB ranges
may be selected and selectively zeroed. Listen/talk address set by rear-panel bit
switch.
The 4200 implements these subsets of the GPIB function
SHI Source Handshake, complete capability
AH1 Acceptor Handshake, complete capability
Basic Talker, Serial Poll, Unaddress if MLA, No
T6
Talker Only capability
TEO No Extended Talker capability
L4
Basic Listener, Unaddress if MTA, No Listener
Only capability
LEO No Extended Listener capability
SRI Service Request capability
RL2 Remote-Local capability. No Local Lockout
PPO No Parallel Poll capability
DCO No Device Clear capability
DTI Device Trigger capability
CO No Controller capability
Note
MLA = My Listen Address
MTA = My Talk Address
In addition to the talk and listen commands, the 4200 responds to the following:
GTL, Go to local; GET, Group Trigger; UNL, Unlisten; UNT,
Untalk; 1FC, Interface Clear; R EN, Remote Enable.
Output Data Format:
abcsddddEsd, S, R (cr) (If)
ab = Mode: power, dBm, dBr
c = Channel number
s = Sign
d = Data digit
d = Data digit
E = Exponent marker S = Status code
R = Range code
s = Sign
Output Data Speed:
Free run access time is 55 ms, or 18 readings per second.
-03 Input Channel 2: Allows display of either Channel 1 or Channel 2, or
Channel 3 which is Channel 1 minus Channel 2, expressed in dB.
Requires use of two power sensors. Precludes use of option -02.
Channel I operates independently of Channel 2. Measurement
parameters are entered and stored separately for each channel.
1-7
Section I
Introduction
TABLE I-I. PERFORMANCE SPECIFICATIONS (Cont.)
In Channel 3 operation, GHz entry applies the appropriate calibration
factors for that frequency separately to Channel I and Channel 2.
Other measurement parameter entries made in the Channel 3 mode
do not respond and those previously made for Channel 1 and
Channel 2 remain active.
The recorder output is driven by Channel 1 or Channel 2 as selected. In
Channel 3 operation the recorder output reverts to Channel I.
-04 Rear Input: Duplicates front panel Channel 1 input connector.
-06 Internal TMA (MATE). Requires -01B Option.
-S/17 Two Inputs-On Front Panel. Requires -03 Option.
TABLE 1-2. SENSOR CHARACTERISTICS
Model
(Impedance)
(RF Connector)
Freq. Range
PWR rang*
(Watts)
(dem)
Overload
Rating
(Watts)
(dem)
Ong and Noose
Lowest Rang*
Max. SWR
Frequency I SWR
Drift (typical)
1 Hr
Nome (typical)
RMS
2a
0100E SENSORS
100 kHz to 12.4 GHz
100 kHz to 2 GHz
2 GHz to 4 GHz
4 GHz to 11 GHz
11 GHz to 12.4 GHz
1.12
1.2
1.4
1.6
65 pW
130 pW
51012 (4C)
750
NIM)
100 kHz to I GHz
I nW to 10 mW
-60 to • 10 dem
300 mW
+25 dein
100 kHz to I GHz
1.18
150 pW
65 pW
130 pW
51013 (4E)
500
NIMI
100 kHz to 18 GHz
1 nW to 10 mW
-60 to +10 dem
300 mW
+25 dem
100 kHz to 4 GHz
4 GHz to 10 GHz
10 GHz to 18 GHz
1.3
1.5
1.7 .4
150 pW
65 pW
130 pW
51051(4G)
500
APC 3.5 (M)
1 MHz to 26.5 GHz
I nW to 10 mW
-60 to +10 dem
300 mW
+25 dem
I MHz to 12.4 GHz
12.8 GHz to 18 GHz
18 GHz to 26.5 GHz
100 pW
30 pW
60 pW
51015 (5E)
500
N(M)
100 kHz to 18 GHz
10 nW to 100mW
-50 to +20 dem
2W
.33 dem
100 kHz to 1 GHz
1 GHz to 2 GHz
2 GHz to 4 GHz
4 GHz to 12.4 GHz
12.4 GHz to 18 GHz
1.5 nW
0.65 nW
1.3 nW
51033 (6E)
500
N(M)
100 kHz to 18 GHz
100 nW to I W
-40 to +30 dem
2W
• 33 dam
100 kHz to 1 GI-lz
1 GHz to 2 GHz
2 GHz to 4 GHz
4 GHz to 12.4 GHz
12.4 GHz to 18 GHz
1.07
1.10
1.12
1.18
1.28
15 nW
6.5 nW
13 nW
1 vW to 10 mW
- 30 to +10 dem
30 mW
+15 dem'
10 MHz to 15 MHz
15 MHz to 10 GHz
10 GHz to 18 GHz
1.5
1.35
1.6
450 nW
150 nW
300 nW
1.5
1 35
1.6
45vW
I 5 vW
1 nW lo 10 mW
'?:,
300 mW
• 25 dem
150 pW
-60 to + 10 dem
??.A
51011 (46)
500
N(M)
THERMOCOUPLE SENSORS
51016 (7E)
500
NOW
10 MHz to 18 GHz
• Thermocouple Pulse Characteristics at 25.C. Maximum pulse energy . 5 W-,sec.
Maximum subs. sower . I W Maximum pulse duration at maximum pulse power . 5 ,sec.
51017 (8E)
500
N(M)
10 MHz to 18 GHz
10 vW to 100 mW
-20 to +20 dem
200 mW
• 23 dem •
10 MHz to 15 MHz
15 MHz to 10 GHz
10 GHz to 18 GHz
3
Ol
• Thormocouoitt Pulse Characteristics al 25•C. Maximum pulse energy . 30 W-.sec.
Maximum ouise sower . 15 W Maximum pulse duration at maximum pulse power . 2 ,sec.
WAYEGUIDE SENSORS
la GHz to 26.5 GHz
10 nW to 10 mW
- SO to • 10 dem
103 mW
+20 dem
18 GHz to 26.5 GHz
1.3
200 oW
60 pW
120 oW
51972-WAG
WR0180C24
18 GHz to 40 Wiz
10 nW to 10 mW
-50 to • 10 dem
100 mW
+20 dem
18 GHz to 40 GHz
1.3
200 pW
600W
120 OW
51038 (4Ka)
WR-28
UG-599/U
28.5 GHz to 40 GHz
10 nW to 10 mW
-50 to • 10 dam
100mW
+20 dem
26.5 GHz to 40 GHz
13
600W
15 pW
30 pW
51037140)
WR-22
UG-383/U
33 GHz to 50 GHz
10 nW to 10 mW
-50 to .10 dem
100 mW
+20 dem
33 GHz tO 50 GHz
1.3
60 oW
15 OW
30 PW
51045 (4U)
WR-19
UG-383/U
40 GHz to 60 GHz
10 nW to 10 mW
-50 to +10 dem
100mW
+20 dam
40 GHz to 60 GHz
I3
60 0W
15 pW
30 pW
51048 (4V)
WR-15
UG-385/U
50 GHz to 75 GHz
10 nW to 10 mW
- 50 to +10 dam
100 mW
• 20 dem
50 GHz to 75 GHz
1.3
60 pW
15 pW
30 pW
51047 (4W1
WR-10
UG-387/U
75 GHz to 110 GHz
32 nW to 10 mW
-45 to +10 dem
100mW
• 20 dam
75 GHz to 110 GHz
13
60 pW
15 pW
30 0W
50135 (4K1
WR -42
UG-595/U
NOTES: • W41 vmnstana shon periods of overload. extended overload operation may result in permanent change in characteristics or burnout.
Power linearity uncertainly: (worst ease) 4B. 4C. 4E (003 f ) dB per de above +4 dem: (above • 14 dam for the SE and above .24 dem for the 6E).
where f Is vn GHz. Other sensors: negligible.
1-8
*See Instruction-manual supplement
Section I
Introduction
Table 1-3A. Model 4200 and DIODE SENSORS: Measurement Speed through the IEEE Bus
t
1
Starting Level, dBm
10-dB Power Step
20-db Power Step
30-db Power Step
50-db Power Step
-5E Sensor
...
-6E Sensor { Increasing
Decreasing
Increasing
Decreasing
Increasing
Decreasing
Increasing
Decreasing
-60
-50
-40
.
i
0.60 s
N.A.
0.65 s
N.A.
0.45 s
N.A.
0.50 s
N.A.
-50
-40
-30
1
1
0.60 s
5.4 s
0.40 s
N.A.
0.35 s
N.A.
0.50 5
N.A.
-40
-30
-20
1
0.40 s
1.0 s
0.35 s
5.4 s
0.40 s
N.A.
0.35 s
N.A.
-30
-20
-10
1
0.35 s.
0.50s
0.35s
1.0 s
0.40s
5.4s
N.A.
N.A.
-20
-10
0
0.35 s
0.30 s
0.35 s
0.55 s
0.30 s
1.0 s
N.A.
N.A.
-10
0
+10
0.20 s
0.25 s
0.15 s
0.25 s
N.A.
0.70 s
N.A.
6.0 s
0
+10
+20
i
0.15 s
0.35 s
N.A.
0.35 s
N.A.
0.50 s
N.A.
1.7 s
+10
+20
+30
i
N.A.
0.35 s
N.A.
0.35 s
N.A.
0.60 s
N.A.
1.0 s
-4E Sensor
Table 1-3B. Model 4200 and THERMAL (true RMS) SENSORS: Measurement Speed through the IEEE Bus
Starting Level dBm
-8E Sensor
-30
-20
i
i
-10
1
-10
0
0
+10
+10
+20
10-dB Power Step
;
: Increasing
-7 Sensor
-20
NOTES:
:
30-db Power
Step
40-db Power Step
Decreasing
Increasing
Decreasing
Increasing
Decreasing
Increasing
Decreasing
6.0 s
N.A.
1.0 s
N.A.
0.75 s
N.A.
0.35 s
N.A.
1.0 s
4.0 s
0.75 s
N.A.
0.35 s
N.A.
N.A.
N.A.
0.75 s
1.6 s
0.35 s
6.1 s
N.A.
N.A.
N.A.
N.A.
0.25 s
1.5 s
N.A.
2.7 s
N.A.
9.0 s
N.A.
N.A.
N.A.
0.50 s
N.A.
4.0 s
N.A.
13.4
s
N.A.
14.0 s
.
I
:
I
:
t
:
20-db Power Step
I. "Measurement Speed" is the time required to make measurements within 0.1 dB of final value on the
using an HP-85 controller. The free-run access time is 55 ms (18 measurements per second).
ending
range.
2. These are typical speeds (in seconds), using the Display-Hold ("Q" command) measurement mode.
3. With dual-channel operation (i.e.: with Option -03 installed), the measurement rate is two sets of readings
per second.
TABLE 1-3. MAXIMUM RESPONSE CHART FOR SERIES 4200-A SENSOR.
1-9
Section I
Introduction
Table 1-3C. Model 4200 and DIODE SENSORS: Measurement Speed through the IEEE Bus
1
e
1
Starting Level. dBm
10-dB Power Step
20-db Power Step
30-db Power Step
50-db Power Step
t
1
;
: Increasing
1
I
i
1
0.60 s
4K. 4Ka. 4Q, 4U,
4V, 4W, WRD180
Sensors
-50
i
1
1I
1
1.1
-40
- 30
Decreasing
Increasing
Decreasing
Increasing
Decreasing
Increasing
Decreasing
N.A.
0.65 s
N.A.
0.45 s
N.A.
0.50 s
N.A.
N.A.
0.60 s
1.0 s
0.40 s
N.A.
0.35 s
N.A.
0.50 s
0.40 s
0.5 s
0.35 s
1.0 s
0.441 s
N.A.
N.A.
N.A.
:
•
i
0.35 s
0.35 s
0.35.s
0.55 s
0.40 s
1.0 s
N.A.
N.A.
0.35 s
0.35 s
0.35 s
0.35 s
N.A.
0.55 s
N.A.
N.A.
i
.
:
0
0.20
0.25 s
N.A.
0.25 s
N.A.
0.35 s
N.A.
1.7 s
0.35 s
N.A.
0.35 s
N.A.
0.35 s
N.A.
1.0 s
e
- 20
- 10
0
+ 10
NOTES:
5
N.A.
1. "Measurement Speed" is the time required to make measurements within 0.1 dB of final value on the ending range,
using an HP 85 controller. The free-run access time is 55 ms (18 measurements per second).
-
2. These are typical speeds (in seconds), using the Display-Hold ("Q" command) measurement mode.
3. With dual-channel operation (i.e.: with Option -03 installed). the measurement rate is two sets of readings
per
second.
TABLE 1-3. MAXIMUM RESPONSE CHART 2 FOR INSTRUMENT AND 4240 SENSOR (Cont.)
Section I
Introduction
Figure 1-2 Outline Dimensions
Section II
Installation
SECTION II
INSTALLATION
2-1. INTRODUCTION.
2-2. This section contains instructions for the installation of
the Model 4200 RF Microwattmeter.
2-3. INSTALLATION.
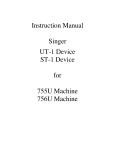
2-4. Unpacking. The instrument is shipped complete
with sensors (if ordered), and is ready for use upon
receipt. Packaging details are shown in Figure 2-1.
Unpack the instrument carefully, and inspect it for any
signs of shipping damage. Should any damage be noted,
notify the carrier and the factory immediately.
NOTE
Save the packing material and container for
possible use in reshipment of the instrument.
2-5. Mounting. For bench use, choose a clean, sturdy,
uncluttered surface. See Figure 1-4 for space requirements. For rack mounting, an accessory package, part
number 950000, is available to mount one instrument,
and another package, part number 950001, is available to
mount two instruments side-by-side.
2-6. Power Requirements. The instrument has a tapped
power transformer which permits operation from 100,
120, 220, or 240 volt t 10%, 50 to 400 Hz, single phase ac
power sources. Power consumption is approximately 24
volt-amperes at 60 Hz.
2-7. Cable Connections. Interconnecting cable connections required depend upon the options installed and
the system applications of the instrument. A line cord and
sensor cable are supplied with the instrument. Any other
cables required must be supplied by the user. Cable connections that may be required are as follows:
Figure 2-1 Packaging Diagram
2-1
Section Il
Installation
( I.) In the power mode, it is proportional to displayed
power, with 10 volts for full scale each range, either
channel.
(2.) In the dB mode, it is proportional to displayed dBm
with the relationship shown following:
2-2
+ 30
+ 20
+ 10
0
—10
—20
—30
— 40
— 50
— 60
6
Volts
I I
* b. Recorder Output. Recorder connector J20 (type
BNC) on the rear panel provides an analog dc voltage for
application to a remote recorder. The output resistance is
approximately 9000 ohms, delivering 1 milliampere into a
1000 ohm load for full scale input in the power mode. The
analog dc voltage is proportional to the following:
dBm
Sensors Series
5/8
C7N00 Is- kb trl getcol(N
The front-panel SENSOR connector is the
input connector for channel 1 measurements.
If the instrument is equipped with option -03,
a sensor may be connected to the rear-panel
connector marked SENSOR; the same conditions apply to this sensor connection. The
rear-panel connector is the input connector
for channel 2-measurements.
4/7/K/Ka
Q/U/V/W/
WRD180
1111
NOTE
Recorder Output
kl,
a. Sensors. The sensor cable supplied with the basic
instrument connects directly to the fot-anel SENSOR
connector, and the sensor that is to be used for power
measurements connects directly to the other end of the
se cable. Although the sensors are insulated against
extreme temperature variations it is advisable to locate
t1 sensor away from heat sources when using the most
sensitive ranges of the instrument. If the instrument is to
be used to measure the output of equipment that generates heat significantly above the ambient temperature, a
short length of coaxial cable or solid line having the same
characteristic impedance as the sensor may be used
between the sensor and the equipment undergoing test to
allow heat to dissipate before reaching the sensor. If such
a cable is used, the length must be kept as short as possible
for operation at the high end of the frequency range; cable
losses and an increase in SWR will tend to degrade measurement accuracy.
(3.) In the channel 3 mode (option), it is similar to the dB
mode, but for the channel I level only.
c. Status Output. Rear-panel connector P3 provides
signal outputs for input disconnect during zeroing
operations and high and low DB limit signals during dB
measurements. The dB limits always test against the
displayed value for operation. With the calibration factor
and dB reference level equal to zero, the dB limits
entered prevail. With a dB reference level other than zero
the displayed value is checked against the limits chosen.
In the channel 3 mode (option), the first limit exceeded.
whether channel 1 or channel 2, activates the limit status
Pin connections are as follows:
Connector Pin
1
2
3
4
5
Signal
Common
Not used
Logic high indicates zeroing
operation
Logic low within dB limits;
logic high above high dB limit
Logic low within dB limits;
logic high below low dB limit
*See Instruction-manual supplement
Section III
Operation
SECTION III
OPERATION
3-1. INTRODUCTION.
3-2. This section contains the operating instructions for the
Model 4200 RF Microwattmeter.
3-3. OPERATING CONTROLS,
INDICATORS, AND CONNECTORS.
c. Check the rating of the fuse in the rear-panel fuseholder. For 100 or 120 volt operation, the fuse should be a
0.3 ampere, MDL Slo-Blo type; for 220 or 240 volt operation, it should be a 0.2 ampere, MDL Slo-Blo type. If the
rating of the fuse is incon-ect, install a fuse of the required
rating in the fuseholder.
3-4. The controls, indicators, and connectors used during
the operation of the instrument are listed in Table 3-1 and
shown in Figures 3-1 and 3-2.
3 5.
-
SENSOR CALIBRATION DATA.
3-6. Calibration corrections for sensors ordered with the
instrument are written into microprocessor storage at the
factory before shipment of the instrument and sensor. A
copy of this information is stored under the right side cover.
WARNING
The instrument is designed to operate from a
3-terminal (one ground) ac power receptacle.
If only a 2-terminal ac power receptacle is available, use a 3-prong to 2-prong adapter. Connect
the ground wire of the adapter to the power
receptacle ground to eliminate a potential shock
hazard to the operator.
When the CAL FACTOR GHz function of the instrument
is used during measurement, the microprocessor reads and
interpolates the stored data on the basis of the specified
measurement frequency, and con-ects all measurement
values accordingly. The microprocessor memory has stor-
d. Connect the power cord between the ac power connector on the rear panel of the instrument and the ac power
age capacity for calibration data for up to eight sensors.
receptacle (with adaptor, if necessary).
Calibration corrections vary for different sensors; therefore,
if sensors arc to be substituted or added in the field, calibration data for these sensors must be written into memory in
3.9 PRELIMINARY CHECKOUT
the field in order for the CAL FACTOR GHz function to be
accurate. Refer to paragraph 5-37 for calibration data entry
procedures.
3 7. POWER APPLICATION.
-
3 8. The basic instrument is designed for operation from a
-
100, 120, 220, or 240 volt, 50 to 400 Hz, single phase, ac
power source. To apply ac power, proceed as tbllows:
NOTE
The following checkout procedure is intended
merely to demonstrate that the major circuits of
the instrument are operating before the instrument is placed for service. For a detailed check
of the instrument aeainst performance specifications, refer to paragraph 3-34.
3-10. To perform the preliminary checkout, proceed as
a. Determine the line voltage at the ac power output
receptacle.
follows:
b. Set the two slide switches on the rear panel to conform
to the available ac line voltage.
b. Check operation of the LED display and the
numerical keys by pressing the following keys in the
a. Set the LINE switch to the ON position.
Section III
Operation
Figure 3-1 Front View of Instrument
CIt
ACCssssssiemAi.
iic.ts)110=
5
9892 9864 3109
OPTIONS 01A-03
••
•
Figure 3-2 Rear View of Instrument
3-2
Section III
Operation
TABLE 3-1. OPERATING CONTROLS,
INDICATORS, AND CONNECTORS
Control, Indicator
or Connector
Figure and
Index No.
LSN, ATN, REM,
and TLK
annunciators
3-1, 1
Indicates operation of
IEEE-488 bus interface
(option -01).
Meter
3-1, 2
Indicates power and
dB levels for peaking
and nulling operation.
Function
CH I , CH2, and
CH3 annunciators
3-1, 3
Indicates channel in
use.
MODE keys
3-1, 4
Selects LED display
indication mode
(POWER or dB).
RANGE keys
3- I, 5
Selects ranging mode
(AUTO or HOLD).
LED display
3-1, 6
Four digit LED
display with minus
sign and decimal
points: provides
numerical indication
of measured power or
dB m, and of data
entered or recalled
through keyboard,
or error messages,
mW, p.W, and nW
annunciators
3-1, 7
Indicates units of
power when instrument is operating in
power mode.
dBm and dBr
annunciators
3-1,8
Indicates dB mode in
use when instrument
is operating in
dB mode.
LINI annunciator
3-1,9
Indicates when power
level in dB is outside
selected dB limits.
dB LIMITS keys
3-1, 10
Provides means for
entering and recalling
dB limits (1_0 and HI).
CAL FAC keys
3-1, I 1
Provides means for
entering and recalling
calibration factors in
terms of dB or
frequency.
Control, Indicator,
or Connector
SELECT keys
CHNL key
Figure and
Index No.
Function
3-1, 12
Provides means for
entering and recalling
channel and sensor
serial numbers.
REF LEL
dB
key
3-1, 13
Provides means to set
the dB reference
level.
CLR
key
LCL
3-1, 14
Provides means for
clearing incorrect
digit(s) entry, clearing
dB calibration factor
and dB reference level
to zero, and returns
keyboard control from
IEEE-488 bus control.
Numerical,
decimal point, and
and CHS keys
3-1, 15
Provides means for
entering signed
numerical data.
LINE switch
3-1, 16
Provides means for
turning AC line
power on and off.
POWER REF
connector
3-1, 17
Supplies I mW level
at 50 MHz to 5() ohm
load when POWER
REF ON switch is set
to ON position.
SENSOR
connector
3-1, 18
Provides means for
connecting sensor to
channel 1 input.
CAL key
3-1, 19
Provides means for
calibrating instrument when sensor is
connected to 1 mW
source.
ZERO key
3- I , 20
Provides means for
generating and storing
zero corrections for all
ranges with zero input
to sensor.
SENS
key
•SiN
•SET
3-3
Section III
Operation
TABLE 3 1. OPERATING CONTROLS, INDICATORS, AND CONNECTORS (Cont.)
-
Control, Indicator
or Connector
Figure and
Index No.
Function
Control, Indicator,
or Connector
Figure and
Index No.
11 connector
3-2, I
Connector for IEEE488 bus operation
(option -01).
Power connector
3-2, 4
3_192
LINE VOLTAGE
3- 1 , 5
S I switch
Provides means for
selecting instrument
address when instrument is equipped with
IEEE-488 bus interface
option (option -01A)
selector switch
3-2, 3
Provides logic level
signals for input
disconnect during
zeroing operations
and high and low dB
limit signals during
dB measurements.
sequence indicated and noting the LED display:
Press
Display
CLR
0000
0000.
000.0
0
00.0 I
2
3
CLR
4
5
6
7
CLR
8
9
CHS
CLR
0.012
0123
0000
0004
0045
0456
Provides means for
INPUT
connector
1 1 6
Provides means for
connecting sensor to
channel 2 input
(option (13).
INPUT
connector
3- 1 , 7
Alternate position for
INPUT channel I
(option 04).
RECORDER
connector
3-', 8
Provides means for
connecting analog
DC voltage to remote
recorder.
ponding to the sensor number and then pressing the
SELECT SENS keys. (Example: 2 SELECT SENS.)
e. Check to see that the d Bm and CHI annunciator
lighted.
f. With zero input to the sensor, press the ZERO
the instrument will now begin the zeroing process.
instrument display during the zeroing period will be "cccc".
Upon completion of zeroing, the display will he "cc03
g. Connect the sensor to the POWER REF connector.
The LED display should indicate approximately 00.00
d Bm (assuming that a 50-ohm sensor is used). If it does
press the CAL key.
4567
0000
0008
0089
-0089
0000
c. Enter measurement parameters by pressing the following keys:
I SELECT CHNL
MODE dB
RANGE AUTO
0 CAL FACTOR dB
0 REF LEVEL dB
90 CHS dB LIMITS LO
90 dB LIMITS HI
d. Connect the sensor cable to the front-panel SENSOR
connector, and connect the sensor to the free end of the
sensor cable. Note the sensor number indicated on the
barrel of the sensor, and enter this number through the
numerical keyboard by pressing the numerical key corres3-4
Provides connection
for power cord.
selecting proper line
voltage.
and message terminator.
P3 connector
Function
h. Key in .2 CAL FACTOR dB through the keyboard.
The LED display should change to approximately 00.20
d Bm.
i. Key in 0 CAL FACTOR dB through the keyboard.
The LED display should return to approximately 00.00
d Bm.
j. Key in I CHS REF LEVEL dB through the keyboard. The LED display should indicate approximately
01.00 dBr.
k. Key in 1 REF LEVEL dB through the keyboard.The
LED display should indicate approximately -01.00 dBr.
I. Key in 5 dB LIMITS HI through the keyboard.The
LIM annunciator should be off.
m. Key in 5 CHS dB LIM ITS LO through the keyboard.
The LIM annunciator should remain off.
Section III
Operation
n. Key in .5 dB LIMITS HI through the keyboard. The
LIM annunciator should remain off.
o. Key in .5 CHS dB LIMITS LO through the keyboard.
The LIM annunciator should light.
p. Key in 0 REF LEVEL d B through the keyboard. The
LED display should indicate 00.00, the LIM annunciator
should be off and the dBm annunciator should be lighted.
q. Press the MODE PWR key. The LED display should
indicate approximately 1.000 mW.
r. Disconnect the sensor from the POWER REF
connector.
3 11. OPERATING INSTRUCTIONS .
-
3-12. Measurement Parameters.
a. General. Measurement parameters are entered into
the microprocessor through the front-panel keyboard. In
order to eliminate the need for repeated reprogramming,
parameters entered through the keyboard are stored in
non-volatile memory, and the stored parameters are unaffected by instrument turn-off and turn-on. It is important
to remember that the last used parameters are stored in the
instrument because these stored parameters could cause
what may appear to be erroneous indications when subsequent measurements are made. For example: if the instrument had been programmed for operation with sensor 2
and sensor I is used instead, the LED display may be
inaccurate if a G Hz calibration factor is entered because the
sensor 2 calibration factors will be used by the microprocessor instead of the sensor 1 calibration factors. If there is
any question about stored measurement values, the last
entered values can be recalled for display as described in
subparagraph b below. Measurement parameters may be
changed at any time.
NOTE:
When the instrument is in the store or recall mode,
the LED display and the annunciators blink on and
off. This feature is intended to alert the operator to
the fact that the displayed value is not a measured
value; it is a value that has been recalled from the
instrument memory or that is to be entered into
memory.
3-13. Use of Numerical Keys. The numerical keys are used
to enter numerical values for dB LIM ITS, CAL FACTOR,
SELECT, and REF LEVEL dB functions. Whenever any
numerical key is pressed. the microprocessor interrupts the
measurement operation to accept new data. Numerical
values are keyed in normal sequence, and keyed-in values
enter the LED display from right to left. Up to four digits,
plus decimal point and minus sign can be entered; entries
exceeding four digits are ignored. Pressing the decimal
point key places a decimal point after the right-most digit in
the LED display. Pressing the CHS key changes the sign of
the entry in the LED display; that is, plus becomes minus,
or minus becomes plus. (The plus sign is not displayed.) If
an error is made during entry of numerical values, press the
CLR key and repeat the data entry process. When the LED
display shows the desired numerical value, pressing the
applicable dB LIMITS, CAL FACTOR, SELECT, or
REF LEVEL dB key will cause the microprocessor to store
the keyed in parameter and return automatically to the
measurement cycle. Recall of the last entered values is
accomplished by depressing the dB LIM ITS H I, dB LI MITS LO, CAL FACTOR dB, CAL FACTOR GHz,
SELECT CHNL, SELECT SENS, or REF LEVEL dB
keys, as applicable. The value stored for the selected
parameter is displayed on the LED display. When a recall is
performed, the instrument remains in the recall state until
either a MODE key or a RANGE key is depressed: the
instrument then returns to the operating state.
3-14. SELECT Function. The SELECT keys are used by
the operator to specify the number of the sensor to be used
for measurements, and the measurement channel.
IMPORTANT NOTE:
For normal operation, the CHANNEL and sensor
must be selected before any operation is performed,
however, the CHANNEL must be selected before the
sensor is selected.
a. The basic instrument contains only one measurement
channel. This measurement channel is designated channel
I, and the front-panel SENSOR connector provides the
input to this channel. An option is available for addition of a
second measurement channel. When this option is included.
the additional channel is designated channel 2. and input
power levels are applied to this channel for measurement
through a rear-panel connector. To further enhance the
usability of the instrument, a channel 3 mode may he exercised. When channel 3 operation is specified, channel I and
channel 2 levels are measured and compared by the microprocessor, and the difference in relative dB (with the channel 2 level as the reference) is displayed on the LED display Channel I measurements, channel 2 measurements or
the channel 3 function can he selected using the numerical
keys and the SELECT CHNL key.
Example: To select the channel i input for measurement:
Press
Display
000 I
SELECT CHNL
b. Calibration data for up to eight sensors can be stored
in the instrument. In order to use the proper calibration data
when the CAL FACTOR GHi function is selected, the
microprocessor must he advised as to which sensor is being
used. The SELECT SENS key is used in conjunction with
the numerical keys for this purpose. The sensor number is
shown on the barrel of each sensor.
3-5
Section III
Operation
Example: To specify sensor number two:
Press
Display
2
SELECT SENS
0002
c. Sensor serial numbers are stored in the non-volatile
memory. To recall sensor serial numbers:
Press
Display
• key,
SENS
•S/N
kt.N.
will respond
with the serial
number stored in
memory.
3-15. MODE Selection. The MODE keys enable the operator to select the desired measurement mode. When the
MODE PWR key is pressed, measured power levels are
displayed in mW, µ W, or nW; the annunciators associated
with the LED display indicate the appropriate unit. When
the MODE dB key is pressed, measurement values are
displayed in terms of dB with respect to an operatorentered dB reference level. If 0 dB had been chosen as the
reference level, the displayed numerical values represent
dBm, and the dBm annunciator is lighted; selection of any
other dB reference level causes lighting of the d Br annunciator, and displayed measurement values represent dB
with respect to the selected reference level. Resolution of
the instrument in the dB mode is 0.01 dB.
3-16. RANGE Selection. The RANGE keys enable the
operator to select either automatic ranging or a range hold
function. The automatic ranging function, which is most
effective when measurine unknown or wide varyine
power levels, is activated by pressing the RANGE AUTO
key, and the microprocessor then selects the appropriate
measurement range automatically. If input power levels
exceed the upper measurement limit of the instrument, an
error indication (cc04) appears on the LED display; if input
power levels are below the low measurement limit of the
instrument, the instrument displays cc03. Ranging time is a
function of a number of factors such as absolute level,
change in level, analog response time, and direction of
change (See Figure 1-2 and 1-3). The range hold function is
useful when a series of measurements of approximately the
same power level are to be made; selecting this mode eliminates delays due to ranging time. The range hold function is
useful only in the PWR mode. When the RANGE HOLD
key is pressed, the instrument remains on the measurement
range that was active at the time the key was pressed. Input
power levels that exceed the upper limit of this range cause
an error indication (cc04) on the LED display; input power
levels below the low limit of this range result in fewer
significant digits in the LED display. If the minimum capability of the instrument is reached, the instrument diplays
cc03.
3-17. dB LIMITS Selection. The dB LIMITS keys enable
the operator to program high and low dB limits into the
instrument. Input power levels outside these limits will
cause lighting of the LIM annunciator and activation of
out-of-limit sienals at rear-panel connector P3.
a. Limits are entered by keying in the numerical value in
dB, using the numerical keys, and then pressing the dB
LIMITS LO or dB LIMITS HI key, as applicable.
Example: To enter a low limit of -31.34 dB:
Press
3
3
4
CHS
dB LIMITS LO
Display
0003
0031
0031
031.3
31.34
-31.34
b. The dB limits always test against the value displayed.
If the measurement is in d Bm (0 REF LEVEL dB), the limit
is in dBm. If any value other than 0 dB is chosen for the
reference level, the limits operate in d Br (relative dB), which
is the displayed value. If it is desired to have the limits
operate on dBm when the REF LEVEL is other than 0
dBm, the value entered as the REF LEVEL should be
subtracted algebraically from the desired dBm limits
(reverse the sign of the REF LEVEL dB and add algebraically to the desired limit in dBm).
c. The dB limit function is always operative in the
instrument. Fora!l practical purposes, it can be cancelled, if
desired, by entering a high limit of 90 dB and a low limit of
-90 dB.
3-18. CAL FACTOR Selection. The sensors used with the
instrument are frequency sensitive; that is, with a constant
input power level applied, their output signal level does not
remain constant as the measurement frequency is changed.
The CAL FACTOR keys provide means for introducing a
calibration factor in terms of one or two parameters; either
the actual dB calibration factor, or the measurement
frequency.
a. A calibration chart is attached to the barrel of each
sensor, and the calibration factor in dB for the measurement frequency being used can be computed from this
chart. This dB calibration factor can then be entered into
the instrument, using the numerical keys and the CAL
FACTOR dB key, and the microprocessor will correct all
subsequent measurements, both dB and power, automatically in accordance with the dB calibration factor
entered.
Example: To enter a dB calibration factor of -0.3 dB:
Section III
Operation
Display
0000.
000.3
-000.3
Press
•
3
CHS
CAL FACTOR dB
Example:
b. Reading and interpolation of the calibration chart
can be tedious and subject to error or inaccuracy. The CAL
FACTOR G Hz function provides a simple, alternative
method for calibration data selection. Calibration data for
up to eight sensors can be stored in the memory; such
calibration data may be entered into storage at the factory
or in the field. When the sensor number and the measurement frequency are entered throueh the keyboard, the
microprocessor computes the required correction from the
stored data and corrects subsequent dB and power measurements accord inely. The sensor number is entered using
the SELECT function described in subparaeraph g: the
measurement frequency is entered using the numerical keys
and the CAL FACTOR GHz key. To recall the last entered
frequency. for display, press the CAL FACTOR G Hz key:
to determine the calibration factor value for this frequency,
press the CAL FACTOR dB key. Press a MODE key or a
RANGE key to return the instrument to the operate mode.
Example: To specify a measurement frequency
Press
Display
3
0003
0003.
003.3
3
CAL FACTOR G Hz
3-19. REF LEVEL dB Selection. The instrument normally
uses 1 mW, 50 ohms as a reference for computing dBm
measurement values; the dBm annunciator is lighted during sucn operation. The REF LEVEL dB key, used in
conjunction with the numerical keys, enables the operator
to select any other desired dB reference level; subsequent
level indications are with respect to the selected reference,
and this display mode is indicated by liehtine of the dBr
annunciator.
a. A dB reference level is entered by keying in the
desired numerical value in dB, using the numerical keys,
and then pressing the REF LEVEL dB key.
Example: To enter a dB reference level of -15.3 dB:
Press
Display
000 I
0015
5
0015.
3
015.3
-015.3
CHS
REF LEVEL dB
b. To return to the dBm measurement display mode,
enter a 0 dB reference level, or press the CLR and REF
LEVEL dB keys.
Annunciators
dBr
dBm
Lighted
Liehted
Lighted
Lighted
Lighted
Off
Off
Off
Off
Off
Off
Lighted
Press
Annunciators
dBm
dBr
Display
0
0000
REF LEVEL dB
Off
Liehted
Lighted
Off
NOTE:
The maximum display capability of the LED display
is ±99.99 d B. When operating in the d Br mode, keep
this fact in mind. Avoid choice of dB reference levels
that will result in display values that exceed the LED
display capacity. Keyboard entries beyond the capability of the instrument produce error indications
(cc01 or cc02 for entires too small or too large,
respectively).
c. The displa.ved dBin may also be used as the reference
level. This is accomplished by first depressing the decimal
point key and then the REF LVL dB key.
The display will indicate 00.00 showing that the previously displayed LIBin level has now become the REF
LEVEL. This reference may be recalled by pressing the
REF LEVEL dI3 key: it can be cleared by depressing the
CLR and then the REF LEVEL dB keys.
Note that this entry method utilizes the current dBm level,
and would replace any previously entered dB reference
level. Note also that this procedure of entering the existing
dBm level as the dB reference level is not operative in
IEEE-488 bus interface operation (Appendix A).
3-21). Entry Limits. Limits for entry of parameter values
are as follows:
a. CAL FACTOR dB: 3.00 to — 3.00
b. CAL FACTOR GHz: 0.0 GHz to 999 GHz (sensor
dependent) with minimum increment of 0.1 GHz
REF LEVEL d13: 0 to -± 99.99, ith minimum increment of 0.01 dI3
.
d. dI3 1.11MITS 1.0 and dB LINI1TS HI: (1 to -± 99.99,
with minimum increment or 0.01 LIB.
3-21. Recall of Entered N'alues. The last entered value for
each of the corresponding functions may he recalled for
display on the LEI) display by pressing the following keys:
dli LIMITS LA)
LINn-rs HI
CAL FAcroR du
cAt. FACTOR Cd-lz
saEcr SENS
SELECT CI-INL
REF LEVEL (113
3-7
Section III
Operation
After any of the above keys are pressed, the instrument
remains in the recall mode. To return to the operating
mode, press any of the MODE keys or RANGE keys.
the sensor, the display will indicate cc03. If a signal is being
applied, and if the rear-panel (Pin 3, P3) power-disconnect
signal is being utilized, the display will indicate the power
being supplied to the sensor.
NOTE
When the instrument is in the recall mode, the LED
display and the annunciators will blink on and off.
3-22. Zeroing the Instrument. For greatest accuracy,
especially on the most-sensitive ranges, the instrument
must be zeroed. Zeroing is accomplished by depressing the
ZERO key with zero power applied to the sensor.
The zeroing period is composed of two parts. When the
ZERO key is depressed, a range-dependent "waiting
period - occurs first: it is followed by the actual zero acquisition for each range. The purpose of the waiting period is to
permit the sensor, and the instrument's analog and digital
circuits, to reach a clear (zero) state. The higher the level of
the signal prior to zeroing, the longer the waiting period
required.
TABLE 3-2. INSTRUMENT ZEROING TIME
Zeroing
Time
Sensor Series
4200-4
dBm
4200-5 4200-6
dBm
dBm
4200-7
dBm
4200-8
dBm
(Seconds)
+10
+20
+30
22
0
+10
+20
20
-10
0
+10
18
-20
-10
0
+10
+/0
16
-30
-20
-10
0
+10
14
NOTE
-40
-30
-20
-10
0
I/
When the instrument is first turned on, two successive zeroing operations should be performed.
-50
-40
-30
-20
-10
10
A TTL-compatible signal (true high), marking the beginning of the zeroing operation, is available at Pin 3 of P3 on
the rear panel. If this signal is utilized to remove incoming
power to the sensor, the waiting period will automatically
become range-dependent. If this TTL signal is not utilized,
the same results can be achieved by depressing the ZERO
key immediately before removing the incoming signal from
the power sensor. If the incoming signal is removed prior to
depressing the ZERO key, the instrument will immediately
begin down-ranging—which would result in a shorter waiting period than is desirable. In such an event, a second
zeroing operation should be used.
CAUTION
If the rear-panel (Pin 3, P3) power-removal signal is not utilized, signal power must be removed
immediately following depression of the ZERO
key. If signal power remains connected to the
sensor during the zeroing operation, an erroneous set of zeroes will be generated.
During the warm-up period, and whenever ambient conditions are changing, the instrument should be zeroed frequently if the lowest ranges (i.e. highest-sensitivity ranges)
are being used.
The display during the zeroing period will indicate cccc. On
completion of zeroing, and if no signal is being applied to
3 -8
The approximate zeroing times, including the "waiting
periods," are listed in Table 3-2.
3-23. Calibrating the Instrument. The instrument incorporates a power reference and automatic calibration facilities for fine sensitivity corrections. Sensitivity corrections
arc limited to a maximum of approximately ±3.5% from
the original, factory set values as a precautionary measure.
This feature protects against gross miscalibration which
might occur if calibration were attempted with a power
level other than that supplied by the power reference
applied to the sensor. If computed calibration corrections
from the factory set value exceed approximately ±3.5%,
the instrument rejects the sensitivity correction and reverts
to its previous sensitivity. To use the calibration function,
proceed as follows:
a. Program the instrument for power mode,autorange,
and the appropriate measurement channel and sensor.
b. Enter a calibration factor of 0 dB through the
keyboard.
c. Connect the sensor to the POWER REF connector.
d. Press the CAL key. The LED display should indicate
1.000 m W ±0.1% (±0.4% for 4200-5 sensors).
NOTE
If the instrument is supplied with a 75-ohm sensor
(4200-4C), an adapter (P/ N 950006) is also supplied.
Use this adapter between the POWER REF connector and the sensor to convert the Type N POWER
Section III
Operation
REF connector to a 75-ohm Type N. Before calibration, enter a 1.76 dB CAL FACTOR to compensate
for the mismatch error that is introduced by the
75-ohm sensor.
3-24. Error Messages. Under certain conditions, the LED
display returns error messages as follows:
Display Condition
cc01
cc02
cc03
cc04
cc05
cc06
cc07
Illegal entry, too low
Illegal entry, too high
Signal level out of range (low)
Signal level out of range (high)
Zero acquisition out of range-excessive negative offset (hardware malfunction)
Zero acquisition out of range-excessive positive
offset (input too large)
Signal level out of range, one channel high, one
channel low, in channel 3 mode of operation.
3-25. MEASUREMENTS.
3-26. Making Power Measurements. Once the instrument has been programmed, calibrated, and zeroed, it is
ready for power level measurements. Merely connect the
sensor to the source whose power level is to be measured.
The power level will be displayed directly on the LED
display.
3-27. Low-Level Measurements. The instrument will
provide reliable, reproducible measurements of CW, AM,
and FM power levels as low as 1 nW (-60 dBm). It can also
be used for pulse measurements but with slightly decreased
accuracy (± d B). Peak power levels for pulse measurements
should not exceed 200 W (20µW for Series 4200-4 sensors); above this level the sensor enters the region where it
operates out of the square-law region, and accuracy at such
signal levels is correct for CW and FM only.
3-28. High-Level Measurements. Zeroing of the instrument is not critical when making high-level measurements
(10 p.W to I W). CW and FM power measurements can he
obtained within the specified accuracy up to I W; accuracy
cannot be guaranteed for pulse power measurements with
instantaneous (35 u.W for Series 4200-4 sensors) peaks
exceeding 350 1.1.W.
3-29. High-Frequency Measurements. At frequencies
ahovve I GHz, the appropriate sensor calibration factor
must he entered through the keyboard if the specified accuracy of the instrument is to he realized. (Refer to paragraph
3- I 8 ).
NOTE
Model 4200-4A, 4200-4B, 4200-4E, 4200-5B, 4200-
5E, 4200-6E, and 4200-7E, 4200-8E, and Waveguide
Sensors are calibrated for use with a 50-ohm source;
model 4200-4C sensors are calibrated for use with a
75-ohm source. Impedance mismatch results in increased SWR, which affects measurement accuracy.
This effect can be reduced by inserting a low-SWR
attenuator (SWR less than 1.10) or a low-loss tuner
between the source and the sensor.
3-30. Temperature Effects. Specified instrument accuracies apply over an ambient temperature range of 21°C to
25'C. Operation outside this temperature range causes
some additional error. Refer to table I-1 for accuracy
versus temperature. Figure 3-3 shows typical temperature
characteristics of sensors, and Figure 3-4 shows typical
temperature characteristics of the instrument and sensors
combined.
NOTE
For best zero stability of the instrument, allow the
instrument and sensor to reach a stable temperature.
3-31. SWR Measurements. The high upper-frequency
limit and sensitivity of the instrument facilitate SWR measurements with a slotted line. SWR measurements require
only comparative, rather than absolute, measurement
values; therefore, the instrument may be used up to 20 G Hz
with a model 4200-4E sensor. The front-panel meter is
especially useful for rapid determination of maximum and
minimum power points. SWR is determined by measuring
the dB difference between a maximum and a minimum
voltage point on a slotted line and converting this difference
to SWR. An adapter, usually available from the slottedline manufacturer, is required to couple the sensor to the
slotted line. To make slotted-line SWR measurements,
proceed as follows:
a. Connect the sensor to the sliding carriage, using a
suitable adapter.
b. Ascertain that the signal source is turned off; then,
zero the instrument.
c. Turn on the signal source and slide the carriage
along the slotted line until a point of maximum indication is located. Adjust the source signal level and the
probe setting for the least coupling that yields a -41 dBm
reading at the maximum point. (The incident power
should be at least 0 dBm.)
d. Slide the carriage along the slotted line until a
minimum indication is located. Read the level at this
point. Subtract the measured level at the minimum point
from that at the maximum point, ignoring signs. Convert
the resultant a dB into SWR, either through use of the
SWR conversion chart (Figure 3-5) or by computation.
SWR is the antilog, base 10, of .1 db/ 20.
3-9
Section III
Operation
+0.2
+0.1
0 dB m* +10dBm
+20dBmo
0
-0.1
dB
-0.2
- 30 d Bm* -20dBm°
- 10 dBmo
- 0.3
-0.4
- 0.5
- 0.6
0
10
20
30
40
50
DEGREES CELSIUS
831375
* USED WITH -4 SERIES SENSORS
• USED WITH -5 SERIES SENSORS
O USED WITH -6 SERIES SENSORS
Figure 3-3 Typical Temperature Characteristics of Series 4200 Sensors
+0.2
+ 0.1
0 dB m* +10dBm°
+20dBm°
0
- 0.1
dB -0.2
- 30 d Bm* -20 dBm°
- 10 dBm °
- 0.3
- 0.4
- 0.5
-0.6
0
10
20
30
40
50
DEGREES CELSIUS
* USED WITH -4 SERIES SENSORS
• USED WITH -5 SERIES SENSORS
O USED WITH -6 SERIES SENSORS
Figure 3-4 Typical Combined Temperature Characteristics of Instrument and Sensor
3-10
831376
Section III
Operation
13
1.4
1.5
1.6
1.7
VOLTAGE STANDING WAVE RATIO
Figure 3-5 dB-SWR Conversion Chart
3-32. Shielding Recommendations. If the instrument is
subjected to strong noise fields, accurate zeroin2 may be
difficult unless the sensor is shielded during the zeroing
operation. The simplest method of shielding is to connect
the sensor to the device whose power level is to be measured, first making sure that the device is turned off: however, in some instances, the device may act as an antenna
and introduce additional noise voltage into the sensor. If
this happens, disconnect the sensor from the device, stand
the sensor, end down, on a copper plate, and hold it down
firmly so that the rim of the sensor connector makes good
contact with the copper plate at all points. Alternatively,
wrap a piece of thin copper foil around the threaded
portion of the connector body, and crimp the foil around
the open end of the connector, making certain that the
center pin of the connector is not shorted. If frequent
zeroing in strong noise fields is necessary, construct an
adapter, using a Type N connector permanently fitted with
a copper foil shield.
3-33. Analog Output. A dc voltage proportional to
either power or dBm is available at rear panel recorder
connector J20 for recorder or other applications. This
output voltage will be affected in both power and dB
*See Instruction
-
manual supplement
modes by calibration factor entries. The source resistance
of the recorder output is approximately 9000 ohms,
permitting a current of 1 mA into a load of 1000 ohms at
full scale power. Output levels for various measurement
modes are as follows:
a. In the power mode, the dc output level is
proportional to the displayed power, with 10 volts at full
scale for each rann.
* b. In the dB mode. the dc output level is proportional to
dBm according to the formula (Series 4/ 7/ KIKA/ Q
Sensors)
dBm
V OUT = (8 +
— ) volts
10
Example:
The voltage output at -20 dBm would be:
(8 +
10
volts = 6 volts
This output is a function of dBin only, but is affected by
CAL FACTOR entries.
3-11
Section III
Operation
* c. In the Channel-3 mode of operation (Option -03),
the recorder output is proportional to the difference in dB
of channel 1 minus Channel 2. This output is affected by
both the calibration factors and the dB reference levels
entered in each channel. The equation is:
RECORDER OUT (VOLTS)
for each of the following tests unless specifically directed otherwise.
3-37. Automatic Zero Function Test. To check the
automatic zeroing function of the instrument, proceed as
follows:
a. Ascertain that the signal input to the sensor is zero.
[ (dBch.1 + dB CAL FACT CHI -dB REF.ch. I )
10
L
(dBch.2 + dB CAL FACT CH2 +dB REF.ch.2) +8]
10
Or. equivalent:
RECORDER OUT (VOLTS) = dBdisplav+8
10
Valid recorder outputs will be obtained for display indications of -80 dB (0 volts) to +30 dB (11 volts).
3-34. MINIMUM PERFORMANCE
STANDARDS.
3-35. Test Equipment Required. For minimum performance testing of the instrument, an adjustable power
source, such as the Boonton Electronics Corporation
Model 25A Power Meter Calibrator, and a dc voltmeter
or oscilloscope capable of measuring 0 to +10 volts are
required.
3-36. Preliminary Setup.
NOTE
Do not confuse 0 dB with zero input. For zero
input to the sensor, turn off the adjustable
power source.
b. Press the ZERO key and ascertain that the logic
signal level at pin 3 of rear-panel connector P3 switches
from a logic low to a logic high when the ZERO key is
pressed, remains high throughout the zeroing period
(approximately 26 seconds), and returns to a logic low at
the end of the zeroing period. During zeroing, the frontpanel LED display should show the following:
Display
cccc
cc03
3-38. Autoranging Mode Test. To check the autoranging function of the instrument, set the output level of
the adjustable power source to each of the values listed
below and ascertain that the instrument LED display
readout aerees with the input power level within t0.2 dB
+10 dBm
0 dBm
-10 dBm
-20 dBm
-30 dBm
-40 dBm
-50 dBm
a. Turn on the instrument and the adjustable power
source and allow sufficient warmup time. If either unit
had been stored at ambient temperatures substantially
different from the ambient temperature at the minimum
performance test facility, make sure enough time is
allowed for each device to reach ambient temperature.
b. Set the adjustable power source output to zero, and
connect the sensor between the adjustable power source
and the front-panel SENSOR connector of the instrument, using the sensor cable.
c. Key in the following measurement parameter data
through the keyboard:
1 SELECT CHNL
N SELECT SENS ( N = number of sensor being used)
MODE dB
RANGE AUTO
dB LIMITS — any
0 CAL FACTOR dB
0 REF LEVEL dB
NOTE
Maintain the same measurement parameters
3-12
Comment
Zeroing
Zeroing complete
NOTE
For lowest ranges, rezero if necessary.
3-39. Range Hold Function Test. To check the range
hold function of the instrument, proceed as follows:
a. Set the output level of the adjustable power source
to 0 dBm.
b. Press the RANGE HOLD key and the MODE
PWR key.
c. Ascertain that the LED display readout is 1.000
mW t 1.2%.
d. Set the adjustable power source output to each of
the following levels in succession, and ascertain that the
*See Instruction-manual supplement
Section III
Operation
corresponding listed LED indications are obtained on
the instrument:
Instrument Indication
Power Source Level
cc04 (power level too high)
10 mW
1.000 mW
mW
0.100 mW
100 pLW
10 JAW
0.010 mW
or
cc03 (if less than 10 counts;
power level too low)
Power Source Level
-7 dBm
-8 dBm
-9 dBm
NOTE
If the dBm indications are within limits, it
may be assumed that power mode indications
are also within limits; dBm indications are
computed from power measurements within
the instrument.
e. Press the RANGE AUTO key.
NOTE
When the range hold function is selected,
input power levels greater than the power
decade operative when the selection was made
will result in overranging of the instrument
and display of an error indication; lower input
levels result in a decrease in the number of
significant digits in the display. Note that the
decimal point and annunciator remain fixed.
To check the
basic accuracy of the instrument, proceed as follows:
340. Basic Instrument Accuracy Test.
a. With zero input to the sensor (adjustable power
source turned off), zero the instrument by pressing the
ZERO key.
LED Display Tolerance
t 0.085 dB
t 0.09 dB
1-0.095 dB
3-41. Power Mode Test. To test operation of the instrument in the power measurement mode, proceed as follows:
a. Without disturbing any measurement parameters
used in preceding paragraph , adjust the output level
of the adjustable power source to 0 dBm and ascertain
that the LED display of the instrument indicates 0 dBm
t0.05 dB.
b. Press the MODE PWR key. The LED display
should indicate 1.00 mW t1.3%.
c. If desired, other power levels may be checked in
similar fashion. To determine the proper power indication for a specific dBm input level, use the formula:
P=
dB/10 (mW)
3 42. Calibration Test. To check the automatic calibration capability of the instrument, proceed as follows:
-
b. Connect the sensor to the POWER REF connector.
Press the CAL key.
c. Upon completion of calibration, press the MODE
dB key, and connect the sensor to the adjustable power
source.
d. Set the output level of the adjustable power source
to each of the following dBm values in succession, and
ascertain that the LED display readout agrees with the
output level of the adjustable power source within the
specified dB limits:
Power Source Level
-50 dBm
-40 dBm
-30 dBm
-20 dBm
-10 dBm
0 dBm
+10 dBm
-I dBm
-2 dBm
-3 dBm
4 dBm
-5 dBm
-6 dBm
LED Display Tolerance
t0.I dB
t0.05 dB
t0.05 dB
1:0.05 dB
t0.05 dB
t'O.05 dB
.1.0.05 dB
t0.055 dB
t 0.06 dB
1'0.065 dB
t 0.07 dB
4:0.075 dB
t 0.08 dB
a. Set the power source to I.0 mW.
b. Select the power mode and autoranging.
c. Enter a 0 dB calibration factor.
d. Note the indication of the LED display. If the indication is not 1.000 mW, press the CAL key, and ascertain
that the indication is now 1.000 mW ±2 counts (±4 counts
with 4200-5 sensors).
e. If an indication of exactly 1.000 mW is obtained
originally in step d, enter a calibration factor of 0.03 dB to
cause the indication to increase to approximately 1.01
mW. Then, press the CAL key and ascertain that the
indication changes to 1.000 mW =2 counts. Enter a 0 dB
calibration factor and press the CAL key to restore the
original indication.
f. The automatic CAL function is operative at all 10 LIB
points if a suitable signal source is available: operation is as
in steps a thru e, except for the input signal level and ranee.
N()TE
For greatest overall aCCUraCy', however, it is strongly
recommended that this feature he used with tile 50
3-13
Section III
Operation
MHz power reference which provides an accurate I
mW level.
3-43. Sensor Selection Test.
Entry of the correct
number for the sensor in use is absolutely essential for
instrument accuracy. Data for each sensor supplied with
the instrument has been entered and stored in microprocessor memory at the factory. Stored data consists of
functions peculiar to each sensor, such as sensitivity,
calibration factors, etc. A direct, absolute check of the
sensor data is not possible; however, the basic instrument
accuracy test (paragraph 3-40) and the calibration test
(paragraph 3-42 ) provide a good indication of satisfactory operation of the sensor selection function.
Entry of an incorrect sensor number will probably result
in degradation of basic accuracy. Sensor serial numbers
can be recalled from non-volatile memory by keying in a
decimal point followed by SELECT SENS.
3-44. dB Reference Level Function Test. To check the
dB reference level function of the instrument, proceed as
follows:
a. Set the output power level of the adjustable power
source to 0 dBm.
b. Press the MODE dB key and ascertain that the LED
display indicates 0 dBm ±0.05 dB.
c. Enter a -10 dB reference level by pressing the following keys:
0
CHS
REF LEVEL dB
d. Ascertain that the LED display now indicates +10
dBr ±0.05 dB. The dBm annunciator should he off, and
the dBr annunciator should be lighted.
CHS
dB LIMITS LO
d. Ascertain that the LIM annunciator is off.
e. Set the output level of the adjustable power source
to -2.0 dBm. The LIM annunciator should light. The logic
level at pin 5 of rear-panel connector P3 should be high
the logic level at pin 4 of connector P3 should be low
f. Set the output level of the adjustable power source to
+2.0 dBm. The LIM annunciator should be lighted.
logic level at pin 4 of rear-panel connector P3 should be
high; the logic level at pin 5 of the connector P3 should be
low.
NOTE
Limits can be entered only in terms of dB, not
power; however, the limit function operates in
both the dB mode and the PWR mode.
g. Set the input level to -7 dBm. Press the CLR and the
REF LEVEL dB keys: the indication should be approxi
mately -7.00 dB. Press the decimal-point and the REF
LEVEL dB keys: the display should now indicate 00.00
dBr. Recall the dB reference level by pressing the REF
LEVEL dB key; the indication should be -7.00, showing
that the original dBm level is now stored as the dB reference
level. Press the CLR and the REF LEVEL dB keys:
indication now should be -7.00 dBm, showing that the
reference level is now 0 dBm. Note that, as discussed
paragraph 3-19 (pace 3-8), this method of entering
current dBm level as the dB reference level is operative only
in the local mode—not in IEEE-488 interface mode.
3-46. Calibration Factor Test. To check operation
the calibration factor function, proceed as follows:
a. Set the output level of the adjustable power source
to 0 dBm.
e. Reset the instrument to indicate dBm by pressing
the following keys:
0
REF LEVEL dB
b. Press the MODE dB key and note the indication on
the LED display.
f. Ascertain that the LED display again indicates 0
dBm ±0.05 dB. The dBm annunciator should be lighted,
and the dBr annunciator should be off.
c. Enter a 0.2 dB calibration factor by pressing
following keys:
0
3-45. dB Limit Test. To check operation of the dB
limit circuits, proceed as follows:
CAL FACTOR dB
a. Set the output level of the adjustable power source
to 0 dBm.
d. Ascertain that the indication on the LED display
equal to the value noted in step b plus 0.2 dB.
b. Enter a + I dB high limit by pressing the following
keys:
e. Enter a 2 GHz calibration factor by pressing the
following keys:
2
CAL FACTOR GHz
f. Determine the calibration correction for 2 GHz from
the chart on the barrel of the sensor. Ascertain that the
dB LIMITS HI
c. Enter a -1 dB low limit by pressing the following
keys:
3-14
Section III
Operation
LED display indicates the value noted on the chart on the
sensor barrel.
NOTE
For proper calibration factor correction and
instrument accuracy, it is essential that the
sensor number entered into the instrument
prior to measurement agrees with the number
indicated on the barrel of the sensor used for
the measurement. Calibration factors that are
invoked are operative in both the dB mode
and the PWR mode.
NOTE
If the instrument is equipped with the -03
option, repeat the minimum performance
standards tests for channel 2.
Section IV
Theory of Operation
SECTION IV
THEORY OF OPERATION
4-1. INTRODUCTION.
4-2. 'The instrument is a general purpose RF microwattmeter capable of measuring power levels from 1 nW (-60
dBm) to I W (+30 dBm). It is designed to operate in
conjunction with Boonton Electronics Corporation Series
4200 power sensors. The usable frequency range depends
upon the sensor used with the instrument. 'The lowest
usable frequency for calibrated measurements is 0.2 MHz;
the highest frequency is 110 GHz.
4-3. The instrument is a completely solid-state unit that
employs a microprocessor for versatility in use. The
microprocessor is controlled by a permanently stored,
internal program; pertinent operating parameters can be
entered by means of a front-panel keyboard. Use of a
microprocessor enables automation of numerous functions, such as zeroing, calibration, sensor calibration,
range selection, unit conversion, dB limit testing, relative
dB measurements, etc. Measured values are displayed
directly on a 4 digit LED display in terms of nW,
mW, dBm, or dB r (relative dB). Annunciators associated
with the display indicate the unit of measurement. A
meter is also provided for relative power measurements;
this feature simplifies such operations as nulling and
peaking.
4 4. OVERALL BLOCK DIAGRAM.
-
(See Figure 4-1.)
4-5. Sensor. Power levels to be measured are applied
to an external sensor, which is connected to a front-panel
connector through a five-foot sensor cable. Input power
appears across a precision resistor (50 or 75 ohms,
depending upon the sensor model). Because the resistance
value is constant, the voltage developed across the resistor
is a function of input power (E2 = PR). The RF voltage
developed across the resistor is converted to a DC
voltage, and the resulting DC voltage is applied to the
input module of the instrument.
4-6. Input Module. The input module receives the DC
voltage developed by the sensor. Operating under control
of the control module, the input module converts the DC
signal to an AC signal, amplifies the AC signal, converts
the amplified AC signal to an analog DC signal, and
converts the analog DC signal to a digital signal. I f the
autoranging function of the instrument is being used, the
gain of the amplifiers in the input module is adjusted
automatically by the control module to accommodate
any power level within the range of the instrument. The
digital output signal of the input module is supplied to the
control module for further processing; an analog DC
output signal is developed from the digital signal and
applied to the analog meter on the display module for
relative power measurements, and to a rear-panel
connector for application to a peripheral recorder.
4-7. Control Module. The control module consists
primarily of a pre-programmed microprocessor. The
microprocessor accepts and stores measurement parameter commands entered through the front-panel keyboard, and controls operation of the internal circuits of
the instrument in accordance with its program and keyedin commands. The microprocessor performs measurement value corrections based on stored zero corrections
and stored or keyed-in sensor calibration factors, unit
conversions based on selected measurement modes, and
dB limit determination. The microprocessor also performs automatic instrument zeroing and calibration. The
processed digital signal, which defines the final measurement value, is applied to a data bus and to the display
module.
4-8. Display Module. The display module contains
the keyboard and LED display circuits. Parameters to be
used for power measurements can be entered at any time
through the keyboard. Keyed-in values are read and
stored by the microprocessor, and selected numerical
values are shown on the LED display during parameter
selection. Computed power levels are processed by the
microprocessor in accordance with the keyed-in parameters; the digital values representing the final computed
measurement values are decoded by the display module
circuits to produce a direct LED readout of measured
values and to activate the appropriate annunciators.
4-9. Power Reference. The power reference module
generates a precision, 1.00 mW, 50 MHz signal that is
used for calibration of the instrument. When this signal is
applied to the sensor and the front-panel CAL key is
pressed, fine sensitivity adjustments of the instrument are
performed automatically under microprocessor control.
4-10. Power Supply Module. The power supply
module provides all DC voltages required for operation
of the internal circuits. It also provides a reset signal to the
control module when it is powered up, and an interrupt
signal if an undervoltage condition is detected. The
standard power supply module can be powered from a
100, 120, 220, or 240 volt, 50 to 400 Hz, AC power source.
4-11. Optional Modules. Standard options are available
to further increase the versatility of the instrument. Two of
these optional modules are shown in Figure 4-1.
4-1
Section IV
Theory of Operation
RF MICROWATTMETER
INPUT
RF
POWER
SERIES 4200
SENSOR
-› >-.-
INPUT
MODULE
(CHNL I)
DC
ANALOG
SIGNAL
KEY
COMMANDS
AND
DISPLAY
DATA
CONTROL
MODULE
•
•
INPUT
RF
POWER
SERIES 4200
SENSOR
DATA BUS
•
A DDRESS BUS
CONTROL BUS
r._
RESET
AND •
INTERRUPT
I--1
INPuT
>---I MODULE I
(CHNL 211
DISPLAY
MODULE
I INTERFACE
MODULE
IEEE 488
BUS
+5V +I5V
Ift
-5V 1 -I5V
100,120,220, OR
240V, 50-400 Hz
AC LINE
1 mW,50 MHz
OUTPUT
POWER
SUPPLY
MODULE
POWER
REFERENCE
MODULE
NOTE:
GASHED LINES
INDICATE OPTIONAL
MODULES
Figure 4-I Overall Block Diagram
a. A second input module can be added to the
instrument to permit measurement of output power levels
of two devices without the need for repeated switching of
sensor connections. The input connector for this optional
module is located on the rear panel of the instrument. The
second input module also permits LED display of the
difference between the power levels of the two devices,
expressed in dB.
b. The interface module provides an IEEE 488 bus
interface for remote control of instrument operation and
for remote display of measured values.
4-12. DETAILED THEORY OF OPERATION,
SENSOR CIRCUITS.
(See Figure 4-2.)
The sensor contains two paralleled precision resistors (50-ohm effective total resistance for Models 4200-4A,
4200-4B, 4200-4E, 4200-5B, 4200-5E, and 4200-6E, and
75-ohm effective total resistance for Model 4200-4C) across
which the input power is applied. With a constant load
resistance, the RF voltage developed across the load resistance is a function of the RF power (E 2=PR). The RF
voltage is rectified by a full-wave rectifier that permits measurement of highly asymmetrical waveforms without sub-
4-13.
4- 2
stantial error. When the applied power level is within the
square-law region of the diodes (up to approximately 20
AW), the sensor has a true R MS response. Above this power
level, the sensor response approaches peak-to-peak, calibrated in the instrument in terms of true average power.
NOTE
Series 4200-5 and 4200-6 sensors have input attenuators; this permits measurements to 100 mW (+20 dB)
and 1000 mW (+30 dB) respectively.
4-14.
The body of the sensor has been designed and
fabricated very carefully to eliminate any cavity
resonance effects within the calibrated frequency range
and to minimize noise. The sensor diodes are specially
selected for this application. The DC output voltage of
the sensor is applied to the input connector of the
instrument through a low-noise sensor cable.
4-15. DETAILED THEORY OF OPERATION,
INPUT P.C. BOARD CIRCUITS.
(See Figure 4-3).
4-16. The input printed circuit board receives from the
sensor a DC voltage that is a function of the power level
being measured. Under control of the control board
Section IV
Theory of Operation
circuits, it provides amplification and signal processing
required to develop an analog DC voltage and a digital
signal that are proportional to the input RF power level.
The input DC signal from the sensor is balanced in form
and may vary from microvolts to volts, depending upon
the input power level. The input printed circuit board
must provide amplification with a wide range of gain,
low offset voltage, and low noise; therefore, the input DC
signal is converted to an AC signal which is amplified, and
the amplified AC signal is converted to a DC analog
signal and to a digital signal.
4-17. The input DC signal is converted to an AC signal
by a chopper module, which plugs into the input printed
circuit board. The chopper is composed of solid-state
switches IC I a, IC1b, IC1c, and 'Cid in a balanced
arrangement, operating at a frequency of approximately
94 Hz to minimize AC line and line-related component
interaction. The chopper drive signal is derived from the
output of an astable multivibrator, which is completely
independent of line frequency. The use of a solid-state
chopper eliminates many of the problems, such as contact
wear and contamination, associated with electromechanical choppers. The chopper supplies a balanced AC
signal of approximately 94 Hz to the input amplifier.
4-18. The 94 Hz drive signal for the chopper is derived
from the output signal of astable multivibrator IC5.
Multivibrator IC5 drives flip-flops IC7a and IC7b, and
these flip-flops supply the-drive signal to the chopper
circuits. Flip-flop IC7a also drives flip-flops IC8a and
IC8b, which provide a94 Hz, synchronized drive signal to
the demodulator circuits that convert the amplified AC
signal back to a DC signal.
/ R101
100
C101
750pF
INPUT
RF
•
- 14
-*C R 101
NA",
R103
160
4 19. Amplification of the balanced AC signal from the
chopper is accomplished in an input amplifier composed
of low-noise, operational amplifiers A5, A6, and A7. A
balanced arrangement with degenerative feedback for
stabilization and gain control is employed. The input AC
signal is amplified by 500, 50, 5, or 0.5, depending upon
the instrument range. Demultiplexer IC6, under control
of the control printed circuit board, adjusts the degenerative feedback in accordance with the range selected by the
microprocessor to provide the required gain switching.
An attenuator at the output of the input amplifier provides
attenuation of 2 for the highest range only; on all other
ranges its attenuator is zero. This attenuator is switched
into the circuit on the highest range through solid-state
switches IC I Oa, lC9h, and IC9c. Demultiplexer IC13
decodes digital signals that define the range from the microprocessor and activates the solid-state switches on the
highest instrument range.
-
4-20. The amplified 94 Hz signal is converted to a DC
analog signal by means of a demodulator circuit that
operates in synchronism with the chopper. The demodulator consists essentially of a sample and hold
switch, composed of solid-state switches IC I Ob and IC 10c
and associated circuitry. Switches ICIOb and IC10c are
controlled by the 94 Hz drive signals from flip-flops 1C8a
and IC8b. The sampling point and period of the sample
and hold circuit has been chosen to minimize switching
products and noise, and to vary signal averaging in
accordance with the signal level. Switch IC9a adjusts
operating parameters automatically in accordance with
instrument range; the switch is activated through gates
ICI I b and ICI lc and demultiplexer IC13 on the four
highest ranges.
C102
I.5n F
220
DC TO
INSTRUMENT
I
POWER
R102
100
L
R10 4
10
6
-101---^"A
* CR102
C103
1.5n F
R106
220
vent--
NOTE:
* INDICATES FACTORY SELECTED COMPONENTS.
When making your own probe, you may use Zero Bias Schottky
Detector Diodes, such as the HP HSMS-2852 or HP HSCH-9161
Figure 4-2 Typical Series 4200 Sensor. Schematic Diagram
4-3
Section IV
Theory of Operation
4-21. The DC output voltage of the sample and hold
circuit is amplified by an amplifier circuit composed of
integrated circuits A8, A9, and IC14, and associated
circuitry. Integrated circuits IC14 is a demultiplexer
which decodes microprocessor-supplied digital signals
that define the selected range and adjusts an attenuator
circuit accordingly; the gain of the amplifier is 125, 12.5,
or 1.25, depending upon the selected range. The full-scale
output voltage of the amplifier is 2.25 volts nominal on
each range.
4-22. The DC output voltage of integrated circuit A9 is
usually unipolar and positive; however, during the
automatic zeroing process of the instrument, the DC
output voltage may be positive or negative, depending
upon small DC offsets. Because some of the following
circuits operate only with unipolar signals, a polarity
switch is required. This polarity switch, which consists of
solid-state switches IC3b and lC3c, operates under
control of the microprocessor on the control printed
circuit board, which tests for polarity. The DC voltage is
routed through the polarity switch to the appropriate
input of operational amplifier A3 so that the output DC
from this amplifier is always negative. This output voltage
is applied to a comparator circuit.
4-23. Comparator A2 operates in conjunction with the
microprocessor on the control printed circuit board and
D/A converter IC2 to convert the DC output signal of
amplifier A3, which is proportional to the input power, to
a digital signal that can be processed by the microprocessor circuits. D/A converter IC2 is supplied with
successive half-level digital signals (full scale/ 2, full
scale/ 4, etc.) by the microprocessor. D/A converter IC2
converts these digital signals to a DC analog voltage, and
this analog DC voltage is applied through amplifier Al to
comparator A2, where it is compared with the DC signal
from amplifier A3. The difference signal from comparator A2 is supplied to the microprocessor through interface
ICI so that the microprocessor can monitor the results of
the comparison and adjust the digital signal accordingly.
The digital signal is adjusted by the microprocessor until
the two input signals to comparator A2 are equal. The
resulting digital signal then defines the input DC level
being measured. This digital signal is then processed (zero
correction, calibration correction, unit conversion, etc.)
by the microprocessor before application to the LED
display circuits of the instrument.
4-24. After the digital signal has been fully processed by
the microprocessor, the prota.ssi.d digital signal is again
supplied by the microprocessor to D/A converter IC2,
which converts the processed digital signal to a corresponding DC analog voltage that is used to drive the
front-panel meter and the recorder output of the
instrument. This DC analog voltage from D/ A converter
4-4
1C2 is supplied through amplifier Al to sample and hold
switch 1C3a, which is closed at this time by a control
signal from the microprocessor. The DC analog voltage
at the output of the sample and hold circuit is applied
through amplifier A4 and the control printed circuit
board to the display printed circuit board.
4-25. All interfacing between the input printed circuit
board and the microprocessor is accomplished through
interface ICI. Interface ICI is an input/ output device that
operates under control of the microprocessor. When signal
RD is activated by the microprocessor, data are transferred from the input printed circuit board to the microprocessor, provided that signal CS to interface ICI is also
active; when signals WR and CS are both activated by the
microprocessor, data are transferred from the microprocessor to the input printed circuit board. Data flow between
the input printed circuit board and the microprocessor over
the eight-line bi-directional data bus. Routing of data
through the interface is controlled by the address signals
supplied to the interface by the microprocessor.
4-26. DETAILED THEORY OF OPERATION,
CONTROL P.C. BOARD.
(See Figure 4-4.)
4-27. The operation of the instrument is controlled by a
microprocessor contained on the control printed circuit
board. The control printed circuit board is organized
around a central processing unit (CPU), associated
memories, input/ output ports, and a 40-line bus. A stored
program, in conjunction with key-entered commands,
enables the microprocessor to perform a variety of
functions, including the following:
a. Analog to digital conversion
b. Zero determination
c. Zero correction
d. Ranging
e. Calibration
f. Signal processing
g. Binary to BCD conversion
h. dB conversion
i. dB reference conversion
j. dB limit testing
k. Diagnostics.
4-23. Integrated circuit 1C3 is the microprocessor CPU. It
is an 8-bit unit that operates at a clock frequency of 2 MHz,
generated by integrated circuits IC la through [Cie and
associated circuitry. The operating program for the microprocessor is stored in integrated circuits 106 and IC7,
which are programmable read-only memories (PROMs).
RAM IC8 provides temporary storage of data during
operation of the instrument. It also stores certain measurement parameters such as, sensor data, calibration fac-
Section IV
Theory of Operation
TP8
I
I)
CHOPPER
P. C.
BOARD
IC1b,
ICId
INPUT DC
FROM
PROEM
AC AMPL
45,46,47
DEMODULATOR
.I01013,1010c
R34
RI6
DC
AMPL
AS, A9
POLARITY
SWITCH
IC3b, IC3c
AMPL A3
C8
I
RANGING
AT TENuATOR
TP4
TP3
0—•
R35
3)
I
TPI5
0
TP9
0
TP7
0
TP5
0
IJI
TP6
• -0
ATTENUATOR
T
COMPA RATOR A2
C22
R4 E
86/
R43 C241
-
SWITCH
OEMULTIPLEXER
IC 6
A
TP2
O
13
0
II
,
CLK
B
10
0
5 0
4,—
9
B2
BO
F-F
IC 7a
2 CLK
0
•
5
SWITCH
IC9a
/ PI
2 <1
■
3 (-1
4<
5 (:
6 (I
7 (
8
9<
<
,
36 \
37 (
2 .
39 (21.
I CIIe
4
j: 17 )1
34
18
so
DI
33
19
8/ \
02
32
20
B2
03
31
22
84 \
04
30
23
85
05
29
24
86 \
06
28
25
57 \
07
27
DO
Al
R
36
TPI3
RO
IS
CS 6
--
F- F
IC84
P
23
22
21
37
CO
A7
20
38
A6
19
39
A5
Aa
17
A3
16
2
42
15
3
A
4
4
AO
13
5
4 5 6
OEMULTI FLEX ER
IC13
C
B
4J-- ■ CLK
0
TPIZ
4
V
8
24
40
R30
F -F
SCSI
R26
2
CLK
C3
4
_5V
L
C2
CI
17
INTERFACE 16
ICI
15
AO
12
C18
- 5V
<I
IC11 0
cia
O
TP10
TO
CONTROL P. C.
BOARD
R II
OEMULT PLEXER
IC14
IC 9e
C
V
5V
By 81/ 82/
0
F -F
IC 7b
ASTABLE
MULTIVIBRATOR
IC5
P/O
INTERFACE
ICI
RANGING
ATTENUATOR
L
RI7
C4 13
0
12
BO
10
9
81
82
/
101
- 5V
C2
6
4
TP14
0
TPi6
• --0
87
ANALOG DC
0/A
CONVERTER
IC2
9
AMPL
AI
SAMPLE AND
HOLD
IC3a
AMPL
A4
P1-40 TO DISPLAY
P C. BOARD
VIA CONTROL
P C BOARD
10
C831450A
Figure 4 -3 Input P.C. Board, Detailed
Block Diagram
4-5 / 4-6
Section IV
Theory of Operation
81- DIRECTION•L DA,T• BUS
J.
RESIST.VE
NETWORK
IC2
a
8\
<
8\
/6
a
DATA SUS
• OOPESS BUS
P/O P. \
TP2
•0
,zn=
00/
14
.5
08/
\01
.0
02/
8
7
03/
04,/
9
80
\o z
\92
\03
.3
\03
i3
\ 02
ns 03
\
14
\ 04
14
\
05/
\05
.5
\05
.5
• ,05
06/
\pis
.6
\06
16
• . OS
\or a
\07
a
32
•2
33
•3
34
••\
35
A5 \
36
3?
•6\
A7 \
AEI
6
5
/• 3
5
/110
/••
/„
/••
/.6
/.
AAA
411
Al. \v/
3
/
2
/•9
22
0
T•3
vra
NREC1
J5 1,5
---<<
7P1?
NarkE0
P.-34
.5
•3
1.1
•
V
IC.5e
\ •5
>
> .S
\ •6
<
\ •7
\ •.3
\ 1,9
\ ••3
5
CS • N 0
CS•••
I
TO
- 80.00
rc"
> .6
; > .7
, >
.a
;>
7-> 39
> 24
CS.F
T•2
6
-•
-> 38
•
36
•
PC
.5
PC.
•5 J5
C94
.13
3v
17
5 LON Litoor
> 36
• .614
7 3 IMPuT DISCONNECT
C3.F
9
P80., >
• 81
IC9b
".1
CRI
R6
20
iNTERF•CE
IC16
3
Cr•RENT
SOuPCE
12
QI
IC94
IC.S•
-•
• I5v
•82
3
.5v
•S•
2
24
•85
Ps
25
PEIT
>2
>3
*
5
>8
>
›.,
9
RFSw
2
•
22A
••0
PC4
I3
•
••2
2
PAS/
40
T6
i6
a
PA. /
3
I Cl5e
s.8TIvE
NETIvoria
IC.7
39 •45
20 !ORO
22
26
>9
; > .0
, > 11
> 12
> .3
•5
20 I NS 24
IC.•
RESET
••• I
2
r
>8
\
TP15
OL
2
\
\ •z
2
2ef2:
•cc
80 1
I >6
\ .0
„
3
>3
> •
9
or
00.RO
133
SL2
10
22
ST1
.3
\ - __\ \
\ 06
TO
INSPL•T
- • c
<
SU ;
• CZ
• 5
24 *Al T
TILS ; <,0
82
2
1
17...P_C25TP.3_c_4 6.5
0
TP10
0
6
28
I CI Sa
DECODER
IC•
t:8 4aFmS'or.N
\
\ 05
33
3
•
NREQ 4 \
.3
\ 0.
RL3
5
TIL • f_<
30IT•13 8. , <
>
\ 03
32 re LO
4 \
27 At
IPPCO
INTERFACE
IC•13
28
\
• OOPESS OuS
P•
IC
■ 13
( 3
2
31
tl
ROY.
•
•Z
••
E
-
.8,--071•19
8
1
CE
0 T•7
aFs•
ir
111L.
PL2 <
CS .0 RP
• 10
5 \
TP1
\Ds
\oe
T P4
C
3
22
•
.4
15
86
2
/A9
18.__120
.5
45
/.49 22
.2
39
\ 02
\ 03
\
23 VPIE. 80 , < 5
23
•13
• 14\
\ 02
05L3 35
4
/•7
/
/Alt
\ 138
„rya reLCI <
AO
5
23
19
21
27: AO OuT (095
.3
29
IC8
/A
/••
/Ap5
.2
\ 01
••••
23
/•11
• 12
3
/4 1
/Az
/••
R9
•8
A9\/ 49
• .0
39
40
/,,
RESIST ■ vE
NE TRONA
IC•3
15
PROra
IC7
6
IC6
AC1-•7
13
\ oo
j2
\ 00
\ 07
1. 1.10 1•
/Al
8
.0
.
CPU
IC3
0
TP9
\ 01
1
07/
2 te•r
OSCiLLAT0R
IC•T, IC14.
ICic
me I Am
.22
8 ...kis /
7.1i
/TriTTi Nan
.15
37
LO 8AT
RE S E
18 ••LT
./0
3.
\ \
;117 •■ 3
••T
•./
V so7
P/0 Po ‘r,
28 30 20 Z. 22 23 25 33 3. 26 27 29 35
s.e
3
TP5
5
•
P•7
5.2v
1171
• I5N.
Pt
32
To INPuT
P C 210•110
•
831451E3
TO ■ N•uT P C 80A PO
FrioN POI•ER SuPPLT • C BOA•D
Figure 4-4 Control P.C. Board,
Detailed Block Diagram
4-7/ 4-8
Section IV
Theory of Operation
tors, some key-entered parameters, etc. Lithium-type battery BT I, which has an anticipated life of 10 years, supplies
power to RAM IC8 during power-down of the instrument
to enable retention of data in memory. During normal
operation, RAM IC8 is powered by transistor Q I . Integrated circuit 1C16 is an 1/O port which interfaces with
the following:
a. An 8-bit switch used to set the mode of operation.
number of channels, and number of sensors.
enabled, keyed-in commands from the display printed circuit board, which had been stored in integrated circuit
IC 18, are transmitted over the data bus. If integrated circuit
1C16 is enabled, input data from bit switch S i or power
supply connector P4, as determined by address bits AO and
Al, are supplied through interface IC16 to the data bus. If
interface ICI on the input printed circuit board is enabled,
data generated on the input printed circuit board are
transmitted over the data bus through interface ICI.
4-31.
b. A test socket (J3) used in signature analysis.
c. A plug (P3) for output of status information.
4-29. The CPU receives and transmits data over an eightline data bus. A 15-line address bus is used for addressing,
and a control bus is used for various control functions.
When the instrument is turned off, signal RESET is activated by the power supply circuits and the microprocessor
is reset to the start of the operating program; when the
instrument is next turned on and DC voltages have reached
the correct operating levels, the RESET signal is deactivated by the power supply circuits and the microprocessor
begins to execute the stored program. Instructions are
retrieved from storage by the CPU in accordance with
the address code developed at its output. Decoder IC4
enables the appropriate PROM (106 or IC7), and the
instruction contained in the memory location defined by
the address on address lines AO through A II is read and
transmitted by the CPU over the data bus. The CPU then
executes this instruction.
4-30. During the measurement process, the CPU must
retrieve data from storage and from the input and display
printed circuit boards, it must store temporary calculaton
values, and it must output data to the input and display
printed circuit boards. To retrieve data from memory, the
storage device and data location are defined by the address
supplied by the CPU, and signals MREQ and RD are
activated. Integrated circuit IC4 decodes three of the
address bits to activate signal CS at RAM IC8 through
gates IC9a and lC9c. Signal OE at RAM IC8 is activated
through gate IC 15d, and data stored at the location specified by the remaining address bits are transmitted over the
data bus to the CPU or to other circuits connected to the
data bus. To access data developed by circuits outside the
control printed circuit board, the CPU activates signals
IORQ and RD along with the appropriate address lines.
Decoder IC14 decodes three address bits to develop enabling signal CS for interface IC 16, integrated circuit 1C18,
or interface ICI on the input printed circuit board, as
specified by the three address bits, and gate ICI 5b activates
signal R D for the read function. If integrated circuit 1C18 is
To store data, the CPU activates signal WR and the
address lines that define the storage device and storage
location. Decoder IC4 decodes three address bits to enable
signal CS at RAM IC8, signal WR enables the write function of RAM IC8 through inverter ICId and gate IC9b,
and data on the data bus are written into memory at the
location defined by the remaining address lines. To output
data to circuits outside the control printed circuit board,
signal IORQ is activated by the CPU in addition to the
previously mentioned signals. Signals IORQ and WR activate the write enable signal to the device defined by the
address bits. Decoder IC14 decodes three address bits to
select the appropriate device (interface 1C16, interface
IC18, or interface ICI on the input printed circuit board).
Data on the data bus are then transferred to the selected
device. If interface IC16 is selected, these data are transferred through interface IC16 to connector P3 or J3, as
determined by address bits AO and A I. The output to
connector P3 consists of dB out-of-limit signals and an
input disconnect signal which is active when the automatic
zeroing function is selected. The output data at connector
J3 are used in signature analysis checks. If interface IC18 is
selected, the data on the data bus are written into storage in
interface 1C18 for application to the display printed circuit
board. These data are then clocked out of storage to activate the LED display and annunciators on the display
printed circuit board. If interface ICI on the input printed
circuit board is selected, data on the data bus are transferred through the interface to control various functions on
the input printed circuit board.
4-32.
Connector J I is included in the data bus on the
control printed circuit board to facilitate signature
analysis maintenance of the microprocessor circuits.
When connector J I is pulled out, the data bus is
disconnected from the CPU, and the CPU executes
successive NOPs for free-running signature analysis
checks.
4-33. The CPU receives two control signals directly
from the power supply printed circuit board. If the power
supply voltage should drop during operation, or on
equipment turn-off, signal RINE is activated by the power
supply circuits; the CPU, upon receipt of this signal
4-9
Section IV
Theory of Operation
activates signal HALF, and halts further execution of the
program. Signal HALT is applied to the power supply
printed circuit board, where it latches signal RESET to
the active state. Signal RESET, in turn, causes the
microprocessor to return to the starting point of the
program. When the power supply rises to a level
approximately 150 millivolts below its nominal value,
either as a result of correction of the undervoltage
condition or of power turn-on, signal RESET is
deactivated to permit execution of the stored program by
the microprocessor.
4-34. DETAILED THEORY OF OPERATION,
DISPLAY P.C. BOARD.
(See Figure 4-5.)
4-35. The display printed circuit board contains the
instrument LED display, meter, annunciators, keyboard,
and control circuits for these items. It interfaces directly
with the control printed circuit board. When any keyboard
key is pressed, the microprocessor on the control printed
circuit board interrupts the normal measurement process
and accepts and stores the key-entered commands; the
microprocessor also supplies digital data to the display
printed circuit board to cause keyed-in numerical values to
appear on the LED display; the microprocessor resumes
the normal measurement process when any of the terminator keys (dB LIMITS, CAL FACTOR, SELECT, REF
LEVEL dB) is pressed. Upon completion of the measurement by the microprocessor, measurement values are supplied to the display printed circuit board.
4-36. Operation of the display printed circuit board is
controlled by the microprocessor through integrated
circuit 1C18 on the control printed circuit board, which
provides the following functions:
a. It provides a RAM for storage of microprocessor
output data to the display printed circuit board.
b. It provides a first-in, first-out RAM which accepts
and stores input information (up to 8 key commands)
from the display printed circuit board.
c. It provides scan signals for both the LED display
and the keyboard.
4-37. The LED display consists of four 7-segment
displays, which provide a display capacity of four digits
with decimal points, and a fifth display which is capable
of displaying a minus sign. Each display consists of
individual anodes for each segment that makes up the
display and the decimal point, and a common cathode.
The character that appears on the display is determined
by the activated anodes at the time that the common
cathode is scanned. The individual displays and the
associated annunciators are scanned in sequence. The
display duty cycle is 12.5%; that is, each digit or
annunciator of the instrument is on 12.5% of the time.
4-38. Digital information for the LED display and annunciators is developed by the microprocessor, and is stored in
the output RAM contained in integrated circuit IC18 on
the control printed circuit board. Digital information that
defines display and annunciator row selection is supplied to
8-channel demultiplexer IC2. The output lines of demultiplexer 1C2 are activated in sequence, based on the input
digital codes. The signal on the active output line of demultiplexer 1C2 is applied through resistive network 105 to
display driver 1C7, and the display driver supplies driving
power for the corresponding display and the corresponding
row of annunciators. At the same time, digital data that
define the display segments and the annunciators that are
to be activated are supplied to decoder ICI. The binarycoded input is decoded by decode IC I, and the output lines
of the decoder are activated in accordance with this decode.
The outputs of the decoder activate the individual anodes
of the selected display and the individual annunciators in
the active annunciator row, thereby providing the appropriate instrument display. A decimal point signal is applied
through transistor Q I, when appropriate, to cause a
decimal point to be displayed to the right of the character
on the active display.
4-39. Demultiplexer 1C2 also provides scanning signals
to the keyboard. As each of its first five output lines is
activated in sequence, a scan signal is applied to an
individual row of the keyboard through an inverter. If
any key in the row being scanned is pressed, a signal is
supplied to one of the column output lines to the RAM in
integrated circuit IC19 on the control printed circuit
board, and the key command is stored by the RAM. Key
selection is defined by a combination of the row scan
signal and the column output line. The RAM can store up
to a maximum of eight key commands, and it delivers this
stored information to the microprocessor when it is read.
Actuation of more than eight key commands without a
read causes the RAM to be cleared.
4-40. Analog DC voltage, which is proportional to the
measured power level, is supplied from the control
printed circuit board to drive the front panel meter to
provide a relative indication of measured power for peaking and nulling applications. This also supplies a DC
analog voltage to rear-panel connector P I. This signal can
be used to drive an external recorder.
4-41. DETAILED THEORY OF OPERATION,
POWER REFERENCE P.C. BOARD.
(See Figure 4-6.)
Section IV
Theory of Operation
PI-17
R4
DC ANALOG VOLTAGE
TO RECORDER
LED DISPLAY
MI
R5
DC ANALOG
SIGNAL FROM
INPUT P. C
BOARD VIA
CONTROL
P.0 BOARD
ICII
I
ICIO
3
IC8
2
IC9
4
ICS
AN
16
ANNUNCIATORS
COLUMNS
8
8 \
IC4-5
13
12
BO 7 DECODER 12
13
4
14
3
16
10
2
RESISTIVE
NETWORK I
IC4
7
/
II
6
/
P/0 JI
/
2 ) .
8 )
7
3
ICI
I al
i
8
1
>_LE122
c
I
>4836 D
■
b
II
c
0 1
d
e9
} IS
14
BO 5
9
5,--,--- R8
\ IC4- 4
IC4-3
2
3
4
[lbw I
ILSNI
CHI1
I d8MI
CR1
CR2
CR3
CR4
kiwi
IATNI
ICH3I
CR9
CR10
CRII
IOW
[REM[
CR6
ICH2I
CR7
CR5
I
L1m I
CR8
I
ROW 2
ROW 3
A
♦ I C4 -I
8
dBr .I
CR12
ROW
IT LK I
ROW 4
CR13
FROM
/C18
ON
CONTROL
P. C.
BOARD
DECIMAL
POINT DRIVER
AO
15
O1
0
6 )
4 )
)
SO
SI
S2
13
DEMUX
15
A IC2 2
12
10
3
8
1
4
9
5
C
5
2
6
4
7
II
■
14
•
•
•
4
12
II
6
10
3
7
6
13 RESISTIVE 4
9 NETWORK 8
IC5
14
3
8
13
16
15
12
15
17
16
4
II
DISPLAY
DRIVER
ICT
7
10
I MODE PWR I
12
IC3o
5
5
SI
MODE d8
IC3b
14
5
[LIMITS d8 LO
S1 1
RANGE HOLD
I LIMITS d8 HI
CAL FACTOR dBI
IS ENS / • SiN I
dB /•sEl
519
S23
CAI FACTOR GHZI
!SELECT CHNL
I CL R /L C L-
SIB
520
SI5
53
S8
SI 3
SIT
S2I
El
a
S4
59
514
SIB
S22
526
10
fl
ci
I
I
S24
$12
CHS
IC3d
AUTO
S6
S7
S2
IC3c
I
RANGE
0
525
P/0 JI
IC3e
I CAL I
55
I ZERO
S 10
R5
R4
R3
R2
\.10
( 9
KEY COMMANDS
( II . TO IC19 ON
(12 CONTROL
P.C. BOARD
RI
( 13
RO
C 831465 A
14
Figure 4-5 Display P.C. Board, Detailed
Block Diagram
4-11/4-12
Section IV
Theory of Operation
4-42. The circuits on the calibrator printed circuit board
are used to develop a 1 mW reference power level with a
50-ohm source resistance. This reference level can be used
for automatic calibration of the instrument.
4-43. The reference signal is generated by transistor
oscillator Q I, which operates at a frequency of approximately 50 MHz. An automatic leveling circuit is used to
maintain a constant reference power level. Leveling is
achieved by rectifying the oscillator output signal in the
signal level detector circuit, and comparing the resulting
DC voltage with a stable DC voltage developed by
voltage reference ICI. The difference voltage is amplified
by operational amplifier A l, and the output level from the
operational amplifier controls a varactor in a capacitive
divider that determines the drive to the oscillator. The
output of the operational amplifier adjusts the varactor
effective capacitance as required to adjust the drive to the
oscillator in the direction and amount required to
maintain a constant output level. A second capacitive
divider at the output of the oscillator divides the oscillator
output signal and tends to provide some isolation from
the load. Because the source impedance of this divider is
low, a 50-ohm series resistor is used to establish the
desired 50-ohm source resistance. The output reference
power level signal is available at the front-panel POWER
REF connector.
4-44. DETAILED THEORY OF OPERATION,
POWER SUPPLY P.C. BOARD.
(See Figure 4-7.)
4-45. The power supply printed circuit board performs
the following functions:
a. Converts 100, 120, 220, or 240 volt 50 to 400 Hz, ac
line power to -5, +5, +5.2, +15, and -15 volts dc for system
operation.
b. Generates a power-up signal for the microprocessor
when supply voltages reach the proper values for system
operation.
4-46. Input ac line power is supplied to the primary of
power transformer T1 on the main chassis through fuse F 1 ,
line switch Si, and a line voltage selector switch.
4-47. Power transformer TI steps down the ac line voltage to two secondary windings. These voltages are rectified by bridge rectifiers CR1 and CR2. The dc voltage
supplied by CR I is filtered by Cl and C2 and drives regulators IC2 and IC3 which develop +15 and -15 volts, respectively. The regulated -15 volt supply also drives regulator
IC5 to develop the -5 volt supply.
4-48. The dc voltage developed from CR2 is filtered by
C3 and drives regulator IC4 to produce +5.2 volts. R5
provides adjustment for the +5.2 volt supply.
4-49. The unregulated +15 volt supply also drives regulator IC1 to produce +5 volts to power A 1, IC6, and generate
a voltage reference at the junction of R7 and R8.
4-50. The output voltage of the +5.2-volt regulated DC
supply is monitored by comparator Ala to develop a
power-up signal on turn-on and an interrupt signal under
undervoltage or power-down conditions. When the
instrument is turned on, comparator Ala develops a
positive output pulse when the output of the +5.2-volt
regulated supply rises to a value approximately 150 mV
below the nominal output voltage; the exact power-up
signal point is adjustable by means of potentiometer R11.
The positive output pulse of comparator Ala clocks flipflop IC6 to deactivate signal RESET to the microprocessor on the control printed circuit board. If the
output voltage of the +5.2-volt regulated supply should
drop below the reliable usable level during operation of
the instrument and during instrument shut-down comparator Ala switches its output level to a logic low, thereby
activating signal NMI to the microprocessor. The
microprocessor activates signal HALT, which resets flipflop IC6, thereby latching signal RESET low to ensure
resetting of the microprocessor to the start of the program.
c. Activates an interrupt signal to the microprocessor
when supply voltages drop to levels too low for reliable
operation.
1
SIGNAL
LEVEL
DETECTOR
CR2
•■•••■■
-I5V
VOLTAGE
REFERENCE
ICI
OP
AMPL
A
CAPACITIVE
DIVIDER
C4 ,CR3
50 MHz
OSCILLATOR
01
CAPACITIVE
DIVIDER
C9,C10
RI5
5011
J2
POWER
REF
Figure 4-6 Power Reference P.C. Board, Detailed Block Diagram
4-13 / 14
Section IV
Theory of Operation
T
2
VOLTAGE
REGULATOR
ICI
•
T
+5V
IR7
V REF
C4
+15V
CR3
jo
I LINES
CI n
-< 5
SI
P
R2
BRIDGE
RECTIFIER
CR I
—‹ 4
3<
_E4 1
C5
>
GN D
R3
C2
VOLTAGE
REGULATOR
IC3
R4
T
1
7
VOLTAGE
REGULATOR
IC5
CR5
:
BRIDGE
RECTIFIER
CR2
-1.-
•
C3
)
P8
-5V
P7
- 5V
>1 3
P5 1
> 6
0
TP3
TP6
P7\
•
+5.2V
VOLTAGE
REGULATOR
IC4
C9
RIT
CR6
2
I
4
CR4
MAIN FRAME
GND
-->
135 4
8
›, 4
"..
4 -15V
-15V
RI4
/ I -
„_22.4
_ PIO „
RI6
POWER
TRANSFORMER
TI
♦
1
•
TP5
C6
+I5V
8>5
•
RI
P1(10)
>5
0—
)1.-> 5
TP4
VOLTAGE
REGULATOR
IC 2
P5
TPI
R8
e
P8
P
6
>6
+5.2V
/ 6
R5
6 ,,.
C7
P4 I
>3
R6
V REF
+5V
P4
RIO
Ala
14
1
>5
NMI
RESET
TO
MICROPROCESSOR
F-F
IC6
RII
TP2
R12
4
>4
HALT
Alb
POWER SUPPLY P.C. BOARD A7
••■■=1.NIMO
C 83 1 4 53 A
Figure 4-7 Power Supply P.C. Board,
Detailed Block Diagram
4-15.4-16
Section V
Maintenance
SECTION V
MAINTENANCE
5 1. INTRODUCTION
-
5 2. This section contains maintenance instructions for
the instrument. Included are a list of required test
equipment, trouble localization procedures, instrument
adjustment and sensor calibration procedures. Minimum
performance checks are included in Section III; these
checks should be performed whenever there is any doubt
about instrument performance.
and necessary, leaves much to be desired. With such test
equipment alone, troubleshooting in a bus-oriented
system is extremely tedious and time-consuming, if not
impossible. A new technique called signature analysis has
been devised to deal with microprocessor-based systems,
and the troubleshooting procedures in this manual are
based on sigriature analysis techniques.
5 3. SAFETY REQUIREMENTS.
5-9. SIGNATURE ANALYSIS.
5-4. Although this instrument has been designed in
accordance with international safety standards, general
safety precautions must be observed during all phases of
operation, service and repair of the instrument. Failure to
comply with the precautions listed in the Safety Summary
at the front of this manual or with specific warnings given
throughout this manual could result in serious injury or
death. Service and adjustments should be performed only
by qualified service personnel.
5-10. A complete discussion of signature analysis is
-
-
5 5. TEST EQUIPMENT REQUIRED
-
5-6. Table 5-1 lists test equipment required for maintenance of the instrument. Test equipment of equal
capability may be substituted for any listed item except
the model 5004A signature analyzer (unless it is known
that the substitute signature analyzer agrees completely
with the model 5004A) and the model 2500 range
calibrator.
NOTE
A Diagnostic ROM Kit, P/N 961003 is available for
use in troubleshooting the Instrument. The following
Two Calibration Data Cartridges are available for use
with the Instrument: P/N 961008-1 (for use with the
HP 9825A) and P/N 961008-2 (for use with the HP
85B). The Calibration Data Cartridge can be used for
testing the GPIB, printing out the contents of nonvolatile memory, and DC and AC calibration. Instructions are included with the kit and Data Cartridges.
5 7. TROUBLESHOOTING CONCEPT.
-
5 8. The instrument employs both analog and digital
circuitry. The digital portion uses a microprocessor in a
bus-oriented system. DC and AC measuring instrument
such as voltmeters and oscilloscopes have been the
traditional test instruments for electronic instrument
maintenance; however, in a microprocessor-based busoriented system, such test equipment, while still useful
-
beyond the scope of this manual; however, a brief
discussion will aid in maintenance of the instrument.
Long, complex data streams are present in microprocessor bus-oriented systems. In signature analysis,
with the system operating at normal speed, these data
streams are compressed into concise, easy to interpret
readouts (signatures) measured at pertinent nodes. By
choosing or generating appropriate measuring periods or
windows, these signatures become unique; one and only
one signature occurs at each node if operation is normal.
Using signature analysis, it is possible to proceed through
the instrument in an orderly fashion until a faulty
signature is obtained. Generally, at this point, it is
possible to identify one component as the most probable
cause of the malfunction.
TABLE 5 1. TEST EQUIPMENT LIST
-
Nomenclature
Digital Multimeter
Oscilloscope
Power Meter Calibrator
Signature Analyzer
Calibration Data
Cartridges
For use with:
HP 9825A
HP 85B
Diagnostic ROM Kit
Range Calibrator
Milliwatt Test Set
VOM
General Purpose
Amplifier 10 dB*
*Requires 24 VDC
@ .6 A Pwr Supply
50 ohm Attenuator
Attenuator
Model No.
Data Precision 1450
Hewlett-Packard 1740A
Boonton Electronics 25A
Hewlett-Packard 5004A
Boonton Electronics
P/N 961008-1
P/N 961008-2
P/N 961003
Boonton Electronics 2500
W & G ENIP-1
Simpson 260 or equivalent
Mini-Circuits ZHL-3A
(N Connectors)
Midwest Microwave #389
or Weinschel Mod 2
HP Model 355C
or equivalent
5-1
Section V
Maintenance
5 11. Signature analysis checks are of two basic types:
"free-running" and "stimulated" or programmed. In freerunning checks, the data bus between the microprocessor
and the system is opened, and an instruction that will
cause the microprocessor to free-run is forced. The
microprocessor then runs through its address field
repeatedly. Free-running checks may be used to check the
following:
a. Microprocessor address output
b. Memory select decoding
c. I/O select decoding
d. ROM program
screws that secure the front top and bottom trim strips, and
remove the top and bottom trim strips and front panels.
c. Power Reference. The power reference is secured to
the front subpanel with two screws entering from the rear.
To gain access to the power reference, follow the same
procedure as for the display module.
5-12. In the stimulated mode, the data bus between the
microprocessor and system bus is left intact, and
programs provided in a special ROM are invoked to
conduct the desired tests. In this instrument, the
stimulated mode is used to check the following:
a. RAM operation
b. Display functions and scanning
c. Keyboard
d. I/O ports
5 18. Use of Block Diagrams.
-
5-13. In this instrument, programmed signature analysis tests are activated by setting a bit switch, located at the
rear of the control board, to the number associated with
the particular test. In using signature analysis, the freerunning tests should be performed first to ascertain that
the microprocessor is putting out a normal address field,
that the memory and I/O decoding is correct, and that the
ROM contents are normal.
5 14. The signature analysis technique is applicable
only to the digital section of the instrument. Some
sections of the instrument employ both analog and digital
circuits. The input module, for example, receives a DC
analog signal and amplifies the analog signal before
converting it to a digital signal. The power supply uses
both digital and analog circuitry to develop the voltages
necessary for instrument operation. The discussion of
these hybrid sections in Section IV of this manual will he
helpful in maintenance and servicing.
-
5 15. TROUBLE LOCALIZATION.
-
5 16. Gaining Access To Internal Components. To gain
-
access to internal components of the instrument, remove the
top and bottom covers by removing, the securing screws at
the rear of each cover and then sliding the cover to the rear.
Figure 5-I shows the location of all major assemblies. To
gain access to these assemblies, proceed as follows:
a. Input Module. To gain access to the input module,
remove four screws (on in each corner) and lift off the
cover.
h. Display Module. To gain access to the display
module, remove the top and bottom covers, remove the four
5-2
5 17. Visual Inspection. With the instrument covers re-
moved, inspect all assemblies for foreign material, unseated
integrated circuits, transistors or connectors, for broken
leads. scorched components, loose screws, and other evidence of electrical or mechanical malfunction.
By studying the detailed
theory of operation in Section IV together with the
associated block diagrams, it may be possible to isolate
the cause of an instrument malfunction to a particular
block.
-
5-19. Systematic Troubleshooting. If visual inspection and block diagram analysis do not localize the source
of a malfunction, proceed with module troubleshooting
as follows:
a. Power Supply. With normal input power applied to
the instrument, check the power supply output voltages at
each module power connector. Correct power supply
voltages are shown on the applicable schematic diagrams.
If an abnormal voltage is encountered, disconnect the
module connector from the module and note whether the
power supply output voltage becomes normal; if it does,
the problem probably is not in the power supply. If, on the
other hand, the abnormal voltage condition remains, work
backward through the power supply circuits, comparing
voltages with those shown in Figure 7-7. By analyzing
abnormal indications, it should be possible to localize the
problem to one component in the power supply.
b. Input Module. With a 2.51 mW signal applied to
the power sensor, compare waveforms and voltages with
those shown in Figure 5-2. Correct indications will
essentially eliminate the input module as the source of an
instrument malfunction; however, incorrect indications
will not necessarily localize the problem to the input
module because the input module depends on proper
operation of the control module for such functions as
ranging, analog-to-digital conversion, and recorder and
meter output. If incorrect indications are obtained,
localization of the problem using the oscilloscope and
digital multimeter may be a long and tedious process; a
simpler approach may be to proceed with signature
analysis.
c. Display Module. Proper operation of the display
module is generally self-evident. Incorrect operation does
not necessarily mean that the problem is in the display
module; the control module may be malfunctioning. The
simplest and quickest way to check the display module is
Section V
Maintenance
to perform the visual and signature analysis checks
specified in paragraph 5-22.
d. Control Module. If normal indications are obtained in checking the power supply, input, and display
modules, the problem must be in the control module;
however, it is very unlikely that this situation will occur
because it is virtually impossible for the input and display
modules to operate properly if the control module is
malfunctioning. Signature analysis is the best way to
localize a problem in the control module.
5-20. SIGNATURE ANALYSIS
FREE-RUNNING TEST PROCEDURES.
5-21.
To make free-running signature analysis tests,
proceed as follows:
Make sure that power is off before attempting
to perform steps a, b, and f of the following
procedure. Failure to observe this caution
may result in the loss or destruction of data
stored in the non-volatile RAM.
NOTE
Prior to any signature analysis checks, note
and record bit switch (Figures 5-1 and 5-3)
settings. Restore these switch settings upon
completion of the signature analysis tests.
a. With power off, remove the data bus connector
PI on the control board from socket JI adjacent to J2, and
remove the data bus connector PI on the control board
from socket J I adjacent to IC2 and disconnect jumper from
connector J5. (See Figure 7-5.) Do not remove any of the
control board PROMs.
b. Detailed information for each of the free-running
tests is provided in Tables 5-2 through 5-7. For each
check, set the signature analyzer controls and make
signature analyzer connections as specified in the applicable table.
NOTE
For instruments containing PROMs with codes
differing from those referred to in the various
signature analysis tables contact the Boonton
Service Department for correct signatures.
c. After setting and connecting the signature analyzer,
apply power to the instrument, touch the signature
analyzer probe to the specified measurement points, and
compare the signature obtained on the signature analyzer
with that specified in the table. An incorrect signature is
evidence of malfunction.
d. If an incorrect signature is noted, try replacing the
integrated circuit(s) most intimately associated with the
point at which the incorrect signature was obtained. For
example: an incorrect signature in the address field would
point to integrated circuit IC3 on the control board, but
the problem could be caused by any other integrated
circuit or component tied to that address line.
e. A signature of 0000 is obtained with the signature
analyzer probe connected to common (ground). Some
other items which will produce this signature are:
1. A node stuck at zero
2. A node at the signature analyzer clock frequency.
f. A signature of 755U is obtained with the signature
analyzer probe connected to +5 volts. Some other items
that will produce this signature are:
I. A node stuck at logic I
2. Any signal with a specific relationship to the clock
signal; if the clock signal is signal RD from the
microprocessor, signals IORQ, WR, and RFSH are
examples of signals that will produce this signature.
g. Upon completion of the free-running checks, turn
power off. Then, reinstall data bus connector P I in
socket JI on the control board and reinstall jumper at
connector J5.
NOTE
If programmed tests are to be performed, leave
jumper disconnected from connector J5.
5-22. SIGNATURE ANALYSIS
PROGRAMMED TEST PROCEDURES.
NOTE
Perform the free-running signature analysis
tests before proceeding with programmed
tests.
5-23. Use the following general procedure for each of
the specified programmed signature analysis tests:
NOTE
A Boonton Electronics diagnostic PROM is
required for the programmed signature analysis
tests. The diagnostic PROM is part of the
961004 Test Kit.
a. Turn off input power to the instrument.
h. Remove ROM IC6 and IC7 from its socket on the
control hoard, and remove ROMs 106 and 1C7 from its
socket on the interface hoard (if option -01 is installed),
(See Figure 7-5 and A-2).
c. Install the diagnostic PROM in place of ROM IC6
observing pin I orientation.
5-3
Section V
Maintenance
.4r.....•
CONTROL BOARD
BENEATH IF
INTERFACE BOARD
IS INSTALLED
IEEE 488
INTERFACE
BOARD
Figure 5-1 Location of Major Assemblies (Sheet l of 2)
54
Section V
Maintenance
TP9
TP4
R45 OFFSET
ADJ
R44 FACTORY
ADJ
TP8
R36 OFFSET
ADJ
TP7
TP5
R5 CHOPPER ADJ
R4 CHOPPER ADJ
Figure 5-1 Location of Major Assemblies (Sheet 2 of 2)
5-5
NORMAL
WAVEFORM
MEASUREMENT
POINT
4.5%,
MEASUREMENT
POINT
NOTES
-....., .—. .—.. .,-.—. .
OSCILLOSCOPE TRIGGER
CONNECTED TO TP4;
HORIZONTAL SCALE
2mS/DIV
-
IC5, PIN 10
. . . . . . ........
-5V
.
■
IC1, PIN 5
.-.
+101",_....„
-
IC2, PIN 10
0
TP2, TP4
0
Figure 5-2 I nput P .C . Board : Voltageand Waveform Data
+4V
+5V
A2, PIN 3
TP3, TP11
0
-4V
+5V
r
1
-5V
IC3, PIN 11
+5V
IC8, TP6
-
1
II
In
r.--
II
Ii
0
-
+5V
-
-5V
-
Ii
1
,..I
TP12
‘..
+IV .., 44.'"""" ■
■
,..‘
TP5
-1V j
r.'...."""...
e°...
NOTE:
ALL WAVEFORMS OBTAINED WITH POWER SENSOR
CONNECTED TO MODEL 25A POWER CALIBRATOR
AND MODEL 25A SET AS FOLLOINS:
OUTPUT LEVEL
0
-
I
1
I
I
I
-5V
-
,--- 100 /./.9
RANGES 0, 1 AND 2
RANGES 1 THROUGH 6
2.800 /.tS
- 2.51 mW 1-",- 2.25V AT TP1 ON INPUT P.C.B.)
NOTES
OSCILLOSCOPE TRIGGER
CONNECTED TO IC3 PIN 9
HORIZONTAL SCALE -.5mS/DIV
+5V
-.1 1.*-
0
+5V
NORMAL
WAVEFORM
+5V
1
0
/
IC3, PIN 9
-
Section V
Maintenance
I
OPEN
MODE SET
c,)
CHANNEL SELECT SET
ROCKER IN TRUE (T) OR
0
-o
m
z
OPEN (0) POSITION
OPEN
rn
SENSOR SELECT SET
CO
ENABLES/DISABLES USE OF BIT
SWITCH WITH IEEE-4888 BUS.
CLOSED FOR NORMAL OPERATION
ROCKER IN FALSE (F) OR
CLOSED (C)
Comment
Switch Setting
-t -1 < >-. rnV-JOv)LLI0
Z0 I-
6
In
7
4
v) LLI0
8
0
3
2
1
C
C
Operate Mode
C
0
Calibrate Mode I (DC Cal.)
0
C
Calibrate Mode 2 (AC Cal.)
C
One Channel Operation
0
Two Channel Operation
C
C
C
One Sensor Capability
C
C
0
Two Sensor Capability
C
0
C
Three Sensor Capability
C
0
0
Four Sensor Capability
O
C
C
Five Sensor Capability
O
C
0
Six Sensor Capability
O
0
C
Seven Sensor Capability
O
0
0
Eight Sensor Capability
0
0
0
1
A
R EPS
0
0
Sealed System Operation
Figure 5-3 Control Board Bit Switch Settings
5-7
Section V
Maintenance
TABLE 5-2. CONTROL BOARD ADDRESS FIELD TEST*
Signature Analyzer
Function
START
STOP
CLK
Switch
Setting
1
1
1_
Connection
Point
1
2
Bit Switch**
3 4 5 6 7
8
Item
Measurement
Point
Signature
TPI
TPI
TP5
Any setting
AO
AI
A2
A3
A4
AS
A6
A7
A8
A9
A 10
A 11
Al2
A 13
Al4
A15
Common
+5V
1C3, pin 30
IC3, pin 31
IC3. pin 32
IC3, pin 33
IC3. pin 34
1C3. pin 35
IC3. pin 36
IC3. pin 37
IC3, pin 38
IC3. pin 39
ICI pin 40
IC3, pin I
IC3. pin 2
ICI pin 3
IC3, pin 4
ICI pin 5
0000
755U
H335
C113
7050
0772
C4C3
AA08
7211
A3C1
7707
577A
H H86
89F1
AC99
PCF3
1180
755U
*This test checks the output of the proper address field by CPU IC3; however, any item connected to an address line
could be responsible for an incorrect signature on that line.
**0 = open
TABLE 5-3. CONTROL BOARD MEMORY DECODING TEST*
Signature Analyzer
Function
START
STOP
CLK
Switch
Setting
Connection
Point
1
1
1
TPI
TP1
TP5
Bit Switch**
1 2 3 4 5 6 7 8
Item
Any setting
CSO
CSI
CS2
CS3
*This test checks decoding for selection of memory integrated circuits.
**0 = open
Measurement
Point
Common
+5V
IC4, pin I
IC4. pin 2
1C4. pin 3
IC4, pin 4
Signature
0000
755U
FU4U
A207
H6A3
HU34
Section V
Maintenance
TABLE 5-4. CONTROL BOARD I/0 DECODING TEST*
Signature Analyzer
Connection
Switch
Setting
Point
Function
START
STOP
CLK
1
Bit Switch**
I 2 3 4 5 6 7 8
Item
Measurement
Point
Signature
TP1
TP1
TP5
Any setting
CSO
CS I
CS2
CS3
CS4
Common
0000
+5V
755U
ICI4, pin 1
I7UH
IC14, pin 2 7375
IC14, pin 3 253H
IC14, pin 4 8059
IC14, pin 5 PAOU
*This test checks decoding for selection of I/0 integrated circuits.
**0 = open
TABLE 5 5.CONTROL BOARD ROM 0 TEST*
-
Signature Analyzer
Switch
Connection
Point
Setting
Function
START
STOP
CLK
1
_r
TP7
TP7
TP5
Bit Switch
I 2 3 4 5 6 7 8
Item
Any setting
DO
DI
ID/
D3
D4
D5
D6
D7
Measurement
Point
Signature
Common 0000
+5V
826P
IC6, pin 9
4122
IC6, pin 10 2265
IC6, pin II AH7A
IC6, pin 13 6341
IC6, pin 14 COF3
106, pin 15 7C35
106, pin 16 F152
106. pin 17 U120
*This test checks the program content of ROM 0, for softWare code 314BC.
TABLE 5 6. CONTROL BOARD ROM 1 TEST*
-
Signature Analyzer
Connection
Switch
Point
Setting
Function
START
STOP
CLK
TPI9
TP19
TP5
Bit Switch
1 2 3 4 5 6 7 8
Item
Any Setting
DO
DI
D2
D3
D4
D5
D6
D7
Measurement
Point
Signature
0000
Common
826P
+5V
A39U
IC7, pin 9
IC7, pin 10 5U29
112P
1C7, pin II
1C7, pin 13 FUU2
1C7, pin 14 9A15
IC7. pin 15 AP12
IC7, pin 16 916P
IC7. pin 17 1967
*This test checks the program content ()I' RON1 I , for sof [ware code 365BC.
5-9
Section V
Maintenance
TABLE 5 7. INTERFACE BOARD ROM 2 TEST*
-
Signature Analyzer
Switch
Connection
Setting
Function
Point
TP18
START
TPI8
STOP
TP5
CLK
Bit Switch
I 2 3 4 5 6 7 8
Item
Any setting
DO
DI
D2
D3
D4
D5
DO
D7
Measurement
Point* *
Common
+5V
ICI, pin 9
ICI, pin 10
ICI. pin 11
ICI. pin 13
ICI. pin 14
ICI. pin 15
ICI. pin 16
ICI. pin 17
Signature
0000
826P
504F
A820
P036
90H3
PCIA
20AC
PF5C
721H
*This test checks the program content of ROM 2, for software code 322BC.
**Signature analyzer connection points are on control hoard; measurement points are on interface hoard.
d. Check to sec that data bus connector PI on the control
hoard is installed in socket J I, and that juniper P5 on the
control hoard is connected to connector J5.
e. Turn on input power to the instrument.
f. Perform the specific test procedures provided in Tables
5-7 through 5-22. For each of the programmed signature
analysis tests, make signature analyzer connections and
switch settings as listed in the appropriate table. Then, set
the bit switch on the control board as specified.
Connect the signature analyzer probe to the specified
measurement points, and compare the signatures obtained on the signature analyzer with those listed in the
table.
j. Upon completion of all tests, disconnect all power to
the instrument. Replace ROM Ul on the interface board
the -01A option is installed, or replace the -01B board, if
installed. Remove the diagnostic PROM from the control
board and replace ROM IC6 and IC7.
k. Restore the bit switch (Figure 5-4) to the settings
recorded at the start of signature analysis tests.
5-24. NON-VOLATILE RAM
CIRCUIT TESTS.
5 25. Non Volatile RAM Test. To test non-volatile
RAM IC8, proceed as follows:
-
-
CAUTION
g. Note that in each signature analysis test the signature
analyzer probe is first checked on common (ground) and
then on +5 volts. If the specified signatures are not
obtained for these checks, do not proceed further; subsequent signatures cannot possibly be correct. Recheck
all signature analyzer connections and switch settings.
h. Both visual and signature analysis tests are provided
for the display and keyboard of the instrument. The visual
check should be made first because it is fast and simple;
if the visual check is satisfactory, the signature analysis
test may be omitted.
i. If an incorrect signature is obtained at any point,
replace the integrated circuit (or other active device) most
intimately associated with the node at which the incorrect
signature is obtained. All integrated circuits and transistors in the instrument are socket-mounted for easy
removal and replacement. If the signature is still incorrect
after all active devices have been checked, all passive
devices connected to that node should be suspect.
This test will destroy and overwrite instrument data
stored in the non-volatile RAM, necessitating reloading of data. This test should be made as a last resort
only, or if it has been determined that stored instrument data has already been lost or is faulty.
NOTE
Leave the Boonton Electronics diagnostic ROM
installed on the control board as for the programmed
signature analysis tests. Make sure that jumper P5 on
the control board is connected to connector J5.
a. With power applied to the instrument, set all eight
segments of the bit switch on the control board to the open
position.
b. Observe the instrument LED display. The LED display should provide an error indication cccc initially.
Section V
Maintenance
TABLE 5-8 CONTROL BOARD 4ABIO TEST*
Signature Analyzer
Connection
Switch
Function
Setting
Point
START
STOP
CLK
f
1
_I-
1
2
Bit Switch**
3 4 5 6 7
8
Item
Measurement
Point
Signature
TP6
TP6
TP5
Common
0000
+5V
0000
J3, pin 1
PBO
0000
PBI
J3, pin 2
0000
J3, pin 3
PB2
0000
PB3
J3, pin 4
0000
PB4
J3, pin 5
0000
PBS
J3, pin 6
0000
PB6
J3, pin 7
0000
J3. pin 8
PB7
0000
OCCCCCCC
J3, pin I
PBO
4F7C
COCCCCCC
PBI
J3, pin 2
4F7C
CCOCCCCC
J3, pin 3
PB2
4F7C
CCCOCCCC
J3, pin 4
PB3
4F7C
CCCCOCCC
PB4
J3, pin 5
4F7C
CCCCCOCC
J3, pin 6
4F7C
PB5
CCCCCCOC
J3, pin 7
4F7C
PB6
J3, pin 8
CCCCCCCO
PB7
4F7C
*This test checks operation of ports A and B of the control module I/O port; the function of the bit switch is checked
collaterally.
**0 = open; C = closed
CCCCCCCC
TABLE 5 9 CONTROL BOARD 4C10 TEST*
-
Signature Analyzer
Connection
Switch
Point
Setting
Function
TP6
START
TP6
STOP
TP5
CLK
Bit Switch**
1 2 3 4 5 6 7 8
Item
1
1
_I-
PCO
PCI
PC2
PC3
*This test checks the operation of part of port C of the control board I/O port.
**0 = open; C = closed
OCCCCCCO
Measurement
Point
Signature
Common
0000
+5V
7C88
IC16, pin 14 5437
IC16. pin 15 CCA9
IC 16, pin 16 1788
IC16, pin 17 7C88
TABLE 5 10 CONTROL BOARD 4D10 TEST*
-
Signature Analyzer
Connection
Switch
Point
Setting
Function
TP6
START
TP6
1
STOP
TP5
CLK
Bit Switch**
I 2 3 4 5 6 7 8
Item
Measurement
Point
Signature
5
1
COCCCCCO
Common 0000
58UA
+5V
IC16, pin 13 0000'0
IC16, pin 13 C35P0
PC4
PC4
*This test checks the operation of part of port C on the control board I/O port.
0 Line voltage = 90 volts
@Line voltage = 120 volts
**0 = open; C = closed
5-11
Section V
Maintenance
TABLE 5-11 DISPLAY VISUAL TEST
Bit Switch*
1 2 3 4 5 6 7 8
Instrument Display
In succession:
All zeros
All ones through all nines
All decimal points
All left-most annunciators
All left-most-1 annunciators
All left-most-2 annunciators
All right-most annunciators and - sign
Repeat of the above
NOTE: If this visual check produces satisfactory results, there is no need to perform the associated signature analysis
check.
* 0 = open; C = closed
0000OCCO
TABLE 5-12 CONTROL BOARD DISPLAY TEST*
Signature Analyzer
Connection
Switch
Point
Setting
Function
TP6
START
TP6
STOP
TP5
CLK
Bit Switch**
1 2 3 4 5 6 7 8
0000OC CO
Item
DO
D1
D2
D3
D4
D5
D6
D7
Measurement
Point
Common
+5V
IC3, pin 14
IC3, pin 15
IC3, pin 12
IC3. pin 8
IC3, pin 7
1C3, pin 9
IC3, pin 10
1C3. pin I3
Signature
0000
F72F
94F8
PH9U
83FF
4A1H
HIPS
F3A7
P85F
5536
*This test checks output of digital information to the display. The signature analysis gate in this test is quite
lengthy (approximately 8 seconds); hold the signature analyzer probe on each test point for at least one complete
window, approximately 20 seconds.
**0 = open; C = closed
TABLE 5-13 CONTROL BOARD DISPLAY SCAN TEST*
Signature Analyzer
Connection
Switch
Point
Function
Setting
START
STOP
CLK
Bit Switch**
I 2 3 4 5 6 7 8
Item
Signature
T P4
TP4
TP8
00C 00C CO
SO
SI
S2
S3
*This test checks the control board display 1/0 chip for output of encoded scan data.
**0 = open; C = closed
5 - 12
Measurement
Point
0000
Common
000U
+5V
IC 18, pin 32 0000
IC18, pin 33 0005
IC18. pin 34 0003
IC18, pin 35 000U
Section V
Maintenance
TABLE 5 14 KEYBOARD VISUAL TEST*
Press Keyboard
Instrument Display
-
Bit Switch**
1 2 3 4 5 6 7 8
Key
CCOCCCCO
MODE PWR
RANGE AUTO
LINIITS LO
CAL FACTOR dB
SELECT SENS
dB REF LEVEL dB
isitODE dB
RANGE HOLD
LINIITS HI
CAL FACTOR GHSELECT CHNL
CLR
0
1
2
3
4
5
8
9
10
13
16
17
18
19
20
21
24
0
25
26
1
2
27
28
3
4
29
37
CAL
ZERO
33
*This test is partly keyboard and partly control board because the I/0 chip (IC18) for the display board resides on the
CHS
5
6
7
8
9
control board.
**0 = open; C = closed
TABLE 5-15 CONTROL BOARD RAM TEST*
Si(2nature Analyzer
Switch
Connection
Setting
Point
Function
START
STOP
CLK
1
Bit Switch**
2 3 4 5 6 7 8
Item
Measurement
Point
PBO
PBI
PB2
PB3
PB4
PB5
PB6
PB7
Common
+5V
J3, pin 1
J3, pin 2
J3. pin 3
J3, pin 4
J3, pin 5
J3, pin 6
J3, pin 7
J3, pin 8
Signature
TP6
TP6
TP5
OCOCCCCO
0000
2915
5PPA
77UU
5PPA
77U U
5PPA
77UU
5PPA
77UU
te'd \vrites hit patterns into each byte ot the RAM, reads each byte and outputs it to the test socket at the rear i)I the
cculirol hoard where it is checked with the signature analyzer probe. While not completely exhaustive, this test \\
disclose most RAM failures
'0 = open; C closed
5-13
Section V
Maintenance
TABLE 5-16 INPUT MODULE, CHANNEL 1 OAIO TEST*
Signature Analyzer
Switch
Connection
Function
Setting
Point***
START
STOP
CLK
Bit Switch**
I 2 3 4 5 6 7 8
Item
Measurement
Point
Signature
TP6
TP6
TP5
C O OCCCCO
PAO
PA1
PA2
PA3
PA4
PA 5
PA6
PA7
Common
+5 V
ICI, pin 4
ICI, pin 3
ICI, pin 2
ICI, pin I
ICI, pin 40
ICI, pin 39
ICI, pin 38
ICI, pin 37
0000
876 P
485P
I A33
F85P
5H7U
OFFI
FIOC
9091
4P81
*This test checks the operation of I/O port A of the input module; correct signatures depend on proper functioning of
both the control board and the input module.
**0 = open; C = closed
***Signature analyzer connection points are on the control board; measurement points are on input module board.
TABLE 5-17 INPUT MODULE, CHANNEL 1 OBIO TEST*
Signature Analyzer
Connection
Switch
Point***
Setting
Function
TP6
START
TP6
STOP
TP5
CLK
.
Bit Switch**
1 2 3 4 5 6 7 8
000CCCCO
Item
PBO
PBI
PB2
PB3
P B4
P B5
P B6
P B7
Measurement
Point
Signature
Common 0000
+5V 876P
ICI, pin 18 485P
ICI, pin 19 IA33
ICI, pin 20 F85P
ICI, pin 21 5H7U
ICI, pin 22 OFF I
ICI, pin 23 FIOC
IC I, pin 24 9091
ICI, pin 25 4P81
*This test checks the operation of I/O port B of the input module; correct signatures depend on proper functioning of
both the control board and the input module.
**0 = open; C = closed
***Signature analyzer connection points are on the control board; measurement points are on input module board.
Section V
Maintenance
TABLE 5-18 INPUT MODULE, CHANNEL 1 OCIO TEST*
Signature Analyzer
Switch
Connection
Setting
Function
Point***
START
TP6
TP6
STOP
TP5
CLK
Bit Switch**
I 2 3 4 5 6 7 8
Item
Measurement
Point
Signature
1
I
1
Common 0000
+5V
5064
ICI, pin 14 6U01
CCCOCCCO
PCO
ICI, pin 15 67IU
PC1
ICI, pin 16 CFH2
PC2
ICI, pin 17 12IH
PC3
*This test checks the operation of part of I/0 port C on the input module; correct signatures depend on proper
operation of both the input module and the control board.
**0 = open; C = closed
***Signature analyzer connection points are on the control board; measurement points are on input module board.
TABLE 5 19 INPUT MODULE, CHANNEL 1 ODIO TEST*
-
Signature Analyzer
Switch
Connection
Point***
Function
Setting
TP6
START
TP6
STOP
TP5
CLK
Bit Switch**
1 2 3 4 5 6 7 8
Item
Measurement
Point
PBO
PBO
Common
+5V
A5J3, pin I
A5J3. pin I
1
1.
1
0 C C 0 C C C 0
Signature
0000
23HC or 5C43
00000
7H970
*This test checks part of I/0 port C of the input module for channel I.
**0 = open; C = closed
***Signature analyzer connection points and measurement points are on the control board.
°Signature obtained with range calibrator connected to channel I input, and range calibrator set to zero and Rs =500k,
or with instrument sensor connected to power REF connector and POWER REF ON switch set to off.
0 Signature obtained with range calibrator connected to channel I input, and range calibrator set to range 5 and Rs=
500k, or with instrument sensor connected to POWER REF connector and POWER REF ON switch set to on.
TABLE 5 20 INPUT MODULE, CHANNEL 2 lAIO TEST*
-
Signature Analyzer
Connection
Switch
Point***
Setting
Function
TP6
START
TP6
STOP
TP5
CLK
Bit Switch**
I 2 3 4 5 6 7 8
Item
Measurement
Point
Signature
_F
1
1
Common 0000
+5V
876P
0000CCCO
PAO
ICI, pin 4 485P
1A33
PA I
ICI, pin 3
F85P
ICI, pin 2
PA2
5H7U
ICI, pin I
PA3
PA4
ICI, pin 40 OFFI
ICI, pin 39 F1OC
PA5
PA6
ICI, pin 38 9091
PA7
ICI, pin 37 4P81
*This test checks the operation of I/0 port A on input module 2. Correct signatures depend on the proper operation of
both the control board and input module 2.
**0 = open; C = closed
***Signature analyzer connection points arc on the control board; measurement points are on input module board.
5-15
Section V
Maintenance
TABLE 5-21 INPUT MODULE, CHANNEL 2 1BIO TEST*
Sienature Analyzer
Switch
Bit Switch**
Measurement
Connection
Function
Item
Setting
1
2
3 4 5 6 7 8
Point
Signature
Point***
TP6
START
TP6
STOP
CLK
TP5
Common
0000
+5V
876P
ICI, pin 18 485 P
CCOOCCCO PBO
ICI, pin 19 I A33
PBI
ICI, pin 20 F85P
P B2
ICI, pin 21 5H7U
PB3
ICI, pin 22 OFF!
PB4
ICI, pin 23 FIOC
PBS
ICI. pin 24 9091
P B6
PB7
ICI, pin 25 4P81
*This test checks the operation of I/O port B of input module 2. Correct signatures depend on proper operation of
both the control board and input module 2.
**0 = open; C = closed
***Signature analyzer connection points are on the control board; measurement points are on input module board.
TABLE 5-22 INPUT MODULE, CHANNEL 2 1CIO TEST*
Sienature Analyzer
Bit Switch**
Connection
Measurement
Switch
Item
I 2 3 4 5 6 7 8
Point
Point***
Function
Setting
START
STOP
CLK
TP6
TP6
TP5
OCOOCCCO PCO
PCI
PC2
PC3
Signature
Common 0000
+5V 5064
ICI, pin 14 6U01
ICI, pin 15 67IU
ICI, pin 16 CFH2
ICI, pin 17 12tH
*This test checks the operation of part of I/O port C of input module 2. Correct signatures depend upon proper
operation of both the control board and input module 2.
**0 = open; C = closed
***Signature analyzer connection points are on the control board; measurement points are on input module board.
Section V
Maintenance
TABLE 5-23 INPUT MODULE, CHANNEL 2 IDIO TEST*
Signature Analyzer
Switch
Connection
Function
Setting
Point***
START
STOP
CLK
_r1
Bit Switch**
12 3 4 5 6 7 8
Item
Measurement
Point
PBO
P BO
Common
+5V
A5J3, pin I
A5J3, pin 1
TP6
TP6
TP5
CO OOCCCO
Signature
0000
P95 lOor (088
0000 C)
7H970
*This test checks part of I/O port C of the channel 2 input module.
**0 = open; C = closed
***Signature analyzer connection points and measurement points are on the control board.
0 Signature obtained with range calibrator connected to the channel 2 input, and range calibrator set to zero and Rs
=500kfl,orwithinstrument channel 2 sensor connected to POWER REF connector and POWER REF ON switch
set to off.
Signature obtained with range calibrator connected to the channel 2 input, and range calibrator set to range 5 and Rs
=500E2 ,or with instrument channel 2 sensor connected to POWER REF connector and POWER REF ON switch
set to on.
a
c. Turn the input power off, then back on. If the nonvolatile RAM is operating properly, the instrument LED
display will show I I I I.
b. Connect a digital multimeter between the cell positive
terminal and ground,ensuring that the cell is not shorted to
ground at any time.
d. Repeat step c several times. The LED display should
always show IIIl, not the error indication.
c. Observe the digital multimeter indication: it should
be approximately 3 volts with input power to the instrument turned off. If the indication is much lower than 3
volts, replace the cell in accordance with the procedures in
paragraph 4-25.
e. Upon completion of this test, turn off input power to
the instrument, remove the diagnostic ROM from the control board, and install intetzrated circuits IC5 and IC6 in
their sockets on the control board, making certain that the
correct pin 1 orientation is observed.
5-26. Non-Volatile RAM Cell Test. To test the nonvolatile RAM cell, proceed as follows:
L
kUTION.1
The following test procedure must be adhered to
strictly: otherwise, instrument data stored in the nonvolatile RAM will be lost. Do not attempt to take
measurements other than those specified. Take all
necessary precautions to ensure that no terminals are
shorted to another terminal or to common (ground).
NOTE
The load imposed on the cell by the non-volatile
RAM is 5.25 microamperes or less. With this load,
the cell has a rated life of at least 100,000 hours, which
is greater than I() years.
a. Remove the non-volatile RAM cover to gain access to
the cell terminals.
5-27. Non-Volatile RAM Cell Replacement. (See Figure
5-4). The replacement time for the cell is expected to be 10
years from the time of manufacture. This is the shelf life of
the cell. If cell replacement is needed, restoration of all
instrument calibration data will be required. To replace a
defective cell, proceed as follows:
CAUTION
Use care to avoid shorting the leads of the replacement cell. This will cause discharge of the cell and
result in reduced cell lifetime.
a. Remove the control printed circuit board from the
instrument.
b. Remove the insulating shields from the non-volatile
RAM section.
c. Disconnect the positive lead of the defective cell by
cutting the lead.
d. Unsolder the defective cell using a low-wattage
soldering iron, and remove excess solder from the mounting holes.
5-17
Section V
Maintenance
e. Install the replacement cell, observing cell polarity.
f. Solder the negative terminal of the cell first. Then, as
quickly as possible, solder the positive terminal.
g. Check the non-volatile RAM current by measuring
the voltage across resistor R6. This voltage should be less
than 525 microvolts.
b. Connect the digital voltmeter between HI lead to TP2
and LO lead to TP4. Note the voltage indication: it should
be 150 mV ± 10 mV. Adjust R I I for an indication of 150
mV. (The polarity of the reading will depend on how the
test probes arc connected to the circuit.)
c. Connect the digital voltmeter between TPI and
common. The voltage should be +15Vdc. ±0.6 Vdc.
h. Measure the voltage at pin 12 of integrated circuit
IC8. This voltage should be approximately 3 volts.
d. Connect the digital voltmeter between TP5 and
common. The voltage should be -15Vdc. ±0.6Vdc.
i. Reassemble the shields on the control printed circuit
board, and install the control printed circuit board in the
instrument.
e. Connect the digital voltmeter between TP6 and
common. The voltage should be -5Vdc. ±0.2 Vdc.
5 31. Input Module Adjustments.
-
To adjust the input
5 23. INSTRUMENT ADJUSTMENTS.
module. proceed as follows:
5 29. General. Adjustment procedures are provided for
a. Gaining Access to Adjustment Controls. To gain
access to input module adjustment controls, remove the
four screws that attach the input module cover, and
remove the cover. If the instrument is equipped with two
input modules (option -03), the channel 2 input module
will have to be removed temporarily to provide access to
the channel I input module. The removal procedure for
the channel 2 input module is as follows:
-
-
the chopper, input, display, power supply and power reference boards. The control board requires no adjustments.
For the locations of test points and adjustment controls,
refer to the applicable diagrams in Section VII.
5 30. Power Supply Adjustments. With all power connec-
tors in place, the instrument controls set for proper line
operation, and with line voltage applied, make power
supply adjustments as follows:
a. Connect the digital voltmeter between TP3 and
common. Note the voltage indication; it should be 5.20
±0.002 Vdc. Adjust R5 as required to obtain the specified
voltage.
I. Remove the four channel 2 input module cover
attaching screws, and remove the cover.
2. Remove the channel 2 chopper by unplugging it and
positioning it out of the way.
3. Disconnect the voltage supply cable.
4. Disconnect the the 40-pin bus connector.
Figure 5-4 Non-Volatile RAM Cell Test and Connection Points
Section V
Maintenance
5. Remove the four screws that attach the channel 2
input module to the side frames of the instrument, and
remove the channel 2 input module. Take care to ensure
that no adjustments are disturbed.
c. Chopper Adjustment. The preceding offset adjustments must have been completed before chopper adjustment is attempted. To perform the chopper adjustment,
proceed as follows:
6. Reverse steps 1 through 5 to install the channel 2
input module in the instrument.
I. Allow the instrument to warm up for at least 30
minutes.
b. Offset Adjustments. To perform input module
offset adjustments, proceed as follows:
2. Connect the instrument and test equipment as
shown in Figure 5-5.)
I. Turn on the instrument and the Model 2500 range
calibrator, and allow the equipment to warm up for at
least 30 minutes.
3. Set the instrument controls as follows:
(a) Set the control board bit switch for calibrate mode I.
(See Figure 5-3.)
(b) Press the I and SELECT CHNL keys on the
keyboard if the channel I chopper is to be adjusted; press
the 2 and SELECT CHNL keys if the channel 2 chopper is
to be adjusted.
2. Connect the equipment as shown in Figure 5-5.
3. Set the instrument controls as follows:
(a) Set the control board bit switch for calibrate mode I.
(See Figure 5-3.)
(b) Press I and SELECT CHNL keys on the
keyboard if the channel I input module is to be adjusted;
press the 2 and SELECT CHNL keys if the channel 2
input module is to be adjusted.
(c) Press the 0 and RANGE HOLD keys on the
keyboard.
4. Set the range calibrator and controls to range 0 and
500k .c2 source resistance, and press the ZERO button.
5. Connect a digital multimeter between test point TP9
on the input module and common.
6. Connect a clip lead from test point TPS to chassis or
common.
7. Connect a clip lead from test point TP7 to chassis or
common.
8. Observe the digital multimeter indication; it should
be less than ±15 millivolts. If the digital multimeter
indication is incorrect, adjust potentiometer R45 as
required to provide a digital multimeter indication of less
than ±5 millivolts.
9. Remove the clip lead from test point TPS. The
digital multimeter indication should be less than ±15
millivolts. If the digital multimeter indication is incorrect,
adjust potentiometer R36 as required to provide a digital
multimeter indication of less than ±5 millivolts.
10. Remove the clip lead from test point TP7.
1 I. Using the digital multimeter, measure the voltage
at test point TP5. The voltage should be less than ±100
millivolts. If the voltage is incorrect, adjust potentiometer
R24 as required to provide a voltage indication of less than
±100 millivolts.
NOTE
Potentiometer R24 is omitted in later instruments.
12. If no further adjustments are to be performed, set
the control board bit switch back to operate mode. (See
Figure 5-3.)
(c) Press the 0 and RANGE HOLD keys on the
keyboard.
4. Set the range calibrator controls to range 0 and
sookn source resistance, and press the ZERO button.
5. Using the digital multimeter, measure the voltage at
test point TP9 on the input module. Adjust potentiometer
R4 and potentiometer R5 on the chopper board equally to
obtain a reading from zero to -100 millivolts, but as close
to zero as possible.
NOTE
Considerable fluctuation in the digital multimeter indications will be observed during the
voltage measurements in the preceding step.
The fluctuation is caused by noise, thermals,
etc. Mental averaging of the indications will be
required.
6. If no further adjustments are to be performed, set
the control board bit switch back to operate mode. (See
Figure 5-3.)
d. A/D Converter Adjustment. Conversion of voltage levels from analog to digital format is performed by
the input module AID converter, which operates in
conjunction with the instrument microprocessor and
appropriate software. There are two adjustments associated with the Al D converter: an upscale adjustment and a
downscale adjustment. These adjustments have been
made precisely during the instrument calibration process,
and should seldom, if ever, require readjustment; however, if it is desired to check and readjust the A/D
converter, the procedure is as follows:
NOTE
The input module offset and chopper adjustments should be completed before proceeding
with the A/D converter adjustment.
5-19
Section V
Maintenance
I. Connect the instrument and test equipment as
shown in Figure 5-5. Turn on the instrument and test
equipment and allow a warmup period of at least 30
minutes.
2. Set the instrument controls as follows:
(a) Set the control board bit switch to calibrate mode 1.
(See Figure 5-3.)
paragraph 6 above and adjust R44 to obtain a
display of 3.685 on range 5. Then repeat paragraphs 7 and 8 above. There is some interaction
between R I and R I I , so recheck adjustments.
9. Set the control board bit switch back to OPERATE MODE. (See Figure 5-3.)
NOTE
(b) Press the 1 and SELECT CHNL keys on the
keyboard if the channel 1 input module is to be adjusted;
press the 2 and SELECT CHNL keys on the keyboard if
the channel 2 input module is to be adjusted.
Data has been entered into the non-volatile
memory of the instrument at the factory for the
instrument and for the sensor(s) ordered with
the instrument. A copy of the factory-entered
data is provided under the right side cover of
the instrument. Field entry of data is not
required unless stored data is destroyed or its
accuracy becomes suspect, or if another sensor
is to be used with the instrument.
(c) Press the 0 and RANGE HOLD keys on the
keyboard.
3. Set the ranee calibrator controls to mnge 0 and
500k source resistance, and press the ZERO button.
4. Zero the instrument by pressing the ZERO key on
the keyboard.
5. Upon completion of the zeroing operation, press
the 5 and RANGE HOLD keys on the keyboard.
6. Set the range calibrator to range 5 and release
the ZERO button. The indication on the instrument LED
display should be 3685. If the indication is incorrect, adjust
potentiometer R I on the input module as required to
obtain the 3685 indication on the LED display.
7. Set the range calibrator to range 2. Press 2 and
RANGE HOLD keys on the instrument and record the
displayed reading.
8. Set the range calibrator to range I and adjust R I I
for one tenth of the reading recorded on range 2. For
example, if the range 2 display was 3680, set range I to
display 368.
NOTE
The front end of the instru5-32. DC Calibration.
ment input module is a balanced-input DC amplifier with
seven decade ranges for nominal inputs of I 0 microvolts to
10 'volts. The output is an unbalanced DC with a 2.5 volt
full scale value for each range: this DC is converted into a
proportional digital value. One manual gain adjustment,
potentiometer R44, adjusts the gain of all ranges by the
same amount; this adjustment is factory set during instrument calibration. Individual range adjustments are accomplished through software correction or adjustment, which
is also determined during instrument calibration. The software corrections are stored in the instrument non-volatile
memory. A gain factor associated with the recorder DC
output is also stored in the memory. To calibrate the DC
gain of the instrument, proceed as follows:
a. Connect the instrument and test equipment as shown
in Figure 5-5.
b. Set the instrument controls as follows:
If there is not enough range of R I or R I I ,
center R I and R I I under the conditions of
MODEL 4200
RF
MICROWATTMETER
MODEL 2500
RANGE
CALIBRATOR
CHANNEL 2
SENSOR
0
CHANNEL 1
Figure 5-5 Test Setup for Input Module Offset, Chopper. and A/ D Converter Adjustments
5-20
Section V
Maintenance
1. Set the control board bit switch to OPERATE
MODE (see Figure 5-3.)
NOTE
For 4200-5B and 4200-5E series sensors, increase all the levels indicated below by + 10
dBm. For 4200-6 series sensors, increase all
levels by + 20 dBm. Refer to paragraph 5-41
for procedure to obtain levels sufficient to calibrate the highest range when using a 4200-6
sensor. Refer to paragraph 5-40 for calibrating a
4200-4C sensor.
2. Set the range calibrator to range 0 and depress
ZERO.
3. Press the I and SELECT CHNL keys if channel I
is to be adjusted; press the 2 and SELECT CHNL keys if
channel 2 is to be adjusted.
4. Press the MODE PWR key.
5. Press the 0 and CAL FACTOR dB keys.
a. Connect the instrument and test equipment as shown
in Figure 5-6.
6. Press the 0 and REF LEVEL dB keys.
NOTE
7. Press the ZERO key.
To calibrate with 4200-5G, 4200-7E or 42008E sensors, the Model 25A must he replaced
with an equivalent 50 MHz source.
8. After zeroing is completed, set the control board
bit switch to CALIBRATE MODE I and press, in order,
the 1, 0, 0, 0, and RANGE AUTO keys.
h. Depress the Model 25A ZERO or 50 MHz source.
9. Release the range calibrator ZERO.
c. Set the control hoard bit switch to OPERATE MODE.
10. Line-by-line set the range calibrator and press the
instrument keys as listed in Table 5-24.
d. Press in order, the I, SELECT CHNL, sensor
number of I through 8, as appropriate (See Section 5-39
for additional sensors), SELECT SENS, 0, CAL FACTOR
dB, 0, and REF LEVEL dB keys.
I I . Disconnect the ranee calibrator and set the control
board hit switch to OPERATE MODE.
5-33. AC Calibration. Two types of data arc stored in the
instrument non-volatile memory for each sensor that is
calibrated with the instrument: low-frequency gain corrections, and high-frequency gain corrections or calibration
factors, (The calibration factors are marked on the sensor
housing). The low-frequency gain corrections are of two
types: a gain factor for each range, and a gain correction for
each range. Any sensor procured independently of the instrument must have its low-frequency gain data entered and
stored in the non-volatile memory. Entry of high-frequency
gain corrections is not absolutely necessary because calibration factors can he read from the sensor housing and entertd
through the instrument keyboard while using the instrument: however, if the capability of making automatic highfrequency gain corrections as a function of frequency is
desired, high-frequency gain corrections must also he
entered and stored in the instrument non-volatile memory.
To calibrate the low-frequency gain of the instrument,
proceed as follows:
e. Set the control hoard hit switch to CALIBRATE
MODE I.
t. If calibrating a 4200-4A, B, C, E series sensor, press,
in order, the 0, CAL FACTOR GHz, I, 0, 0, 0, and CAL
FACTOR dB keys.
It calibrating a 4200-6E series sensor, press, in order, the 2,
CAL FACTOR GHz, I, 0, 0, 0, and CAL FACTOR dB
keys.
It calibrating a 4200-7E sensor, press, in order, the I , 3, I ,
CAL FACTOR GHz, 3, 8, 5, 0, and CAL FACTOR dB
keys.
If calibrating a 4200-8E sensor, press, in order, the I , 3, 2,
CAL FACTOR GHz, 3, 8, 5, 0, and CAL FACTOR dB
keys.
MODEL 4200
RF
MICROWATTMETER
MODEL 25A
POWER METER
CALI BRATOR
DIGITAL
MULTIMETER
SENSOR
0
POWER
SENSOR
-
• DIGITAL MULTIMETER CONNECTS TO
REAR PANEL CONNECTOR J20.
Figure 5-6 Test Setup for Recorder Output Adjustment
5-21
Section V
Maintenance
TABLE 5-24. DC CALIBRATION TEST
Range
Calibrator
Press
Allow
settling
Press
Record
Display
Range 0
0, RANGE HOLD,
3,6,.,8,5,MODE dB
—
CAL, REF LEVEL dB
=-- 1000
Range I
I, RANGE HOLD
—
CAL, REF LEVEL dB
- 1000
Range 2
2, RANGE HOLD
—
CAL, REF LEVEL dB
=-- 1000
Range 3
3, RANGE HOLD
—
CAL, REF LEVEL dB
.-- 1000
Range 4
4, RANGE HOLD
—
CAL, REF LEVEL dB
=-- 1000
Range 5
5, RANGE HOLD
—
CAL, REF LEVEL dB
=-- 1000
Range 6A*
6, RANGE HOLD
—
CAL, REF LEVEL dB
= 1000
*S/N 975 and above if BO series software is used, se Range to 6B. SN 1186 and above set to range 6B.
If calibrating a 4200-5B, E series sensor, press, in order,
the I , CAL FACTOR GHz, 1, 0, 0, 0, and CAL FACTOR
dB keys.
If calibrating a 4200-5G series sensor, press, in order, 6, 5,
CAL FACTOR GHz, I, 0, 0, 0, and CAL FACTOR dB
keys.
Example
Always use whole numbers: the idea is t i display reading to equal true reading.
True reading = 10.00
Display reading = 9.95
Downscale correction = 5
g. Enter the last four digits of the sensor serial number
by pressing the appropriate keys followed by the dB LIMITS HI, I, 0, 0, 0, and RANGE AUTO keys.
NOTE
True reading = 1.000 p..W
Display reading = 1.006 p. W
Downscale correction = — 6
m. To enter the downscale correction, refer to Table 527 and set the hit switch to CALIBRATE MODE 2.
Pressing N and then HOLD selects range N.
h. Set the control hoard hit switch to CALIBRATE
MODE 2 for subsequent operations.
i. Zero the 4200 by pressing 0, HOLD, ZERO. Wait for
the completion of the zeroing process (digit display indicates ccec then returns to numeric display).
j. To adjust the full scale gain, set the Model 25A or
50 MHz source and 4200 as listed in Table 5-25.
k. Set 25A or 50 MHz source for no output. Set the control hoard hit switch to OPERATE MODE and press
RANGE AUTO, ZERO.
I. To calculate the down scale corrections, set the
Model 25A or 50 MHz source and 4200 as listed in Table
5-26.
NOTE
There is a one-to-one relationship between the
counts entered for the downscale correction IX)
and the correction which results.
n. Set the hit switch to OPERATE MODE and check
accuracy.
o. If after checking accuracy there are out-of-tolerance
conditions, the quality of each range may he changed as
follows:
Example
OPERATE MODE input = — 44 dBm
Display reads —44.30 dBm
The difference is 30 counts low. In dBm mode, there is a
twenty-to-one relationship between the counts entered for
full scale correction and the correction which results: 20 x
30 = 600
Set the hit switch to CALIBRATE MODE 2 and recall gain
factor by pressing HOLD, REF LEVEL dB. A gain factor
of 5000 is displayed. Increase gain factor by 600 by pressing: 5,6,0,0, REF LEVEL dB. Recheck in OPERATE
MODE. If the example display was 30 counts high, a correction would have been made 600 counts lower or 4400.
5-34. Display Board Recorder Output Adjustment. To
check and adjust the recorder output, proceed as follows:
TABLE 5-25. FULL SCALE SENSOR CALIBRATION DATA
FOR 4A, 4B, 4C, 5B*, 5E* AND 6E* SERIES SENSORS
25A 50MHz
Press
Section V
Maintenance
Allow
settline
Press
Record
Display
— 54dBmt .398nW)
0,HOLD,3,9,.,8
0,MODE dB
—
CAL,O,HI, REF LVL dB
------ 5000
— 44dBmt3.98nW)
I,HOLD,3,9,.,8
0,MODE dB
—
CAL,O,HI, REF LVL dB
=---- 5000
— 34dBmt39.8nW)
2,HOLD,3,9,.,8
0,MODE dB
—
CAL,O,HI, REF LVL dB
=--- 5000
— 24dBmt3.98p.W)
3,HOLD,3,9,.,8
0,MODE dB
—
CAL,O,HI, REF LVL dB
.----- 5000
— 14dBm(39.8[LW)
4,HOLD,3,9,.,8
0,MODE dB
—
CAL,O,HI, REF LVL dB
=--- 5000
OdBmt1.00mW)
5,HOLD,9,9,.,9
9,MODE dB
—
CAL,O,H1, REF LVL dB
'----- 5000
+ 10dBmi 10.0mW)
6,HOLD,9,9,.,9
9,MODE dB
—
CAL,O,HI, REF LVL dB
=--- 5000
'"All levels should be increased by 10 dB for 5B and 5E sens ws and 20 dB r 6E sensor.
FOR 5G SERIES SENSOR
Press
50MHz source
Allow
settline
Press
Record
Display
— 29dBmt 1.26p.W)
2,HOLD,I,2,.,6
0,MODE dB
—
CAL,O,HI, REF LVL dB
=---- 5000
— 19dBrrn12.6i.LW)
3,HOLD,1,2,.,6
0,MODE dB
—
CAL,O,HI, REF LVL dB
=--- 5000
— 6dBm(.251mW)
4,HOLD,2,5,., I
0,MODE dB
—
CAL,O,HI, REF LVL dB
------ 5000
+ 7dBmt5.01mW)
5,HOLD,5,0,., I
0,MODE dB
—
CAL,O,HI, REF LVL dB
--.--- 5000
+ I9dBm(79.4mW)
6,HOLD,7,9,.,4
0,MODE dB
—
CAL,O,HI, REF LVL dB
=---- 5000
0,HOLD,O,REF LVL dB4O,HI
0,HOLD,O,REF LVL dB4O,H1
FOR 7E AND 3E* SERIES SENSORS
Press
50MHz source
Allow
settline
Press
Record
Display
— 20dBm(10.0p.W)
0,HOLD,9,9,.,9
9,MODE dB
—
CAL,O,HI, REF LVL dB
=---- 5000
— 10dBm(10(h.LW)
1,HOLD,9,9,.,9
9,MODE dB
—
CAL,O,HI, REF LVL dB
-,-- 5000
OdBm(1.00mW)
2,HOLD,9,9,.,9
9,MODE dB
—
CAL,O,HI, REF LVL dB
----- 5000
+ 10dBmt 10.0mW)
3,HOLD,9,9,.,9
9,MODE dB
—
CAL,O,HI, REF LVL dB
.--- 5000
4,HOLD,O,REF LVL dB4O,H1
5,HOLD,O,REF LVL dB4O,HI
6,HOLD,O,REF LVL dB4O,HI
*Increase level by 10 dB n. SE sensor.
5-13
Section V
Maintenance
TABLE 5-26. DOWN SCALE SENSOR CALIBRATION DATA
FOR 4A, 4B, 4C, 4E, 5B*, 5E* AND 6E* SERIES SENSORS
25A or 50MHz
Record Display
Reading
True Reading_
Downscale Correction
— 60dBm(1.00nW)
1.00nW
Range 0 =
— 50dBm(10.00nW)
10.00nW
Range I =
— 40dBm(100.0nW)
100.0nW
Range 2 =
— 30dBm(1.000p.W)
1.00011W
Range 3 =
— 20dBm( 10.0011W)
10.0011W
Range 4 =
— 10dBm(100.01.1.W)
100.01.LW
Range 5 =
+ 3dBm(2.00mW)
2.00mW
Range 6 =
*All levels should be increased by 10 dB for 5B and 5E sensors and 20 dB for 6E sensor.
FOR 5G SERIES SENSOR
50MHz source
Record Display
Reading
True Reading
.2001.t.W
— 37dBm( .20011W)
2.511.1.W
— 26dBm(2.51p.W)
25.111W
— 16dBm(25.11.1.W)
.50 I mW
— 3dBm( .50 I mW)
10.0mW
+ 10dBm( I 0.0mW)
Downscale Correction
Range 2 =
Range 3 =
Range 4 =
Ranges =
Range 6 =
FOR 7E AND SE SERIES SENSORS
50MHz source
Record Display
Reading.t.
True Readina
Reading
2.511.1.W
— 26dBm(2.5111W)
25.111W
— 16dBm(25.1p.W)
.25I mW
— 6dBm(.25 I mW)
2.51mW
+4dBm(2.5 ImW)
TABLE 5-27. DOWNSCALE
CORRECTION DATA
PRESS
0,
HOLD,
X,
X,
X,
X,
HI
I,
HOLD,
X,
X,
X,
X,
HI
2,
HOLD,
X,
X,
X,
X,
HI
3,
HOLD,
X,
X,
X,
X,
HI
4,
HOLD,
X,
X,
X,
X,
HI
5,
HOLD,
X,
X,
X,
X,
HI
6,
HOLD,
X,
X,
X,
X,
HI
X Denotes downscale correction
5 24
-
Downscale Correction
Ranae
t- 0 =
Range I =
Ran g e 2 =
Range 3 =
Section V
Maintenance
NOTE
a. Connect the instrument and test equipment as shown
in Figure 5-6.
Make sure that control board bit switch is set
back to OPERATE MODE upon completion of
adjustments.
b. Set the instrument controls as follows:
I. Press the MODE PWR key on the keyboard.
2.
Press the RANGE AUTO key on the keyboard.
3.
Press the 0 and CAL FACTOR dB keys on the
keyboard.
4.
5-35. Power Reference Adjustment. To check and adjust
the power reference output, proceed as follows:
a. Connect a 50-ohm test probe to a Model EPM-1 milli-
Press the 0 and REF LEVEL dB keys on the
watt test set.
keyboard.
b. Turn on the milliwatt test set and the instrument.
c. Set the power meter calibrator output to I mW.
Allow the milliwatt test set and the instrument to warm up
for at least 30 minutes.
d. Check the indication on the LED display of the instrument. If the indication is not 1.000 mW, press the CAL
key.
•
c. Standardize the milliwatt test set in accordance with
the manufacturer's instructions.
e. With I .000 mW indicated on the LED display, check
d. Connect the probe of the milliwatt test set to the
the indication on the digital multimeter: it should be 9.98 to
POWER REF connector of the instrument and note the indi-
10.00 volts. If the indication is correct, proceed directly to
cation on the milliwatt test set. The indication should he
step h: if the indication is incorrect, proceed to step f.
within
•
0.005 dB.
NOTE
f. If the digital multimeter indication in preceding step e
was incorrect, set the control board bit switch to CALI-
the indication in step d is within the specified
BRATE MODE I (see Figure 5-3) and press the dB LIM-
limits, no adjustment of the power reference is
ITS LO key on the keyboard. The LED display will show a
required. Proceed with the following steps only
Lzain modifier of approximately 3600. Calculate a revised
if the indication is outside the specified limits.
gain modifier value to obtain the required correction. For
example: if the digital multimeter indication were 9.96 volts
(0.4% low) and the dB LIMITS LO key recalled a gain
modifier of 3500, the revised gain modifier value would he:
e. Remove the bottom cover.
f.
Remove the bottom front trim strip from the instru-
ment by removing the two screws (one on each side) that
1.004 x 3500 = 3514
Enter this revised gain modifier value by pressing the
following keys on the keyboard:
secure the trim strip.
g.
Locate the power reference adjustment. (See Figure
5- I .)
3, 5, I, 4,
dB LIMITS LO,
dB LIMITS LO (revised value should appear on the LED
h. Adjust the power reference adjustment R4 as required
to obtain an indication of 0 dBm + 0.005 dB on the milli-
display )
watt test set.
* g. Reset the control board bit switch to OPERATE
MODE 0. (Sec Figure 5-3.) Note the indication on the digital multimeter: it shuld he 9.98 to 10.00 volts. Repeat steps
f and g, if necessary, until the correct indication is obtained.
* h. Set the power meter calibrator output to 0.125 mW,
and observe the indications on the instrument LED display
i.
Restandardize the milliwatt test set and recheck the
power reference. Readjust the power reference adjustment
as necessary.
j.
Turn off the instrument and the milliwatt test set.
Install the trim strips and cover.
and on the digital multimeter. The millivolt indication on
the digital multimeter should equal ten times the value
5-36. Entry of Sensor Calibration Factors Versus Fre-
shown on the LED display It I count. If the digital multi-
quency.
meter indication is incorrect, adjust potentiometer R55 on
the input module hoard as required to provide the proper
digital multimeter indication.
Proceed as folows:
NOTE
The 4200 is capable of storing twenty calibration
factors (0 through 19) for each sensor (from I to 8)
i. Repeat steps e through h until no further adjustments
in ascending order, starting with the lowest and
are necessary.
* See Instruction
programmed into the instrument. Frequencies must he
—
manual supplement
5-25
Section V
Maintenance
advancing in sequence to the highest. If less than
twenty calibration factors are to be entered, enter the
calibration factors available then fill the remaining
positions with the highest frequency and associated
calibration factor.
a. Using the keyboard keys, select the sensor for which
calibration factors are to be entered. For example, if the
calibration factors to be entered are for sensor 4, press the 4
and SELECT SENS keys.
b. To confirm correct sensor selection press the SELECT
SENS key. 'The number of the selected sensor will appear
on the instrument LED display.
location. The control board bit switch is set to accept this
number as the number of the sensor for which new data is to
be entered, and the error indication is erased automatically
The maximum number of sensors for which data may be
stored is eight. If data for eight sensors is already in storage
and it is desired to use another sensor, the data already in
storage for one of the sensors must be over written.
b. Serial number, type, and attenuation data for the new
sensor must be entered into non-volatile memory. (See Sec
tion 5-33)
c. Set the control board bit switch. to CALIBRATE
MODE 2. Refer to Figure 5-3.
c. Gain factors and gain corrections for the new sensor
must be developed, entered, and checked. A calibration
source is required for this function. (See Section 5-33)
d. Using the keyboard keys, enter the calibration factor
position number (0 through 19) followed by the RANGE
AUTO key.
d. Calibration factors versus frequency, which are shown
on the barrel of the sensor, must be entered into non-volatile
memory. (See Secton 5-36)
For example: to enter a frequency and calibration factor into
position 0, press the 0 key followed by the RANGE AUTO
key.
5 39. Bit Switch Setting For Additional Sensor. To de-
e. Using the keyboard keys, enter the frequency to which
the sensor calibration factor to be entered applies.
For example: if the sensor calibration factor to be entered
applies to a frequency of 0.1 GHz, press the 0, , and I
numeric key, then press the CAL FACTOR GHz key.
(Frequencies of 0.1 GHz through 110 GHz are valid).
f. Using the numerical keys, enter the sensor calibration
factor for the frequency selected in step e. (For negative
values, press the CHS key after entering the sensor calibration factor value.) After entering the correct sensor calibration factor value, press the CAL FACTOR dB key. (Values
of — 3.00 to + 3.00 are valid.)
g. Repeat steps d through f until all twenty positions are
filled.
h. Press the 0 and RANGE AUTO keys.
i. Set the control board bit switch, to the OPERATE
MODE. Refer to Figure 5-3.
-
termine the correct bit switch setting for the new sensor,
proceed as follows:
a. If the number of sensors for which data is already
stored is unknown, select sensors in sequence through the
keyboard until an error indication (CCO2) appears on the
instrument LED display. For example, press the 1 and
SELECT SENS keys, the 2 and SELECT SENS keys, the 3
and SELECT SENS keys, and the 4 and SELECT SENS
keys.
b. When an error indication is returned, press the
SELECT SENS key a second time: if the LED display does
not indicate the last selected sensor number, it can be assumed that no data has been entered in non-volatile memory
for this sensor number.
c. Set the control board bit switch (Figure 5-3) to accept
the sensor number that produced the error indication and
mark this sensor number on the sensor barrel.
5 40. Calibration of NIodel 4200 4C Sensor. The calibra-
5 37. SENSOR CALIBRATION
-
5 38. General. In order to use a sensor tbr which calibration
data is unknown, the following requirements must be met:
-
a. The control board bit switch must be set to accept
another sensor number without returning an error indication. Data is stored in the instrument non-volatile memory
for the number of sensors procured with the instrument; if a
sensor number other than any of those for which data is
stored is selected, an error message is displayed on the instrument LED display, thereby indicating an empty storage
5-1 6
-
tion procedures for this sensor are the same as those for
other sensors, except that a 50-ohm to 75-ohm transformer
is required between the power meter calibrator and the
sensor. Any loss or gain introduced by the transformer must
be taken into account during the calibration procedure. For
example, if a transformer with a loss of 0.05 dB at I MHz is
used, the LED display indications must be reduced by 0.05
dB while the input levels remain the same.
NOTE
When making final calibration checks of the
sensor, the transformer loss in the example
Section V
Maintenance
above can he compensated for by entering a calibration factor of + 0.05 dB into the instrument.
5-41. Calibration Notes, Model 4200-6 Sensor +30
dBm Range.
attenuation value of the 10 dB attenuator. If the values listed
in the third column are within 0.02 of the values listed
in the second column plus the exact value of the 10 dB
attenuator, no adjustment on this range is needed. If readjustment is desired, proceed to paragraph 5-44.
5-42. The maximum output level of the Model 25A calibrator, which is recommended for instrument calibration, is
+20 dBm. Because levels of +20 to +30 dBm are required for checking or calibrating the highest range of the
4200-6 sensor, an amplifier with an exact gain of 10 in
power and a capability of delivering 1 watt into 50 ohms at
1 MHz is required. The procedure which follows outlines an
alternate method for checking this range.
a. Calibrate and/or check the instrument with the 4200-6
sensor on all ranges except the highest ( + 30 dBm) range as
outlined in paragraph 5-33.
b. Connect the instrument and test equipment as shown
in Figure 5-7. A small fan directed at the Model ZHL-3A
will minimize drift. The exact attenuation of the 10 dB, 50
ohm attenuator must be known. If the exact attenuation is
unknown, it can be determined with a reasonable degree of
accuracy as follows:
I. With the Model 25A, the instrument, and the 42006 sensor calibrated or checked as in paragraph a above, set
the output of the Model 25A to 10 dBm and connect the
equipment as shown in Figure 5-8.
2. Note the reading on the instrument display. The
attenuation value of the 10 dBm attenuator is 10 dBm minus
the dBm indication on the instrument display. Higher resolution may be obtained by operating the instrument in the
PWR mode and calculating the attenuation value from:
Attenuation (dB) =
log
10.00 mW
Instrument indication (mW) with 10 dB attenuator
c. Using the test setup shown in Figure 5-7, note and
record the indication on the instrument display as the Model
25A output level is varied over the range of + 10 dBm to
+ 1 dBm. A tabular form as shown in Table 5-28 is recommended. In Table 5-28, the first column is the Model 25A
output setting, and the second column lists indications
typical of what might be expected. These two columns
amount to a calibration of the Model 25A — Model ZHL-3A
combination.
d. Remove the 10 dB attenuator from the test setup
shown in Figure 5-7, and connect the 4200-6 sensor directly
to the Model ZHL-3A. Set the Model 25A output to the
levels listed in the first column of Table 5-28, and record
the indications on the instrument display in the third column
of the table. Ideally, the values listed in the third column
will equal those listed in the second column plus the exact
NOTE
At the higher output level, the output will be
distorted; however, this does not matter since
the same distortion exists in both determinations
(second and third columns).
5-43. In the + 30 dBm range adjustment procedure that follows, it is assumed that the 4200-6 sensor has been previously calibrated with the instrument. The adjustment
value is stored in REF LEVEL dB: this value will be in the
vicinity of 5000. If the 4200-6 sensor has not been calibrated with the instrument, 5000 should be stored initially
and adjusted as necessary. Use the following procedure:
a. Set the Model 25A output to + 7 dBm.
b. Set the control board bit switch (Figure 5-3) to
CALIBRATE MODE 2 (switch No. 2open).
c. Press the instrument REF LEVEL dB key. The display will indicate a number in the vicinity of 5000.
d. If the 4200-6 sensor has not been calibrated previously, enter 5000 as the initial value by pressing the 5, 0, 0,
0, and REF LEVEL dB keys. Repeat the procedures of
paragraphs 5-42c, 5-42d, and 5-43a through 5-43c.
e. Adjust the value obtained in paragraph c above in the
desired direction by increasing or decreasing this value. A
change of 12 counts in this value corresponds to a change of
approximately 0.01 dB. For example: if the recorded indication in Table 5-28 were 25.34 dBm rather than 25.32
dBm as required, a correction of —0.02 dB is necessary;
therefore, 24 counts should be subtracted from the value obtained in paragraph c above. To enter this new value. press
the N, N, N, N, and REF LEVEL dB keys.
f. After entering the adjusted value, set the control board
bit switch (Figure 5-3) to the OPERATE MODE (switch
No. 2 closed), and recheck the performance by returning to
paragraph 5-43c.
5-44. If the difference in the last column of Table 5-23
exceeds ±0.02 dB for the 3, 4, or 5 dBm setting of the
Model 25A, this difference may be reduced as follows:
a. Set the Model 25A output to +4 dBm.
b. Set the control hoard bit switch (Figure 5-3) to
5-27
Section V
Maintenance
MODEL 25A
POWER METER
CALIBRATOR
ATTENUATOR
HP MODEL 355C
OR EQUIVALENT
(10 aim
MODEL ZHL-3A
AMPLIFIER
10 dB
50 OHM
ATTENUATOR
MODEL
4200-6
SENSOR
MODEL
4200
Figure 5-7. Test Setup for Determination of Attenuation Value
MODEL 25A
POWER METER
CALIBRATOR
(10 dBm)
111.,
■■■■
10 d8
50 OHM
ATTENUATOR
MODEL
4200-6
SENSOR
MODEL
4200
Figure 5-8. Calibration Test Setup, Model 4200-6 Sensor, +30 dBm Ranee
TABLE 5 28. TYPICAL CALIBRATION DATA FOR MODEL 4200 6 SENSOR WITH MODEL 4200
-
-
Model 25A
Level
Model 4200 Indication
with 10 dB Atten.
Model 4200 Indication
Without 10 dB Atten.
Difference
10 dBm
20.02 dBm
30.03 dBm
+0.01 dB
9 dBm
19.02 dBm
29.04 dBm
+0.02 dB
8 dBm
18.06 dBm
28.07 dBm
+0.01 dB
7 dBm
17.09 dBm
27.09 dBm
0.00 dB
6 dBm
16.12 dBm
26.11 dBm
-0.01 dB
5 dBm
15.13 dBm
25.12 dBm
-0.01 dB
4 dBm
14.15 dBm
24.13 dBm
-0.02 dB
3 dBm
13.16 dBm
23.16 dBm
0.00 dB
2 dBm
12.18 dBm
22.18 dBm
0.00 dB
1 dBm
11.17 dBm
21.18 dBm
+0.01 dB
CALIBRATE MODE 2 (switch No. 2 open).
c. Press the dB LIMITS HI key on the instrument front
panel and note the value shown on the instrument display.
d. Increase or decrease this value as required in steps of
5 or 10 counts, returning the control board bit switch to the
OPERATE MODE (switch No. 2 closed), and noting the
result. Repeat the adjustment as necessary to obtain the desired indication.
e. Recheck the entire range, starting with paragraph
5-43c.
I. At the conclusion of the procedure, he sure to return
the control hoard hit switch to the OPERATE MODE
(switch No. 2 closed).
Section VI
Parts List
SECTION VI
PARTS LIST
6-1. INTRODUCTION
Table 6-2. Replaceable Parts, list all the replaceable parts
and includes: the reference symbol, description, Mfr.,
N1fr's Part No, and the BEC Part No, Table 6-1. Manu-
facturer's Federal Supply Code Numbers, list the manufacturer's federal supply numbers.
TABLE 6-1. NIANUFACTURER'S FEDERAL SUPPLY CODE NUMBERS
NUMBER
00241
01121
01247
01295
02660
02735
03888
04713
0490 I
06383
06776
07263
07326
13812
14655
17801
19701
NUMBER
NANIE
Fenwal Electronics
Allen Bradley
Sprauue Electric Company
Texas Instruments
Amphenol
RCA Solid State Division
Pyrotilm i KDI)
INIotorola Semiconductor
Boonton Electronics
Panduit Corp.
Robinson Nueent. Inc.
Fairchild Semiconductor
Fairchild Semiconductor
Dialco Div. of Amperex
Cornell-Dubilier
Panel Corp. (Schumer)
Ntepco Electra
20307
24266
27014
27264
27735
27777
28480
31313
31918
32575
32897
32997
33297
33883
34335
51640
52464
NUN1BER
NAN1E
Arco — NIicronics
Gowanda Electronics
National Semiconductor
Molex. Inc.
F-Dyne Electronics
Varo Semiconductor
Hewlett-Packard Corp.
Components Corp.
ITT' Schadow. Inc.
AN1P
Erie
Bourns. Inc.. Trinipm Div.
NEC
RN1C
Advanced Micro Devices
Analog Devices. Inc.
OKI
54420
54426
54473
56289
56708
57582
61637
71450
73138
81073
91293
91506
98291
99942
S4217
NAME
Dage — NITI
Buss Fuses
Panasonic
Sprague Electric Company
Zilog. Inc.
Kahgan Electronics Corp.
Kemet-Union Carbide
CTS Corp.
Beckman Instru.. Helipot Div.
Grayhill
Johanson
Augat
Sealectro Corp.
Centralab
United Chemicon. Inc.
TABLE 6-2. REPLACEABLE PARTS
OPCODE:
94004302A
MODEL: 4200
0 REV:
6*
REFEPENCE
DESIGNATOR DESCRIPTION
COMMON CHASSIE 4200
FED.
CODE
MANUFACTURER
PART NUMBER
A5
A2( 2 )
A7( 5)
A6( 15 )
J26
PWA CONTROL
(G
( C , PUP DISPLAY
(C ) PWA P014ER SUPPLY
( G ) PWA INPUT
( G ) CONNECTOR ASSY FEMALE
04,01
04901
04901
04901
04901
0422,7400E
04235300C
04223100C
04223001B
09214101C
J1-03
J36-014
(
(
CONNECTOR ASSY FEMALE
CONNECTOR ASSY FEMALE
04 9 01
04901
09 2 1 4 1 OIC
W17
W20
W12
W13
w14
w16
W21
(G) CABLE UN/T 16
CABLE FLAT UNIT
(r2i
CABLE ASSY PS
(G, CABLE ASSY PS
CASLE ASSY PS
(C,
(G) CABLE ASSY PS
(G, CASLE ASSY PS
G
G
)
)
04901
04901
04901
TO DISPLAY
04901
TO CONTROL
04901
—CONTROL *2
04901
TO INPUT
TO INTERFACE 04901
PIN
09214101C
92004600B
920052000
57114200D
57114400C
57114500C
57114300C
571147011C
EEC
PART NUMBER
121.7
1
1
1
1
1
1
1
1
1
1
1
1
1
1
04223400E
04235300C
04223100C
04223001B
09214101C
09214101C
09214101C
920046008
920052000
57114200D
57114400C
57114500C
57114300C
57114700C
6-2. Replaceable Parts (Continued)
Section VI
Parts List
OPCODE:
04223400E
MODEL: 4200
0 REV: C*
CG) PWA CONTROL
REFERENCE
DESIGNATOR DESCRIPTION
871
Cl
C2
C3
C4-7
CR1-2
ICI
IC2
1C3
IC4
ICS
IC9
IC13
IC14
IC15
IC16
IC17
IC1S
J8
JA
J1-2
J5
LI
PS
PA
PI
P2
P3
P4
P5
GI
RI
R2-3
R4-5
R6
R7
R8
R9-11
51
XIC3
XIC6-3
XICI6
XIC18
XS1
CELL LITHIUM 3V
CAP MICA 430pF 1% 500V
CAP MICA 100pF 5% 500V
CAP TANT 15uF 107 20V
CAP EL 10uF 20% 25V
DIODE SIG 1N914
IC 7404 HEX INVERTER
RES NETWORK 4.7K 2% 1.8W
IC Z30-CPU-PS
IC 74LS42 4-10 DECODER
IC MSM5128-20-RS RAM 2K X 8
IC 4011 QUAD 2 INPUT NAND
RES NETWORK 4.7K 2% 1.8W
IC 74LS42 4-10 DECODER
IC 74LS32 QUAD 2 INPUT OR
IC 8255APC PERIPH INTERFACE
RES NETWORK 4.7K 2% 1.8W
IC S279-2 KEY8D/DISP INTERFACE
CONNECTOR 2 PIN STRAIGHT
CONNECTOR 2 PIN STRAIGHT
SOCKET IC 16 PIN
CONNECTOR 2 PIN STRAIGHT
INDUCTOR 15uH 107.
SHUNT 2 CIRCUIT
SHUNT 2 CIRCUIT
SHUNT 8 CIRCUIT
CG) CONNECTOR 5 PIN RT ANG MOD
CG) CONNECTOR 5 PIN RT ANG MOD
CC) CONNECTOR 6 PIN RT AMC MOD
SHUNT 2 CIRCUIT
TRANS NPN 2N3904
RES MF 332 OHM 1% 1/4W
RES MF 10.0K 1% 1/4W
RES MF 5.11K 1% 1/4W
RES MF 100 OHM 1% 1/4W
RES MF 10.0K 17. 1/4W
RES MF 5.11K I% 1/4W
RES MF 4.75K 1% 1/4W
SWITCH ROCKER SPST DIP
SOCKET IC 40 PIN
SOCKET IC 24 PIN
SOCKET IC 40 PIN
SOCKET IC 40 PIN
SOCKET IC 16 PIN
04236201E
MODEL: 4200
OPCODE: 0 REV:
D-
REFERENCE
DESIGNATOR DESCRIPTION
IC6A3
IC7A5
IC EPROM PROG. 3658G 4200
IC EPROM PROG. 314BG 4200
FED.
CODE
MANUFACTURER
PART NUMBER
54473
14655
14655
56289
S4217
01295
01295
01121
56708
01295
52464
02735
01121
01295
01295
34335
01121
33297
27264
27264
06776
27264
24226
27264
27264
32575
04901
04901
04901
27264
04713
19701
19701
19701
19701
19701
19701
19701
81073
06776
06776
06776
06776
06776
BR2325-1HB
CD15FD431F03
CMOZFD101J03
196D156X9020KA1
SM-25-VB-10-M
1N914
SN7404N
3168472
Z80-CPU-PS
SN74LS42N
MSM5128-20-RS
CD4011AE
3168472
SN74LS42N
SN74LS32N
AM8255APC
3168472
uPD3279C-2
22-03-2021
22-03-2021
ICH-163-53-G
22-03-2021
10M152K
15-38-1024
15-33-1024
435704-8
47733300A
477332008
47733100A
15-33-1024
2N3904
5043ED332ROF
5043ED1OKOOF
5043ED5K11OF
5043ED1OOROF
5043ED1OKO0F
5043ED5K110F
5043ED4K750F
765808
ICN-406-54-TG
ICN-246-S4-G
ICN-406-54-TG
ICN-406-S4-TG
ICN-163-S3-G
BEC
PART NUMBER
QTY
1
1
1
1
4
2
1
1
1
1
1
1
1
1
1
1
1
1
1
1
2
1
1
1
1
1
1
1
1
1
1
1
2
2
1
1
1
3
1
1
3
1
1
1
556007000
200037000
200001000
283227000
283336000
530058000
534042000
345020000
534159000
534210000
Z34304000
534022000
345020000
534210000
534163000
534171000
345020000
534211000
477361000
477361000
473042000
477361000
400373000
483253000
483253000
483226000
47733300A
477332008
47733100A
483253000
528071000
341250000
341400000
341368000
341200000
341400000
341368000
341365000
465225000
473052000
473043000
473032000
473052000
473042000
UNIQUE CONFIG PARTS 4200
FED.
CODE
MANUFACTURER
PART NUMBER
04901 53436500H
04901 53431400H
OTY
BEC
PART NUMBER
1 53436500H
1 53431400H
6-2. Replaceable Parts (Continued)
04235800C
MODEL: 4200
OPCODE:
0 REV: C*
(G) PWA DISPLAY
REFERENCE
DESIGNATOR DESCRIPTION
C3-4
CRI-13
ICI
IC2
IC3
IC4
ICS
IC6
IC7
IC8-11
JI
MI
P1
P2
QI
R4
R5
R6
R7
SI-26
XIC6
XIC8—I1
0422300113
0422300213
MODEL: 4200
CAP EL 10uF 20% 25V
LED RED DIFF 5092-4684
IC 74C48 BCD 7 SEG DECODER
IC 4051B 8 CHAN MULT/DEMULTPL
IC 4049A HEX BUFF
RES NETWORK 100 OHM 2% 1.8W
RES NETWORK 4.7K 2% 1.8W
DISPLAY NUMERIC 5082-7653
IC 8863 DRIVER
DISPLAY NUMERIC 5082-7653
SOCKET IC 16 PIN
METER MARKED
CONNECTOR 6 PIN STRAIGHT POLAR
HEADER 2 PIN RT ANGLE
TRANS NPN 2HSO88 BLUE
RES MF 9.09K I% 1/4W
RES MF 8.87K 1% 1/4W
RES MF 15.0K 1% 1/4W
RES MF 4.75K I% 1/4W
SWITCH PUSHBUTTON SPST
SOCKET IC 14 PIN
SOCKET IC 14 PIN
OPCODE:
0 REV:
C*
REFERENCE
DESIGNATOR DESCRIPTION
AR1
AR2
AR3
AR4
AR5-6
AR7
AR8-9
Cl
C2
C3
C4
C5
C6-7
C8
C9
C12
C13
C14
CI5
C16
C17
C18
C19
C20
C22
C23
C23
C26
IC 301A OP AMP
IC 311N OP AMP COMPARATOR
IC 301A OP AMP
IC 3140 OP AMP
(G) IC 356B OP AMP SELECTED
(G) IC SELECTED LF356 OPAMP
IC 3140 OP AMP
CAP CER 33pF 3% 1000Y
CAP EL 10uF 20% 25V
CAP CER 33pF 5% 1000V
CAP PE 0.01uF 10% 80V
CAP CER 130pF 107 600V
CAP CER 33pF 3:4 1000N?
CAP CER 1000pF 10% 600V
CAP MICA 1500pF 1% 500Y
CAP CER 0.01uF 100N1
CAP CER 68pF 10% 600Y
CAP PE 0.01uF 10% 80V
CAP CER 0.01uF 100V
CAP CER 68pF 10% 600V
CAP CER 2200pF 10% 250V
CAP PE 0.01uF 10% 80Y
CAP CER 330pF 10% 600V
CAP PP 0.1uF 10% 100Y
CAP PP 0.IuF 10% 100si
CAP CER 33pF 3% 1000V
CAP CER 33pF 5% 1000V
CAP CER 1000pF 10% 600V
Section VI
Parts List
(G)
FED.
CODE
MANUFACTURER
PART NUMBER
S4217
28480
27014
02735
02735
01121
01121
28480
27014
28480
06776
MODTEC
27264
06383
04713
19701
19701
19701
19701
31918
06776
06776
SM-25—VB-10—M
HLMP-1301
MM74C48N
CD4051BE
CD4049AE
3168101
3168472
5082-7653
DS8863N
5082-7653
ICN-163—S3—G
00-700-098
22-04-2061
HFAS100-2—C
2N5088
5043ED9K090F
5043ED8K870F
5043ED15KOOF
5043ED4K750F
210272
ICN-143-53—G
ICN-143—S3—G
BEC
PART NUMBER
QTY
2
13
1
1
1
1
1
1
1
4
1
1
1
1
1
1
1
1
1
26
1
4
283336000
536024000
534214000
534139000
534172000
345021000
345020000
536809000
534215000
536809000
473042000
554335004
477327000
477367000
528047000
341392000
341391000
341417000
341365000
465230000
473019000
473019000
PWA INPUT AND PWA INPUT 03 OPT
-
FED.
CODE
MANUFACTURER
PART NUMBER
27014
27014
27014
02735
04901
04901
02735
56289
S4217
56289
56289
16546
56289
16546
14655
33883
16546
56289
33883
16546
16546
56289
16546
27735
27735
56289
56289
16546
LM301AN
LM311N
LM301AN
CA3140AE
535062000
535079000
CA3140AE
10TCC—Q33
SM-25—‘18-10—M
10TCC—Q33
192P1039R8
CE-151
10TCC-033
CE-102
C019FD152F
BT 25U
DTZ-68
192P1039R8
8T 25U
DTZ-68
CF-222
192P1039R8
CE-331
PP11—.1-10-100
PP11—.1-10-100
10TCC—Q33
10TCC-033
CE-102
BEC
PART NUMBER
QTY
1
1
1
1
2
1
2
1
1
1
1
1
2
1
1
1
1
1
1
1
1
1
1
1
1
1
1
1
535012000
535034000
535012000
535050000
535062000
535079000
535050000
224139000
283336000
224139000
234092000
224314000
224139000
224310000
200531000
224119000
224312000
234092000
224119000
224312000
224309000
234092000
224313000
234148000
234148000
224139000
224139000
224310000
6-3
Section VI
Parts List
6-2. Replaceable Parts (Continued)
042230018
042230028
4200
MODEL:
OPCODE:
REFERENCE
DESIGNATOR DESCRIPTION
C27-34
C35
C36
C37
IC1
IC2
IC3
ICS
IC6
IC7-8
IC9-10
IC11
IC13-14
P2
RI
R2
R3
R4
R5
R6
R7
R8
R9
RIO
R11
R12-13
R14
RI3
R16
R17
R18-19
R20
R21
R22
R23
R25
R26-28
R30
R32
R34
R35
R36
R37
R38
R39
R40
R42
R44
R45
R47
R48
R49-52
R53
R54
R55
RT1
X14
XAR4-7
XICI
XIC2
XIC6
XIC9-10
6-4
0 REV:
C"
(G)
PWA INPUT AND PWA INPUT -03 OPT
FED.
CODE
CAP EL 10uF 20X 25V
S4217
CAP CER 150pF 107. 600V
16546
CAP EL 100uF 20X 25V
S4217
CAP CER 1000pF 107. 600V
16546
IC 8255APC PERIPH INTERFACE
34335
IC 565 D/A CONVERTER 12 BIT
51640
IC 40538 TRPL DECDR/DEMULTPXR
04713
IC 4047A MULTIVIB (RCA ONLY)
02735
IC 40518 MULTIPLEXER RCA ONLY
02735
IC 40138 DUAL FLIP FLOP
02735
(C.) IC 40168 QUAD SWITCH
02735
IC 40758 TRPL 2 INPUT OR
02735
IC 4051E MULTIPLEXER RCA ONLY
02735
(G) CONNECTOR 6 PIN RT ANG MOD 04901
RES VAR 100 OHM 10% 0.5W
73138
19701
RES MF 2.67K 1% 1/4W
19701
RES MF 1.00K 1% 1/4W
RES MF 100 OHM 1% 1/4W
19701
RES MF 10.0K I% 1/4W
19701
19701
RES MF 5.11K IX 1/4W
RES MF 10.0K 1% 1/49
19701
RES MF 8.25K 1X 1/49
19701
19701
RES MF 10.0K 1% 1/49
01121
RES COMP 3.0M 5% 1/4W
RES VAR 50K 10% 0.5W
73138
14674
RES MF 1.00M 1X 1/4W
RES MF 237K 1Z 1/4W
19701
RES MF 249K 1% 1/4W
19701
19701
RES MF 12.1K 1% 1/49
19701
RES MF 806K IX 1/49
01121
RES COMP 12M 5% 1/4W
19701
RES MF 1.82K 1X 1/4W
19701
RES MF 20.0K I% 1/49
19701
RES MF 221K 1% 1/4W
14674
RES MF 1.00M IX 1/4W
14674
RES MF 1.00M IX 1/4W
19701
RES MF 100K 1X 1/49
19701
RES MF 100K 1% 1/4W
19701
RES MF 9.09K IX 1/49
19701
RES MF 10.0K 1% 1/49
19701
RES MF 5.11K 1% 1/49
73138
RES VAR 10K 10% 0.59
19701
RES MF 3.92K IX 1/49
19701
RES MF 7.87K IX 1/4W
19701
RES MF 80.6K IX 1/4W
19701
RES MF 806K 1X 1/4W
19701
RES MF 7.50K 1% 1/4W
73138
RES VAR 200K 10% 0.59
73138
RES VAR 10K 10% 0.39
19701
RES MF 3.92K IX 1/4W
19701
RES MF 909K 1X 1/4W
19701
RES MF 47.5K 1X 1/4W
19701
RES MF 100K 1X 1/4W
19701
RES MF 200K IX 1/4W
73138
RES VAR 10K 10% 0.59
00241
THERMISTOR 50 OHM 10%
06776
SOCKET IC 6 PIN
06776
SOCKET IC 8 PIN
06776
SOCKET IC 40 PIN
06776
SOCKET IC 24 PIN
SOCKET IC 16 PIN
06776
SOCKET IC 14 PIN
06776
MANUFACTURER
PART NUMBER
SM-25-VB-10-M
CE-151
sm-25-ve-l00 -m
CE-102
AM8255APC
AD565AJD
MC14053BCP
CD4047AE
CD405IBE
CD4013BE
CD4016BE
CD4075BE
CD4051BE
47733100A
72PR100
5043ED2K670F
3043EDIK000F
5043ED1OOROF
5043ED1OKOOF
5043ED5K110F
5043ED1OKOOF
5043ED8K250F
5043ED1OKOOF
C83053
72PR5OK
5043ED1M000F
5043ED237KOF
5043ED249KOF
5043ED12K1OF
5043E0806KOF
CB1265
5043ED1K820F
3043ED2OKOOF
5043E0221KOF
5043ED1M000F
5043EDIM00OF
5043ED1OOKOF
5043ED1OOKOF
3043ED9K090F
5043ED1OKOOF
5043ED5K110F
72PR1OK
5043ED3K920F
3043ED7K870F
5043ED80K60F
5043ED806K0F
5043ED7K3OOF
72PR200K
72PR1OK
5043ED3K920F
5043ED909K0F
5043ED47K50F
5043EDI00KOF
5043ED20OKOF
72PR1OK
L815J1-M
ICN-063-S3TG
ICN-083-S3-G
ICN - 406-S4-TG
ICN-246-S4-G
ICN-163-S3-G
ICN-143-S3-G
BEC
PART NUMBER
QTY
8
1
1
1
1
1
1
1
1
2
2
1
2
1
1
1
1
1
1
1
1
1
1
1
1
2
1
1
1
1
2
1
1
1
1
1
3
1
1
1
1
1
1
1
1
1
1
1
1
1
1
4
1
1
1
1
1
4
1
1
1
2
283336000
224314000
283334000
224310000
534171000
421034000
534207000
534229000
534209000
534205000
534218000
534206000
534209000
47733100A
311408000
341341000
341300000
341200000
341400000
341368000
341400000
341388000
341400000
343646000
311393000
341600000
341536000
341538000
341408000
341587000
343708000
341325000
341429000
341533000
341600000
341600000
341500000
341500000
341392000
341400000
341368000
311328000
341357000
341386000
341487000
341587000
341384000
311401000
311328000
341357000
341592000
341465000
341500000
341529000
311328000
325007000
473054000
473041000
473052000
473043000
473042000
473019000
6-2. Replaceable Parts (Continued)
OPCODE: 0 REV: AA
042361000
MODEL: 4200
(G) INPUT REST. NETWORK ASSY
FED.
CODE
REFERENCE
DESIGNATOR DESCRIPTION
R29
R31
R33
RES MF 110K 1% 1/3W
RES MF 110K 1% I/3W
RES MF 2.10K 1% 1/3W
OPCODE: 0 REY: A*
04222502A
MODEL: 4200
OPCODE:
FED.
CODE
0 REV: A*
042360000
MODEL: 4200
REFERENCE
DESIGNATOR DESCRIPTION
A3(4)
C6
J1
J2
(G) PWA CALIBRATOR
CAP FT 1000pF 20X 500V
CONNECTOR HOUSING
CONNECTOR TYPE "N"
MANUFACTURER
PART NUMBER
BEC
PART NUMBER
QTY
1 04216102A
PWA CHOPPER DUROID
CAP PP 0.1uF 10% 100V
(G) IC SELECTED QUAD SWITCH
TERMINAL .040 OD .270 LG .062M
CONNECTOR PIN
RES MF 51.1K 1% 1/4W
RES VAR 23K 10% 0.5W
RES MF 51.1K 1% 1/4W
SOCKET IC 14 PIN
OPCODE: 0 REV: A*
1 338504000
1 338504000
1 338331000
04901 04216102A
REFERENCE
DESIGNATOR DESCRIPTION
C1-2
IC1
PI
P2/1-2/2
R3
R4-5
R6
XIC1
BEC
PART NUMBER
QTY
CHOPPER MODULE
PWA CHOPPER DUROID
04216102A
MODEL: COMMON
MANUFACTURER
PART NUMBER
19701 5063.10110KOF
19701 5063JD110KOF
19701 50634D2K1OOF
REFERENCE
DESIGNATOR DESCRIPTION
A4
Section VI
Parts List
FED.
CODE
MANUFACTURER
PART NUMBER
27735
04901
98291
71279
19701
73138
19701
91506
PP11-.1-10-100
534223000
229-1071-230
460-1521-02-03-00
5043E051K1OF
72PR25K
5043ED51K1OF
714AGID
BEC
PART NUMBER
QTY
2
1
1
2
1
2
1
1
234148000
534223000
510038000
477400000
341468000
311400000
341468000
473056000
(G) CALIBRATOR ASSY 4200
FED.
CODE
MANUFACTURER
PART NUMBER
04901
TUSONX 2499-003-X5S0102M
27264 22-01-2021
24931 23JR109-3
BEC
PART NUMBER
OTY
1
1
1
1
04222700B
227105000
479415000
479219000
6-2. Replaceable Parts (Continued)
Section VI
Parts List
042227008
MODEL: 4200
OPCODE: 0 REV: CC
(G) PWA CALIBRATOR
FED.
CODE
REFERENCE
DESIGNATOR DESCRIPTION
AR1
Cl
C2
C3
C4
CS
C7
CS
C9
CIO
C11
C12
CR1-2
CR3
ICI
LI
L2
L3
GI
R1
R2-3
R4
R6
R7
R8-9
RIO
RI?
R12
R13
R14
R15
04223100C
MODEL: 4200
27014
33883
20307
S4217
91293
16546
S4217
33883
14655
14655
14655
91293
28480
04713
51640
24226
24226
04901
04713
19701
19701
32997
19701
19701
19701
19701
19701
19701
19701
19701
64537
IC 301A OP AMP
CAP CER 470pF 10% 500V
CAP MICA 100pF 5 300Y
CAP EL 10uF 20% 25V
CAP VAR CER 3.5-18pF 250V
CAP CER 1000pF 10% 600Y
CAP EL 10uF 207. 25V
CAP CER 0.01uF 100V
CAP MICA 36pF 5% 300Y
CAP MICA 200pF 5% 100V
CAP MICA 10pF 5% 300V
CAP VAR CER 3.5-18pF 250V
DIODE HSCHI001 C1N6263)
DIODE MV-1650
IC AD581JH VOLT REF
INDUCTOR 4.7uH 10%
INDUCTOR 0.56uH 10%
INDUCTOR 0.033uH 10%
TRANS NPN 2N3904
1/4W
RES MF 1.50K 1
RES MF 100K 1% 1/4W
RES VAR 1K 10% 0.5W
RES MF 100K I% 1/4W
RES MF 2.43K 1% 1/4W
RES MF 1,00K 1% 1/4W
RES MF 10.0K 1% 1/4W
RES MF 5.11K 1% 1/4W
RES MF 1.21K I% 1/4W
RES MF 1,30K I% 1/4W
RES MF 75.0 OHM 1% 1/4W
RES MF 50 OHM 0.1% 1/4W
OPCODE: 0 REV: D*
BEC
PART NUMBER
QTY
LM301AN
TYPE JF
DM5-FC101J
SM-25-VB-10-M
9373
CE-102
SM-25-VB-10-M
BT Z5U
CD5EC360J
CDSFA201J
CD5WCCI00J
9373
HSCH-1001
MV1650
AD58IJH
10/471
10/560
400386000
2N3904
5043EDIK500F
5043ED1OOKOF
3299X-1-102
5043ED100KOF
RNSSD-2431-F
5043EDIK000F
5043EDIOKOOF
5043ED5KI1OF
5043ED1K210F
5043ED1K300F
5043ED75ROOF
PME55-T0
1
535012000
1 224219000
1 203006000
1 233336000
1
281011000
1 224310000
1 283336000
1 224119000
1 205003000
1 205024000
1 205002000
1
231011000
2 530174000
1 530762000
1 535053000
I 400384000
1 400382000
1 400386000
528071000
1
341317000
1
2 341500000
1
311410000
1
341500000
1 341337000
2 341300000
1 341400000
1 341368000
1 341308000
341311000
1
341184000
1
1 325916000
(G) PWA POWER SUPPLY
REFERENCE
DESIGNATOR DESCRIPTION
A13(2)
AR1
C1-2
C3
C4
CZ-6
C7
CS
C9
CR1
CR2
CR3-6
ICI
IC6
P1
P4-5
P7-10
MANUFACTURER
PART NUMBER
(G) HEAT SINK ASSEMBLY
IC 339 QUAD COMPARATOR
CAP EL 2200uF -10%+50% 35V
CAP EL 4700uF -10%+50% 16V
CAP EL 10uF 20% 25V
CAP EL 100uF 20% 25V
CAP EL 1000uF -10%4.50% 10V
CAP CER 3300pF 10% 100V
CAP EL 100uF 20% 25V
DIODE BRIDGE KBP-02
DIODE BRIDGE VS-248 6A 200 PIV
DIODE SIG 1N4001
IC 78L05 VOLT REG
IC 40138 DUAL FLIP FLOP
HEADER 5 PIN STRAIGHT
CONNECTOR 6 PIN STRAIGHT POLAR
CONNECTOR 6 PIN STRAIGHT POLAR
FED.
CODE
04901
27014
57582
S4217
54217
S4217
56289
61637
54217
15281
27777
04713
07263
02735
06383
27264
27264
MANUFACTURER
PART NUMBER
042232008
LM339N
KSMM-2200-35
SM-25-VB-100-M
SM-25-VB-10-M
SM-25-VB-100-M
513D108M0I0DG4
CO52K332K1X5CA
SM-25-VB-100-M
KBP02
VS-248
1N4001
uA78L05AWC
CD4013BE
MPSS156-5-0
22-04-2061
22-04-2061
BEC
PART NUMBER
QTY
1
1
2
1
1
2
I
1
1
1
1
4
I
1
I
2
4
042232008
535018000
283351000
283352000
283336000
283334000
283329000
224296000
283334000
532013000
532014000
530151000
535044000
534205000
477345000
477327000
477327000
6-2. Replaceable Parts (Continued)
OPCODE:
04223100C
MODEL: 4200
0 REV: D*
REFERENCE
DESIGNATOR DESCRIPTION
RI
R2
R3
R4
R3
R6-8
R9
RIO
R11
R12
R13
R14
R15
R16
R17
R18
R19
RES
RES
RES
RES
RES
RES
RES
RES
RES
RES
RES
RES
RES
RES
RES
RES
RES
MF 10.0K 1% 1/4W
MF 4.99K 1% 1/4W
MF 2.21K 1% 1/441
MF 12.7K 1% 1/4W
VAR ZOO OHM 10% 0.3W
MF 4.99K 1% 1/4W
MF 1.00K 1% 1/4W
MF 453 OHM 1% 1/4W
VAR 100 OHM IO% 0.5W
MF 464 OHM 1% 1/4U
MF 100K 1% 1/4W
COMP 330 OHM 5% 1W
MF 5.11K 1% 1/4W
MF 2.21K 1% 1/4W
MF 2.80K 1% 1/4W
MF 5.11K I% 1/4W
MF 51.1K 1% I/4W
OPCODE: 0 REV BD
04223200B
MODEL: 4200
REFERENCE
DESIGNATOR DESCRIPTION
IC2
IC3
IC4
IC5
IC
IC
IC
IC
78MGUIC VOLT REG FOS
79MGUIC VOLT REG NEG
78GUIC VOLT REG
79MGUIC VOLT REG MEG
OPCODE: 0 REV: AD
46528900B
MODEL: 4200
REFERENCE
DESIGNATOR DESCRIPTION
SI
SWITCH ROCKER DPDT
04235601A
MODEL: 4200-S16
OPCODE: 0 REV: C*
REFERENCE
DESIGNATOR DESCRIPTION
P7
S2
CONNECTOR LINE CORD
SWITCH DUAL SLIDE DPDT-DPDT
Section VI
Parts List
(G) PWA POWER SUPPLY
FED.
CODE
MANUFACTURER
PART NUMBER
19701
19701
19701
19701
73138
19701
19701
19701
73138
19701
19701
01121
19701
19701
19701
19701
19701
5043ED1OKOOF
5043ED4K990F
5043ED2K210F
5043ED12K7OF
72PR500
5043ED4K990F
5043ED1KOOOF
5043ED453ROF
72PR100
5043ED464ROF
5043EDIOOKOF
GB3315
3043ED5KI1OF
3043ED2K210F
5043ED2R8000F
5043ED5K110F
5043ED51K1OF
BEC
PART NUMBER
QTY
1
1
1
1
1
3
1
1
1
1
1
1
1
1
1
1
1
341400000
341367000
341333000
341410000
311305000
341367000
341300000
341263000
311408000
341264000
341500000
302087000
341368000
341333000
341343000
341368000
341468000
(G) HEAT SINK ASSEMBLY
FED.
CODE
07263
07263
07263
07263
MANUFACTURER
PART NUMBER
BEC
PART NUMBER
QTY
1
1
1
I
uA78MGUIC
uA79MGUIC
uA78GUIC
uA79MGUIC
535042000
535043000
535055000
535043000
(G) SWITCH CABLE UNIT
FED.
CODE
MANUFACTURER
PART NUMBER
QTY
13812 572-2121-0103-010
BEC
PART NUMBER
1 463286000
(G) REAR PANEL UNIT
FED.
CODE
MANUFACTURER
PART NUMBER
82389 EAC309
82389 47206LFR
QTY
EEC
PART NUMBER
1 477281000
1 465279000
6-2. Replaceable Parts (Continued)
Section VI
Parts List
04235501A
MODEL: 4200-S16
OPCODE:
0 REV: 13*
(C) REAR PANEL ASSY
REFERENCE
DESIGNATOR DESCRIPTION
Fl
J10
J15
J20
T1
FUSE 0.3 AMP 230V MDL
CONNECTOR 5 CIRCUIT
CONNECTOR PIN FEMALE
CONN COAX 8NC
TRANSFORMER POWER
OPCODE:
042317018
MODEL: 4200
4 REV:
EC
(G)
REFERENCE
DESIGNATOR DESCRIPTION
C1
C2-3
CRt
J1
P2
Rt
St
Ut
U2
U3
U4
US
U6
U7
XSI
XU1
XU4
XU5-7
CAP TANT 1.0uF 10% 35V ONLY
CAP EL 10uF 20% 23V
DIODE SIC 1N914
CONNECTOR 24 PIN (GPIB)
(G) CONNECTOR 5 PIN RT ANG MOD
RES NETWORK 4.7K 2% 1.8W
SWITCH SLIDE DIP SPST X 7
IC EPORM PROG. 3228G 4200-01A
IC 74LS32 QUAD 2 INPUT OR
IC 74LSO4 HEX INVERTER
IC 9914AHL IEEE BUS PROCESSOR
IC 74LS373 OCTAL LATCH
IC 75160 IEEE BUS TRANSCEIVER
IC 75161 IEEE BUS TRANSCEIVER
SOCKET IC 8 PIN
SOCKET IC 24 PIN
SOCKET IC 40 PIN
SOCKET IC 20 PIN
04223500A
MODEL: 4200
OPCODE:
mm. mr-,=NCm
DESIGNATOF DESOFIF7ION
A
B
CI
C3
C5
C7-12
J2
P1
R1
R2
R3-4
FA1
RA2
4 REV: E9
FED.
CODE
MANUFACTURER
PART NUMBER
34426
06383
27264
34420
04901
MDL 0.3
CE156F24-3-C
0206-1231
UG-623/U
44609100A
PWA INTERFACE
BEC
PART NUMBER
OTY
1
1
1
1
1
343307000
479394000
479320000
479123000
44609100A
4200 01 A OPT
-
FED.
CODE
MANUFACTURER
PART NUMBER
56289
S4217
01295
32375
04901
01121
75378
04901
01295
01295
01295
01295
01295
01295
91506
06776
06776
06776
196010:n.003311AI
SM-25-‘,8-10-M
114914
552230-1
47733300A
3168472
206-7-LP
53432200H
SN74LS32N
SN74LSO4N
TMS9914AHL
SN74LS373N
SN75160BN
SN731618N
508-AG7D
ICH-246-54-G
ICN-406-54-TG
ICN-203-S3-G
BEC
PART NUMBER
QTY
1
2
1
1
1
1
1
1
1
1
1
1
1
1
1
1
1
3
283216000
283336000
530058000
479330000
47733300A
345020000
46530007A
53432200H
534168000
534153000
334288000
334237000
534286000
334287000
473053000
473043000
473052000
473065000
PWA INTERFACE 4200-019 OPT
FED.
CODE
27264
CONNECTOR 2 PIN STRAIGHT
27264
SHUNT 2 CIRCUIT
27244
CONNECTOR 2 PIN STRAIGHT
20707
CAP MICA 47pF 5% 300V
56239
CAP TANT 1 .0uF 10% 55V
042 1'2
CAP CE R 0.1uF 207% 50V
$4217
CAP EL 10uF 207% 23V
04222
CAP CEP. 0.1uF 207% 50V
CONNECTOR 24 PIN (GPIB)
(G) CONNECTOR 5 PIN PT ANC MOD 04901
14674
RES MF 1.00M 17. 1/4W
19701
FES MF 20.5 OHM 17% 1/4W
1 9 701
RES MF 4.75K 1% 1/4W
01121
RES NETWORK 4.7K 2% 1.3W
01121
RES NETWORK 22! 2% 1.7W
MANUFACTURER
FART NUMBER
22-05-2021
15-33-1024
22-05-2021
DM5-EC470J
154D106;<903FE4
SR215E104MAA
SM-25-VB-10-M
SR215E104MAA
552250-1
5045ED1MOOOF
5043ED20R5OF
5043ED4K750F
314E472
40SE223
EEC
PART NUMBER
OTY
1
1
1
1
1
1
1
6
1
1
1
1
2
1
1
477361000
483255000
477341000
205018000
235353000
224263000
233336000
2'4268000
479350000
4:. :300A
541500000
5 4 1130000
741365000
345020000
34504412A
6-2. Replaceable Parts (Continued)
u4223500A
MODEL: 4200
OPCODE:
4 REV: EB
PWA INTERFACE 4200-01B OPT
FED.
CODE
R=r-mENCE
DESIGNATOR DESCRIPTION
31
U1-2
U3-4
U5
N6
U7
US
U9-10
U11
U12
U15
U16
U17
U13
XU1-2
XU3-4
XU5
NU7
xue
xue-lo
XU11
XU12
XU14
XU15
XU16
XU17-18
Y1
991006I4C
CKT PIANO
SNITCH DIP SPST
IC 32C55 INTERFACE
IC 74HCO4 HEX INVERTER
IC 7705 SUPPLY VOLTAGE SUPVR
IC 74HC74 DUAL D TYPE FLO
IC .7.30C CPU CMOS
IC EPROM PROG 452AA 4200
IC 74HC32 QUAD 2 INPUT OR
IC 5564 8Kx2 RAM CMOS 28 DIP
IC 74HC179 DUAL 2-4
IC 74HC240 OCTAL BUS
IC 9914ANL IEEE BUS PROCESSOR
IC 75160 IEEE BUS TRANSCEIVER
IC 75161 IEEE BUS TRANSCEIVER
SOCKET IC 40 PIN
SOCKET IC 14 PIN
SOCKET IC 3 PIN
SOCET IC 14 P:N
SOrKET IC 40 PIN
SOCKFT IC 23 PIN
SOCKET IC 14 PIN
SOCKET IC 23 PIN
SOCKET IC 16 PIN
SOCKET IC 24 PIN
SOCKET IC 20 PIN
:SOCKET IC 40 PIN
SOCKET IC 20 PIN
CRYSTAL 3.579545 MH=
OPCODE: 0 REY: A*
Section VI
Parts List
MANUFACTURER
PART NUMFER
BEC
PART NUMSER
QTY
LAMB
34371
02735
01295
02735
TOSHIS
BT-8-2
CP82C55A
CD74HCO4E
TL7705ACP01295
CD74HC74E
TMP.234COOAP
04901
53445200A
0277.5 CD74HC32E
TOSHIE TC.5564PL-15
02735 CD74HC139E
02735 CD74HC240E
01295 TMS9914AHL
01295 SN75160BH
01295 SN75161BN
06776
ICN-406-S4-TG
06776
ICN-143-1-13-G
06776
ION-007-33-G
ICN-147-S3-G
06776
ICN-406-S4-TG
06776
ICN-286-34-TG
06776
06776
ICN-143-S3-G
ICN-236-S4-TG
06776
06776
ICN-I63-S3-G
06776
ICN-246-34-G
06776
ICH-203-37-G
ICN-406-S4-TG
06776
ICN-203-33-C
06776
EDMAR MCICO35A
1
2
2
1
1
1
1
2
1
1
1
1
1
1
2
2
1
1
1
1
?
1
1
1
1
1
2
1
46.529908A
53441100A
53442504A
53442200A
53442502A
53440900A
53445200A
53442501A
534403000
.53442500A
53442503A
574238000
534286000
534287000
473052000
473019000
473641000
473019000
473052000
473044000
473019000
473044000
473042000
473043000
477.065000
473052000
473065000
547035000
4200-01B
MODEL: 4200
REFERENCE
DESIGNATOR DESCRIPTION
IC6A5
IC7A5
042230028
MODEL:4200
IC EPROM PROG 450AA 4200
IC EPROM PROG 451AA 4200
OPCODE: 0 REV: D*
REFERENCE
DESIGNATOR DESCRIPTION
FED.
CODE
MANUFACTURER
PART NUMBER
QTY
BEC
PART NUMBER
1 53445000A
1 53445100A
04901 53445000A
04901 53445100A
PWAINPUT-03OPT
FED.
CODE
MANUFACTURER
PART NUMBER
OTY
BEC
PART NUMBER
Same as standard PWA Input P/N 04423002B
6- 9
6-2. Replaceable Parts (Continued)
Section VI
Parts List
OPCODE:
04232002A
MODEL: 4200
3 REV: D-
REAR INPUT 4200-04 OPT
REFERENCE
DESIGNATOR DESCRIPTION
FED.
CODE
MANUFACTURER
PART NUMBER
<401)
<402)
<403)
<404)
<405)
<406)
<407)
<408)
<409)
(410)
(411)
02660
06915
06915
80-75-CCC1
HUC-2
HUC-4
02660
78189
04901
04901
83330
04901
04901
41-16
1223-02
09214101C
72088600A
654
571157000
81211900C
CAP AND CHAIN
CABLE CLIP 1/8"
CABLE CLAMP 1/4"
SCREW 4-40 X 1/4 BH SS SENS
NUT HEX 5/8-27 X 3/32 X 3/4
WASHER LOCK 5/3 INT
(G) CONNECTOR ASSY FEMALE
PLATE CONN UNIT
PLUG BUTTON 5/3"
CABLE INPUT
SHIELD
OPCODE:
99100624C
MODEL: 4200
0 REV: 8*
REFERENCE
DESIGNATOR DESCRIPTION
IC6A5
IC7A5
U8A23
U14A23
IC
IC
IC
IC
EPROM
EPROM
EPROM
82C54
PROG 427AA 4200
PROG 428AA 4200
PROG 429AA 4200
TIMER
SEC
PART NUMBER
QTY
1
1
1
1
1
1
1
1
1
1
1
477155000
810099000
810100000
911002000
745270000
843038000
09214101C
72088600A
755107000
571157000
81211900C
4200-018-06 OPT
FED.
CODE
MANUFACTURER
PART NUMBER
04901
04901
04901
34371
53442700A
534428004
53442900A
CP82C54
BEC
PART NUMBER
QTY
1
1
1
1
534427004
53442800A
534429004
534410004
Section VII
Schematic Diagrams
SECTION VII
SCHEMATIC DIAGRAMS
Schematic Diagrams
7- I
7-2
7-3
7-4
7-5
7-5
7-6
7-6
7-7
7-8
Main Frame A I, Schematic Diagram
Display Board A2, Schematic Diagram
Power Reference Board A3, Schematic Diagram
Chopper Board A4, Schematic Diagram
Control Board A5, Schematic Diagram (Sheet I of 2)
Control Board A5, Schematic Diagram (Sheet 2 of 2)
Input Module Board A6, Schematic Diagram (Sheet I of 2)
Input Module Board A6, Schematic Diagram (Sheet 2 of 2)
Power Supply Board A7, Schematic Diagram
Options, Schematic Diwzram
Page
7-3
7-5
7-7
7-9
7-11
7-13
7-15
7-17
7-19
7-21
7-1 / 7-2
Section VII
Schematic Diagrams
Al MAIN FRAME
!LINE(
S I
0
GRY
1
FRONT I
PANEL I
A3 J2
J1126)
BLK
A3
ISV CALIBRATOR
P.C. B
I
TO
FRONT
PANEL
PWR
REF
Fl
BLK
NOT USED IN 9200
1GNO
1;7 '4.2
VOLTS 210%1100/120 1 220 /240 1 50-4 00 Hz
0.3A 1 0.2A 1 24VA
FUSE
t
A7 P8, (28)
5
100/220 I
1
100/120
TO A6
V/20J2812131 W20 W20J30(30) INPUT PCB ON
OPTIONS MAIN
FRAME SCHEMATIC
<7.■
t•fn
3
4
120/240 i
i
PIO ( 9) ,W2I J29(291 W21 W2I J31(31),.
TO A23
\ INTERFACE PCB
5
I
A7
POWER
SUPPLY
P.C.a
220/240
GRN
4.1
A7 P9 (13)
W13313(13)
W13 V4133181181
3
A7 P4 (141
A5 P2 (181
/3
WI4J14(141
W14
A5 P4 (19)
WI4J19 (191
AS
CONTROL
P.C.B
A5P3
TO
> REAR CO
PANEL
5
• 1
afk.
nl
aY
5.1!!
NI
NI
ml
NOTES.
I.
I
DENOTES EXTERNAL MARKINGS.
A7 P6(15)
4I-2A DETECTOR
CABLE
Amphenol 80-MC2M
CNIA-type Male Plug
W15J15 (IS) WIS WI5J20(20)
R ECORDE R A
>>
TO
, REAR
PANEL
I
■0
a. I
I
<I
A7 P7(161
W(6J16 (161 WIG
>>
W16J21(21) A6 P2(21)
/5
I
AG
INPUT
•P.0
E83127113
Figure 7-1 Main Frame Al, Schematic Diagram
7-3/7-4
Section VII
Schematic Diagrams
AZ DISPLAY P.C.80ARO
REC
OUT
R4
9.096
-I V GNO •SV P2(26)
PltIrT 11
•%
2
-
I ORN
ISV
MI
R5 1,64
8.876
T. T'?:
35V
:
4
1.2
131
000
J1122)
AN
ICI
tam 74C4eN N
▪2
G
00
9 2)
93 > 3
•C
10
6
c
15
•
INPUT
88
V CC
rt-2>
21_11
15 I
e
II
2
1
au
9
131 10
ea
8
I
7
2
de
9
e
II
e
eI
13
0
7
2
II
506I2C-1 633
do
9
IC 11
5062 -7653
c am 13
coNia.
r1
"
COM COM
13
10
7
9
3L1
1
I
IC•
9
=t7;
0
I
I
14
• 5v
91
116
I5K
SV
I
1
•
Ca'4171:1
C0141--•
C0144.
898-3 8100
,
9
8I 7
IC9
5082-7653
COm
13I
41
01 ) 9
IS
ICS
3082 -7653
1
21
NO
> 16
C01.4../
co .4.
iC 6
5062-7653
3.
(p<
I
So
at
21150811
21_ I
•
) 4
10 a
52>
2
•
CRI
• 5V
So ) 6
) IO
84) 9
3) it #
•
18!
21
13
2 , 12 #
A O) '4
0133
7
Our.
II
6
10 l
7
131
IC5
•
9
598-3-13416
8
3
16
I
15
2
I
OUT 3 1—
®
OUT 2 4
,
0368636
OUT I '
•i 1144
il I
OUT7 14
iN5
0
131
OUTS
I2
15 1I117
OUTS
16
OUTS
Ill INK
61 183
C11151
•
GEO
CR2 "'
N)
•
• i ; IS
Vss
4
CR9 ';'`‘
ECEI
R3 \\
CR7
PCB
10 ?
2
CR4'.
Ma
CRIO'
ECEI
c ... NI•
"1
vo o
NOTE
CINViD
I. S5 USED ON 4200 SERIES ONLY.
000
NOTE 3
14;0
LSO
c /8
6,
P2(2
L
NOTESI
L CAPACITANCE VALUES IN • F UNLESS OTHERWISE SPECIFIES
JI (221
CONNECTS TO
AI wi7P131273
ON FRAME SCHEMATIC
8312 71
SHY I OF T
P11(71
CONNECTS TO
A1612.1171171
ON FRAME SCHEMATIC
1131271
SHT. I OF 7
P2126)
CONNECS TO
A3 w194 11261
ON FRAME SCHEMATIC (•II
831271
SHT. I OF 7
ICII
IC IO
5
•
1C9
IC8
IC6
3
2
1
EL /C
0
OP-
2. RESISTANCE VALUE IN OHMS UNLESS OTHERwiSE SPECIFIED
3. ALL LES'S TO BE TYPE HL/AP-1301 UNLESS OTHERWISE SPECIFIED
C831275A
4 = EXTERNAL MARKINGS.
• • •
S. •
• USED ON 9200 SERIES ONLY
6. LAST NUMBERS USED:
Re CR13 526 ICII
•• •. 7. USED ON 4200 SERIES ONLY.
E831271B
Figure 7-2 Display Board A2, Schematic Diagram
7-5/ 7-6
Section VII
Schematic Diagrams
A3 CALIBRATOR
R2
100K
RC. BD.
C.R2
HSCH -1001
74V
C9
36
T
CI
470
C2
_1/C4
too
ILI
3.5-18
L2
0.5604
H
L3
0.033µH
RI5
50
=vv..
T
J2
I
POWER
REF
CIO
200
•
1
-3.5 V
/
8
Al
LM301AN
R3
100K
R6
100K
6
C5
1000
R9
IK
01
2N3904
7
3
R8
1K
1 CII
10
_11C12
7^ 3.5-18
CR3
MV 1650
- 4V
-I5V
C3
T+
RII
5.11K
10ALF
25
RIO
10K
CRI
R14
75
RI3
1.3K
T
s
C8
0.01 p.F
HSCH-1001
r--
CV
■—•
ICI
A058IJH
ce)
R4
IK
RI
1500
R7
2.43K
1
-10 V
•
C7
10µF
R12
1.2 K
25 V
vor
)11- 1
B831274A
C6
1000
0
NOTES:
ORN
1.
CAPACITANCE VALUES IN
OTHERWISE SPECIFIED.
2.
RESISTANCE
3.
I
4.
LAST NUMBERS
RI5
C12
5.
NUMBERS NOT USED
I
VALUES
IN
pF,
UNLESS
JI (26)
OHMS.
EXTERNAL MARKINGS.
-I5V
JI (26)
CONNECTS TO
A2 P2(26)
ON FRAME SCHEMATIC
831271
SHT. I OF 7
USED:
R5
D831271A
Figure 7-3 Power Reference Board A3.
Schematic Diagram
7-7 7-8
Section VII
Schematic Diagmms
A4 CHOPPER P.C. BD.
PI
I
> TO AMP
SEE NOTE 3
NOTE 8
<
RED
0
R2-I
9
2
I/0
I/0
IC la
• IN523213
•
!Cie
13
• • • • • •
t.i._t •
•
CRI
CTRL
CTRL
CI
A •
J.
-4117
0.1m.F
• • • • •
7
6
CD40168E
I/0
I/0
8
I
PI
'SENSOR
<
I
5V
VS
> TO AMP
R3
> 51.IK
4
7
±
MI
R6
51.IK
SEE NOTE 2
>
• • • • • •
•
CR2
• I N52328 A .
• • • • • •
NOTE
L CRI AND CR2 USED ON 92E-S5 ONLY.
,--••
I/0
I/0
C2
0.1p.F
IC Id
1C1b
5
12
CTRL
2. R7 AND R8 USED WITH 4210-7E AND
4210-8E ONLY.
4
<
WHT
0
14
V
CTRL
I/0
B831045G
M2
10
3
83I045G
PI
CONNECTS TO
A6JI
ON FRAME SCHEMATIC
831271
SHT. I OF 7
AND
A6 JI
ON OPTION FRAME
SCHEMATIC
831099
AND
A2 J2
ON FRAME SCHEMATIC
831170
SHT. I OF 3
OD
+5 V
I/0
II
P2-2
NOTES:
I.
2.
RESISTANCE VALUES IN OHMS .
..+,
• Ig.
FACTORY SELECTED.
3.
CAPACITANCE IS PART 0 P.C. BD. CIRCUITRY.
4.
=I EXTERNAL MARKING.
5 . LAST NUMBERS USED:
R8
6. NUMBERS NOT USED:
RI, R2
• •••
• USED ON 92E-S5 ONLY.
• •••
SCHEMATIC,CHOPPER PC.130.
D83127I 0 SHT. 4 OF 7
7 •
D831271D
8. RES R7,R8 USED ONLY WITH 4210-7E
AND 4210 - 8E SENSORS.
Figure 7-4 Chopper Board A4. Schematic Diagram
7-9/7-10
•
Section VII
Schematic Diagrams
42(23)
A5 CONTROL P.C. BOARD
16:
COM
BLKT
•
<
4
30
29
TO PI (241,136 6
7
28
8
27
• C6
T Ay
•
•
T
9
9
10
8
TO P1(241,07
10TO P1(241,40
25V TO P1(24),A1
TO IC3,PIN 31
11
TO IC3,PIN 326 P1(241,42
N/C
31
TO JI,P1N4 &PI (24),D6
.5.2V <
IC4 _It CS
10 10
25V T25V
32
TO 41,PIN26pi(24),o3
P2(18)
4 BLU
5
TO JI,PIN58113 1(241,02
TO J1 ,PIN1 8112 1(241,04
• 5.2V
• 5.2V <
(24),0,
33
TO J1 ,PIN8
TO IC3,PIN 33
3
N/C (---
api (24),A3
TO 1C3,PIN3411 P1(241,44
2
34
TO JI,PIN781 P1(241,130 7
P2(181
CONNECTS TO
Al WI3 .118 (18)
ON FRAME SCHEMATIC
831271
SHT. 1 OF 7
0
D80
13
GB!
40 OUT
2
D3
DE12
RL!
15
14
13
1C14
I 5
C SN74LS42N 4
GNO
16 VCC
12
17
D8
18
D6
19
07
AO
3
P1(24)
Al
1C16
AM 8255
Fi7 < 39
CSAN!
VCC
39
CSAN0
5
A 37 'RD
RO
36
"Y
-74" < 36
PC0
, 40
PC!
AN c.
PC2
TO IC3 ,PIN 22 WR
PC3
8
■■••■■11
0
•
TO IC3,PIN 20 IORO.
IC15 b
13
TO IC3,PIN 21 RD
PC4
IC154
SN74LS32N
12
Pep
PB!
11
PB6
P137
2
TO PIN 30,40-4
7
6
5
4
TO PIN 33, Ay.
TO PIN 34,44•
TO PIN 35, A 3-•
1C3 TO PIN36,46•
TO PIN 37, A7
ICI•
NOTES:
Pi(241
J2 (231
i
1
44
)
-
4.
TO PIN 39,49
TO PIN40,4!0-*-
IC13
RII
4.7K
30
IC18
32
p.PD8279C-5 "0
2
SD
35
33
SL3
SLI
22
28
CS
83
31
8
9
34
RESET
SL2
36
rio-- SHIFT
CLK
PTO P1(24),PIN 27
37
• -- ■ CNTL/STB
"WR" 2.-TO PI (24),PIN 36
20
10
"RO"
TO PI (241, PIN 37 a
VSS
VCC
IC15, PIN II a
IC16,PINS
40 I
(
( 80
( SL2
w
> HI LIM
> INPUT DISC
GND
13
18
1
< P 80
PEI!
19
3,
4
5
6
24
25
8
9
898 -3- 12
R 4.7K 13
2
15
PA4
PA6
PA6
•
PAT
39
2
15
3
14
41
13 0
12
6
7
10
37
81
9
35
inn.
1
( PB7
SI
38
GND RESET
( PB6
16
51
40
< P84
PBS
THR-<
ij 16
1•
PA3
1
0
3
4
5
07
ICI.
9,10,11,12
13,14,15,16
+5.2V
10
II RESET
RESET
NN%
P4(19)
4
LO 847
HALT
3.
• NMI
6
TO PI(24),PIN 29
+15V
+15V
6
PB2
( PB3
I)
TO IC 9, PIN 1
To
‹. SLI
3 ,
• B3
16
17
0 TEST POINT
5. NUMBERS NOT USED:
IC5 ,ICIO, IC11 ,IC12
4
N/C
TO IC3,PIN 18
D 831299D
8 < al
7
82
SL0
3 > LOW LIM
PA2
II
14
RIO
4.7K
R t..3
5
29
14
PA!
10
3
R9
4.7K
10
6
• 5.2V
PA0
16
TO PIN 38, A8
I. CAPACITANCE VALUES IN p.F,
UNLESS OTHERWISE SPECIFIED.
I EXTERNAL MARKINGS.
2. 1
3. LAST NUMBERS USED.
C7
1C18 RII
13
R L2
RL3
IC17
898 -3-R4.7K
9
TO P1N32 ,A2 -,
26
+52V
IC15 c
ICH
SN7404N
TO PIN3I, A ! -4
087
12 ,
PBS
TO PI(24),PIN 34 MREO
12
RL.4
111.0
13( R
(..!
22
P8 4
23
TO 1C4,PIN 12
13
RL5
086
14 ,
39
PB3
• 5.2V
TO IC3,PIN 28 RFSH
0B5
38
20
P82
21
14
IC?
RL3
AN
13 ( AO O
OUT
3
2
3
< 24
RL2
08 4
AO
13
• 5.2V
DB3
16
04
5
12
RL0
27
5
IC3,PIN 26
RESET
N/C
D831271C
Sh6
J2(23)
CONNECTS TO
Al WI7 P14(23)
ON FRAME SCHEMATIC
83J 271
SHT. I OF 9
P4( 19)
CONNECTS TO
A1W14 419 (19)
ON FRAME SCHEMATIC
831271
SHT. I OF 9
SCHEMATIC,CONTROL P.C.SD.
0 831271 C SHT. 6 OF 9
Figure 7-5 Control Board A5.
Schematic Diagram (Sheet I of 2)
7-11/7-12
Section VII
Schematic Diagrams
AS CONTROL P.C. BOARD
• 5.2V
• 5.29
'CO
698-3-R• 76
--2j
SI
A.-g.2..!
II
31
.---•
••1
1 1,
9
12
15
16
14
151
121
SI
10 i
71
141
13
II
101
III
30
13
32
TO 1C13,1016
1
03
0.
15 I
1_
TO 103,PI1J4
TO IC13,PIN2
TO 1C13,PIN I
I.I
161
171
Ag
A,
3:
71
5
51
13
13
IA
14
8937
"
3
1 I
191
A. 38
231
AS
21
A.
-• 39
IS
16
16
07
ICS
mSM51213
IC7
AO
A,
7
40
A,
6
1.2
5
As
• 1
19
2■1
,6
0K
• 5.2V ..--•••••-•—• TNT
32,
23
23
191
21
ICIS.P1N 3
,21
5
8
> AO
> A,
6
II
S
I
A4
As
1
CE
IS
201
> All
22
22
Al
19
i9
IN. As
4,0
12 G..
OE
201
20 a
w
ICIO
SEE
MOTE 3
9
zui
CI
2
7.
161
vcc
24
\SEE NOTE S
IC9b
>
O USAA: 1
CR2
IN91•
ION 29 SUSRO
22
201
TO 1C154,P10110 & 1C151LPINIZ
iCS•
C04011AE
'CO
SN74LS•28
IS HALT
TO P4119),PIN •
TO IC14,PiN 3-.24
• :2 V
211
TO IC150,PINI3
2N3904
4
9
ONO
IS
1
CRI
111914
►I
• 5 2V
C3
,3
70.
ST I
3V
T 289
iC9c
13
7.5.6
• 15V 8 TO P4(191,P1116
1' Ps Is
IC IA
CI
4301,F
319740•N I
>
> A7
1
As
AS
AID
I
> 22
3
3
A7
221
r--1
17
AS
AR
Aro
21
As
2
23
44
TO
IC 3
ZOO...CPU-PS
AS
21
") 0 5
>
0
,7
I
AT
221
40
R3
.3
> 04
31
371
5V
2 > °I
3> 03
II
Os
Og
> 00
9
10
10
31
93
35
As 36
• 5.2V
0
I
7
De
DI
15 I
16
AS
A4
TO P1,10130
1
131
i•
17
36
II
13
P1(24)
'ACC
II 1
15
A2
351
TO IC13,PIN3
II
101
171
SI
A,
A.°
ID
1• I
33 I
34 I
TO IC13,1,15
00
02
131
91
TO 1C13,1118
TO IC154,PIN
2.1
C.]
GNO Vce
91
10
SI
TO ICILPIN 35
TO 1C16.19 1N5
25
tRe
am. vcc
LI
15414
WAIT
S 2V
R7
101(
> ROM
IF
TO 1Ci4,1•184
TO 1C14.PINI
TO 42123I,PIN 16
29
28 >wAiT
24
2
All
CZ
IOORF
!Gib
.5 2V
4
> Ais
•
WR
wa
ZORO
NMI
32
22
21
20
17
29
IS
34 >
ONES
26 7,,
NOES
RFS..
>H mI
>
MI
RESET
V
> RO
> 1070
27",
24
TO P4(191. P1N5
TO tC 3,PH116..
TO 1C1•,P11113
NOTES:
I. CAPACITANCE VALUES IN .F UNLESS
OTHERWISE SPECIFIED.
Z. RESISTANCE VALUES IN OHMS
WHEN IC7 13 A
3. USE JUMPER
32K ROM
WHEN 1C7 IS A
USE JUMPER
ISO ROM
4 LAST MUNI:OCRS USED!
RS C3 1C12
INT
3
211
> RFSH
TO P41191,P1N 3
OV
P11241
CONNECTS TO
Al Will 4221241
ON FRAME SCHEMATIC
631271
SHT I Of 7
ANO
CONNECTS TO
A20 w20J24 (241
ON OPTIONS FRAME
SCHEMATIC
931099
SCHEMATIC,CONTROL PC.80.
88312719 SHT.5o OF 7
5. UNIT ON • 5.2V,UN1T OFF NOM.•26111.
S. 0 TEST POINT
819 SELECTED COMPONENT
S. NUMBERS NOT USED.
ICS, IC10,1C11,1C12
E831271B
Sh 5a
Figure 7-5 Control Board A5,
Schematic Diagram (Sheet 2 of 2)
7-13/7-14
Section VII
Schematic Diagrams
TEST POINT
+4V
+5V
WAVEFORM
+QV
411111111111111
111111111111111
1
Fr.'
;
,
11
11
1
rr
4V
ALL .2 mS/ DIV
1
111
11
i
+5V
11
1
1
1
1
4200 V"- 2.5mW INPU1)
TRIGGER AT TP
700mV INPUT
9200
0
A6 INPUT MODULE P.C. BD.
P1(321 OPTION
Pt(251
-
I
<
34 DO
331 0,
<
A6
.8(210 0.1t(•1
41(1)0
Ji(710
JI(310
J1(510
0.11(61
3
<
321
31 1 D023
5
<
<
56'04
291 06
•<
6
a <
9
®
10
18
TO IC 6,13,14, PIN 11
19
TO IC6,13,14. PIN 10
TO IC6,13,14, PIN 9
86
aT
281 06
271 07
7
IC6
80
4
25
<
.3
.1 48) ADORESS
- At
<
:t
'24 EtaSEI
231V2
22163
21 la.
20166
191
C3
CZ 5
12
34
3411
30
32
30
211
2•
P1(251
4---
r4
CO '4
A7 37
m
36A6
13
P2(211
20
z!
*SEE NOTE 1
•
•
A4
48
''as
Az
2
3 Ai
i5I
C7
33
SEE
NOTE •
910
141
131 8,2
4AO
RE
1C1
AMSZ55
OUT
A4
CA3140AE
9
3
GNO vEE
'21
T
71
-I5V
t5v
-i5V
27
C5
150
28
Z9
•
-t
26
-15 V
1:155
10K
IR53
100K
16189
A3
• 4---
R54
ZOOR
10
IC2
I 86
'8' 57 A0565JN/
4---
.L.:—•—•-=+-1
Rido
R
39A5
▪ 4--19
0
C37
1000
C2
10.F
25V
+i 5V
3
6
4---
+5.2V
;
Ri6
12.IK
-5V
I
TO A9,1.916
71 121
30
RI2
IM
31
RI4
237K
33 (--34
+5 2V
R5
i0K
14
OUT/1N
1C30
0-vv•
32
vEE
•Y
13
vss
C6
33
A
35
36
37
<
38
R•
100
24
CI
AZ
LM3t IN
K
101
R9
10K
7
C35
mo
i50 3m
IR6
5.1i K
RI5
249K
A3
Lm30i AN
1R:3
1m
SOK
-t5V
*I5V
I5V -I5V
Ca
10 0 0
ou r;3` "
V00 !NM
61
1
-15V
+5.2V
•0
NOTES:
CH•NNEL I Aoo JUMPER 101 .
CHANNEL 2 ADO JumPER
REssOvE
D8312768
A• AmPLIF1ER.
<
NOTES
I CAPACITANCE VALUES 1N pF. UNLESS
OTHERW SE SPECIFIED.
2. RESISTANCE VALUES IN OHMS.
UNLESS OTHERWiSE SPECIFIED.
3. CHANNEL 1 A00 JUMPER 0 ONLY.
CHANNEL 2 A00 JUMPER
,
•
A• NOT USED ON CHANNEL .
5.
0 TEST POINT
PI(25)
CONNECTS TO
Ai WI8 J23(251
ON FRAmE SCHEMATIC
83:271
SHT. I OF 9
P1(321
CONNECTS TO
A20W20J29 (321
ON OPTION FRAmE
SCHEMATIC
831099
SCHEMATIC, INPUT MODULE P.C.80.
D83127I A SHT. 7 OF 9
REMOVE 0
D831271A
Sh 7
Figure 7-6 Input Module Board A6,
Schematic Diagram (Sheet 1 of 2)
7-15/7-16
Section VII
Schematic Diagrams
O3 II
TEST POINT
111111111111111•11111111111M1
0 111111111111RIIIIIIIIMMI
WAVEFORM
-5v
11111311111
+5V
• 5V
• 5v
I
0
■E■■ IMIIIIII
-5V
I
1
I
I
I
0
I
I
.
• 5V
I
I
0
-5v
v
10111111111111111ENTIMIIIIMMI
HIMINEMINNIUM
0 niMIEMEMBEEM
UMMAHMEMNIIM
• IV
0
1•1111=11111111111111111
IV
-5V
/
SOLID-RANGE 0,1,2 Z 10003
DOTTED-RANGE 3,4,5,6Z 800AS
ALL 2 mS/ DIV
4200 W.": 2.5 m W
9200 Ca.T.-. 700 mV
A6 INPUT MODULE P.C.80.
TO ICI
TO
IC8b,PINI2
TO
IC70 , PINI3
C26
1000 pF
PINI8 PINI9 PIN20
.11
3
-ISV
RT 1.50
6
+ 5.2 V
• 5.2V
-5V >2--•
2
12M
+ A6
LF356H
113T
,2
3.9K
7
5V
R20
, L821(
821
201C
R22
221K
C19
330 pF
4
GNO
131 141. 151
12
vss
.11
-61
CONNECTS TO
INH
A4 PI
ON FRAME SCHEMATIC ---71
C
8
831271
101
9
SHT. 1 OF 7
AND
TO
CONNECTS
TO
C
ICI,
A4 PI
PIN 20 TO
ON OPTION FRAME
ICI,
SCHEMATIC
PIN 19
831099
023
33pF
4
3
0 1 2
106
C040 5IBE
COM
Voo OUT/IN
1
!El
3
CI6
68pF
VEE
71
2
A7
LF356H
C13
689F
-5V
+5.2V
;:
)1
TO
ICI.
PIN 18
)
7
R28
100K
R23
I 14
ICIOC
7
3
I/O
I/O
R29 • • • •
1101C •54.9K •
• • • •
12
R35
5.IK r
-ISV •I5V
CZ2
0.,
F
I/0
CTRL
6
4
cI o
C 140016 8 E
15
C
4
5 CTRL
0
C36
100
AS
CA3140AE
I/O I/O .-*AIV-•
R40
806K
6
VSS
8
Me'
•-•■
2
1
-5V
.15V
R39
80.6K (4
IC14
R34
10K
CTRL
R33
2.10K
(9.09K I
4
-ISV +I5V
VD
7
+5.2V
2
1/0
AS
LF356
1_0_1
TO 1C7a, PIN 2
• ---•- ISV
m
Cl2
5
TO IC7b, PIN 12
-r
0.0,
•
+5.2V
-5V
C040168E
1C9a
017
2200pF
"1
4
IC Ila
004075BE
14
V00
2
6
10
12
3
8
P2(21)
(OPTION) P2(30)
TO PIN 18
11.12,13, 4
9
!CUB
3
IC13
4 C040518E
5
2
L
-5V
ASTABLE
iz
1C9b
CTRL
13
5
I/O
-TRIGGER
p
1C9e
CTRL
1/
Vcc I/
ASTABLE
B
TO PIN 19
C
TO PIN 20
ICI
3
+5.2V
105
CD4047AE
TO iCIO , PIN 13
- v T v
INH
VEE
VSS
,c50.
IC9d
8
I/O
I/O
9
+5.2 V
5V
VSS 7
8
•
TO 41 , PIN 4
sLC32
10
....,- 10
=25V 1 25v
I> 5v
5
31;
CTRL
+ TRIGGER I0 - •
-5v
+i5V
2
4 57 O
K R
47
5 K R4 57 K
8
47
4 9K R
6
I c
- 5V
V00 OUT/IN
R COMMON
9
7
COM
161
10
+5.2 V
IC27 ,.C3I
6
1/0
V00
1
CTRL
12 1
-5V
118 CTRL
3
T
II
I/O
+5.2V
RI7
806K
I/O
P2(30)
ON A2O OPTION FRAME
SCHEMATIC
831099
CONNECTS TO
WZO 430(3010N
Al FRAME SCHEMATIC
831271
SHT. I OF 7
+5 2V
-5V
+5.2V
- CI5
0.01
16
ICIOb
vin
-•---I
R42
7.5K
7V
ial
-15V
8
A
0
13
C20
0.1
R32
9.09K
10
R38
7.87K 13
vw
R36
10K
P2(21
CONNECTS TO
-ISV
Al W16421(21)
ON FRAME SCHEMATIC
831271
SHT. I OF 7
-5V
T. C29 1.033
• ,0 v
10
I 25 V I 25V
T
C30
034
10
1-4
25v 125 V
4> I5V
6
GNC
EXT. RESET 124
7. 0 TEST POINT
RETRIGGER 1-4
TO IC I0, PIN 5
NOTES :
I. CAPACITANCE VALUES IN pa, UNLESS OTHERWISE SPECIFIED.
2. RESISTANCE VALUES IN OHNS,UNLESS OTHERWISE SPECIFIED.
2
> N /C
....
-5V
3.:
THESE VALUES USED ON 9200/A/B ONLY.
TO J1, PINS
4. LAST NUMBERS USED:
R55 C37 AS ICI4
5.®
D831271A
S h 6b
6. NUMBERS NOT USED:
CIO CI 1
C2I R4) R46
824 TPI C24 R43 iC4 IC12
SCHEMATIC, INPUT MODULE P.C.80.
D83127IA SHT. 6b OF 7
FACTORY SELECTED.
Figure 7-6 Input Module Board A6,
Schematic Diagram (Sheet 2 of 2)
7-17/7-IS
•
Section VII
Schematic Diagrams
RESET
CPU
Nut
+13V
HALT
N/C
N/C
+5 2v
♦ 5 2V
p•11•1
AT POWER SUPPLY P.C. BO.
5
I IN-
OUT- 2
ICs PUT
,•78L05wC
CNC,
61
3
•
+5V
T
• ISV
e•
,e,
IS
25V
K
SIK
3
VREF
— C8
33000F
IRS
• 99K
DI
IC6
CD•CM313E
•
AIR
LM339N
vo o
0,
a,
SETv,ss s, 02 R2 cLx2R,
•
71
Ri
CLK;
2
Ri9
SIR
5
iAIR
HI
(i)
RI3
100K
R9
IK
Lm339N
7
1
12
v REF
P1(101
RED/WHT
<
+15V
RE0/81-K
RED
(3
CR2
VO
1C2
78 MGUIC
. CI
2200
35V
IIIIIII
RIO
..
C ONT
CND
GNDGNO
GNO
GNO
N/C
02
N/C
02
N/C
02
N/C
N/C
02
-15v
-t5V
-ISV
N/C
— P10(29)
III
•
12 3
03
• CS
100
25V
P9(13)
PI (10)
+15v
3
-
P4(14)
•
+i5V
p5u2) ' 07061i P8(2131T P9031/
CR3
CRI
• C2
.7:7. 2200
35V
4 5
RIR
2. 2 1 K
IM
CONT 2
ICS
,•79mGUIC
CONT
.C6
7K :T.T100
25v
1C3
•
2.80K
. C9
100
25v
02
v0
V
CR6
0
RI•
330
iw
CR I
CR•
N/C
;
+5 2V • 5 2V +5 ZV •5 2V •5 2v
CR5
GPM/ wHT
RIO
• 53
CR2
--4(
16
16
16
16
AEC
OUT
-SV
-SV
N/C
N/C
T3
T3
vS-2•6
IC•
,A78GUIC
SRN
•
CR5
C3
• 700
16V
M
CONT
F15
500 _1 Cjoo
T
P6(151
10V
R6
• 99K
Pt (10)
CONNECTS TO
Al 410110I
ON FRAME SCHEMATIC
C831273B
3
R II
100
RIZ
• 6•
P 7 1161
P 9 ol.1)
CONNECTS TO
P S 112)
CONNECTS TO
CONNECTS TO
• ■ w 12 J12 (12)
• 1 w 16 J ■ 61161
AI In} ,R3i13)
ON FRAME SCHEMATIC
ON FRAME
s3,7I
SCHEMATIC
ON FRAME SCHEMATIC
83IZ7I
331271
831271
5HT I OF 7
SHT I OF 7
SHT I OF 7
SHT I OF 7
P 4 1011
77 6 1151
CONNECTS TO
CONNECTS TO
P 8 1281
CONNECTS TO
PIO '29)
CONNECTS TO
w7i .291291
WI• .1141141
• e w 20 /281281
All W15 Jt51I51
H, EM • T 1 C
ON FRAME :S2O
Cc
ON FRAME SCHEMATIC
ON FRAME SCHEMATIC
ON FRAME SCHEMATIC
83127:
831271
831 271
5111T. 1 OF 7
SHT I OF 7
SHT I OF 7
NOTES.
1 ALL CAPACITANCE VALUES IN pF. UNLESS OTHERWISE
SPECIFIED
2 ALL RESISTANCE VALUES IN OHMS
3 0 TEST POINT
•
LAST NUMBERS USED
RIR C9
Figure 7-7 Power Supply Board A7.
Schematic Diagram
5 NUMBERS NOT USED
1.2
PS
E831271A
7-1977-20
•
TO A5(POCONTROL PC.11
•• • ••
•
•
•
• •
0
0 lo
Z
n M-4 0
0 Z;
r-
•
•
•
•
W20124(24)
3kli Vii 4NIV II
06601. £83
E831099D
TC A5(P4)CONTRCL. P.C.B
•
0
0
1
TO REAR PANEL
1
J20
a
0
1
0
g
W20J26(25)
0,c — >
>JO A6(P2) INPUT PC.B
0
IN3
0
0
-1
) 1'0 A2 ( PI MISPLAY P.C.B
•
• A25 P3(31)•
-to
0
0
-p
6
k
2
-0
1
-4 0
-1 To
111 N
0 Al OA 0
-1.1 T:1
• • 4
m
rn
0
6
!-
•
OOOOO •• •
<
-4
•
A23 P2(3I)
5
c
-o-o
A25P1(29) •
A23PI (29) W20J28(29)
.31 rn
0
i
zl
-1
▪
41.
'11
• •
•••
/40 >>
ti • tn
cl
N • • • •
LAI
• • •
0
•
•
t) •
• 6- •
• O3 •
• •••
< GRN
-o
co
GRN/WHT
-1
23
•
Z
-1 CA 0
0 c_
0
0 •
:0 Z
u, II
fl
RED/WHT
W20J24 (24)
1:1 0
< FiED/131. K
;U
< RED
-
:U N
-0
n
•
c
-1
W20J26(25)
Z
P -0
—0
C
ts.) --e
o
(4
-1
EJJ
m
(4
A6P2( 30)
C CO
•-•
rs)
• •
-
A6 PI(32)
5
W20129(321
40
7%.1
0
0
0
A6J1
A4 PI
7
cn
0
'
J3I
>
>
I
11: 1
!,
NOTES:
COMPONENTS INTHE"SENSORhHAVE
NOT BEEN SHOWN. IN GENERAL ,
THEIR REPLACEMENT MUST BE
FOLLOWED BY ADJUSTMENTS
THAT REQUIRE SPECIALIZED
EQUIPMENT AND
NIQUES.
•—
I
A4 J2(33)
RED
<<
wHT
TECH_J
W23.130(34) W23 W23P2(33)
-1 >>
<<
t
-11
',3/
oc
rrn-1
g3 2
0
-0
0
V)
n
C1 P.,'
st3
fr,
•-■
2
I■1
APPENDIX A
OPTION 4200-01A
APPENDIX A
IEEE-488 BUS INTERFACE
OPTION 4200-01A
A-1.
DESCRIPTION.
The IEEE-488 (GPIB) bus Interface
A-2.
option permits external control of the
Instrument and data capture by a wide variety
of compatible controllers. The instrument
may be operated with other GPIB-compatible
devices to achieve specific test automation
goals, with no specialized control interface
requirements for proper electrical operation.
Although no standard GPIB interface
A-3.
data formats have yet been established, certain common practices are achieving de-facto
standard status. These practices have been
adhered to in the design of the 4200-01A
option interface formats and delimiters,
thereby assuring the user of format compatibility with almost all controllers.
A-4.
CAPABILITY.
Certain subsets of full GPIB functions
A-5.
are specified in the IEEE-488 1978 Standard.
The Model 4200-01A option includes the
following capabilities:
SH1
SOURCE HANDSHAKE complete capability
AH1
ACCEPTOR HANDSHAKE complete capability
T6
BASIC TALKER, SERIAL POLL,
UNADDRESS IF MLA,
NO TALKER ONLY capability
TEO
NO EXTENDED TALKER capability
L4
BASIC LISTENER, UNADDRESS IF MTA,
NO LISTENER ONLY capability
c. Cut the cable tie in the instrument that
holds the extra power plug (the plug with two
blue wires and one black wire).
d. Remove the six screws that fasten the
control board and replace them with the six
mounting posts supplied with the -01B package.
e. Position the interface board in the
instrument so that the mounting holes in the
interface board line up with the mounting
posts in the instrument. Attach the interface board to the mounting posts with six
4-40 screws and lockwashers supplied with the
Interface board.
f. Connect the 40 pin ribbon connector to
the front edge connector of the interface
board.
g. Connect the power plug in the instrument
to the 4-pin brown connector on the interface
board.
A-8. OPERATION.
A-9,
Address Assignment. Before using the
instrument in the GPIB, it must be assigned a
unique address. This address is set using
the five right-most sections of rear-panel
address switch SI in accordance with Table
A-I„
A-10. Message Terminator, Positions 6 and 7
of the rear-panel switch Si permit a choice
of message terminators, as shown in Table
A- 2.
A-11. Command Response. In addition to Talk
and Listen Address commands, the instrument
responds to the following:
LEO
NO EXTENDED LISTENER capability
SRI
SERVICE REQUEST capability
RLI
REMOTE-LOCAL capability,
LOCAL LOCKOUT capability
Mnemonic
Name
Function
PPO
NO PARALLEL POLL capability
GTL
Go To Local
Enables panel
control
DCO
NO DEVICE CLEAR capability
GET
DTI
DEVICE TRIGGER capability
Group Execute Trigger a
Trigger
measurement
CO
NO CONTROLLER capability
a. Address Commands (Response if Listen
Addressed).
b.
MLA = My Listen Address
MTA = My Talk Address
A-6.
INSTALLATION.
Option 4200-01A consists of interface
A-7,
board A23. Electrical interconnections are
shown in Figure 7-8. To install the interface board, proceed as follows:
a.
Listen Address Group.
Mnemonic
Name
Function
UNL
Unlisten
De-address as
listener
c.
Talk Address Group.
Mnemonic
Name
Function
UNT
Untalk
De-address as
talker
Turn off power to the instrument.
b. Remove the screws that secure the top
cover of the instrument and slide the top
cover back and off.
A-1
APPENDIX A
OPTION 4200-01A
TABLE A-1.
*Decimal
Address
*
Talk
Code
TABLE A-2.
MESSAGE-TERMINATOR SELECTION
ADDRESS ASSIGNMENT
Listen
Code
Switch
Switch Setting
5 4 3 2 1
0
El
SP
0
0
0
0
0
1
A
!
0
0
0
0
1
2
B
II
0
0
0
1
0
3
C
1
0
0
0
1
1
Message
Terminator
7
6
0
0
E01
0
1
CR*
1
0
LF*
1
1
CR LF
*
4
0
S
0
0
1
0
0
5
E
%
0
0
1
0
1
6
F
&
0
0
1
1
0
A-11. (Continued).
7
G
'
0
0
1
1
1
d. Unencoded Commands.
8
H
(
0
1
0
0
0
Mnemonic
Name
Function
9
I
)
0
1
0
0
1
IFC
Interface
Clear
Initialize
interface
10
J
*
0
1
0
1
0
REN
11
K
+
0
1
0
1
1
Remote
Enable
Permits remote
operation
12
L
,
0
1
1
0
0
13
M
-
0
1
1
0
1
14
M
.
0
1
1
1
0
15
N
/
0
1
1
1
1
16
0
0
1
0
0
0
0
17
P
1
1
0
0
0
1
18
Q
2
1
0
0
1
0
19
R
3
1
0
0
1
1
20
S
4
1
0
1
0
0
21
T
5
1
0
1
0
1
22
U
6
1
0
1
1
0
23
V
7
1
0
1
1
1
24
X
8
1
1
0
0
0
25
Y
9
1
1
0
0
1
27
I
;
1
1
0
1
1
b. Command Functions. Table A-3 describes
command functions.
28
\
<
1
1
1
0
0
Keyname
29
I
=
1
1
1
0
1
dB CAL FAC 0
Cal Factor Constant, in dB
30
A
>
1
1
1
1
0
RANGE AUTO A
Sets autorange mode
RANGE HOLD 0
Sets range hold mode
GHz
Interpolates Freq/Cal
Factor Table
Address 31 (11111) will not be
recognized and should not be used.
*
With or without E01
A-12. Operating States. The instrument
operates in two separate states, whether in
local or remote control. One state is the
measurement state, during which the instrument performs and displays measurements; the
other state is the data entry/recall state,
which Is operative during number entry or
after recall of stored information. When
operating on the bus, it is important to
remember that the instrument can send only
that information Which appears on the front
panel display. When the instrument is in the
store or recall mode, the LED display and
annunciators blink on and off to indicate
that the displayed value is not a measured
value.
a. Measurement Mode Functions. The
following functions change the measurement
mode of the instrument:
Keyname
GPIB
PWR MODE
P
Displays measured voltage
dB MODE
B
Displays measured dBmV
GPIB
F
Function
Function
•
•
APPENDIX A
OPTION 4200-01A
TABLE A-3.
COMMAND FUNCTIONS
Command
Arm
Disarm
Description
Q
IQ
OQ
the last reading, or the last
Hold command:
keyboard entry, will remain on the display.
The Instrument will continue to read probe input, but will not update the display.
The
instrument cycle time will be greatly reduced
because of the measurement-cycle overhead that
is not executed during the hold command.
V
IV
OV
the service request
Service request command:
will be issued by the Instrument upon completion of a measurement.
J
IJ
OJ
Raw-data command:
the instrument will not
average or smooth any of the measurements.
U
1U
OU
the Instrument will issue a
Limit command:
service request If any limit is exceeded. If
a limit is exceeded and a service request is
issued, the U command must be rearmed to become operational again.
Trigger command:
this command, identical with
the IEEE-488 group execute trigger, initiates
a measurement cycle.
T
INTERFACE CLEAR and DEVICE disarm all the above commands.
A-12. (Continued).
c. Service Request Status Codes. Service
request status is defined by a five-bit code,
as defined In Table A-4.
4
TABLE A-4. SERVICE REOUEST STATUS
BIT
Meaning
1
0
3 2
X
X
X
0
X
X
X
10
Ch 1 high
X
0
1
X
X
Ch 2 low limit exceeding
X1OX
X
Ch 2 high
1
CH I
e. Special Functions. Special functions
Include the automatic zeroing and clear functions.
Keyname
ZERO
Initiate an automatic
zeroing cycle
CLR
Clear numeric entry
to zero
CAL
Performs 1 mW Auto
Calibration
limit exceeding
limit exceeding
f.
IEEE-488 Bus Command Extensions. The
following functions are added to bus operation:
Name
Function
LIMITS
dB LO
Low limit value In dB
LIMITS
dB HI
High limit value In dB
SELECT
CHNL
Selects channel number
dB REF
LEVEL dB
dB reference level for dB
modes
SENS
Selects Sensor Data Tables
GP1B
ADR.ZERO
SET RANGE
GPIB
Function
low limit exceeding
d. Data Entry/Recall Functions. These functions enable entry or retrieval of numeric
constants used by the instrument. Operation
reverts to the measuring state after data
storage.
Kevname
GP1B
Function
Zero selected
ranges (0-7)
G
Set to selected
range (0-7)
These commands must be preceded by an
appropriate argument. The argument for Y is
the span of ranges to be zeroed: for example:
26Y specifies zeroing of ranges 2 through 6.
If only one range is to be zeroed, the argument must begin and end with the same code
(e.g., IIY to zero only range 1). The argument for G Is the range number (0 = 10 nW to
6 = 10 nW for 4200-4 sensors) to be set. From
execution of the Y command to measurement
mode, the maximum time is as follows:
A-3
APPENDIX
OPTION 4200-0IA
A 13. TIME RESPONSE CHART.
A-12. (Continued).
Command
00Y
01Y
02Y
03Y
Command
Time
2.3
2.9
3.3
3.5
-
seconds
seconds
seconds
seconds
04Y
05Y
06Y
Refer to Tables 1-3 for the Model 4200 sensor
measurement through the IEEE-488 Bus.
Time
3.8 seconds
4.0 seconds
4.3 seconds
NOTE
The "Y" command allows no wait time for a
sensor to reach a stable zero before actual
offset storage occurs.
NOTE
The G command sets the 4200 to
range which may not correspond
code output in the data string
8-21. The table below relates
apparent range codes:
LEVEL
an internal
to the range
in Paragraph
internal and
INTERNAL APPARENT
+10 dB
10 rriW
+6 dB
0 dB
3.98 mW
1 mW
6
6 5
-10 dB
-11 dB
10011W
79.4 11W
- 20 dB
- 21 dB
10 LIW
7.94 1.1W
A-14. REMOTE PROGRAMMING.
-5-
It is assumed that the user is acquainted
with GPIB principles and terminology. Refer
to the controller instruction manual for the
syntax needed to create specific bus commands
and addressing sequences. All examples given
apply to the HP 9825 calculator.
A-15.
Bus Programming Syntax. The bus
programming syntax mirrors the front-panel
keystroke sequence closely. Each key has
been assigned an alphanumeric character and
sending that character is equivalent to
pressing that front-panel key. The resulting
operation is indistinguishable from local
control. Numerical values are translated by
the GPIB interface so that commonly observed
formats may be used. Fixed formats and
floating point formats may both be used.
These representations are converted to their
equivalent fixed point values and the sign
information Is post-fixed automatically,
thereby ensuring that natural notations for
numbers will be accepted by the instrument.
4
A-16. Suppose that it is desired to set the
Instrument to the PWR mode. The HP 9825
calculator could be programmed:
- 4 3
- 30 da
- 32 dB
wrt 716, "P"
- 3 -
1 11W
631 nW
2
- 40 da
100 nW
- 42 dB
63.1 nW
- 2 -
1
- 50 dB
-52 dB
-60 dB
10 nW
6.31 nW
1 nW
- 10
4.
0
4.
For the series 4 and 5 sensors add 10 dB to
the Internal and apparent levels.
For the series 6 sensor add 20 dB to the
internal and apparent levels.
a. Bus Availability. When the Model 4200
is sent a string, it does not normally tie up
the bus while responding to the string; other
bus communications are possible during the
interval. The 4200 can Inform the
controller when It Is finished by use of the
Service Request see paragrpah 8-12d, if this
is desired.
The Model 4200 can, however, be made to lock
up the bus while It Is responding to a string
- if such action is desired - by sending it
two strings In succession (even if the second
string is only a Null command).
Example: A "zero" command: wrt 716,"Z"
Followed by a "talk" command: red 7I6,A,B,C
A- 4
The "wrt" instructs the calculator to send
data on the bus to one or more listeners.
The number following Is the address information; 7 is the calculator address and 16 Is
the instrument address. (all examples in
this appendix will use 16 as the instrument
address, although any valid address can be
assigned to the instrument.) When the calculator interprets the first part of the line,
It will assert the ATN line to signify that
commands or addresses will be sent on the
bus. Following that, it will send three
bytes or characters: Unlisten, the calculator Talk Address and the instrument Listen
Address. This Information will configure
both the calculator and the Instrument for
the data transfer. After the last command
byre has been accepted, ATN will be released
to the false state by the calculator. All
information on the bus Is Interpreted as
data In this mode. While in the data mode,
the calculator will send the character "P" to
the instrument. At the instrument, this will
be interpreted as equivalent to pressing the
MODE PWR key and that function will be executed. Because there is no more data to be
sent, the calculator will send a delimiter
(the preselected ASCII code for the termination character). The instrument recognizes the termination character as an
end-of-message signal and returns to the bus
Idle condition.
APPENDIX A
OPTION 4200-01A
The preceding discussion of the
A-17.
sending of a single programming byte serves
to illustrate two important points: every
data transfer is preceded by a
command/address preamble and each transfer is
terminated by a termination character. In
the preceding example, six characters were
sent on the bus; only one was a programming
byte.
The measurement mode functions (P, B,
A-18.
A, 0) and the special functions (Z, K) do not
expect any numeric value. These functions
all execute as received. For example: the
following will program dB and autorange mode:
wrt 716, "BA"
Or
wrt 716, "AB"
Note that the sequence is unimportant, except
that each function executes in the order it
Is received on the bus.
Suppose that the instrument Is to be
A-19.
zeroed automatically, and then asked to send
the reading in the PWR and RANGE AUTO mode.
The HP 9825 calculator could be instructed as
follows:
wrt 716, "APZ"
red 716, V, S
The automatic zeroing cycle time is approximately 10 to 22 seconds, depend-ing on range.
Until zeroing is com-pleted, the instrument
will be unable to respond with new data. The
first line of the preceding instructions sets
the operating mode and initiates the zeroing
cycle. The last line reads the response from
the Instrument. The instrument response consists of two numeric values: the first value
is the front panel reading and the second is
a status value (normally zero). These two
numbers will be stored in the calculator
variables (storage locations) V and S. Note
that each data transmission from the instrument consists of two values. When the status
value is non-zero, indicating an error condition, the data value will be set to zero.
The program will normally test the status
value to assure valid operating conditions.
Store/Recall Functions Syntax. The
A-20.
general syntax for store/recall functions is
the same as the front panel sequence; if a
numeric value immediately precedes the function, that value will be stored; otherwise,
the existing stored value will be recalled to
the front panel. These functions (L, H, D,
F, S, N, R, J, U, V) thus operate in a dual
mode. When the instrument is in the store or
recall mode the display will blink to indicate that the instrument is not in the
measurement mode. The Instrument is returned
to the measurement mode by sending any of the
following: P, B, A, 0, T, 1J, OJ, IQ, OQ,
IV, OV, 1U or OU.
Suppose that it is desired to store
A-21.
the current power level in dBm into the dBm
reference so that all future readings will be
referenced to the current value. Allowance
must be made for the possibility that the
current value Is a dB relative value. To do
this, the current dB value must be read, the
existing dB reference must be recalled, the
true dBm value must be computed and this
value must be stored into dB reference. The
calculator could be instructed as follows:
red 716, V, S
wrt 716, "R"
red 716, X, S
V +X-). Y
wrt 716, Y, "R"
Note that R Is used twice in the program, the
first time to obtain the existing value for
the dB reference and the second time to store
the computed value. Also, note that the two
read statements (red) each fetch a different
value, the first value is the power value In
dB and the second Is the dB reference.
A-22. Output Data Format. The data
output of the instrument consists of two
numeric values. The first is the
numeric data in the display and the
second Is the status information. The
normal data output will have the
following format:
abcsddddEsd, S, R (tc)
Where:
ab = mode (power in milliwatts = PW;
dB = OM; dBr = OR)
c = channel (A = 1. B = 2; C = 3)
s = sign (+ or -)
dddd = data (four digits, each digit
0-9)
Esd = exponent, sign, digit
, = data delimiter
S = status digit:
0 = no error
1 = entry too small
2 = entry too large
3 = measurement under range
4 = measurement over range
5 = zero acquisition out of
range - excessive positive
offset
6 = zero acquisition out of
range - excessive positive
offset
7 = channel 3 over/under range
R = Range Code, coded per Table A-4
tc = termination character
A-23. Hold Indication Function Syntax. The
Hold Indication function, when enabled (1Q),
automatically does a measurement cycle
following its receipt and then holds the
Indication until receipt of a T, OQ or
another 1Q command. It is Intended primarily
for use with the Trigger or Group Execute
Trigger commands. Following its receipt, the
Instrument continues to measure but does not
update the display. This can be use-ful
where response time is important since
A- 5
APPENDIX
OPTION 4200-01A
RANGE CODES FOR VARIOUS SENSORS
TABLE A-4,
Sensor Type
Range
Code
0
1
2
3
4
5
6
A-23.
4200-5E
4200-4E
4-50
4-40
4-30
4-20
<-10
4 0
4+10
4-40
4-30
4-20
4-10
4 0
4+10
4+20
dem
dem
dem
dem
dem
dem
dem
dem
dem
dem
dem
dem
dem
dem
(Continued).
display-update time is eliminated until
called for with a Trigger (T) command;
another IQ command will also update the
display and maintain the hold indication
function; a 00 command will update the
display and negate the hold indication function.
SRO Function Syntax. The control-ler
A-24.
can command the instrument to pull the SRO
line true after each measurement. The syntax
for this command is IV; to command the
instrument not to pull the SRQ line true
after each measurement the syntax Is OV.
Measurement Trigger Syntax. The
A-25.
Trigger (T) command is an addressed command
(wrt T16,"T"), used to trigger a measurement,
and Is generally used In conjunction with the
Hold Indication function (Q). (Refer to
paragraph 8-23.) The instrument is also
responsive to the unaddressed Group Execute
Trigger (GET) command. This command Is
asynchronous and may result in a slightly
faster response time than the T command,
which Is executed only once each measurement
cycle.
Limit Service Request. This command,
A-26.
when enabled, will result in a service
request by the instrument when either de
limit (high or low) of either channel
(channel I or channel 2) is exceeded. The
limit exceeded and the channel can be determined from the service request byte as shown
below:
4200-7E
4200-6E
4-30
<-20
4-10
4 0
<+10
4+20
4+30
<-20
<-10
4 0
4+10
dem
dem
dBm
dem
dBm
dem
dem
dem
dem
dem
dem
4200-8E
4-10 dem
4 0 dBm
the program will loop on insertion loss/gain
measurements. Each measurement is triggered
by the user. Zeroing is prompted in the
local mode at the beginning of the program.
Reading errors, should they occur, will be
signalled by a double beep from the calculator; normal measurements will give a single
beeP. There will be one print line per
measurement. The reference value Is not
printed In this example.
Program Variable Usage:
P: = power measurement value
R: = range value
S: = status value
Z: = dummy input for prompts
Program Statements
0: cli 7
Comments
/clear Interface
1:
ent "zero chl, /prompt for zeroing
2",Z
2:
rem 7
3:
/0 aref, auto - set
wrt 716,
"INAOR2NAOR3N" ch 3
4:
ent "ref
measure",Z
/prompt to set up
ref
5:
red 716,P,S,R
/read ref value, status
6:
If S>0;dsp
"error",S;
beep; gto 4
/test status
7:
wrt 716,"IN",
P,"R3N"
/set ch 1 deref = P
8:
beep;ent
"measure",Z
/prompt for measurement
9:
red 716,P,S,R
/read measurement, status
NOTE
/enable remote
Bit 6, when set, is the service request.
Bit
765 4 32 10
X I X X X X01
X1XXXX10
XIX X 0 I X X
X 1X X10 X X
Limit Exceeded
Channel 1 low
Channel I high
Channel 2 low
Channel 2 high
limit
limit
limit
limit
A-27. Typical Application. Suppose that it
is desired to measure insertion loss or gain
with an instrument equipped with option
4200-03, channel 2 measures incident power
and channel 1 measures output power. The
program, shown below, will request reference
conditions and wait for the user to set them
up. Following establishment of the reference,
A-6
10: If S>0; dsp
"error",S;
beep;walt 100;
gto 8
/test status
11: prt P,"de";
gto 8
/print measurement
12: end
APPENDIX A
OPTION 4200-01A
A-28. The program in paragraph A-25 also
measures reflection coefficient if channel 1
measures reflected power and channel 2
measures Incident power. The reference conditions are established with a short at the
test port of the directional coupler.
A-29. Use of Hold Measurement (Q), Trigger
(T) and Measurement Complete-SRQ (V)
Commands. An example of the use of these
commands using an HP85 Controller, Boonton
Electronics Model 1020 Signal Generator and
Model 4200 RF Microwattmeter follows:
Statement
220 WAIT 1000
Walt 1 second for settled
indication on 4200
230 ON INTR 7
GO TO 290
If interrupt occurs,
branch to 290
240 OUTPUT 703;
"IV"
Set Model 4200 to issue
a SRQ at completion of
measurement
250 WAIT 200
Wait 0.2 second
260 ENABLE INTR
7;8
Enable SRQ interrupt in
Model 85
270 ON TIMER IL,
5000 GO TO
370
If no interrupt is
received in 5 seconds,
branch to 370
280 GO TO 280
Wait for interrupt
(or escape after 5
seconds - step 270)
290 OUTPUT 703;
"OV"
At interrupt, set
Model 4200 to nomeasurement-complete SRQ
295 WAIT 200
Wait 0.2 seconds
300 S=SPOLL(703)
Store result of
serial poll of Model
4200 in S
Comment
10 ! TQVCHK
Program name
20 REMOTE 7 @
CLEAR
Enable remote; clear
display
Set Model 4200; chan30 OUTPUT 703;
"1N1SODOROQOVAB nel 1 sensor 1, 0 CAL
FACTOR dB, 0 REFERENCE dB, no hold
Indication, no
measurement-complete
SRQ, autorange mode,
dB display mode
40 OUTPUT 702;
"IMHOLOON"
Set Model 1020; 1
MHz, output level of
0 dBm, output on
50 OUTPUT 703;
1,199
Set Model 4200 to
hold indication mode
60 OUTPUT 702;
"OL-10"
Set Model 1020 to -10
dBm level
70 ENTER 703: A
Read model 4200;
store In A
80 PRINT A
Print model 4200
Indication
90 DISPLAY "PRESS
CONTINUE FOR T
COMMAND"
Display prompt on
Model 85
100 PAUSE @ BEEP
Stop program; issue
beep (press continue)
37Q PRINT"NO-MEAS- There has been no
COMP-SRQ"
service request
110 OUTPUT 703;
"T"
Send T (trigger command) to Model 4200
380 PRINT "DONE"
120 ENTER 703; A
Read model 4200
indication; store in A
In the above example, the device
addresses are:
130 PRINT A
Print model 4200
indication
Device
140 OUTPUT 703;
"09"
Set Model 4200 for
indication-hold, auto
range mode, dB mode
150 DISP"PRESS
CONTINUE FOR IV
COMMAND"
Display prompt on
Model 85
200 PAUSE @ BEEP
Stop program; issue beep
210 OUTPUT 702;
"OLO"
Set Model 1020 to 10
dBm output
310 IF BIT(S,6)<>1 If bit 6 (SRQ bit) of
THEN GO TO
Model 4200 service
370
request byte does not
equal 1, go to 370
320 PRINT
"MEAS-COMPSRO"
If bit 6 does equal 1
(SRQ bit) print
"MEAS-COMP-SRQ"
340 DISP"PRESS
CONTINUE FOR OV
COMMAND"
Display prompt on
Model 85
350 PAUSE @ BEEP
Stop program; issue beep
360 GO TO 260
Go to 260
HP Model 85B
BEC Model 1020
BEC Model 4200
Check is complete;
print "DONE"
Address
7
2
3
The sequence of events in the above
program are as follows:
A-7
APPENDIX A
OPTION 4200-01A
A-29. (Continued).
HP85
Controller
Bi-directional buffers A23U6 and A23U7 handle
data and control signal transfers, respectively, between adapter A23U4 and the Interface buses.
Comments
RUN
The model 4200 will read the
generator level of approximately 0 dem and this will be
printed by the model 858; the
Model 1020 generator will
change Its level to -10 dem but
the Model 4200 will not change
its indication since it Is in
the hold-Indication mode;
program stops at pause and
waits for "CONTINUE" on
Model HP85.
CONTINUE
This issues a T (trigger) command to the Model 4200 which
now changes to approximately
-10 d8m; this is printed by the
Model HP85.
CONTINUE
This Initiates a sequence In
which the measurement-completeSRQ is enabled.
CONTINUE
This initiates a sequence In
which the measurement-completeSRO has been disabled.
Model 4200 Device Dependent Statement
A-30.
Summary. Refer to Table A-5.
Sealed System Operation. When in
A-31.
sealed system operation (selected by the
control board bit switch) the instrument will
power up in the operate mode but, by the use
of the proper GPIB commands this instrument
can be placed in the DC or AC modes to allow
calibration of the Instrument over the bus
without removal from the system rack. The
GPIB commands are:
Operate Mode
Calibrate Mode 1 (DC Cal)
Calibrate Mode 2 (AC Cal)
A-32.
"80m"
"8Im"
"82m"
THEORY OF OPERATION.
A-33.
General. Interface board A23 Is a
microprocessor-driven data interface which
converts IEEE 488 bus compatible signals into
control codes that operate the internal
It also concontrol bus of the instrument.
verts instrument data Into IEEE 488 compatible signals for use on the bus. All data
transfers are handlea by source ana acceptor
handshake protocols as defined by
IEEE-488-1978.
Detailed Description. Refer to Figure
A-34.
A-1. All data manipulation and IEEE 488 bus
management are controlled by CPU A51C3 on the
instrument control board In conjunction with
a micro-program stored In PROM A23U1 on the
Interface board. All data transfer is
handled In parallel-to-parallel mode by
adapter A234. Latch A23U5 handles transfer
ot bit switch data that defines the Instrument address and message termination characters to the Instrument data bus.
A- 6
A-35,
When the instrument is turned on, the
RESEf line to adapter A23U4 is set low while
capacitor A23C1 charges through pull-up network A23U1, thereby clearing the adapter. To
Initiate an Interface transaction, signal
ROM-IF is set low by CPU A5IC3, thereby
enabling the output of PROM A23U1. Interface
micro-program instructions from the PROM
memory location specifiea by the address bits
from the CPU are written onto the instrument
data bus. The CPU executes these instructions and activates the control signals
required to perform the commanded Interface
transaction.
Instrument address and messaae terA-36.
mination character data manually preset into
bit switch A23S1 is supplied to latch A23U5.
To read the switch data, control signals TE7
anc17577 and address bit A6 are activated,
thereby enabling the latch output through
gates A23U2c and A23U2b and inverter A23U3c.
The switch data is then transferred through
the latch to the instrument data bus.
A-37.
To read Incoming Interface control
slanals, the CPU activates signals 7Tiand
CSIF and sets address bit A6 low. The interface control signal port of adapter A23U4 is
selected through address bits AO, A1 and A5.
Adapter A23U4 Is enabled through gate
A23U2a. Because signal 7E7 Is active, signal
TE supplied by the adapter to buffer A23U7 Is
Inactive, and this buffer Is set up for data
transfer from the interface control signal
bus to the control signal port of adapter
A23U4.
Incoming Interface control signals
are transferred through buffer A23U7 and
adaoter A23U4 to the Instrument data bus.
Clocking of adapter operations is controlled
by the clock signal from the instrument
control board.
Interface control signal
transfer In the opposite direction is
achieved by reversing the states of signals
RD and WR. An active WR causes signal TE to
buffer A23U7 to become active, thereby
reversing the direction of data flow through
the buffer.
Interface control signals from
the Instrument data bus are then written onto
the Interface control bus throuah adapter
A23U4 and buffer A23U7. Interface control
signals are definea as follows:
DAV
DATA VALID
NRFD
NOT READY FOR DATA
NDAC
NOT DATA ACCEPTED
ATN
ATTENTION
IFC
INTERFACE CLEAR
REN
REMOTE ENABLE
SRQ
SERVICE REQUEST
E01
END OR IDENTIFY
APPENDIX A
OPTION 4200-01A
TABLE A-5.
Statement
Statement
Description
Description
T
Trigger a measurement
H
Recall high dB limit
OJ
Enable data averaging
(N)D
Enter N as CAL FACTOR in dB
(N = -3.00 to +3.00)
1J
Disable data averaging
D
Recall CAL FACTOR in dB
J
Recall state of J to display
(0 or 1)
(N)F
Enter N as frequency as CAL
FACTOR GHz determination
(N = 0.1 to 999.9)
F
Recall frequency for CAL
FACTOR GHz determination
(N)S
Enter N as sensor number
(N = 1 through 8)
OU
Disable dB-limit-exceeded
service request
1U
Enable dB-limit-exceeded
service request
U
Recall state of U to display
(0 or 1)
S
Recall sensor number
OV
Disable service request at
measurement completion
(M)N
Enter M as channel
(M = 1 through 3)
Enable service request at
measurement completion
N
Recall channel number
(N)R
Enter N as dB reference
level (N = -99.99 to +99.99)
R
Recall dB reference level
Z
Initiate automatic zeroing
cycle
K
Perform 1 mW automatic
calibration
C
Clear numeric entry to 0
(NM)Y
Zero ranges N through M
(N = 0 through 6;
M = 0 through 6;
both must be used)
(N)G
Set instrument to range N
(N = 0 through 6)
IV
*
MODEL 4200 DEVICE DEPENDENT * STATEMENT SUMMARY
V
Recall state of V to display
(0 or 1)
OQ
Disable display
hold
10
Enable display
hold
P
Display measurement
in power
B
Display measurement
in dB
A
Enable autorange mode
0
Enable hold-range mode
(N)L
Enter N as high dB limit
(N = -99.99 to +99.99)
indication
indication
low dB limit
L
Recall
(N)H
Enter N as high dB limit
(N = -99.99 to +99.99)
All other commands are controller dependent;
see controller instruction manual.
number
APPENDIX A
OPTION 4200-01A
CD ”
MODEL
OORESS
*TA
4200
t•
BUS
JI
B
U6
CHTROL
DATA
DATA GPM
DATA
I/O BUFFER I/O
s
DATA
BIT
SWITCH
US
LATCH
UT
AMR
DATA OE
ODOR. DATA CONT.
U4
991 ♦
GPIS
ADAPTER
PROM
<
U7
GPIS
BUFFER
COY
REN
< REN
IFC
( IFC
NOAC
NOAC
NFIF0
( NPF0
-..CONTROL
DAY
DAY
EDI
( ECII
ATN
( ATN
SRO
SRO
0831287A
Figure A-1. IEEE-488 Bus Interface Option 4200-01A Block •agram
A-38. To handle data transfers between the
Instrument data bus and the interface data
bus, adapter A23U4 is similarly enabled
througaeA23UbycontrlsigaCSIF
and a low address bit A6. Address bits AO,
Al and A5 are set to select the data port of
and 75 specify
adapter A23U4 and signals
If data is to
the write and read functions.
be written onto the interface data bus,
signal 7,47 is activated, thereby activating
signal TE to buffer A23U6. Data on the
Instrument data bus is then transferred
through adapter A23U4 and buffer A23U6 to the
Interface data bus. For data transfers from
the interface data bus to the instrument data
bus, signal
is inactive and sicnal 77 is
active. Signal TE to buffer A23U6 Is deactivated by adapter A23U4 to reverse the
direction of data transfer through the
buffer.
w
virr
A-39,
MAINTENANCE.
General. The interface board does not
A-40,
operate alone, but rather in conjunction with
the Model 4200. If interface operation becomes abnormal it should first be determined if
the 4200 operates normally without the interface. If It does, proceed according to the
following paragraphs.
A-41. Physical Inspection. Check the interface board visually for loose or broken connectors, foreign material, etc.
A-10
A-42.
Voltage Checks. With the board
Installed In the 4200, and all connectors in
place, check the supply-and-IC-voltages
according to the values shown on the schematic diagram, Figure A-2,
A-43.
Active-Device Substitution. All the
active devices are socketed, making replacement simple. Replace each device, one at a
time, and check for restoration of proper
performance by the instrument.
A-44.
Troubleshooting. An oscilloscope,
while not the most useful tool for
troubleshooting bus-oriented microprocessor
systems, still may be used to determine activity or lack of activity on the address, data
and control lines.
A-45.
REPLACEABLE PARTS.
A-46.
Table 6-2 lists all the replaceable
parts and includes; Reference Symbol,
Description, Mfr., Mfr's Part No., and the
SEC Part No.
A-47.
SCHEMATICS.
A-48.
Refer to Figure A2 for the 4200-01A
schematic.
Appenciix A
IEEE 138 Bus Interface
Option 4200-01A
-
f
A23 INTERFACE P.C. BD.
PI (29)
20 1
Do<
3
831253
15
5
D4 <
06 <
2
5
7
06 <
8
07 <
6
A
DO
06
D7
5
06
14
02
03
D3 8
Al2<2!
1 13
-
101
7
6
5
A3< 12
<15
10
AI
A2
4
UI
2716
As< 17
<18
22
A9
07
Ali< 19
2° Or—n0
• . 13"
ROM-IF 25
20
15
17
17
8
CE
D5
PE
04
D101
03
0102
0103
D2
DI
U4
9914
D0( MS8)
D104
D105
0106
161151141131 121 111 101
91
12 ,
37
131
36
141
35
151
34
St
33
171
32
81
31
191
VC C----1
08
68 9
07
87 8
0101
2
3,
86 7
D6
U6
5N75160
04
85
0102
6
4
5
13„,
04
B4
03
831 4
02
82 1 3
15,
0I
81 I 2
6
4
D103
< 0104
,
0105
„ D1C6
0107
<'0108
2
21
+5.2V
CONT 30
RSO
20f
INT
U2a
74LS32
3
DC
REN
CE
IFC
U3b
NDAC
5
37
DB1N
NRFD
DAV
4
"WR"< 3
U3a
›;c().S 04
13
5,7,9
29 WAIT
EOI
WE
U3d
12
9
2 NMIE
1
ATN
+5,2V
U3c
3
+5.2V
1
14
U2b
II
L
MR0 ,<2-t-
22
19
23
18
24
17
26
15
27
is
28
13
29
12
2
REN
REN
IFC
IFC 3
NDAC
16
25
TE Vcc
U7
SN75161
17
NRFD
5
7
DAV TERM.
DAV
6
6
DO
Eat 7
8
ATN
9
5
BUS—
ATN
DAV
< E01
SRC
12 ,
101
18,
2F1
10
U2c
NDAC
`NRFD
11
< AT N
10
SRO J ASRO
GND
VS S
201
IFC
8 ,
NDAC 4
NRFO
REN
9
12
13 j
IORO
SRO
18
10
WR
+5.2V
GNOC:
19
20
C3
10
25V
COM
21
22,
RFSH
4,5 ,7
23
CSAN0
AN
4K
101
TE
I®
D831253D
38
RS2
RSI
OE
INT
.* < 27
RI
8 3168472
TE GN
GND
CSIF < 38
"RD"
7
• • • • • • •
0108
PP
5 6
20
A9
V
CRI
-1- 1N914
D6
16
TP
18 TP
95
lio< 31
< 30
+ 5.2V
0107
AR)
21
14
4
19
D7 (LS8)
As
19
A 10<
13
o
A7
23
12
13
03
„ 114
A
4
15
05
16
2 A5
As
, 16
It
02
A3
A 7 .„,
10
00 9
0
3
A5 < 14
0
RESET
4
4, 4
-
11 2 3
VC
A2< II
As
NI
2
VCC ACCGR
241
A14E 24
C SANI
26
MI
C
CI
1
35V
GND
<
40
S
1-
7
02
I OE
+5.2V
18
17
DR
„
13
L, 4
4
Di
U5
74 1_5373
0,
+5.2V
02
SI
3
04
9
A o < 910
LE
7
16
4
1
CC
0
19
< DI
D3<
V
2
< D2
+5.2V
24
40
<-------
1
21
31 41 5
P2 (31)
NOTES.
I CAPACITANCE VALUES IN rF UNLESS OTHERWISE SPECIFIED .
2. 1- 1 EXTERNAL MARKINGS.
3. LAST NUMBERS USED
U7
4 Q TEST POINT
5. USE JUMPER
P 1(29)
CONNECTS TO
A20W20J28 (29)
ON OPTION MAIN
FRAME SCHEMATIC
831099
P2(31)
CONNECTS TO
A 1 W21 J31(31)
ON MAIN SCHEMATIC
831271 , SHT I OF 7
SCHEMATIC, INTERFACE PC.80
0831252C
FOR 16 K ROM OR JUMPER * E3 * FOR 32 K ROM.
Figure A-2 Interface Board A23, Schematic Diagram
APPENDIX B
OPTION 4200-018
APPENDIX 8
IEEE-488 BUS INTERFACE
OPTION 4200-018
B-1.
DESCRIPTION,
The IEEE-488 (GPIB) bus interface
B-2.
option permits external control of the
instrument and data capture by a wide variety
of compatible controllers. The Instrument
may be operated with other GPIB-compatible
devices to achieve specific test automation
goals, with no specialized control interface
requirements for proper electrical operation.
Although no standard GPIB Interface
B-3.
data formats have yet been established, certain common practices are achieving de-facto
standard status. These practices have been
adhered to In the design of the 4200-01B
option interface formats and delimiters,
thereby assuring the user of format compatibility with almost all controllers.
B-4.
CAPABILITY.
Certain subsets of full GPIB functions
8-5.
are specified in the IEEE-488 1978 Standard.
The Model 4200-018 option includes the
following capabilities:
SH1
SOURCE HANDSHAKE complete capability
AH1
ACCEPTOR HANDSHAKE complete capability
T6
BASIC TALKER, SERIAL POLL,
UNADDRESS IF MLA,
NO TALKER ONLY capability
TEO
NO EXTENDED TALKER capability
L4
BASIC LISTENER, UNADDRESS IF MTA,
NO LISTENER ONLY capability
c. Cut the cable tie in the Instrument that
holds the extra power plug (the plug with two
blue wires and one black wire).
d. Remove the six screws that fasten the
control board and replace them with the six
mounting posts supplied with the -018 package.
e. Position the interface board in the
instrument so that the mounting holes In the
interface board line up with the mounting
posts in the instrument. Attach the interface board to the mounting posts with six
4-40 screws and lockwashers supplied with the
interface board.
f. Connect the 40 pin ribbon connector to
the front edge connector of the Interface
board.
g. Connect the power plug in the instrument
to the 4-pin brown connector on the interface
board.
B-8.
OPERATION.
8-9.
Address Assignment. Before using the
Instrument in the GPIB, it must be assigned a
unique address. This address is set using
the five right-most sections of rear-panel
address switch S1 in accordance with Table
8-1.
8-10. Message Terminator. Positions 6 and 7
of the rear panel switch Si permit a choice
of message terminators, as shown in Table
8-2.
8-11. Command Response. In addition to Talk
and Listen Address commands, the instrument
responds to the following:
LEO
NO EXTENDED LISTENER capability
SRI
SERVICE REQUEST capability
RL1
REMOTE-LOCAL capability,
LOCAL LOCKOUT capability
Mnemonic
Name
Function
PPO
NO PARALLEL POLL capability
GTL
Go To Local
Enables panel
control
DCO
NO DEVICE CLEAR capability
GET
DT1
DEVICE TRIGGER capability
Group Execute Trigger a
Trigger
measurement
CO
NO CONTROLLER capability
a. Address Commands (Response if Listen
Addressed).
b.
MLA = My Listen Address
MTA = My Talk Address
B-6.
INSTALLATION.
Option 4200-01B consists of interface
8-7.
board A23. Electrical interconnections are
shown in Figure 7-8. To Install the interface board, proceed as follows:
a.
Listen Address Group.
Mnemonic
Name
Function
UNL
Unlisten
De-address as
listener
c. Talk Address Group.
Mnemonic
Name
Function
UNT
Untalk
De-address as
talker
Turn off power to the instrument.
b. Remove the screws that secure the top
cover of the instrument and slide the top
cover back and off.
B-1
APPENDIX B
OPTION 4200-018
TABLE 8-1.
*
Decimal
Address
ADDRESS ASSIGNMENT
TABLE 8-2.
MESSAGE-TERMINATOR SELECTION
Switch Setting
5 4 3 2 1
Talk
Code
Listen
Code
0
@
SP
0
0
0
0
0
7
6
Message
Terminator
1
A
!
0
0
0
0
1
0
0
E01
2
8
It
0
0
0
1
0
0
1
CR*
3
C
1
0
0
0
1
1
1
0
LF*
4
D
S
0
0
1
0
0
1
1
CR LF
5
E
%
0
0
1
0
1
6
F
&
0
0
1
1
0
7
G
1
0
0
1
1
1
8
H
(
0
1
0
0
0
8-11. (Continued).
9
I
)
0
1
0
0
1
d. Unencoded Commands.
10
J
*
0
1
0
1
0
Mnemonic
Name
Function
11
K
+
0
1
0
1
1
I FC
Interface
Clear
Initialize
interface
12
L
,
0
1
1
0
0
REN
13
M
-
0
1
1
0
1
Remote
Enable
Permits remote
operation
14
M
0
1
1
1
0
15
N
/
0
1
1
1
1
16
0
0
1
0
0
0
0
17
P
1
1
0
0
0
1
18
Q
2
1
0
0
1
0
19
R
3
1
0
0
1
1
20
S
4
1
0
1
0
0
21
T
5
1
0
1
0
1
22
U
6
1
0
1
1
0
23
V
7
1
0
1
1
1
24
X
8
1
1
0
0
0
a. Measurement Mode Functions. The
following functions change the measurement
mode of the instrument:
25
Y
9
1
1
0
0
1
Keyname
GP1B
27
(
;
1
1
0
1
1
PWR MODE
P
Displays measured voltage
28
\
<
1
1
1
0
0
dB MODE
B
Displays measured dBmV
29
I
=
1
1
1
0
1
b. Command Functions. Table 8-3 describes
command functions.
30
A
>
1
1
1
1
0
Switch
*
* With or without E01
*
Address 31 (11111) will not be
recognized and should not be used.
B- 2
8-12. Operating States. The instrument
operates in two separate states, whether in
local or remote control. One state is the
measurement state, during which the instrument performs and displays measurements; the
other state is the data entry/recall state,
which is operative during number entry or
after recall of stored information. When
operating on the bus, it is Important to
remember that the instrument can send only
that information which appears on the front
panel display. When the instrument is in the
store or recall mode, the LED display and
annunciators blink on and off to indicate
that the displayed value is not a measured
value.
Keyname
dB CAL FAC
GPIB
D
Function
Function
Cal Factor Constant, in dB
RANGE AUTO A
Sets autorange mode
RANGE HOLD 0
Sets range hold mode
•
APPENDIX B
OPTION 4200-018
TABLE B-3. COMMAND FUNCTIONS
Description
Command
Arm
Disarm
Q
IQ
00
Hold command: the last reading, or the last
keyboard entry, will remain on the display.
The instrument will continue to read probe input, but will not update the display. The
instrument cycle time will be greatly reduced
because of the measurement-cycle overhead that
is not executed during the hold command.
V
IV
OV
Service request command: the service request
will be Issued by the instrument upon completion of a measurement.
2V
SRQ on settled reading
J
1J
OJ
Raw-data command: the instrument will not
average or smooth any of the measurements.
U
IU
OU
Limit command: the Instrument will issue a
service request if any limit is exceeded. If
a limit is exceeded and a service request is
issued, the U command must be rearmed to become operational again.
Trigger command: this command, identical with
the IEEE-488 group execute trigger, initiates
a measurement cycle.
T
INTERFACE CLEAR and DEVICE disarm all the above commands.
B-12. (Continued).
b. Command Functions. (Continued).
GPIB
Keyname
Function
GHz
Interpolates Freq/Cal
Factor Table
SEL AVERAGE OX
nX
Sets auto average
Sets select average
(n = 1-127)
c. Service Request Status Codes. Service
request status is defined by a five-bit code,
as defined in Table B-4.
d. Data Entry/Recall Functions. These functions enable entry or retrieval of numeric
constants used by the instrument. Operation
reverts to the measuring state after data
storage.
Keyname
GPIB
LIMITS
dB LO
Function
Low limit value in dB
LIMITS
dB HI
H
High limit value in dB
SELECT
CHNL
N
Selects channel number
dB REF
LEVEL dB
dB reference level for dB
modes
SENS
Selects Sensor Data Tables
TABLE 8-4. SERVICE REQUEST STATUS
Bit
4
3
2
1
0
Meaning
XXX01
CHIlow limit exceeding
XXXIO
Chlhigh limit exceeding
X01XX
Ch 2 low limit exceeding
X1OXX
Ch 2 high limit exceeding
e. Special Functions. Special functions
include the automatic zeroing and clear functions.
Kevname
GPIB
Function
ZERO
Initiate an automatic
zeroing cycle
CLR
Clear numeric entry
to zero
CAL
Performs 1 mW Auto
Calibration
8-3
APPENDIX
OPTION 4200-01B
For the series 4 and 5 sensors add 10 dB to
the internal and apparent levels.
8-12. (Continued).
f. IEEE-488 Bus Command Extensions. The
following functions are added to bus operation:
Name
Function
GP1B
g. Bus Availability. When the Model 4200
Is sent a string, it does not normally tie up
the bus while responding to the string; other
bus communications are possible during the
interval. The 4200 can inform the
controller when it is finished by use of the
Service Request see paragrpah 8-12d, If this
Is desired.
Zero selected
ranges (0-7)
ADR.ZERO
SET RANGE
Set to selected
range (0-7)
G
These commands must be preceded by an
appropriate argument. The argument for Y is
the span of ranges to be zeroed; for example:
26Y specifies zeroing of ranges 2 through 6.
If only one range is to be zeroed, the argument must begin and end with the same code
(e.g., 11Y to zero only range I). The argument for G is the range number (0 = 10 nW to 6
= 10 nW for 4200-4 sensors) to be set. From
execution of the Y command to measurement
mode, the maximum time is as follows:
Command
00Y
OlY
02Y
03Y
Command Time
Time
2.3
2.9
3.3
3.5
seconds
seconds
seconds
seconds
04Y
05Y
06Y
3.8 seconds
4.0 seconds
4.3 seconds
The G command sets the 4200 to
range which may not correspond
code output In the data string
8-21. The table below relates
apparent range codes:
an Internal
to the range
in Paragraph
internal and
INTERNAL APPARENT
10 mW
+6 dB
0 dB
3.98 mW
1 mW
6
6 5
- 10 dB
- 11 dB
100 LIW
79.4 uW
- 20 dB
- 21 dB
10 1.1W
7.94 1.04
Example: A "zero" command: wrt 716,"Z"
Followed by a "talk" command: red 716,A,B,C
B-13. TIME RESPONSE CHART.
8-14. REMOTE PROGRAMMING.
NOTE
NOTE
+10 dB
The Model 4200 can, however, be made to lock
up the bus while it is responding to a string
- If such action is desired - by sending it
two strings In succession (even If the second
string Is only a Null command).
Refer to Tables 1-3 for the Model 4200 sensor
measurement through the IEEE-488 Bus.
The "Y" command allows no wait time for a
sensor to reach a stable zero before actual
offset storage occurs.
LEVEL
For the series 6 sensor add 20 dB to the
Internal and apparent levels.
- 5 -
It is assumed that the user is acquainted
with GPM principles and terminology. Refer
to the controller instruction manual for the
syntax needed to create specific bus commands
and addressing sequences. All examples given
apply to the HP 9825 calculator.
B-I5. Bus Programming Syntax. The bus
programming syntax mirrors the front-panel
keystroke sequence closely. Each key has
been assigned an alphanumeric character and
sending that character Is equivalent to
pressing that front-panel key. The resulting
operation Is indistinguishable from local
control. Numerical values are translated by
the GP1B interface so that commonly observed
formats may be used. Fixed formats and
floating point formats may both be used.
These representations are converted to their
equivalent fixed point values and the sign
Information Is post-fixed automatically,
thereby ensuring that natural notations for
numbers will be accepted by the instrument.
4
- 4 -
8-16. Suppose that it is desired to set the
Instrument to the PWR mode. The HP 9825
calculator could be programmed:
3
- 30 dB
- 32 dB
1 pW
631 nW
- 3 2
-40 dB
100 nW
-42 dB
63.1 nW
- 2 -
1
- 50 dB
-52 dB
- 60 d0
8-4
10 nW
6.31 nW
1 nW
- 10
0
wrt 716, "P"
The "wrt" instructs the calculator to send
data on the bus to one or more listeners.
The number following Is the address information; 7 is the calculator address and 16 is
the instrument address. (all examples in
thls appendix will use 16 as the instrument
address, although any valid address can be
assigned to the instrument.) When the calculator Interprets the first part of the line,
it will assert the ATN line to signify that
commands or addresses will be sent on the
bus. Following that, it will send three
APPENDIX B
OPTION 4200-018
B-16. (Continued).
bytes or characters: Unlisten, the calculator Talk Address and the instrument Listen
Address. This information will configure
both the calculator and the instrument for
the data transfer. After the last command
byte has been accepted, ATN will be released
to the false state by the calculator. All
information on the bus is interpreted as
data in this mode. While in the data mode,
the calculator will send the character "P" to
the instrument. At the instrument, this will
be interpreted as equivalent to pressing the
MODE PWR key and that function will be executed. Because there is no more data to be
sent, the calculator will send a delimiter
(the preselected ASCII code for the termination character). The instrument recognizes the termination character as an
end-of-message signal and returns to the bus
idle condition.
8-17. The preceding discussion of the
sending of a single programming byte serves
to illustrate two important points: every
data transfer is preceded by a
command/address preamble and each transfer Is
terminated by a termination character. in
the preceding example, six characters were
sent on the bus; only one was a programming
byte.
The measurement mode functions (P, B,
B-18.
A, 0) and the special functions (Z, K) do not
expect any numeric value. These functions
all execute as received. For example: the
following will program dB and autorange mode:
wrt 716, "BA"
or
wrt 716, "AB"
Note that the sequence is unimportant, except
that each function executes in the order it
Is received on the bus.
Suppose that the instrument is to be
B-19.
zeroed automatically, and then asked to send
the reading In the PWR and RANGE AUTO mode.
The HP 9825 calculator could be instructed as
follows:
wrt 716, "APZ"
red 716, V, S
The automatic zeroing cycle time Is approximately 10 to 22 seconds, depend-ing on range.
Until zeroing is com-pleted, the instrument
will be unable to respond with new data. The
first line of the preceding instructions sets
the operating mode and initiates the zeroing
cycle. The last line reads the response from
the instrument. The instrument response consists of two numeric values: the first value
is the front panel reading and the second is
a status value (normally zero). These two
numbers will be stored in the calculator
variables (storage locations) V and S. Note
that each data transmission from the instru-
ment consists of two values. When the status
value is non-zero, indicating an error condition, the data value will be set to zero.
The program will normally test the status
value to assure valid operating conditions.
B-20.
Store/Recall Functions Syntax. The
general syntax for store/recall functions is
the same as the front panel sequence; if a
numeric value immediately precedes the function, that value will be stored; otherwise,
the existing stored value will be recalled to
the front panel. These functions (L, H, D,
F, S, N, R, J, U, V) thus operate in a dual
mode. When the instrument is In the store or
recall mode the display will blink to indicate that the instrument is not in the
measurement mode. The instrument is returned
to the measurement mode by sending any of the
following:
P, B, A, 0, T, 1J, 0J, IQ, 0Q,
IV, OV, 1U or OU.
B-21.
Suppose that it is desired to store
the current power level in dem into the dem
reference so that all future readings will be
referenced to the current value. Allowance
must be made for the possibility that the
current value is a dB relative value. To do
this, the current dB value must be read, the
existing dB reference must be recalled, the
true dem value must be computed and this
value must be stored into dB reference. The
calculator could be instructed as follows:
red 716, V, S
wrt 716, "R"
red 716, X, S
V + X Y
wrt 716, Y, "R"
Note that R Is used twice in the program, the
first time to obtain the existing value for
the dB reference and the second time to store
the computed value. Also, note that the two
read statements (red) each fetch a different
value, the first value is the power value in
dB and the second is the de reference.
8-22. Output Data Format. The data
output of the instrument consists of two
numeric values. The first is the
numeric data In the display and the
second is the status information. The
normal data output will have the
following format:
abcsddddEsd, S, R (tc)
Where:
ab = mode (power In milliwatts = PW;
dB = DM; der = DR)
c = channel (A = 1; B = 2; C = 3)
s = sign (+ or -)
dddd = data (four digits, each digit
0-9)
Esd = exponent, sign, digit
, = data delimiter
APPENDIX
OPTION 4200-018
TABLE 8-4.
RANGE CODES FOR VARIOUS SENSORS
Range
Code
0
1
2
3
4
5
6
Sensor Type
4200-4E
4-50
<-40
<-30
4-20
4-10
4 0
<+10
dem
dem
dem
dem
dem
dem
dem
4200-5E
4-40
4-30
4-20
4-10
4 0
<+10
4+20
dem
dem
dBm
dem
dem
dem
dem
8-22. (Continued).
S = status digit:
0 = no error
1 = entry too small
2 = entry too large
3 = measurement under range
4 = measurement over range
5 = zero acquisition out of
range - excessive positive
offset
6 = zero acquisition out of
range - excessive positive
offset
7 = channel 3 over/under range
4200-6E
<-30
4-20
4-10
4 0
4+10
4+20
4+30
4200-7E
4-20
4-10
< 0
4+10
dem
dem
dem
dem
dem
dem
dem
4200-8E
dem
dem
dem
dem
4-10 dem
4 0 dem
faster response time than the T command,
which is executed only once each measurement
cycle.
8-26. Limit Service Request. This command,
when enabled, will result in a service
request by the instrument when either dB
limit (high or low) of either channel
(channel I or channel 2) is exceeded. The
limit exceeded and the channel can be determined from the service request byte as shown
below:
NOTE
Bit 6, when set, is the service request.
R = Range Code, coded per Table 8-4
tc = termination character
8-23. Hold Indication Function Syntax. The
Hold Indication function, when enabled (19),
automatically does a measurement cycle
following its receipt and then holds the
indication until receipt of a T, 00 or
another IQ command. It is intended primarily
for use with the Trigger or Group Execute
Trigger commands. Following its receipt, the
instrument continues to measure but does not
update the display. This can be use-ful
where response time is important since
display-update time is eliminated until
called for with a Trigger (T) command;
another IQ command will also update the
display and maintain the hold indication
function; a 00 command will update the
display and negate the hold indication function.
8-24. SRQ Function Syntax. The controller
can command the Instrument to pull the SRQ
line true after each measurement. The syntax
for this command is IS and 2S. To command
the instrument not to pull the SRQ line true
after each measurement the syntax is OS.
To command the instrument to pull the SRQ
line true after each settled reading the syntax is 2S.
8-25. Measurement Trigger Syntax. The
Trigger (T) command is an addressed command
(wrt T16,"T"), used to trigger a measurement,
and is generally used in conjunction with the
Hold Indication function (Q). (Refer to
paragraph 8-23.) The instrument is also
responsive to the unaddressed Group Execute
Trigger (GET) command. This command is
asynchronous and may result in a slightly
8-6
Bit
7 6 5 4 3 2 1 0
XIXXXXO 1
X IXXXX10
X I X X O 1 X X
X 1 X X 1 0 X X
Limit Exceeded
Channel 1 low
Channel I high
Channel 2 low
Channel 2 high
limit
limit
limit
limit
8-27. Average Function Selection. To reduce
the effects of noise, spurious components,
etc. at lower levels, the Model 4200 employs
signal averaging. The amount of averaging is
a function of signal level, being highest on
the lowest ranges and least on the highest
ranges. When the instrument is first turned
on a set of default values is assigned as
follows:
fs LEVEL
RANGE
CONSTANT
10
I
100
10
I
100
10
6
5
4
3
2
1
0
1
1
1
2
4
20
80
mW
mW
4W
pw
4W
nW
nW
8-28. Increasing or decreasing these values
may be accomplished by sending the instrument
N (N=1 to 127) and then X. This new constant
will now be in effect on all ranges and will
remain in effect until changed by entering a
different value, or until OX is sent to the
instrument, or the instrument is turned
OFF/ON, after which the default values will
be again be in effect. The value of the
constant in effect can be recalled by sending
the instrument X. The default values when in
the AUTO mode cannot be recalled, the instrument will return a 0 to indicate the AUTO
mode.
APPENDIX B
OPTION 4200-018
B-29. Typical Application. Suppose that it
Is desired to measure insertion loss or gain
with an instrument equipped with option
4200-03, channel 2 measures incident power
and channel 1 measures output power. The
program, shown below, will request reference
conditions and wait for the user to set them
up. Following establishment of the
reference, the program will loop on insertion
loss/gain measurements. Each measurement is
triggered by the user. Zeroing Is prompted
In the local mode at the beginning of the
program. Reading errors, should they occur,
will be signalled by a double beep from the
calculator; normal measurements will give a
single beep. There will be one print line
per measurement. The reference value Is not
printed In this example.
Program Variable Usage:
P: = power measurement value
R: = range value
ditions are established with a short at the
test port of the directional coupler.
B-3I. Use of Hold Measurement (0), Trigger
(T) and Measurement Complete-SRQ (V)
Commands. An example of the use of these
commands using an HP85 Controller, Boonton
Electronics Model 1020 Signal Generator and
Model 4200 RF Microwattmeter follows:
Statement
Comment
10 I TQVCHK
Program name
20 REMOTE 7 @
CLEAR
Enable remote; clear
display
30 OUTPUT 703;
Set Model 4200; chan"lNISODOROQOVAB nel I sensor I, 0 CAL
FACTOR dB, 0 REFERENCE dB, no hold
indication, no
measurement-complete
SRQ, autorange mode,
dB display mode
S: = status value
Z: = dummy input for prompts
Program Statements
0: cif 7
40 OUTPUT 702;
"1MHOLOON"
Set Model 1020; 1
MHz, output level of
0 dBm, output on
50 OUTPUT 703;
Ition
Set Model 4200 to
hold Indication mode
60 OUTPUT 702;
"OL-10"
Set Model 1020 to -10
dem level
70 ENTER 703: A
Read model 4200;
store In A
Print model 4200
indication
Comments
/clear interface
1:
ent "zero chl, /prompt for zeroing
2",Z
2:
rem 7
3:
/0 deref, auto - set
wrt 716,
"INAOR2NAOR3N" ch 3
80 PRINT A
4:
ent "ref
measure",Z
/prompt to set up
ref
90 DISPLAY "PRESS Display prompt on
CONTINUE FOR T
Model 85
COMMAND"
5:
red 716,P,S,R
/read ref value, status
6:
If S>0;dsp
uerror",S;
beep; gto 4
/test status
wrt 716,"1N",
P,"R3N"
/set ch 1 dBref = P
beep;ent
"measure",Z
/prompt for measurement
red 716,P,S,R
/read measurement, status
7:
8:
9:
/enable remote
100 PAUSE @ BEEP
Stop program; Issue
beep (press continue)
110 OUTPUT 703;
"T"
Send T (trigger command) to Model 4200
120 ENTER 703; A
Read model 4200
indication; store In A
130 PRINT A
Print model 4200
indication
10: If S>0; dsp
"error",S;
beep;walt 100;
gto 8
/test status
140 OUTPUT 703;
"00"
Set Model 4200 for
indication-hold, auto
range mode, dB mode
Display prompt on
Model 85
11: prt P,"d8";
gto 8
/print measurement
150 D1SP"PRESS
CONTINUE FOR IV
COMMAND"
200 PAUSE @ BEEP Stop program; Issue beep
12: end
8-30. The program In paragraph B-25 also
measures reflection coefficient if channel 1
measures reflected power and channel 2
measures Incident power. The reference con-
210 OUTPUT 702;
"OLO"
Set Model 1020 to 10
dBm output
220 WAIT 1000
Walt I second for
settled indication
on 4200
8-7
APPENDIX
OPTION 4200-018
HP85
Controller
B-31. (Continued).
230 ON INTR 7
GO TO 290
If interrupt occurs,
branch to 290
240 OUTPUT 703;
"IV"
Set Model 4200 to
issue a SRO at completion of measurement
250 WAIT 200
Wait 0.2 second
260 ENABLE INTR
7;8
Enable SRQ interrupt
in Model 85
270 ON TIMER #L,
5000 GO TO
370
If no interrupt is
received in 5 seconds, branch to 370
280 GO TO 280
Wait for interrupt
(or escape after 5
seconds - step 270)
290 OUTPUT 703;
"OV"
At interrupt, set
Model 4200 to nomeasurement-complete
SRO
295 WAIT 200
Wait 0.2 seconds
300 S=SPOLL(703)
Store result of
serial poll of Model
4200 In S
310 IF BIT(S,6)<>1 If bit 6 (SRQ bit) of
Model 4200 service
THEN GO TO
request byte does not
370
equal 1, go to 370
320 PRINT
"MEAS-COMPSRQ"
if bit 6 does equal 1
(SRQ bit) print
"MEAS-COMP-SRQ"
340 DISP"PRESS
CONTINUE FOR OV
COMMAND"
Display prompt on
Model 85
350 PAUSE @ BEEP
Stop program; issue
beep
360 GO TO 260
Go to 260
Check is complete;
print "DONE"
380 PRINT "DONE"
In the above example, the device
addresses are:
HP Model 858
BEC Model 1020
BEC Model 4200
Address
7
2
3
The sequence of events in the above
program are as follows:
8-8
RUN
The model 4200 will read the
generator level of approximately 0 dBm and this will be
printed by the model 858; the
Model 1020 generator will
change Its level to -10 dBm but
the Model 4200 will not change
Its indication since it is In
the hold-indication mode;
program stops at pause and
waits for "CONTINUE" on
Model HP85.
CONTINUE
This issues a T (trigger) command to the Model 4200 which
now chances to approximately
-10 dem; this is printed by the
Model HP85.
CONTINUE
This initiates a sequence In
which the measurement-completeSRO is enabled.
CONTINUE
This initiates a sequence in
which the measurement-completeSRQ has been disabled.
8-32. Model 4200 Device Dependent Statement
Summary. Refer to Table 8-5.
A-33. Sealed System Operation. When in
sealed system operation (selected by the
control board bit switch) the instrument will
power up in the operate mode but, by the use
of the proper GPIB commands this instrument
can be placed in the DC or AC modes to allow
calibration of the instrument over the bus
without removal from the system rack. The
GPIB commands are:
Operate Mode
Calibrate Mode 1 (DC Cal)
Calibrate Mode 2 (AC Cal)
"80m"
"81m"
"82m"
B-34. THEORY OF OPERATION.
370 PRINT"NO-MEAS- There has been no
service request
COMP-SRO"
Device
Comments
Comment
Statement
B-35. General. Interface board A23 is a
microprocessor-driven data interface which
converts IEEE 488 bus compatible signals into
control codes that operate the internal
control bus of the Instrument. It also converts instrument data into IEEE 488 compatible signals for use on the bus. All data
transfers are handled by source and acceptor
protocols defined by IEEE-488-1978.
8-36. Detailed Description. Refer to Figure
8-1. All data manipulation and IEEE-488 bus
management are controlled by CPU A23U7 in
conjunction with a micro-program stored in
PROM A23U8. All data transfer is handled in
parallel to parallel mode by adapter A23U16.
Latch A23U15 handles transfer of bit switch
data that defines the Instrument address and
message termination characters to the instrument data bus. Bi-directional buffers A23U17
and A23U18 handle data and control signal
transfers, respectively, between adapter
A23U16 and the interface buses. The Ram
memory A23U11 is used by the CPU for temporary storage of program variables during
APPENDIX B
OPTION 4200-018
TABLE B-5.
Statement
Description
Statement
Description
T
Trigger a measurement
H
Recall high dB limit
OJ
Enable data averaging
(N)D
Enter N as CAL FACTOR in dB
(N = -3.00 to +3.00)
1J
Disable data averaging
D
Recall CAL FACTOR in dB
J
Recall state of J to display
(0 or 1)
(N)F
Enter N as frequency as CAL
FACTOR GHz determination
(N = 0.1 to 999.9)
F
Recall frequency for CAL
FACTOR GHz determination
(N)S
Enter N as sensor number
(N = 1 through 8)
OU
Disable dB-limit-exceeded
service request
IU
Enable dB-limit-exceeded
service request
U
Recall state of U to display
(0 or 1)
S
Recall sensor number
OV
Disable service request at
measurement completion
(M)N
Enter M as channel number
(M = 1 through 3)
Enable service request at
measurement completion
N
Recall channel number
IV
*
MODEL 4200 DEVICE DEPENDENT* STATEMENT SUMMARY
2V
Enable Service Request on
settled reading
(N)R
Enter N as dB reference
level (N = -99.99 to +99.99)
V
Recall state of V to display
(0 or 1)
R
Recall dB reference level
Z
OQ
Disable display indication
hold
Initiate automatic zeroing
cycle
K
IQ
Enable display indication
hold
Perform 1 mW automatic
calibration
C
Clear numeric entry to 0
P
Display measurement in power
(NM)Y
B
Display measurement in dB
A
Enable autorange mode
Zero ranges N through M
(N = 0 through 6;
M = 0 through 6;
both must be used)
0
Enable hold-range mode
(N)G
Set instrument to range N
(N = 0 through 6)
(N)L
Enter N as high dB limit
(N = -99.99 to +99.99)
OX
Enables auto average
(N)X
Enter N as number of samples
to average
low dB limit
L
Recall
(N)H
Enter N as high dB limit
(N = -99.99 to +99.99)
All other commands are controller dependent; see controller instruction manual.
APPENDIX 8
OPTION 4200-018
<
.00C.
/
< /8
4200
12..TA
M
".:Or
W
.4
.OG
..
me. 1...t W.
urreer■Lr
-1""
etcss
LIZ
alcss
01.44
Koto...c.....
.reot ■Acc
ELOCK DmGgAlw:AAATE INTERFACE
Figure 8-1. IEEE-488 Bus Interface Option 4200-018 Block Diagram
8-36. (Continued).
program execution. A23U14 the program timer
is only used by the -06 MATE option for
timing required under CIIL operation. A23U1
and A23U2 the programmable peripheral Interfaces form a "mailbox" for data transfer between the Instrument and interface address,
control, and data buses.
8-37. When the instrument is turned on, or
when the supply voltage goes low, the supply
voltage supervisor A23U5 keeps the reset line
active until the power supply voltage haas
reached its nominal voltage value, thereby
resetting the CPU A23U7 and clearing the
adapter A23U16.
8-38. Instrument address and message termination character data that is preset by
bit switch A23S1 is supplied to latch A23U15.
To read the switch data, address bits A84,
AB5, and control sIgnal IORD are activated
producing slanal SSW and enabling the latch
output. The switch data is then transferred
through the latch to the interface data bus.
8-39. To read incoming interface control
signals, the CPU activates signals IORD and
sets address bit A84 low. The interface
control signal port of adapter A23U16 is
selected through address bits AGO, AB1, and
A82. Adapter A23U16 is enabled through
decoder A23U12. Because signal IORD is
active, signal TE supplied by the adapter to
buffer A23U18 Is inactive and this buffer is
set up for data transfer from the interface
control signal bus to the control signal port
of adapter A23U16. Incoming interface
control signals are transferred through
buffer A23U18 and adapter A23U16 to the
instrument data bus. Clocking of adapter
8-10
operations is controlled by the clock signal
ZCLK which is generated by A23U4b and divided
by A23U6. ZCLK also supplies the required
clock to the CPU A23U7. Interface control
signal transfer In the opposite direction is
achieved by reversing the states of signals
IORD and 10WR. An active -MVP- causes signal
TE to buffer A23U18 to become active,
thereby reversing the direction of data flow
through the buffer. Interface control
signals from the interface data bus are then
written onto the interface control bus
through adapter A23U16 and buffer A23U18.
8-40. To handle data transfers between the
Interface data bus and the interface connector A23J2, adapter A23U16 is similarly
enabled through decoder A23U12 by low address
bit A84. Address bits AO, Al, and A2 are set
to select the data port of adapter A23U16,
and signals 10WR and IORD specify the write
and read functions. If data is to be written
to the interface connector A23J2 signal 10WR
is activated, thereby activating signal TE to
buffer to buffer A23U17. Data on the interface data bus is then transferred through
adapter A23U16 and buffer A23U17 to connector
A23J2. For data transfers from connector
A23J2 to the Interface data bus, signal IORD
is inactive and signal -1MT is active.
Signal TE to buffer A23U17 is deactivated by
adapter A23U16 to reverse the direction of
data transfer through the buffer.
8-41. MAINTENANCE.
8-42. General. The interface board does not
operate alone, but rather In conjunction with
the Model 4200. If interface operation
becomes abnormal it should first be determined if the 4200 operates normally without
the interface. If it does, proceed according
to the following paragraphs.
APPENDIX B
OPTION 4200-01B
B-43, Physical Inspection. Check the Interface board visually for loose or broken connectors, unseated IC's, foreign material,
etc.
8-44. Voltage Checks. With the board
Installed In the 4200, and all connectors in
place, check the supply - and IC - voltages
according to the values shown on the schematic diagrams, Figures B-2, 8-3, and B-4,
8-45. Active-Device Substitution. All the
active devices are socketed, making replacement simple. Replace each device, one at a
time, and check for restoration of proper
performance by the instrument.
8-46. Troubleshooting. An oscilloscope,
while not the most useful tool for
troubleshooting bus-oriented microprocessor
systems, still may be used to determine activity or lack of activity on the address, data
and control lines.
B-47, REPLACEABLE PARTS.
B-48. Table 6-2 lists all the replaceable
parts and includes; Reference Symbol,
Description, Mfr., Mfr's Part No., and the
BEC Part No.
B-49, SCHEMATICS.
8-50. Refer to Figures 82, 83, and B4 for
the schematics for the 4200-018 Option.
8-11/12
APPENDIX B
OPTION 4200-018
CARD EDGE
U2
Ui
AS SY 04 22 35
00
01
02
03
04
05
06
07
21
I( 3
K 4
K 5
K
K 7
t(
el;
34
33
32
31
30
29
29
PAO
PA1
PA2
PA3
PA4
PAS
PA6
PA7
DO
01
02
03
04
05
27 06
07
9
8
P80
P81
P82
P83
P84
P85
P86
P87
AO
Ai
5
36 ID
WI
6
1g Cg
RES
O
82C55
PCO
PC1
+5V
P C2
21 VCC PC3
PC4
PC5
PC6
-21 GND
PC7
61
Z
1
4
2
PAO
PA1
PA2
PA3
PA4
PA5
PA6
PA7
18 P80
19
20 P81
21 P82
22 P83
P84
23 P55
24 P86
25 P87
18
19
20
21
22
23
24
25
14
14
U3
15
16
17
13
12
16
17
13
12
U3
11
10
11
10
PCO
PC1
PC2
PC3
PC4
PC5
PC6
PC7
34
00 33
01 32
02 31
03 30
04 29
05 29
06 27
07
AO 9
Al 5
RO 36
GA 6
Cg
RES 35
080
081
082
OB3
OB4
085
OB6
087
ABO
AB1
rOM
It w
M6 OX
82C55
VCC
rzT
4.5V
26 I
I
74HC04
C7
ENO
8
RA2
Z_Z_K
HC04-
SCHEM ATI C MATE INTERFACE
E314.5901A
40
39
38
37
39
38
37
a
?
1
1
40
U3
0 *p
0
3
2
-4-5 V
I
+5V
NOTES:
I. CAPACITOR VALUES IN OF UNLESS OTHERWISE SPECIFIED.
1
r
2. RESISTANCE VALUES IN OHMS UNLESS OTHERWISE SPEC.
3. USE JUMPER"A" WHEN Ull IS A 2 K ROM.
USE JUMPER "B" WHEN Ull IS A 8K ROM.
,
r'
4. LAST NUMBER USED: R8, Cl2 U18, J4
NUMFFR5 NOT USED: R. R6;., R C , C5; UI3
,
rq
Firifiririrrirr- 71
Figure B-2. A23 Interface PC Board Schematic
and Component Location Diagram
Sheet 1 of 3
B-13/14
APPENDIX B
OPTION 4200-018
C6
10 UF, 25V
P2
<
+5V
X41
5
GNO
U7
0E0 14
0E1 15
082 12
nEl
8
("IBA
7
0E5
9
086 10
087 13
=
Y1
to U6
12 D
74HC74
G
›C
1, 13,14
+5V
+5V
C 8
+5V
7 SEN VCC
2 —7— RES
R IN
3 CT RES
1 REF GND
10 _C2 _C3
V
1CUF I ,1
17
U5
8
6
R3
4.75K
11
U4
TL7705
6
26
00
Di
D2
03
04
05
06
07
NMI
mPEO
FTO
WA
CLK
i
2,91 REt
GND
AE0 10
9
ARi
8
AR2
483
7
6
A84
485
5
AE6
4
A87
3
4E8 25
A89 24
A810 21
AR44 23
A812
2
CPU Z 80
AO
Ai
A2
A3
A4
A5
A6
A7
A8
18
ITT
A9
+5 V
A10
24 I
RAJ
All
Al2
2
EM A13
A14
R4 23
BACK A15
4.75K
16
+5V
Ri
1M
U11
U8
. -•
RI
VCC
30 AEO
Aei
31
32 ARP
33. AE3
34 ABA
35 ARE
36 A88
37 4E7
38 AB8
39 AER
40 A840
1
AR4
2 AR12
3
5
DO
Di
02
03
04
05
06
07
AO
Al
A2
A3
A4
A5
AS
A7
A8
A9
A10
All
Al2
VPP
C571
NC
VCC
GNO
11 0E0
12 081
13 0E2
15 083
16 084
17 OP5
18 0E6
19 0E7
12 12 _ U9
26 it +5V
28 1
14
[3
74HC32
AE9
4810
4E14
A812
WAT:1
•c!?'
10
9
8
7
6
5
4
3
25
24
21
23
2
20
2K
"B"1 o o"A"
AO
Al
A2
A3
A4
A5
A6
A7
A8
AR
Al0
All
Al2
DO
Di
02
03
04
05
06
07
6-e
W-A
CS2
NC
VCC
GNO
11
12
13
15
16
17
18
19
22
27
25
080
nst
082
0E3
0E 4
OEE
0E6
087
+5V
28
14 i
Nviv
C10
1
ABO
ABI
A82
AB 4
A8 5
080
081
082
063
084
065
DB6
087
2 Ult0
5
c
C
28
19
21
22
20
27
A81
A82
A83
_AB 4
_Af15
A86
487
ABB
U4
U4
AE0
74HC32
13 1 0
d
12
+5V
C
11
10
rdWA
0
9C
XINT
ZCLK
RST
5 C H EMAT IC (vIATE IKITE.FAC E
83145302A
Figure 8-3. A23 Interface PC Board Schematic
Sheet 2 of 3
B-15/16
APPENDIX B
OPTION 4200-018
U15
18
3
OR7
0E6
01
16 c 02
03
5
04
ne5
084
i S i 16
0 .
2 o • 15
3 o • 14
4 o . 13
5 o • 12
6 o . 11
7 o . 10
8 o • 9
Di
1
02
4
03
1
04
74HC240
RSW
OBO
OB1
D82
063
084
DEE
0E6
DB7
U14
U12
Afla
AF15
14
A
13 8
15
dg
12
75
11
71 D-10
9
U12
AB4
AB5
8
I
c g
+ 5V
74HC13 9
75
5
71 D
6
7
82 C5 4
7r!
9
C80
CLKO
00
OR1
7 01 GATEO 11
10
OR2
D2 OUTO
np_
03
0E4
4
15
D4
CLK
14
D5 GATE1
13
0E6
06
OUT 1
07
18
CLK2
16
RO
AO
GATE2
20
17
A1
OUT2
/oPn 22 PrO
24
23 gid
VCC
12
—2-17
GND
?
Cl2
P-57
080 10
nal
riF2
OR:i
I1F14
ne5
nes
ne7
11
12
13
14
16
ARO
AB
ARP
IOPO
6
7
8
T(.7-4
a-P-rg
4
3
39
2
g7-TT
177
71K
9
ig
+5v
SCHEMATIC , MATE INTERFACE
.'514-5S 03A
RA1
20
00
D1
D2
D3
04
05
06
D7
AO
Al
A2
RD
DIO1
DIO2
DIO3
DIO4
0105
D106
0107
0108
J2
U17 75160A
U16
U4
ZCLK
6
01 13
02 8
03
04
+5V
ABO
A81
AB2
rdr–
:;0
IOWR
TATi
14 c 01
7c
02
12, 03
9 c19 c
0E3
nAP
neo
-
MBOX
U15
38
37
36
35
34
33
32
31
12
13
14
15
16
17
18
19
1
10
08
07
06
D5
88
87
B6
85
B4
B3
B2
81
PE
VCC
o4
D3
02
01
TE
GNO
9
8
7
6
5
4
2 <
DIO1
DIO2
< 0103
4
134 << 00110054
< 0106
15
16 < 0107
< 0108
3
2
+5v
99I4
U18
REN
TR
IFC
AGR
ARO NDAC
1. NRFD
N-1
A-E.
DAV
EOI
CLK
ATN
SRG
VCC
TE
GND CONT
22
23
24
26
27
28
ea
21
30
la
18
17
16
15
14
12
1
11
75161A
2
REN
BREN
3
IFC
BIFC 4
NCAO BNOAC
NRFD ENRFD
n,,,
KAY
"'
E
EEO'
ATN
BATN
SRG
ESRO
TE
VCC
DC
GND
9
RNIFI
F
E FNc D
r
NDAC
6
11
10
12
2.4
DAV
EOI
ATN
SRG
SHIELD
COM
COM
Figure 8-4. A23 Interface PC Board Schematic
Sheet 3 of 3
B-17/18
APPENDIX C
OPTION 4200-03
APPENDIX C
INPUT CHANNEL 2
OPTION 4200-03
C-1.
DESCRIPTION.
Option 4200-03 provides an additional
C-2.
measurement channel (channel 2) that Is
completely similar to channel 1 except for
mounting and Input connector location. The
Input channel 2 connector for this channel is
mounted on the rear panel of the instrument.
With this option installed, measurements may
be made on each channel Individually, or both
channels can be monitored automatically and
the difference in dB displayed. This option
consists of an input module, complete with
chopper, that connects to the 40 line bus and
has Its own power connector. Connections are
shown in Figure 7-8.
C-3.
INSTALLATION AND REMOVAL.
To Install and remove the Input Channel
C-4.
2 Option, proceed as follows:
a. Turn the Instrument bottom up. Remove
the screws that secure the bottom cover and
slide the bottom cover back and off.
Install the rear input connector at the
b.
left side of the rear panel.
c. Dress the cable from the rear input connector down the left side frame of the
instrument (as viewed from the bottom of the
Instrument) and across the front sub panel.
The cable will run below the module being
installed.
d. Secure the cable grounding lug under the
uppermost, right-most binder-head screw
(6-32) in the front sub-panel.
Install the channel 2 Input module and
e.
secure it to the side frames of the Instrument with the four screws supplied.
f. Remove the four corner screws that secure
the channel 2 input module cover and remove
the cover.
g. Plug the chopper into the channel 2 input
module, seating the chopper firmly.
h. Connect the 40 pin ribbon cable connector
to the front edge connector of the channel 2
input module.
1. Connect the power cable supplied to the
power supply (position 8) with the black lead
on the right side (as viewed from the bottom
of the instrument), and to the input module
(rear) with the black lead on the right.
1. To remove the channel 2 input module,
reverse the above procedure.
C-5, OPERATION.
C-6. When option 4200-03 Is installed, each
of the two Input channels may be operated
with any of up to eight sensors. Channel and
sensor data entered through the keyboard are
selected as a set; that is, once a channel
selection followed by a sensor selection has
been made, subsequent selection of that channel causes selection of that sensor automatically. Subsequent selection of that sensor
through the keyboard, however, does not cause
automatic selection of that channel. Sensor
assignment to a particular channel can be
changed at any time by selecting the channel
through the keyboard, then making another
sensor selection through the keyboard.
C-7. Channel 1 and channel 2 operating procedures are basically the same as those
described in Section II of thts manual. A
channel 3 mode of operation may also be
selected. In channel 3 mode, the input
levels to channels 1 and 2 are both monitored, and the difference between the two
inputs, in dB only, Is displayed on the
instrument LED display. The following parameters selected for channels 1 and 2 prior to
selection of the channel 3 mode remain operative for channel 3 mode operation:
a. Autoranging or range hold (for each channel).
b.
Limits (for each channel).
c.
dB reference levels (for each channel).
d.
Sensor selection.
e.
Zeroing.
f.
Calibration.
C-8. When channel 3 mode has been
selected, the following keys are inactive:
a.
ZERO.
b.
CAL.
c.
MODE PWR.
d.
MODE dB (automatically In this mode).
e.
dB LIMITS LO and dB LIMITS HI.
f.
dB REF LEVEL dB.
g.
CAL FACTOR dB.
NOTE
Avoid reversal of the two ends of this cable;
there Is lead transposition.
J. Install the channel 2 Input module cover
that was removed in step g.
k. Install the side covers and the bottom
cover removed In steps a and b.
In channel 3 mode, the instrument does
respond to a CAL FACTOR GHz key command,
applying the stored calibration factor for
each selected sensor for that frequency.
(Refer to Tables 5-19, 5-20, 5-21 and 5-22.)
For a description of recorder output in the
Channe1-3 mode, see page 3-13, paragraph
3-33c.
C- 1
APPENDIX C
OPTION 4200-03
C-9.
MAINTENANCE.
C-10. The procedures used to Isolate
malfunctions to the channel 2 input module
are similar to those described for the channel 1 input module in Section V. (Refer to
paragraph 5-22.) Signature analysis techniques are used to isolate defective parts on
the channel 2 input module. For convenience,
the signature analysis information for the
channel 2 input module is Included in Section
V. (Refer to Tables 5-19, 5-20, 5-21 and
5-22.)
C-44.
REPLACEABLE PARTS.
C-45. Table 6-2 lists all the replaceable
parts and Includes; Reference Symbol,
Description, Mfr., Mfr's Part No., and the
BEC Part No., for the channel 2 input module
which Is Identical to the channel 1 input
module P/N 042230018.
C-46.
SCHEMATICS.
C-47. Refer to Figures 7-6, Sh 1 and 2 Input
Module Board A6 Schematic Diagrams for the
channel 1 and channel 2 schematics and parts
location diagram.
APPENDIX D
OPTION 4200-04
APPENDIX 0
REAR INPUT
OPTION 4200-04
0-1. DESCRIPTION.
0-2. Rear input option 4200-04 provides a
second power sensor connector on the rear
panel for those applications where sensor
connection to the rear of the instrument may
be more convenient. The second power sensor
connector is connected in parallel with the
front panel SENSOR connector. Refer to
Figure 7-3.
D-3. OPERATION.
0-4. To operate an instrument equipped with
the 4200-04 option, connect the power sensor
cable to either the front panel or rear panel
input channel I connector, as desired, and
affix the shield supplied with the option to
the unused connector. Then, proceed with
operation as described in Section II of the
4200 manual.
NOTE
Do not attempt to use both input connectors
at the same time; use only one and make sure
that the shield is affixed to the other.
APPENDIX E
OPTION 4200-06
APPENDIX E
INTERNAL TMA (MATE)
OPTION 4200-06
ditions preset during power-up. When the
system controller places the 4200-06 into the
REMOTE mode, the above initializations will
be restored. All panel controls are inoperative while the 4200-06 is in REMOTE mode.
E-1. DESCRIPTION.
E-2. The 4200-06 option provides IEEE-488
programming syntax which conforms to MATE
System Control Interface Standard. The protocol is the CIIL subset of the ATLAS control
language.
E-9. The 4200-06 option supports two-channel
operation if the second-channel hardware is
Installed. Attempts to access a non-existent
channel will generate an illegal channel
error message. The first channel is
addressed as :CHO or :CHOO, and the second
as :CHI or :CH01.
E-3. The 4200-06 option consists of the
items listed in Table E-1.
E-4. MATE CONFIGURATION.
E-5. The 4200-06 option allows two main
modes of operation, selected by Bit Switch 8
of the Interface Board Bit Switch as listed
in Table E-2.
E -10. OPERATION.
E-11. Users of this option must be familiar
with the MATE standard. Only the specific
CIIL commands and protocols applicable to the
4200 are discussed in this supplement.
E-6. The MATE/native mode selection is made
during power-on initialization. To change
mode, the instrument must be turned off
before Bit Switch 8 is changed. When power
Is re-applied, the new mode will be in
effect.
E-12. A MATE measurement consists of the
following operations:
a.
b.
c.
d.
e.
f.
E-7. When the 4200-06 powers up in the MATE
compatible mode, the active channel is set to
the following conditions:
a.
b.
c.
d.
e.
dBm Mode
Autorange Mode
High dB Limit = 99.99
Low dB Limit = -99.99
Raw data flag cleared
FNC
CLS
INX
FTH
OPN
RST
command
command
command
command
command
command
E-13. Each of the first three steps (SETUP,
CLOSURE and INITIATION) must be done in that
sequence. An error message will be generated
if the requisite prior steps have not been
successfully performed.
E-8. While the 4200-06 is in IEEE-488 LOCAL
mode, all panel functions are available to
the operator. This includes all of the con-
TABLE E -1.
SETUP:
CLOSURE:
INITIATION:
RESULT FETCH:
DISCONNECT:
RESET:
4200-06 Option Items.
Item
P/N
Location
Replaces
P/N
A23
04223500A
A23 Interface Bd.
A23
042317010
106
53442800A
A5 Control Bd.
A5IC6
534317000
IC7
53442900A
A5 Control Bd.
A5lC7
534318000
TABLE E-2.
8
7
Bit Switch No.
6 5 4 3 2
Operating
Mode
Native (non-MATE)
0
C
1
Bit Switch Si Settings.
X
X
IEEE-488 control
MATE compatible IEEE-488 control
C = closed (Logic 0), 0 = open (Logic 1), X = don't care,
- = as required.
APPENDIX E
OPTION 4200-06
SETUP. The SETUP command syntax is as
E-14.
follows:
h.
Frequency limit out of allowable range:
FO7PWMOn (DEV): ILLEGAL FREOUENCY PROGRAMMED
POWEKMEIER <cr><If>
FNC ACS POWR :CHn (optional limits) <cr><If>
where :CHn = :CHO, :CHOO, :CH1, or :CHOI
<cr> = ascii return, <If> = ascii line-feed
Notes: csp> = ascii space
n = 0 or 1
zZz = unrecognized or illegal
operand, truncated to 20 char.
The optional limits set minimum and
E-15.
maximum values for power, and the operating
frequency. These Ilmits will default to
values appropriate for the particular sensor
In use, with the minimum power set to -99.99
dem.
E-20.
Errors b, c and d are general syntax
errors, and may occur during any improperly
constructed command string. In the sections
that follow they will be termed "syntax
errors", and will not be separately shown.
E-I6. With the 4200-4E sensor, for example,
the default limits would be:
E-21.
A special form of setup is used to
command the auto-zeroing cycle:
Maximum power
= +10.00 am
Minimum power
= -99.99 am
Signal frequency = 200 kilohertz
FNC ACS ZERP :CHn <or><If>
E-17. Each limit may be optionally set
within the FNC command string. Any Ilmit not
set will retain its default value:
Command
Comment
SRX POWR value
Max power: range = PMIN
to sensor max
Min power: range = -99.99
dam to PMAX
Use sensor determined
defaults
Frequency: range = sensor
min to sensor max
SRN POWR value
SET POWR AUTO
SET FREQ value
Note: value = ascii numeric string, fixed or
floating point
E-22.
The measurement cycle which follows
becomes a dummy measurement during which
auto-zeroing occurs. The CLS, INX and FTH
operations described below must still be performed to accomplish autozeroing.
E-23.
CLOSURE. After successful SETUP, the
4200 must be CLOSED. The command syntax is:
CLS :CHn<cr><If>
E-24.
The channel number must agree with the
current active channel, as set by the FNC
command string. If it does not, an Illegal
channel message will be generated.
E-25.
In addition to syntax errors, the
following messages may be generated:
a.
E-I8. If no error is detected while parsing
the FNC string, the active channel will be
set as determined by the :CHh modifier, and
the limit values will be effective until a
new SETUP or a RESET occurs.
E-19. The following messages may be
generated while parsing the SETUP command:
a.
b.
c.
No error:
<sp><cr><If>
FO7PWMOn (MOD):
Unrecognized operand:
ILLEGAL NOUN/NOUN MOO. zzz<cr><if>
FO7PWMOn (MOD):
Operand out of sequence:
ILLEGAL zzz PROGRAMMED POWERMEIEH <cr><If>
d.
Missing operand(s) at end of command:
FO7PWMOn (MOD): ILLEGAL SYNTAX PROGRAMMED
POWERMETER <cr><If>
e.
Improper channel command: FO7PWMOn
No error:
<sq><cr>clf>
Improper channel command:
FO7PWMOn
(DEV): ILLEGAL CHANNEL PROGRAMMED
b.
POWERMEiER <cr><If>
c.
Instrument not SETUP:
FO7PWMOn
POWERMETER NOT SETUP <cr><1f>
(MOD):
INITIATION. Each measurement must be
E-26.
INITIATED before any result can be obtained.
The command syntax is:
1NX POWR ccr><If>
E-27.
If no error condition Is encountered
while parsing the above command, the 4200
computes the time required to complete the
measurement and places the time In the output
The output buffer Is enabled, and
buffer.
the controller Is expected to read this value
and use it to determine Its I/0 timeout
limit.
(DEV): ILLEGAL CHANNEL PROGRAMMED
POWERMETER <cr><It>
f.
Maximum voltage out of allowable range:
FO7PWMOn (DEV): ILLEGAL MAXIMUM PROGRAMMED
POWERMEIER <cr><1f>
g.
Minimum voltage out of allowable range:
FO7PWMOn (MOD): ILLEGAL MINIMUM PROGRAMMED
POWERMEIER <cr><If>
E -2
E-28.
A measurement is then initiated.
DurIng this time, the 4200 is able to accept
the follow-on FTH command string, but will
not return data until the measurement is
complete.
E-29.
A special case for INX is created when
the ZERP noun-modifier was used in the FNC
command. The time required to complete the
autozero cycle will be returned. The result
phase (FTH) after autozero is always zero,
unless an error is being reported.
APPENDIX E
OPTION 4200-06
E-30. In addition to syntax errors, the
following messages may be generated:
a.
No error:
<so>dddd<cr><If>
Instrument not SETUP: FO7PWMOn (MOD):
b.
POWERMETER NOT SETUP <cr><If>
E-38.
In addition to syntax errors, the
following messages may be generated:
a.
No error: <sp><cr><1f>
Improper channel command:
FO7PWMOn
(DEV): ILLEGAL CHANNEL PROGRAMMED
b.
POWERMETER <cr><If>
Instrument not CLOSED: FO7PWMOn (MOD):
POWERMETER NOT CONNECTED <cr><1f>
c.
c.
Instrument not SETUP:
FO7PWMOn
POWERMETER NOT SETUP <cr><If>
(MOD):
Note: d = ascii numeric digit (0 - 9)
RESULT FETCH. The measurement value
E-31.
is requested by the command:
E-39.
RESET. The RESET command addresses a
specific channel, clears any pending error
mess-ages and sets the 4200 to not-SETUP status. The syntax is:
FTH POWR <cr><If>
RST ACS POWR :CHn<cr><If>
E-32.
The instrument will determine if a
settled reading was possible within the
settling time limit reported to the
controller during the 1NX command. The
measurement value is tested against the maximum and minimum limits established during the
SETUP command. If no errors occur, the
reading is loaded into the output buffer;
otherwise, an error message is loaded.
Execution of the FTH command also
E-33.
returns the 4200 to CLOSED and not-INITIATED
status. Any number of successive INX - FTH
measurement cycles may be performed while
still CLOSED.
In addition to syntax errors, the
E-34.
following messages may be generated:
a.
No error:
<sp>0.ddddEsd<cr><If>
Instrument not SETUP; FO7PWMOn (MOD):
b.
POWERMETER NOT SETUP <cr><If>
Instrument not CLOSED: FO7PWMOn (MOD):
c.
POWERMETER NOT CONNECTED <cr><If>
d. Measurement not INITIATED: FO7PWMOn
(MOD): MEASUREMENT NOT INITIATED <cr><If>
e.
Measurement did not settle: FO5PWMOn
<cr><1f>
(DEV): MEASUREMENT TIMEOUT
f.
E-40.
An illegal channel error message is
generated if the channel addressed does not
exist.
E-41.
The IEEE-488 bus command DCL (Device
Clear) will perform a RESET on the currently
active channel.
E-42.
In addition to syntax errors, the
following messages may be generated:
a.
No error: <so><cr><1f>
Improper channel command:
FO7PWMOn
(DEV): ILLEGAL CHANNEL PROGRAMMED
b.
POWERMETER <cr><If>
E-43. SELF TEST. Two self-test commands are
recognized by the 4200, but the same internal
test is done for both. The test is a checksum verification of the 4200 program memory.
The command syntax is:
CNF<cr><If> or IST<cr><If>
E-44. Each of these commands also does an
implied RESET, returning the 4200 to
not-SETUP status, and clearing any pending
errors prior to self-test.
E-45. In addition to syntax errors, the
following messages may be generated:
Measurement exceeded maximum limit:
FOOPWMOn (DEV): MEASURED POWER GREATER THAN
a.
No error: <sp><cr><If>
b.
Checksum error, CNF command: FO7PWMOn
MAXIMUM <cr><If>
g.
Measurement less than minimum limit:
(DEV): CONFIDENCE TEST FAILURE <cr><If>
FO1PWMOn (DEV): MEASURED POWER LESS THAN
MINIMUM <cr><If>
Checksum error, 1ST command:
FO7PWMOn
(DEV): BIT TEST FAILURE RAM/ROM <cr><If>
c.
Notes: s = exponent sign, +/DISCONNECT. The 4200 may be logically
E-35.
disconnected from the test system by the command:
OPN :CHn<cr><If>
The channel Identification must agree
E-36.
with the currently active channel; otherwise
an illegal channel error will be generated.
The channel must have been SETUP prior to
Issuing this command.
After execution of the OPN command, it
E-37.
is necessary to send the CLS command prior to
INX and FTH commands.
E-46. STATUS COMMAND. Messages in the output buffer must be enabled prior to being
sent to the controller. Except after an INX
or FTH command, which implicitly enable the
output buffer, the STA command must be sent
to access the current message. When the STA
command is received by the 4200, the no-error
message is loaded unless an error message is
already present, and the buffer is enabled.
A subsequent talk command on the IEEE-488 bus
will cause the message to be sent to the
controller.
E- 3
APPENDIX E
OPTION 4200-06
E-47. Any error message in the output buffer
prevents further loading of the buffer until
the message is sent over the bus, or a RESET
occurs.
E-48.
The syntax for the STATUS command is:
E-51. To perform any of the maintenance procedures outlined in Section IV of the 4200
Manual, set Interface Board Bit Switch 8 for
native mode operation. This will allow
IEEE-488 access to instrument calibration
functions. Restore the MATE configuration
after maintenance procedures are complete.
STA<cr><1f>
E-52.
If no error message exists in the outE-49.
put buffer, the following message is generated:
a. No errors:
E-50.
<sp><cr><1f>
MAINTENANCE.
REPLACEABLE PARTS.
E-53. Table 6-2 lists all the replaceable
parts and includes; Reference Symbol,
Description, Mfr., Mfr's Part No., and the
BEC Part No.
E-54.
SCHEMATICS.
E-55. Refer to Figures 82, B3, and B4 for
the schematics for the 4200-018 Option.
APPENDIX F
OPTION 4200-S/17
APPENDIX F
REAR INPUT
OPTION 4200-S/17
F-1.
F-3.
DESCRIPTION.
NOTE
The -S/17 option can only be used in conjunction with the -03 option.
F-2. Rear input option 4200-S/17 provides
channel inputs on both the front and rear
panels so that the sensor connections to the
second power sensor connector on the rear
panel for those applications where sensor
connection to the rear of the instrument may
be more convenient. The second power sensor
connector Is connected In parallel with the
front panel SENSOR connector. Refer to
Figure 7-8.
OPERATION.
F-4. To operate an instrument equipped with
the 4200-S/17 option, connect the power sensor
cable to either the front panel or rear panel
input channel connector, as desired, and
affix the shield supplied with the option to
the unused connector. Then, proceed with
operation as described in Section II of the
4200 manual.
NOTE
Do not attempt to use both input connectors
at the same time; use only one and make sure
that the shield is affixed to the other.
BOONTON
ELECTRONICS
CORPORATION
MODEL 4200 INSTRUCTION MANUAL SUPPLEMENT
FOR THE MODEL 4200-S/21
June 17, 1987
Instruction-manual supplements are issued as required to correct errors In
a manual, and to adapt the manual to changes made after its printing.
Make the following additions to the Manual.
1.
The following items have been added to the Model 4200 for the -S/21:
a.
Batteries BT2 and BT3.
Refer to Figure 1.
(2) 1.5 V alkaline batteries replace BT1.
b.
An Elapsed Time Indicator MI and associated 357 k ohm resistor.
Refer to Figure 1.
c.
A 1 k ohm resistor is connected to the recorder output and rear panel
ground to provide a 1 V full scale output.
2. Extending the RMS measuring range of sensors note.
The true RMS detection area of the 4200-4E-S/21 sensor is from -60 dBm to
a.
-20 dBm and -40 dBm to 0 dBm for the 4200-6E sensor. These ranges may be
extended by adding attenuation to the sensor input. For each dB of attenuation
added the RMS range will shift upwards by 1 dB.
The low end sensitivity will
also rise by 1 dB. By adding the 20 dB attenuator 951054/2 supplied In the
4200-5/21 Test Set, the RMS ranges will be changed to -40 to 0 dBm for the
4200-4E-S/21 and -20 to +20 dBm for the 4200-6E.
To correct the display for the attenuator in use enter the attenuation value
b.
for the frequency of interest from the calibration data sheet supplied with the
attenuator and then press the REF LEVEL dB key.
If the attenuation value at 16 GHz is -19.85 dB as read from
c.
For example:
the Calibration Data Sheet, press 1, 9, ., 8, 5, CHS, and then press the REF
LEVEL dB key.
d.
This technique will work with any attenuator for which absolute attenuation
values across the frequency range are known. Attenuators are not calibrated
with specific sensors and are not required to be matched as pairs.
On Page 1-8, Table 1-2, change the 4200-4E-S/21 MAX. SWR speicifIcations to
3.
<1.4 from 4 GHz to 18 GHz.
4.
On Page 2-2, paragraph 2-7b, replace the following text and table:
b. Recorder Output. Recorder connector J20 (type BNC) on the rear panel provides an analog DC voltage for application to a remote recorder. The output
The analog DC voltage is proportional to the
resistance Is 1000 ohms.
following:
In the power mode, it is proportional to displayed power, with 1 volt for
(1).
full scale each range, either channel.
In the dB mode, it Is proportional to displayed dBm with the relationship
(2).
shown below:
Recorder Output
dBm
Series
4/7/K/KA/Q
(volts)
Series
5/8
(volts)
+30
+20
+10
0
-10
- 20
-30
- 40
-50
-60
.9
.8
.7
.6
.5
.4
.3
.2
.9
.8
.7
.6
.5
.4
.3
.2
-
Series
6
(volts)
.9
.8
.7
.6
.5
.4
.3
.2
Page 1 of 3
5.
On Page 3-11, paragraph 3-33, replace the following text:
b.
In the dB mode, the DC output level is proportional to dBm according to the
formula (Series 4/7/K/KA/Q Sensors)
VOUT= ( . 8 + dBm) volts
1150
Example: The voltage output at -20
dBm would be:
(.8 + -20) volts=.6 volts
Tn.
This output is a function of dBm only, but is effected by CAL FACTOR entries.
In the Channel-3 mode of operation (Option -03), the recorder output is proc.
portional to the difference In dB of channel 1 minus Channel 2. This output is
effected by both the calibration factors and the dB reference levels entered In
each channel. The equation is:
RECORDER OUT (VOLTS)
= (dBch.1 +dB CAL FACT CHI -dB REF.ch.1) - (dBch.2 +dB CAL FACT CH2 +dB REF.ch.2
100
Or, equivalent:
RECORDER OUT (VOLT) = dB display +.8
100
Valid recorder outputs will be obtained for display Indications of -80 dB (0
volts) to +30 dB (1.1 volts).
6.
On Page 5-22, paragraph 5-34, replace the following text:
e.
With 1.000 mW indicated on the LED display, check the indication on the
digital multimeter; it should be .98 to 1.00 volts.
If the indication is
correct, proceed directly to step h; if the indication Is Incorrect, proceed to
step f.
f.
If the digital multimeter indication In preceding step e was Incorrect, set
the control board bit switch to CALIBRATE MODE 1, Refer to Figure 5-3) and press
the dB LIMITS LO key on the keyboard.
The LED display will show a gain modifier
of approximately 3600.
Calculate a revised gain modifier value to obtain the
required correction. For example: if the digital multimeter indication were .90
volts (0.4% low) and the dB LIMITS LO key recalled a gain modifier of 3500, the
revised gain modifier value would be:
1.004 X 3500 = 3514.
Enter this revised gain modifier value by pressing the following keys on the
keyboard:
3, 5, 1, 4
dB LIMITS LO
dB LIMITS LO (revised value should appear on the LED display)
g.
Reset the control board bit switch to OPERATE MODE O. Refer to Figure 5-3.
Note the indication on the digital multimeter; it should be .98 to 1.00 volts.
Repeat steps f and g, If necessary, until the correct indication is obtained.
Set the power meter calibrator output to 0.126 mW, and observe the indicah.
The millitions on the Instrument LED display and on the digital multimeter.
volt indication on the digital multimeter should equal the value shown on the
If the digital multimeter indication is incorrect, adjust
LED display ±1 count.
potentiometer R55 on the Input module board as required to provide the proper
digital multimeter indication.
Page 2 of 3
,•-•
-•••^•
- • ^ N ^ ....... • - • • - • ^•
_•
--_-_-_-_-_-_-___
wr..■
oneeeAre..V.V^W^
•••■•
.....
- • • -
•
-
•■•■•• . • • ■••,,...n•■••
.....
?"1'1.:14=2).
.
,,
— .......__ ____
—_ —
—.
-—
_
_______
___
=
-::-----------—---—
—
—
---— ---=::
-- ::::—= - -,:÷-1 r`` i"--':
_
-—. \ ‘.,:
—_—__
—--- ____
_ 7 ....... ===-----=
==---—
:-----.-. . . ___---___
—.
——
---- .—
• '-, ,,
_— -- ,
/7-----,
MA•.iI
"" • ' -•
\ 'cV *
"*..;11:5t
---- 2=2= 7::
— --...— —__
-----=_______
.......—____ _
— ___
—
''
—
_
---
-
--
—
—
-., ‘`,
,\,
- —
-".
..
:S:=1.4:7;11K:114:11:-
-• N
`'..
—
•\
‘..
-
-.t:
`...„
-,
,,
..„.
-
:::;:=7;1=1.1.; -- —
-
----2.7.::7-,n—L;;;--
1.
•- X
sEE
..
No-re
.
Figure 1
Page 3 of 3
7.1
514EET SPECIFIES PART NLIMSER C422340tA
.OLE
T01.
003 '4'133 'Kin° OtICAIPTIO.
;
MOLE 1.101.0
B 0 ONTON
NOTE:
I.P2, P3 P4 1TO BE FLUSH SQuARE
WI714 BoAcalo suRVACE.
ELECTRON1C8
P.W. ASSY
CONTROL.
•
32 stian.8 ro-
20
28
27
26
25
24
23
22
21
70
10
1 CI
r
16
15
14
RANDOLPH
NEW JERSEY
13
12
11
I0
7
mi.
I
• ./3
0.0 NO.
D 042234N
...e
SAMPLE CALIBRATION CERTIFICATE
131E3DNIT ID NI
CDRIF"-
INST SERIAL # 289519BC -TYPE: S/16
SENSOR SERIAL # 13525 -TYPE: 6E
EPROMS: 3148C, 3658C, and 322BC used in the 01A option
DATE: 3/6/87
This is a step by step procedure for reentering the
calibration data into the NON VOLATILE MEMORY of this BOONTON
ELECTRONICS model 4200 R.F. MICROWATTMETER.
Care should be taken to make sure the BIT SWITCH is configured
per instructions. The BIT SWITCH is located under the top cover
of the 4200 in the rear left corner. Also be certain that the
numbers you enter agree EXACTLY with the numbers on the printout.
Data is entered TOP TO BOTTOM, LEFT TO RIGHT. If a mistake is made
depress the CLEAR BUTTON and start at the top of the entry again.
NO -1L: C.F.dB 18 A DEPRESSION OF THE CAL FAC dB BUTTON.
R.L.dB IS A DEPRESSION OF THE REF LVL dB BUTTON.
BIT SWITCH 1 - OPEN, BIT SWITCH 2 - CLOSED
1
3020 1000
0
LHNL LO AUTO HOLD
1001
R.L.dB
1
HOLD
1001
R.L.dB
2
HOLD
998
R.L.dB
3
HOLD
995
R.L.dB
4
HOLD
990
R.L.dB
5
HOLD
1000
R.L.dB
ea
HOLD
994
R.L.dB
BIT SWITCH 1 - OPEN, BIT SWITCH 2 - CLOSED
1
SENS
3525
HI
1000
C.F.dB
GHz
BIT SWITCH 1 - CLOSED, BIT SWITCH 2 - OPEN
0
•
HOLD
4600
R.L.dB
4
1
HOLD
4600
R.L.dB
4
CHS
CHS
HI
HI
2
HOLD
4637
R.L.dB
4
CHS
HI
3
HOLD
4682
R.L.dB
7
CHS
HI
4
HOLD
4718
R.L.dB
5
HOLD
4649
R.L.dB
9r
11
CHS
HI
CHS
HI
6
HOLD
4855
R.L.dB
0
HI
0
1
2
3
4
5
6
7
8
9
10
AUTO
AUTO
AUTO
AUTO
AUTO
AUTO
AUTO
AUTO
AUTO
AUTO
AUTO
0.0
1.0
2.0
4.0
3.0
5.0
6.0
7.0
8.0
9.0
10.0
GHz
GHz
GHz
GHz
GHz
GHz
GHz
GHz
GHz
GHz
GHz
0.00
.33
.44
.43
.13
.26
.55
.63
.79
.87
.78
C.F.dB C.F.dB C.F.dB C.F.dB C.F.dB C.F.dB C.F.dB C.F.dB C.F.dB C.F.dB C.F.dB
11
12
13
14
15
16
19
0
17
18
AUTO AUTO AUTO AUTO AUTO AUTO AUTO AUTO AUTO AUTO
11.0
12.0
13.0
14.0
15.0
16.0
17.0
18.0
18.0
GHz
GHz
GHz
GHz
GHz
GHz
GHz
GHz
GHz
.68
.39
.37
.16
.20
.19
0.00
.18
.18
C.F.dB C.F.dB C.F.dB C.F.dB
CHS
CHS C.F.dB
CHS
CHS
C.F.dB C.F.dB
C.F.dB C.F.dB
BIT SWITCH 1 - CLOSED, BIT SWITCH 2 - CLOSED
SAMPLE CALIBRATION CERTIFICATE
BOONTON ELECTRONICS CORP.
DATE: 3/3/87
FREO
(6Hz)
1.00
2.00
3.00
4.00
5.00
6.00
7.00
8.00
9.00
10.00
11.00
12.00
13.00
14.00
15.00
16.00
17.00
18.00
REF COEFF
(RHO)
0.012
0.007
0.018
0.026
0.028
0.021
0.024
0.030
0.023
0.006
0.010
0.005
0.019
0.028
0.033
0.049
0.065
0.046
SENSOR MODEL: SE-S/16
SERIAL NUMBER: 13525
SWR
1.02
1.01
1.03
1.05
1.05
1.04
1.04
1.06
1.04
1.01
1 .01
1.00
1.03
1.05
1.06
1.10
1.13
1.09
CAL FAC
(dB)
0.13
0.33
0.44
0.43
0.26
0.55
0.63
0.79
0.87
0.78
0.68
0.39
0.37
0.16
-0.20
-0.19
-0.00
-0.18
Sensor data is within specifications.
BOONTON
Description
The Model 2500 is a precise, highly stable DC range calibrator that provides the voltage levels and source resistances that are necessary to calibrate the Model 4200 and
9200 series instruments.
CALIBRATOR
DC Range Calibrator
Model 2500
Specifications
• Accurate, convenient, and self contained.
• Designed for calibrating the Model 4200 and 9200
series instruments.
Ranges and Outputs:
Range
Output Voltage
0
9µV
1
90 p.V
2
900 i.LV
3
9 mV
4
90 mV
5
900 mV
6A
1.8 V
6B
4.5 V
Accuracy: ± 0.15%, all ranges.
IZEROI
I RANGE]
IZEROI
Source Resistance:
Low
9000 to 180052.
300 kt2 3001d2 ± 2%.
5001(0, 500ki1 ±2%
Temperature Influence:
Operating:
21° to 25°C.
Non-operating: — 20° to 75°C.
Power Consumption: 7 VA; 100, 120, 220, 240 V ± 10%, 50 to 400 Hz.
Dimensions: 5.2 in (13.2 cm) high, 8.3 in (21.1 cm) wide, and 11.5 in (29.2
cm) deep.
Weight: 5.9 lbs (2.7 kg).
2500 DC RANGE CALIBRATOR
Boonton
Model 25A
TRACEABILITY.
PURPOSE AND USE OF EQUIPMENT.
The Model 25A is a precision,
solid-state instrument designed to provide accurate 1 MHz signal levels
required in the calibration of all
Boonton RF microwattmeters, Model 41 and
42 series. Full scale and incremental
values for each range are provided,
allowing verification and calibration of
both full scale and down scale indications.
The Model 25A is factory
calibrated using instrumentation whose
accuracy is traceable to the National
Bureau of Standards. Periodic calibration of 0 dBm and -9 dBm outputs is
accomplished using thermal transfer
techniques. The accuracy of other full
scale and down scale ranges is determined by precision attenuators which are
tested at the factory and should not
require periodic calibration.
PERFORMANCE SPECIFICATIONS
Parameter
Power Ranges:
Specifications
Full Scale -60, -50, -40, -30, -20, -10, 0, ±10, ±20 dBm
Down Scale 0 to -9 dB in 1 dB steps
Output Power Accuracy: ±0.05 dB (at 25°C ±5°C for 90 days, 15 minute warm-up)
Temperature Influence:
±0.001 dB/°C from 0 to 50°C
Harmonic Distortion:
<0.15% total harmonic distortion
Output Frequency:
1 MHz, crystal controlled
Output Impedance:
50 ohms ±0.5%
Temperature:
Operating 0 to 50°C
Input Power:
100, 120, 200, 240 VAC ±10% 50 to 400 Hz, 7 VA
Dimensions:
5.2" high (without feet), 8.3" wide, 11.5" deep
Weight:
7.75 lbs. (3.6 kg)
Non-operating -20 to 75°C
BOONTON
BOONTON ELECTRONICS CORPORATION
BOONTON ELECTRONICS CORPORATION
791 ROUTE 10, RANDOLPH, NJ 07869
(201) 584-1077 TWX: 710-986-8215
FAX: (201) 584-3037