1
Eyenal Manual
(Windows)
for use with ASL Series 5000
Manual Version 1.3
1
TABLE OF CONTENTS
EYENAL MANUAL
Table of Contents
1. INTRODUCTION
1.1 File Naming Conventions
2. VIEW RAW DATA FILE
3. CALCULATE FIXATIONS
3.1 Purpose and Application
3.2 Making a Fixation File
3.2.1 Start-Stop Criteria
3.2.2 Fixation Criteria
3.2.2.1 Brief Description of Fixation Algorithm
3.2.2.2 Fixation Criteria Menu Options
3.2.2.3 Fixation Algorithm Criteria Description
3.2.3 Visual Angle Computation
3.2.4 Sample Calculations of Eye Tracker Units per Degree Visual Angle
3.2.5 Detailed description of Fixation Algorithm
4. DEFINE AREAS OF INTEREST (AOIs)
4.1Purpose and Application
4.2 Making an AOI File
4.3 Editing an AOI File
5. FIXATION SEQUENCE ANALYSIS (AREA OF INTEREST STATISTICS)
5.1 Purpose and Application
5.2 Making an Fseq File
5.3 Viewing Fseq file output
5.3.1 AOI Summary
5.3.2 Transition Table
5.3.3 Conditional Probability table
5.3.4 Joint probability table
6. CALCULATE DWELL STATISTICS
Applied Science Laboratories
175 Middlesex Turnpike
Bedford, MA 01730
ASL308-M-976
970728
Copyright c 2001, by Applied Science Group, Inc.
2
TABLE OF CONTENTS
EYENAL MANUAL
6.1 Purpose and Application
6.2 Making a Dwell file
6.3 Dwell Sequence List
6.3.1 Dwell Sequence Summary
6.4 Dwell Transition Table
6.4.1 Dwell Conditional Probability Table
6.4.2 Dwell Joint Probability Table
6.4.3 Dwell Histograms
7. CALCULATE PUPIL STATISTICS
7.1Purpose and Application
7.2 Making a "pda" file
7.3 Pupil Diameter Sequence List
7.3.1 Pupil Diameter Summary List
8. BATCH CAPABILITY
8.1 Purpose and Application
8.2 Using the Batch Function
8.2.1 Batch Fixation Files
8.2.2 Batch Fixation Sequence Files
8.2.3 Batch Dwell Files
3
TABLE OF FIGURES
EYENAL WINDOWS MANUAL
Table of Figures
Figure 1. Sample Eyedat file for model 504 with MHT Option................................................................................................................................ pg 8
Figure 2 Sample EYEHEAD data file...............................................................................................................................................................................11
Figure 3 Fixation Properties (General) pop up menu ......................................................................................................................................................12
Figure4 Start-Stop criteria menu ..........................................................................................................................................................................................13
Figure 5.Fixation Properties (CRITERIA) menu.............................................................................................................................................................14
Figure 6. Fixation Algorithm Criteria (Criteria) menu .....................................................................................................................................................17
Figure 7 AOI Properties menu.............................................................................................................................................................................................20
Figure 8 Sample AOI File .....................................................................................................................................................................................................21
Figure 9 Fixation Sequence Properties pop up menu.......................................................................................................................................................23
Figure 10 Sample Fixation Sequience List..........................................................................................................................................................................24
Figure 11 Sample Fixation Sequence Summary.................................................................................................................................................................25
Figure 12Sample Fseq Summary Table (AOI Summary).................................................................................................................................................26
Figure 13 Sample Fseq Trabsition Table ............................................................................................................................................................................26
Figure 14 Sample Fseq Conditional Probability Table .....................................................................................................................................................27
Figure 15Sample Fseq Joint Probability Table...................................................................................................................................................................28
Figure 16 Sample Dwell Properties pop up menu ............................................................................................................................................................29
Figure 17 Sample Dwell Sequence List ...............................................................................................................................................................................30
Figure 18 Sample Dwell Sequence Summary.....................................................................................................................................................................31
Figure 19 Sample Dwell Histogram data ............................................................................................................................................................................32
Figure 20 Pupil Diameter Analysis pop up menu .............................................................................................................................................................33
Figure 21 Sample "pda" file (Pupil Diameter Sequence List and Summary)................................................................................................................35
Figure 22 Batch Fixation File pop up menu ......................................................................................................................................................................36
4
EYENAL MANUAL
1. INTRODUCTION
EYENAL is an “off-line” data analysis program for processing eye movement and pupil diameter
information recorded on EYEDAT and EYEHEAD data files. EYENAL identifies eye fixations,
matches fixations with designated areas of interest on the scene, and calculates related scan pattern
statistics. Subsequent statistical data is saved in Text file formats suitable for further processing with
other data analysis or spreadsheet programs. Eyenal will also automatically export any of the original
or analyzed data to Excel.
Eyenal will list all files currently open files on the left side of the program window in a file tree. To
look at a file or any selected part of a given file left click on the desired segment and or left click the
+ sign next to a segment number to extend the file tree.
5
EYENAL MANUAL
1.1 File Naming Conventions
Some ASL analysis program features recognize certain file name extensions for performing certain tasks.
The following convention is used by ASL software.
ASL’s EYENAL FILE NAMING CONVENTIONS
DESCRIPTION
Eye data recorded by series
5000 EyeTrackers, models
1050 Pupillometers, and 210
DARS programs.
FILE TYPE
FILE EXTENSION
EYEDAT
.EYD
Integrated EYEHEAD position
EYEHEAD
data recorded by an Eye Tracker
with a MHT(Magnetic Head
Tracker) and EYEHEAD™ Integration software.
.EHD
Files created by EYENAL AOI
specifying rectangular areas of
interest on the viewed scene.
AREAS
.AOI
Files created by EYENAL FIX
containing lists of eye point of
gaze, fixations, and inter-fixation
activity.
FIXATION
.FIX
Files created by EYENAL FSQ.
matching Fixation data files created
with FIX to AOI files created by
AOI showing how a subject viewed
various scene elements
FIX SEQUENCE
.FSQ
File created by EYENAL Pupil
Diameter Analysis program
that calculates various Pupil
diameter statistics for select
portions of EYEDAT data.
PUPIL
.PDA
6
EYENAL MANUAL
Data plotting files created by the
EYENAL FIX function to
facilitate making plots of fixation
position versus time within a
statistical program such as EXCEL.
Files created by CONVERT
function to convert binary
EYEDAT or EYEHEAD files
to an ASCII format suitable for
input into other programs such as
Excel.
PLT
CONVERT
.
7
.ASC
EYENAL MANUAL
2. View Raw Data Files
To View an EYEDAT or EYEHEAD data file:
1. select “Open” from the File Menu
2. Browse to the desired EYEDAT or EYEHEAD file and select “Open” in the browser window.
Figure 1. Eyedat file
8
EYENAL MANUAL
2.1 Data Columns
Once a data file has been opened several columns of data will be shown. The file name and number of
segments will appear in a file tree format on the left side of the program screen. A segment is considered
the length of time between a start and stop of recording on the same data file. Depending on the system
configuration used while recording data these columns will differ from figure 1.
2.1.1 Eyedat Files
An Eyedat file, the standard type of file recorded with ASL’s remote (table mounted pan/tilt or Long
Range) optics, has a .eyd extension. A standard Eyedat file will have nine data columns.
1.
Field No. A field refers to the data items recorded for a single sampling interval. A
sampling interval is a 50th, 60th, 120th, or 240th of a second, depending on the model eye
tracker system used. A field contains eight pieces of data represented by rows.
2.
Segment No. A segment is a continuous section of recorded data. Every time data
recording is paused, and restarted without closing the data file, a new data “segment” is
created on that file; so a data file may have one or more segments. This column will list the
segment of the data file containing the corresponding field (row) of data. All files have a
segment maximum of 169. Note: segments exceeding approximately 5 min may be divided
into pseudo segments which count toward the segment maximum.
3.
Time PC time of day (hours:minutes:seconds) at which the field was recorded .
4.
Total Seconds Same as Time, but displayed as the number of seconds since midnight.
5.
H-POS Horizontal Eye Position
6.
V-POS Vertical Eye Position
7.
Pupil Diam Horizontal pupil diameter measure in pixels. This measure can be scaled to
mm.
8.
X-DAT External Data, this column will show the value that was on the eye tracker
parallel, external data (XDAT) port during the data field.
9.
Mark This column will show any manual event marks entered into the data file by the
operator from the e5win program. These marks can be 0-9.
If using a model 504 Pan/Tilt with Magnetic Head Tracker option an additional six columns of MHT
data will also be displayed.
10.
MHT X Sensor location in the transmitter X-axis
11.
MHT-Y Sensor location in the transmitter Y-axis
12.
MHT-Z Sensor location in the transmitter Z-axis
13.
AZIMUTH Sensor orientation
14.
ELEVATION Sensor orientation
9
EYENAL MANUAL
15.
ROLL Sensor orientation
2.1.2 EYEHEAD Data Files
An EYEHEAD data file, recorded with head mounted optics and ASL’s EYEHEAD™ Integration
feature, has an .ehd extension. A Standard EYEHEAD data file will contain 11 columns of data..
EYEHEAD data includes the computed intersection for line of gaze on one to twenty individual surfaces
(scenes), subject eye to scene distance and pupil diameter. The intersection is defined in specified units
(inches or cm). All files have a segment maximum of 169. Note: segments exceeding approximately 5 min
may be divided into pseudo segments which count toward the segment maximum. See figure 2.
NOTE: there are other data items that can be output for EYEHEAD™ Integration the below
description relates only to a standard EYEHEAD™ data file. Non-standard data files can contain raw eye
position in the head and 6 columns of head position in addition to the standard data items. Consult
Technical Support for additional information
1.
Field No. A field refers to the data items recorded for a single sampling interval. A
sampling interval is a 50th, 60th, 120th, or 240th of a second, depending on the model eye
tracker system used. A field contains eight pieces of data represented by rows.
2. Segment No. A segment is a continuous section of recorded data. Every time data
recording is paused, and restarted without closing the data file, a new data “segment” is
created on that file; so a data file may have one or more segments. This column will list the
segment of the data file containing the corresponding field (row) of data
3. Time PC time of day (hours:minutes:seconds) at which the field was recorded
4. Total Seconds Same as Time, but displayed as the number of seconds since midnight.
5. Magnitude Eye to point-of-gaze distance.
6. Scene Indicates which scene plane the subject was looking at during that field.
7. H-POS Horizontal Eye Position (point of gaze) on the indicated scene plane.
8. V-POS Vertical Eye Position (point of gaze) on the indicated scene plane.
9. Pupil Diam Horizontal pupil diameter measure in pixels. This measure can be scaled to
mm.
10. X-DAT External Data, this column will show the value that was on the eye tracker parallel,
external data (XDAT) port during the data field.
11. Mark This column will show any manual event marks entered into the data file by the
operator from the e5win program. These marks can be 0-9.
10
EYENAL MANUAL
Figure 2. Eyehead data file
11
EYENAL MANUAL
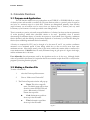
3. Calculate Fixations
3.1 Purpose and Application
The FIX function reduces raw eye position data on an EYEDAT or EYEHEEAD file to a series
of fixation points and recorded on another file. The term fixation refers to a person's point-of-regard as
one looks at a stationary target in a visual field. Fixations are distinguished, primarily, from saccades
(rapid voluntary eye movements used to move from one fixation point to another) and very small
involuntary eye movements of several types which occur during fixation.
There is currently no precise, universally accepted definition of a fixation, but there are known parameters
of ocular physiology which allow reasonable criteria to be used. Specifically, there is research
documenting the minimum latency of saccades in response to visual stimuli (thus suggesting a minimum
fixation duration) and data defining the maximum amplitude of involuntary eye movements during the
fixation (thus establishing maximum fixation boundaries).
A fixation as computed by FIX, may be thought of as the mean X and Y eye position coordinates
measured over a minimum period of time during which the eye does not move more than some
maximum amount. More simply stated, point-of-gaze must continuously remain within a small area for
some minimum time. If default values are used, maximum change in gaze point is 1 degree visual angle,
and the minimum time is 100 msec.
User Adjustable: Several parameters used by the algorithm can be set by the user. Although default
values are specified in this manual, it is important that the user examine output from FIX to verify that the
program is processing fixations properly.
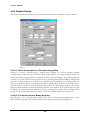
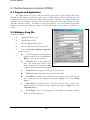
3.2 Making a Fixation File
To make a Fixation file:
1.
select the Fixation pull down menu.
2.
Choose “Make a new Fixation file”
3. The Fixation Properties window will pop up:
a.
Name: This is the output file
name. The default name will be taken
from the current EYEDAT file and
given a .fix extension. If desired
rename the output file.
b.
Code: Information typed here
shows up in the file header.
c.
Title: Information typed here
shows up in the file header.
Figure 3
12
EYENAL MANUAL
4.
Click “Start-Stop” tab and set Start and Stop properties.
5.
Click the “Criteria” tab and set properties.
6.
Click “OK”
3.2.1 Start-Stop Criteria
The Start-Stop Criteria menu allows the user to specify a particular duration of the of the raw data for
analysis.
•
Start Point: A Fseq file can be made with only a portion
of the fixation source file. A start point can be designated
by segment <Segm:>or by time <Delay (secs)>.
•
Stop Point: It is possible to have a Fseq file made with
only a portion of the fixation source file. A stop point can
be designated by segment <Segm:>or by time
<Duration (secs)>.
•
Flags
a. Use start flag: Mark or X-DAT values may be used as
flags to trigger the beginning of fixation calculations.
Check this box to use a start flag then specify the
appropriate flag in one of the two boxes to the right..
NOTE: For more information on Marks and X-DAT
refer to the ASL Model 501/504 user manual.
b. Use stop flag: Mark or X-DAT values may be used as
flags to trigger the end of fixation calculations. Check
this box to use a stop flag then specify the appropriate
flag in one of the two boxes to the right. NOTE: For
more information on Marks and X-DAT refer to the
ASL Model 501/504 user manual.
Figure 4
c. Allow multiple starts: If this box is checked Eyenal will begin analyzing the raw data a the first
occurrence of a specified start flag and stop at the specified point then continue to look for
subsequent occurrences of the specified start flag and create multiple segments on the resulting
Fixation file.
NOTE: start and stop flags may be combined with Start and Stop Points.
13
EYENAL MANUAL
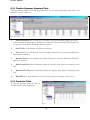
3.2.2 Fixation Criteria
The Fixation Criteria menu allows the user to set parameters used by the algorithm to detect a fixation.
Figure 5
3.2.2.1 Brief Description of Fixation Algorithm
Criterion 1 is used to determine when a fixation starts; Criterion 2 is used to determine whether
subsequent data samples are part of the same fixation; and Criterion 3 is used to determine which data
samples should be averaged together to determine the final fixation coordinates. The quick description is
as follows. To "start a fixation" the program looks for a specified period (MIN SAMPLE) during which
gaze has a standard deviation of no more than a specified amount (Criterion-1). To end the fixation, it
looks for a specified number of sequential gaze position samples (MAX COUNT) to be farther than a
specified distance (Criterion-2) from the initial fixation position. The final fixation position is the average
position of all data samples between the beginning and end of the fixation. The exception is that any gaze
coordinates that were farther than criterion-3 from the initial fixation position are not included in the
average. For more information please see section 3.2.2.3 and a detailed explanation in section 3.2.5.
3.2.2.2 Fixation Criteria Menu Options
The following is a list of the adjustable settings of the Fixation Criteria Menu including those for the
fixation detection algorithm. The criteria are listed as they appear in the Criteria menu(figure 4).
14
EYENAL MANUAL
¾
Min Sample To "start a fixation" the program looks for a specified period (MIN SAMPLE)
during which gaze has a standard deviation of no more than a specified amount (Criterion-1).
¾
Max Count To end the fixation, it looks for a specified number of sequential gaze position
samples (MAX COUNT) to be farther than a specified distance (Criterion-2) from the initial
fixation position.
¾
Max Blink If the number of consecutive lost data fields (pupil diameter =0) in an
EYEDAT data sample is less than the defined Max Blink number of fields than the losses are
considered a blink .A number of consecutive lost fields greater than the maximum are considered
losses. If a loss occurs during a fixation and is less than the value you set as "Max Blink", then the
loss does not cause the fixation to end. If the loss is longer than "Max Blink" the fixation is
considered to have ended with the last field before the loss.
¾
Vertical 1 2 3 and Eyetracker Units/degree This row contains the values (in degrees)
for criteria 1-3 pertaining to the vertical axis. The box in the last column is for the number of
Eye tracker units that equal 1 degree visual angle in the vertical axis. See section 3.2.1.3 for
further description.
¾
Horizontal 1 2 3 and Eyetracker Units/degree This row contains the values (in
degrees) for criteria 1-3 pertaining to the horizontal axis. The box in the last column is for
the number of Eye tracker units that equal 1 degree visual angle in the horizontal axis. See
section 3.2.1.3 for further description.
¾
Zero Time Origin If this box is checked, the time value at the start of the segment
processed will be set to 00:00:00.000. This option only effects the output file.
¾
Pupil scale factor Pupil diameter may be scaled to meaningful units such as millimeters. To
compute a scale factor for pupil diameter values displayed by or recorded on the Interface
program :
1. First place the Model Eye at the same eye to camera distance present
during experimental conditions.
2. Second obtain proper discrimination on the model pupil.
3. Third note the pupil diameter value on the interface screen digital display
window ("Pupil Diameter: nnn").
To compute a scale factor, divide the recorded value by 3.96 (the diameter of the Model Eye pupil).
Convert displayed or recorded pupil diameter values to millimeters by applying this scale factor (value
in millimeters = scale factor * recorded value). See the 501.504 Manual section “Using the Model
Eye” for more information.
¾ Compute max fixation duration Checking this box will result in Eyenal computing the longest
possible fixation duration. The below explanation describes the default (or mid range possibility)
versus Max duration computation
Fixation time and lose time are computed by taking the number of data samples that are part of a
fixation (or loss) and multiplying by the update interval. For example, assuming a 50 Hz system, if 10
data samples are found to be part of a fixation the fixation duration is given as 10*20 ms = 200 ms.
15
EYENAL MANUAL
Note that actually this is the maximum possible fixation duration since it assumes that the fixation
stated at the beginning of the first sample and ended at the end of the last of these samples. The
uncertainty associated with taking discrete samples means that this fixation could actually be as short
as 160 ms (starts near the end of the first sample and ends near the beginning of the last sample) or as
long as 200. This version of Eyenal (ver1.28) chooses the mid range possibility and reports 180 ms in
this example. Currently Eyenal will use the format of the mid range possibility when computing
fixation duration and includes an optional check box to compute the longest possibility as was the
case with all previous versions of Eyenal (both DOS and Windows).
¾ Detect CR Loss Head mounted eyetrackers(E.g., model 501) can measure line of gaze, although
with reduced accuracy, even when only the pupil is recognized. Remote(non head mounted) systems,
which permit motion of the head with respect to the eye camera(E.g., model 504), cannot make a
reasonable gaze measurement unless both the CR and pupil are recognized.
When a remote system recognizes the pupil but not the CR, it continues to report a valid pupil
diameter, but sets eye position values to default values. These default coordinates are zero(0) for series
5000 systems and twenty(20) for series 4000 systems. If “Detect CR Loss” is enabled, eye position
coordinates of these default values will be interpreted as “not valid data”(even though pupil diameter
is not zero) and the data will not be incorrectly interpreted as fixations at these positions.
If analyzing data from a remote eye tracker it usually makes sense to enable “Detect CR Loss” by
checking this box.
If analyzing data from a system with head mounted optics, it is usually best to disable this feature by
leaving this box unchecked.
¾ Scene Boundary Limits
N/A with EYEHEAD data files (.ehd)
If this feature is enabled and if the eye point of gaze position is outside of the defined scene
boundary limits, this is treated as “not valid data”. This provides a means of filtering out “ridiculous”
data values that may occur for example, if some extraneous reflection is recognized as the pupil or
CR.
It makes most sense to use this feature when analyzing data from a remote eye tracker which we
know can make valid measurements only when the subject looks within about 25 degrees visual angle
of the optics module. If for example, the subject was looking at a computer monitor scene, data
values that would indicate gaze points many feet from the scene are unlikely to be valid data and can
be filtered out. Set boundary limits that define a region within which it is reasonable to expect valid
gaze data
Check the box to enable the scene boundary limit feature, then type in the top, bottom, left and right
coordinates of the scene boundaries. The ASL system divides any scene plane into a grid space of 260 by
240; thus all gaze coordinates reported beyond 0,0 and 260,240 are theoretically outside the plane of
interest. Default values are top:-10, left -10, right 270, and bottom 270 because it is possible for the system to
make valid gaze measurements just beyond the boundary limits and taking into account the systems
accuracy.
16
EYENAL MANUAL
3.2.2.3 Fixation Algorithm Criteria Description
Criteria 1, 2 and 3 are defined in terms of visual angle(eyeball rotation angle). These criteria are user
adjustable.
For small visual angles in the center of the scene, d = s * tan x
•
•
•
where d is the distance on the scene,
s is the subject's eye to scene distance,
x is the visual angle.
Thus if the subject is seated 57.3 inches from the scene a square covering 1 degree visual angle would
measure 1 inch by 1 inch.
Figure 6
¾ Eye Tracker Units/degree
N/A for EYEHEAD data files1
Eyedat files,(e.g., data gathered with the model 504 pan tilt optics) do not contain the information
about subject to scene distance or scene camera position and magnification that is required to express
the point of gaze data in terms of visual angles(degrees of eye ball rotation). The program must be
1 *EYEHEAD Integration data (data gathered with head mounted optics, a magnetic head tracker, and ASL’s EYEHEAD™
Integration software) contains enough information for the program to compute visual angles.
17
EYENAL MANUAL
told how many “eye tracker data units” correspond to a degree of visual angle. This ratio(eye
tracker units per degree visual angle) must be determined for both the horizontal and vertical axis and
is entered under a label named “ Eye tracker Units/degree”. The following subsection explains how
this parameter can be determined.
3.2.3 Visual Angle Computation
The following is a suggested procedure for determining eye tracker units per degree of visual angle.
Please note that this computation is not necessary for EYEHEAD data. In addition there is a Visual
Angle Calculator application that can perform this operation. The Visual Angle calculator application is
available for download on ftp://a-s-l.com/pub/Visual Angle Calculator
1. Measure the distance in inches(or centimeters) from the subject eye to the center of the scene plane.
Call this “s”.
1. Measure the distance in inches(or centimeters) horizontally between two known scene points, such as
the points 5 and 6 on the calibration chart. Call this “dh”.
1.
Measure the distance in inches(or centimeters) vertically between two known scene points, such
as the points 5 and 2 on the calibration chart. Call this “dv”.
2.
Use the Set Target mode of the Eyetracker Software while observing the scene monitor. Now
measure the distance in Eyetracker units horizontally between the two known scene points(points 5
and 6 on the calibration chart). Call this “ETh”.
3.
Next measure the distance in Eyetracker units vertically between the two known scene
points(points 5 and 2 on the calibration chart). Call this “ETv”.
4.
Find the angle whose tangent is dh/s and call this “θh”.
5.
Find the angle whose tangent is dv/s and call this “θv”.
6.
Divide ETh by θh
7.
This is the value of eye tracker units per degree visual angle along the horizontal axis.
8.
Divide ETv by θv. This is the value of eye tracker units per degree visual angle along the vertical
axis.
3.2.4 Sample Calculations of Eye Tracker Units per Degree Visual Angle
The following are sample calculations to determine eye tracker units per degree of visual angle.
Sample Measurements
18
EYENAL MANUAL
s = Eye to center of scene distance = 28 inches
dh = Horizontal distance from calibration point 5 to point 6 = 8 inches
Eth = number of horizontal eyetracker units between points 5 and 6 = 120 Eyetracker
units.
dv = Vertical distance from calibration point 2 to point 5 = 7 inches
Etv = number of vertical Eyetracker units between points 2 and 5 = 105
eyetracker units
point 2
dv
Eye
θv
point
5
s
Sample Calculations:
θh = tan-1(dh/s) = 15.9 deg
Horizontal eyetracker units per degree = 120/15.9 = 7.5
θv = tan-1(dv/s) = 14 deg
Vertical eyetracker units per degree = 105/14 = 7.5
3.2.5 Detailed Fixation Determination Algorithm
A three boundary approach is used to define fixations. The recommended values for the three
boundaries (called criterion 1, 2, and 3) are 0.5 degrees, 1.0 degree, and 1.5 degrees respectively. These
values may be reset as described in Section 3.2.2.
The program uses a moving window technique to find the fixation start point. The first “min sample”
data samples are examined. “Min sample” is adjustable as described in Section 8.4.1, but it is usually set
to the number of fields that will correspond to about 100 msec. If the standard deviations of the X
(horizontal) and Y (vertical) eye position coordinates is less than “criterion 1”, the means of this sample
are used as temporary fixation coordinates (XT, YT). If the standard deviation was greater than criterion
1, then the min-sample window is moved up one field and the calculations repeated until a min-sample
window which passes criterion 1 is found.
Once a fixation start point is determined, the program calculates the horizontal and vertical distance (DX,
DY) of the next data sample from the temporary means (XT, YT). If (DX, DY) is less than criterion 2,
the sample is included in the fixation. If it does not pass criterion 2, then the next sample is tested against
criterion 2.
This process is continued until a measurement sample passes criterion 2 or until “max count” sequential
samples (default value of three can be changed by the user) have been tested. If one of these
19
EYENAL MANUAL
measurements does fall within criterion 2, previous samples that did not are tested against criterion 3. All
of the samples that pass criterion 2 or 3 are then considered to be "included in the fixation." This means
that they will be used in the final calculation of fixation position.
If DX and/or DY from “max-count” sequential samples exceed criterion 2 then the X and Y means of
these samples are calculated. If the means do not differ from XT and YT by more than criterion 2, they
are all included in the fixation; otherwise the fixation is closed at the last acceptable data sample.
Blinks, defined as pupil losses of “max blink”samples or less, are ignored and do not terminate a fixation.
Note that a number of samples equal to about 200 msec is the recommended value for maximum blink
duration. This value may be reset as described in Section 3.2.2. Pupil loss for periods longer than “maxblink” do cause a fixation to close at the last acceptable data sample.
20
EYENAL MANUAL
4. Define Areas of Interest (AOIs)
4.1 Purpose and Application
The Area of Interest(AOI) function defines up to 50 Areas of Interest on the visual scene viewed by an
Eyetracker subject. Areas of Interest are defined as rectangles and may be assigned labels of up to ten
characters. Once and AOI file exits EYENAL can calculate statistics on time subjects spent viewing
various scene elements and the sequence in which they were viewed. The AOI function allows the user to
create, edit, draw, print, and save Area of Interest (AOI) coordinates on files for future use by EYENAL
FSEQ, and DWELL functions or possibly other data analysis programs.
For non-EYEHEAD systems, the coordinates of each AOI top, bottom, left, and right boundaries can
be determined by using the Eyetracker Set Target function (see Eyetracker Manual) . Area of Interest
coordinates should be specified to the AOI function in Eyetracker coordinates. Scene plane 0 is the
Eyetracker calibration plane and is the only plane defined for non-EYEHEAD systems.
EYEHEAD™ Integration AOI files can be defined for up to twenty scene planes. The coordinates
for top, bottom, left, and right boundaries of each area in each scene plane are defined in inches or
centimeters with respect to the coordinate frame defined on each EYEHEAD scene plane(See
EYEHEAD manual for explanation of EYEHEAD scene planes).
Fixplot: AOI files can also be made using the Fixplot program. Fixplot allows the user to draw Areas of
interest over any bitmap image rather than define them with coordinates. AOI files made using Fixplot
can be used in EYENAL. (See the Fixplot manual for further information)
4.2 Creating an AOI file
To create an AOI file:
1. Open the AOI pull down Menu
2. Select “Make new AOI file”
3. Once the Area of Interest Properties menu pops
up, fill in the appropriate information and
coordinates. Proceed as follows
A.
File Name: enter a name for the new AOI
file to be created. NOTE if a data file is currently
open the program will display a default file name.
The default file name will be the data file title with
an .aoi extension.
B.
If using EYEHEAD™ Integration data
21
figure 7
EYENAL MANUAL
check the box in the bottom right of the menu.
4.
C.
Title: enter the title for the first area you wish to create. This name will be given to the area
designated in the AOI N (area of interest number) box..
D.
Scene Plane: If using EYEHEAD™ Integration data only. If using EYEHEAD data
specify the scene (0-19) that contains the current Area.
E.
Top: enter Top coordinate
F.
Left: enter Left coordinate
G.
Right: enter Right coordinate
H.
Bottom: enter Bottom coordinate
Select the “New” button to store the current Area and create another one on the same file.
Repeat steps C-H..
OR
Select “OK” to save and create an AOI file based on the information entered into the AOI properties
menu.
Example AOI file:
EYEHEAD™
nonEYEHEAD
figure 8
22
EYENAL MANUAL
4.3 Editing an AOI file
To edit an AOI file:
1. Select the AOI pull down Menu
2. Choose “Open” and open desired AOI file
3. Once the desired file is open select “Edit” from the AOI pull down menu. This will bring up the
Area of Interest Properties menu allowing you to edit any of the coordinates , titles or plane
designations plus add a new area or delete an old one. Use the arrows to the right of the AOI N
(area of interest number) box to select an area contained in the file.
4. When finished click “OK” to save the changes. It may be necessary to refresh the screen to view
the changes outside the Area of Interest Properties window.
23
EYENAL MANUAL
5. Fixation Sequence Analysis (FSEQ)
5.1 Purpose and Application
The FSEQ function is used to study the amount of time subjects spent viewing various scene
elements and the sequence in which they were viewed. FSEQ matches fixation point data from files
created by FIX(section 3.0) with Areas of Interest files created by AOI(section 4.0). FSQ determines the
sequence of the areas fixated, a summary of the total time and percent of time spent fixating each area,
and other summary statistics. In addition, the program calculates joint and conditional probability
distribution between areas of interest. Output is to the monitor screen, a printer and/or an ASCII file as
desired.
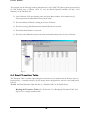
5.2 Making a Fseq File
To make an Fseq file:
1.
Open desired Fixation file
2.
Open desired AOI file
3.
Select the Fseq pull down menu
4.
Choose “Make new fixation sequence file”
5.
Once the Fixation Sequence Properties
menu pops up:
d.
The Fseq Properties window should
display the names of the desired Fix and
AOI files. These are the input files.
e.
FSQ file: This is the output file
name. The default name will be taken
from the current Fix file and given a .fsq
extension. If desired rename the output file.
figure 9
f.
Code: Information typed here shows up in the file header
g.
Title: Information typed here shows up in the file header
h.
Start Point: A Fseq file can be made with only a portion of the fixation source
file. A start point can be designated by segment <Segm:>or by time <Delay
(secs)>.
i.
Stop Point: It is possible to have a Fseq file made with only a portion of the
fixation source file. A stop point can be designated by segment <Segm:>or by time
<Duration (secs)>.
j.
Total Segm: This box will display the total number of segments contained
within the current Fixation file.
24
EYENAL MANUAL
k.
Zero Time Origin: If this box is checked, the time value at the start of the
segment processed will be set to 00:00:00.000. This option only effects the output
file.
5.3 Viewing a Fixation Sequence File
Once “OK” is selected from the Fixation Sequence Properties menu the Fixation Sequence List will be
displayed in the EYENAL program window:
5.3.1 Fixation Sequence List
Each line of the Fixation Sequence list includes the following information (see figure 8):
¾
¾
Fixation number
Scene Plane, Name and number of the area of interest in which the fixation falls.
If the fixation is on an area not specified as an area of interest, it is designated as
"OFF." If overlapping Areas of Interest are defined and a fixation falls within the overlapping areas,
the Fixation number will be repeated on subsequent lines and all such areas will be listed.
¾
Fixation start time in hours, minutes, and seconds (HH:MM:SS.SSS)
¾
Fixation Duration in seconds
¾
Interfixation length(between end of previous fixation and beginning of current fixation) in
seconds
¾
Interfixation distance(between current and previous fixation) in degrees visual angle
¾
Scaled pupil diameter
¾
Eye to Scene Plane distance in inches or centimeters. This item is valid only for EYEHEAD data.
NOTE: that scene plane number, and eye to scene plane distance apply only to EYEHEAD data.
Figure 10
25
EYENAL MANUAL
5.3.2 Fixation Sequence Segment Summary
The program lists the following summary information for each segment of data processed.
¾
Segment start time, stop time, and
length of the data segment.
¾
Total number of fixations
processed, and the mean fixation
duration in seconds.
¾
Fixation Frequency (average
number of fixations per second)
during the data segment.
¾
Total loss time during the data
segment. Loss time refers to time
during which the pupil was not
recognized by the Eyetracker. This
includes some blink time.
¾
Mean interfixation distance. This
distance is the average length between
fixations in degrees of visual angle
Figure 11
and was calculated using the
Eyetracker Units/deg value as
specified in the fixation program, or computed by the program from information in EYEHEAD
files.
Navigation:
Left click on the + sign to extend the Fseq file tree.
Left click on any of the subsequent files to view contents.
26
EYENAL MANUAL
5.3.3 Fixation Sequence Summary Table
The Fseq Summary Table lists the following information. To view the Fseq Summary table, click “AOI
Summary” on the Fseq file tree.
Figure 12
¾
¾
Sum Fix Duration: time for each AOI. This refers to the total time spent fixating a given area
of interest during the data segment. Dwell time for each area of interest is listed both in seconds and
as a percent of total fixation time during the data segment.
Sum Fix Cnt: Total Number of fixations on each area.
¾
Fix Cnt%: Percent of fixations in each area (number of fixations on a given area divided by the
total number of fixations).
¾
Mean Fix Dur: The mean duration in seconds, of fixations on each area (Dwell time divided by
number of fixations).
¾
Mean Interfix Dur: Mean interfixation length (in seconds) while subject was fixating in each
AOI.
¾
Mean Inter Fix Dist: Mean interfixation distance (in degrees) while subject was fixating in each
AOI.
¾
Mean PD: Mean pupil diameter for each AOI while subject was fixating on each AOI.
5.3.4 Transition Table
To view the Transition table. left click on
“Transition table” in the Fseq file tree.
figure 13
27
EYENAL MANUAL
Description: The Transition Table is a matrix representing the actual amount of transitional activity
between Areas of Interest(AOI’s). A transition from i to j is the change from a fixation in Area i to a new
fixation in Area j.
Reading the Transition Table: Referring to the sample table above (figure 12), the left most column of
numbers and the topmost row of numbers represent each AOI number. In this example there are four
areas. There were 0 transitions between Area 0 (off the scene) to Areas 1, 2, and 4. There were 8
transitions between Area 0 and Area 3. There were 7 transitions from Area 0 to within area 0. There was 1
transition from Area 1 to Area 3. The highest transitional activity was with in Area 3.
5.3.5 Conditional Probability
To view the Conditional probability table, left click “Conditional probability” in the Fseq file tree.
Figure 14
Definition: Conditional probability is the likelihood that given a fixation on one specific area, the next
fixation will be on another specific area.
Pc(i/j) =
No. of fixation transitions from Ai to Aj
--------------------------------------------------------No. of fixations on Ai
Reading the Conditional Probability Table: This table reads the same way as the transition table
except that it is a matrix representing the conditional probability of transitional activity between Areas of
Interest(AOI’s).
NOTE: Be careful about interpreting conditional probability results. If, for example, there are
five areas of interest and out of 200 fixations a given subject looked at area 2 only once followed
by a fixation on area 3, then the conditional probability(2,3) = 1.0 (or 100%). Obviously this does
not mean that there was a lot of visual "traffic" between areas 2 and 3, but rather that whenever
28
EYENAL MANUAL
there was a fixation on area 2 the next fixation was on area 3. In the example cited, the result is
insignificant because of the small number of fixations on area 2.
5.3.6 Joint Probability Table
To view the Joint probability table, left click “Joint probability” in the Fseq file tree.
Figure 15
Definition: Joint probability is the relative likelihood (or relative frequency) of a transition between two
particular areas as compared to transitions between other pairs of areas.
Pj(i,j) =
No. of fixation transitions from Ai to Aj
---------------------------------------------------Total number of transition pairs
Reading the Joint Probability Table: This table reads the same way as the transition table except that it
is a matrix representing the joint probability of transitional activity between Areas of Interest(AOI’s).
29
EYENAL MANUAL
6. Dwell Statistics
6.1 Purpose and Application
The DWELL function computes various statistics from the FSEQ(section 5.0) function.
Definition: A "dwell" is defined as the time period during which a fixation or series of contiguous
fixations remain within an Area of Interest(AOI) as defined by the AOI(section 4.0) function.
The dwell data output is comprised of a sequential list of "dwells", a summary of dwell activity in each
AOI, a Transitional Matrix, a Conditional Probability Matrix, a Joint Probability Matrix, and Histogram
data that can be plotted in Excel.
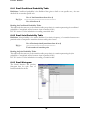
6.2 Creating a Dwell File
To create a dwell file:
1.
Select the Dwell pull down menu.
2.
Choose Make new Dwell file.
3.
Once the Dwell Properties menu pops up, review
the listed properties:
¾
Fsq File: Browse to the desired Fseq file. If
an Fseq file is currently open this will be the
default file. This is the input file.
NOTE: to open a Windows browser left click the
icon on the right. of the text
box
¾
Dwell Title: Any
information typed here will show in the file header.
¾
Dwell File: select a name for the output file
or keep the default name. The default name will be
the same as the selected Fseq file.
¾
4.
Figure 16
Segments: If desired select a start and stop point based on the input file segments.
Click “OK”
6.3 Dwell Sequence List
Once “OK” is selected the program lists the following information for each "dwell" sequence:
30
EYENAL MANUAL
1.
2.
3.
4.
Dwell No: Dwell number
AOI No./Name: Area of Interest (AOI) number, label, and scene plane number (scene
plane numbers only apply for EYE-HEAD data files) that contained the dwell.
Start Time: Dwell start time listed in hours, minutes, and seconds (HH:MM:SS.SSS).
Dwl Dur: Dwell duration in seconds. This is the sum of all the Fixation duration’s that make
up the dwell.
5.
Stop time: Dwell stop time listed in hours, minutes, and seconds (HH:MM:SS.SSS).
6.
InterFix Dur: Inter-fixation length in seconds for each dwell shift between two AOI's.
7.
No of flags:
Figure 17
Navigation:
Left click on the + sign to extend the Dwell file tree.
Left click on any of the subsequent files to view contents
6.3.1 Dwell Sequence Summary
31
EYENAL MANUAL
The program lists the following summary information for each "dwell" FSQ data segment processed and
for each defined Area of Interest (AOI). To view the Dwell Sequence Summary left click “AOI
Summary” in the Dwell file tree.
¾ Area of Interest (AOI) area number, name, and scene plane number. Area number zero (0)
always represents an undefined dwell area off the scene.
¾ The total number of Dwells occurring in the Area of Interest.
¾ The mean (average) Dwell duration and standard deviation in seconds.
¾ The median dwell duration in seconds.
¾ The skew value (difference between the mean and median duration) for the Area of Interest.
Figure 18
6.4 Dwell Transition Table
The Transition Table is a matrix representing the actual amount of transitional activity between Areas of
Interest(AOI’s). A transition from i to j is the change from a dwell period in Area i to a new dwell period
in Area j.
To view the Dwell Transition Table left click on “Transition table” in the Dwell file tree.
Reading the Transition Table: GO TO Section 5.3.4 “Reading the Transition Table” and
Figure 11 for a sample transition table.
.
32
EYENAL MANUAL
6.4.1 Dwell Conditional Probability Table
Definition: Conditional probability is the likelihood that given a dwell on one specific area, the next
dwell will be on another specific area.
Pc(i/j) =
No. of dwell transitions from Ai to Aj
--------------------------------------------------------No. of dwells on Ai
Reading the Conditional Probability Table:
This table reads the same way as the transition table except that it is a matrix representing the conditional
probability of transitional activity between Areas of Interest(AOI’s).
GO TO: section 5.3.4 for information on reading a transition table.
6.4.2 Dwell Joint Probability Table
Definition: Joint probability is the relative likelihood (or relative frequency) of a transition between two
particular areas as compared to transitions between other pairs of areas.
Pj(i,j) =
No. of fixation(or dwell) transitions from Ai to Aj
---------------------------------------------------Total number of transition pairs
Reading the Joint Probability Table:
This table reads the same way as the transition table except that it is a matrix representing the joint
probability of transitional activity between Areas of Interest(AOI’s).
GO TO: section 5.3.4 for information on reading a Transition table.
6.4.3 Dwell Histogram
The Dwell function will produce
histogram data for each Area of
Interest included in the file.
Figure 19
33
EYENAL MANUAL
7. Pupil Statistics
7.1 Purpose and Application
The Pupil Function will compute various statistics based on pupil diameter for specified amounts of time
on a data file. The pupil data output is comprised of a sequential list of pupil diameters for each data field,
pupil average, pupil median, pupil variance, standard deviation and blink frequency.
7.2 Making a Pupil (pdf) file.
1. Select “Make new pupil diameter analysis
file” from the Pupil pull down menu.
2. Once the “… Properties” window pops
up, review the listed properties:
a. Eyedat File: this is the source file.
b. PDA File: this will be the output file
name. If desired change the output
file name or keep the default name.
c. Label: Information typed here
shows up in the file header
d. Code: Information typed here
shows up in the file header
e. Segments: A PDA file can be made
figure 20
with only a portion of the source file
(if the source file has +1 segments). A start and stop point can also be designated by
Eyedat file segment.
f.
Start Delay: It is also possible to delay the analysis start point in seconds. When using a
start delay one can also specify a Duration of the file (seconds) to be analyzed.
e.g. If a file was 10 minutes long; a start delay of 60 seconds and a duration of 60
seconds would yield information from minute 2 of that file.
g.
Use start flag Mark or X-DAT values may be used as flags to trigger the beginning of
fixation calculations. Check this box to use a start flag then specify the appropriate flag in
one of the two boxes to the right.. NOTE: For more information on Marks and X-DAT
refer to the ASL Model 501/504 user manual.
h. Use stop flag Mark or X-DAT values may be used as flags to trigger the end of fixation
calculations. Check this box to use a stop flag then specify the appropriate flag in one of the two
34
EYENAL MANUAL
boxes to the right. NOTE: For more information on Marks and X-DAT refer to the ASL Model
501/504 user manual.
i.
Zero Time Origin: If this box is checked, the time value at the start of the segment processed
will be set to 00:00:00.000. This option only effects the output file.
j.
Pupil Scale factor: Pupil scale factor Pupil diameter may be scaled to meaningful units such as
millimeters. To compute a scale factor for pupil diameter values displayed by or recorded on the
Interface program :
4. First place the Model Eye at the same eye to camera distance present
during experimental conditions.
5. Second obtain proper discrimination on the model pupil.
6. Third note the pupil diameter value on the interface screen digital
display window ("Pupil Diameter: nnn").
To compute a scale factor, divide the recorded value by 3.96 (the diameter of the Model Eye
pupil). Convert displayed or recorded pupil diameter values to millimeters by applying this scale
factor (value in millimeters = scale factor * recorded value). See the 501.504 Manual section
“Using the Model Eye” for more information.
k. Blink Fields: If the number of consecutive lost data fields (pupil diameter =0) in an EYEDAT
data sample is between the defined Blink Minimum and Blink Maximum number of fields than
the losses are considered a blink. A number of consecutive lost fields less than the minimum or
greater than the maximum are considered losses.
The Blink frequency result for a EYEDAT data sample selection is calculated as:
number of blinks in data sample
blink frequency = ---------------------------------------------------------sample duration in seconds
3.
Click OK
7.3 Pupil Diameter Sequence List
Once a pda file is made the program will display a list of each data field selected and the
corresponding pupil diameter. (see figure 20)
7.3.1 Pupil Data Summary List
The Pupil Diameter Summary lists the following statistics based on the specified parameters. The
data summary includes the number of samples, mean, median, and standard deviation of pupil
diameter values for the selected data sample. The Blink Frequency calculation is also included in
the data summary.
35
EYENAL MANUAL
Note: Pupil diameter values of zero (loss) are not included in calculations of the statistical values
listed above.
Figure 21
36
EYENAL MANUAL
8. Batch Function
8.1 Purpose and Application
The Batch function allows the user to create Fixation, Fixation sequence, and Dwell files for any
number of selected EHD or EYD files in a given directory.
8.2 Using the Batch Function
1. Select the Batch pull down menu.
2. Select the desired output file format(Fixation, Fix sequence, or Dwell) for Batch.
3. If the desired output file format was: Fixation file GO TO section 8.2.1
Fix Sequence file GO TO section 8.2.2
Dwell file GO TO section 8.2.3
8.2.1 Batch Fixation Files
1. Once the Batch Properties menu pops up :
2. Select the desired Source directory
3. Select the desired Output directory
4. All .eyd and .ehd files located in the source directory
will be listed below.
5. Select desired source files:
To include a file for Batch, leave a red check mark
next to the file name
To exclude A File from Batch, double click on the
“red check mark” to remove it.
6. To add or change the following items for individual
output files :
A) Double click on the desired output file name
B) Change or adjust desired field in the resulting
Properties pop up window and click APPLY. For
further explanation of the listed items GO TO section 3.2
Figure 22
Output File Name
Title
Code
Start Point (by Segment or delay in secs)
Stop Point (by segment or duration in secs)
7. To set Fixation Criteria for the selected files left click the tab labeled Batch Fixation Options at
the top of the Batch properties pop up menu.
For more in formation on Fixation Criteria GO TO section 3.2.1
37
EYENAL MANUAL
8. Click OK
NOTE: the Batch function will now create fixation files for each selected source file based on
the specified parameters and criteria. These files will be located in the specified source directory.
8.2.2 Batch Fixation Sequence Files
1. Select “Batch Fix Sequence” from the Batch pull down menu
2. Select the desired AOI file from the Windows browser
3. Once the Batch Properties menu pops up
4. Select the desired Source directory
5. Select the desired Output directory
6. All .eyd and .ehd files located in the source directory will be listed below.
7. Select desired source files:
To include a file for Batch, leave a red check mark next to the file name
To exclude A File from Batch, double click on the “red check mark” to remove it.
8. To add or change the below listed items for individual output files :
A) Double click on the desired output file name
B) Change or adjust desired field in the resulting Properties pop up window and click
APPLY. For further explanation of the listed items GO TO section 5.2
Output File Name
Title
Code
Start Point (by Segment or delay in secs)
Stop Point (by segment or duration in secs)
9. Click OK
NOTE: the Batch function will now create Fixation Sequence files for each selected source file
based on the specified parameters. These files will be located in the specified source directory.
8.2.3 Batch Dwell Files
1. Select “Batch Dwell” from the Batch pull down menu.
2. Once the Batch Properties menu pops up
3. Select the desired Source directory
4. Select the desired Output directory
5. All .fsq files located in the source directory will be listed below.
6. Select desired source files:
To include a file for Batch, leave a red check mark next to the file name
To exclude A File from Batch, double click on the “red check mark” to remove it.
38
EYENAL MANUAL
7. To add or change the below listed items for individual output files :
A) Double click on the desired output file name
B) Change or adjust desired field in the resulting Properties pop up window and click
APPLY. For further explanation of the listed items GO TO section 6.3
Output File Name
Title
Code
Start Point (by Segment or delay in secs)
Stop Point (by segment or duration in secs)
8. Click OK
NOTE: the Batch function will now create Dwell files for each selected source file based on the
specified parameters. These files will be located in the specified source directory.
39