1
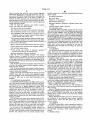
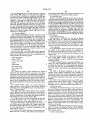
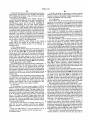
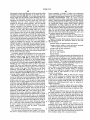
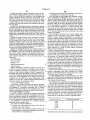
||Il|lIIIIIIIIIIIIIIIIllIlIllIlIlIlIll||||lIlllIlIlIIIllIlIllIIIlllIlIIIlll
US005504315A
United States Patent [191
[11]
Patent Number:
Hardesty et al.
[45]
Date of Patent:
[54]
5,504,315
* Apr. 2, 1996
IVIEANS AND METHOD FOR NON-CONTACT
4,795,281
1/1989 Ulinksi et al. ........................ .. 235/432
BAR CODE LABEL VERIFICATION
4,860,226
8/1989 Martin et al.
4,894,790
1/1990 Yotsuya et al. ..
[75] Inventors: John Hardesty, Ervine, Calif.; Edward
_
.
I};
.
,
lslxgalslgglgfugays'ggrgég?lrd
_
_
_
_
’
,'
"
_
’
Mission VICJO; Timothy Almeida, Santa
zyyowicze
5,194,720
311993 Reinnagel et a1.
5,218,190
6/1993
Hardesty et al.
..
.
..... .. 235/437
..................... .. 235/462
FOREIGN PATENT DOCUMENTS
[73] Assignee: Symbol Technologies, Inc., Bohemia,
55‘88172
7,1980 Japan '
OTHER PUBLICATIONS
N -Y-
[*l Notice;
IIXIIOYHEWT ----
,
Ana, both of Calif.
364/552
..... .. 364/552
The ponion of the term of this patent
subsequent to Jun. 8, 2010, has been
disclajmed,
“Quick Check 500” brochure, Photographic Sciences, 2
Pages (1939)
Barkan, Automatic I.D. News, “Author veri?es the key to
bar coding success”, (Nov. 1988).
[21] Appl- N04 59,252
[22]
Filed,
Primary Examiner—Robert A. Weinhardt
May 7 1993
'
Attorney, Agent, or Firm-—James H. Beusse
9
_
'
[57]
Related U.S. Apphcation Data
ABSTRACT
A portable, conveniently usable, and inexpensive non-con
[63] Continuation of Ser. No. 592,021, Sep. 28, 1990, Pat. No.
tact bar code veri?er permits testing of bar code labels at
some arbitrary but constant distance from the veri?er. Means
am provided for analog analysis of bar code label contrast
levels, and for derivation of new, instructive indices char
5,213,190-
[51] Int. Cl.6 ..................................................... .. G06K 7/10
S Cl
235/462 235/437
[52] U
F: I'd
""" """""""""""""""" "
23 5,262 472
[58]
‘e
0
acterizing the readability and print quality. Additionally, a
932635436 43,7’ 438:
’
’
564/5171 04 552’ 563’
‘
’
new method for determination of absolute bar code label
dimensions is disclosed. The method of calibration for
’
arbitrary scanning distance and angle standardizes not only
the veri?er’s ability to measure absolute dimensions at
.
[56]
References Clted
unknown distances, but also its ability to discern contrast
U.S. PATENT DOCUMENTS
4 199 8 6
4,1
4’251’7;8
0
2,1321
4’360’798
under arbitrary lighting conditions and scanning equipment.
h
4,5 1 04
This is accomplished by employing calibration standards of
:yal """""""""""" " 36
11,1982 swam et al' ‘
________ .
‘ I ''-
_
I II I i -.
7 '
known characteristics. Bar code veri?cation information
235/463
may be stored and/or employed for a variety of control and
235/462
analytical functions as recognized in the HIT.
1,1983
swam et
4,508,686
4/1985
Shaber et al. .
.... .. 235/466
4,705,939
11/1987
Ulinski . . . . . . . . . .
. . . . .. 364/563
9 Claims, 10 Drawing Sheets
I
I
I
I
I
I
AUTO
VERIFY
REVIEW
DATA
OPTIONS
CALIBRATE
DECODE
omsuosncs
USER
LD.
505
SIG
520
-_ CODABAR
mouISTRY
c129
I
I
I
- UPC/EAN/JAN
3|
530
'
ISYMBOLOGYH GROUP Hcwcxl IREPORTSHOUTPUTI _ UPDATE
. C93
.
525
- DELETE
CODABAR
'
.
. IiTA
- C128
' I25
. C39
' VERIFIER
_ D25
. C93
' UPC/ EAN/ JAN
PR'NTER
MEMORY
‘ RS-232
' MSI
SERIAL PORT
- IATA
I 52255
- BASIC REPORT
' ELEMENT REPORT
.
ANS“
_
_ ?g“
'
'
AIAG
VICS
'
'
EMBARC
IATA
- MEASUREMENTS
' DEVIATIONS
- NOMINAL REPORT
- INDUSTRY REPORT
US. Patent
Apr. 2, 1996
110
Sheet 1 of '10
5,504,315
105
/ CA‘
Hail .I-U'HI'
115
@
E
B
wm m@
m____
__n___
ENTER
@EWQB
:3.
0o
FIG.1
U.S. Pater‘lt
Apr. 2, 1996
Sheet 2 of 10
5,504,315
é/
aaa
08Nd:
‘lzYmvia.
US. Patent
Apr. 2, 1996
FIG“
Sheet 3 of 10
I
5,504,315
BARCODELABEL
FIG. 3C LWWDIGHAL SIGNAL
0 n . . Q - . . - . . - . - . - I I - . . I . . . . . Q . v n . - 1 - u v ’ n u u - u - n Q u u a . I ‘ - . I I u n u u ¢ u a u . - ¢ ¢ Q I o .
TIMED TRANSITION
INTERVAL
FIG. 3E I I I I I I I
l I BARCODELABEL
PM’ KW
RAW REFLECTIVITY
F's-3G I...Ji....d|UL...JIIIIMJLJHMHIWJIIn]LJHIU i'?ilgiqm
US. Patent
Apr. 2, 1996
Sheet 4 of 10
420
m _@@Emm_ @ m_@
h____
___._.
ENTER
FIG.4A
7N
@m_ @m_wtEQU
/
__
:3
5,504,315
US. Patent
Apr. 2, 1996
Sheet 5 of 10
r’ SELECT SYMBOLOGY w
» CQDABAR
5,504,315
T
T
DECODE DIAGNOSTICS
MSI
CODE 11
INTERLEAVED 2 OF5
DISCRETE 2 OF 5
CODE 39
SCAN
CODE 3 (F9
TO BE ANALYZED
L EAN/JAN 8
L
F l G. 8A
a
F l G. 88
CODE 3 OF 9
CODE 3 OF 9
*01234567*
[3 N E] 4 E] EH3
A
CHARACTER: UNKNOWN
CHARACTER: START
STATUS! GOOD
PRESS<H> FOR HELP
STATUS: BAD
ILLEGAL BIT PATTERN
PRESS<H> FOR HELP
F I G. 8C
F l G. 80
SCAN
MODULE
Q5
CONNECTOR
“115
CPU
,uEM
9&6
522
FIG.4B
U.S. Patel‘lt
Apr. 2, 1996
Sheet 7 of 10
PIIIuIII
5,504,315
I
III
IIIII
IIII
III“
I...
.III.I..I.IIII...I-
IIIuIIII'IIIIIIIIIIII IIIIIIIIIIIIIIII IIIIIIIIIII I IIIIIII.I.I.I.I IIIIIIII.II IIIIIIIIIIIIIII...II JIIIIIIIIIII I\
IIIIII.IIIIIIII.I IIIIIIII I I IIIIIIIIIII
IIIIIIIII
IIIIIII IIII
IIIII
IIIIuII~I IIIIIIIIIIIII IIII-.I.II.“"I.
IIII)
InII
IIIIIIIIII
IIIII
IIII
IIIIIIIIIIII
III
II
IIIII
II
II
IIIIIII
IIIII
IIII
III
I
III
..
I
III
IIII
II
Ir
II
I
II
I.II.II
II
IIIIIII
IIIIIII
III“II-nIII I
II
II
II
III
III
IIIII
III‘IIIII
IIII.IIIIIIIIIII
I
II“
III
II
I
II
I
IIII
II
IIII
IIIIIII
I"I
IIIIIIIIII
III
II
IIIIIIII\I
...I..
I41.I11.I‘.II.‘
IIIIIIIIIIII
I--uhIIII
I
II
III
III
II
I
m<w.do_I
U.S. Patent
Apr. 2, 1996
5,504,315
Sheet 8 of 10
ANALYSIS SCREEN 1 1
10/11/89 1038 AM
’ ANALYSIS SCREEN 2 T
BAR WIDTH RATIO= 2.9a
Code 3 of 9
GROWTHILOSS= +OO.16
STI
GRADE
LMARGIN RATIO GOOD
RMARGIN RATIO GOOD
PERCENT DECODE 100%
CONTRAST:
67%
93%
A
PRESS <H> FOR HELP J
PRESS <H> FOR HELP J
L
F 1 6.78
1 ANALYSIS SCREEN 3A 1
ELEMENT REPORT
MIN AVG MAX
WBAR- 3O 31 32
NBAR- 11 12 14
WSPC- 29 32 33
T ANALYSISSCREEN 38 S
ELEMENT REPORT
MOD MIN AVG MAX RAT
1 12 14 16
2 26 28 302.00
3 4O 42 44 3.00
4 54 54 54 3.88
PRESS<H> FOR HELP
NSPC- 1o 12 14
PRESS <H> FOR HELP
;
2
L ANALYSIS SCREEN 4
MEASUREMENTS
*STI 3 OF 4 *
BAR
12
27
41
\2
SPC BAR SPC
15 12 43
15 12 15
15
PRESS <H>FOR HELPJ
(
J
i
ANALYSIS SCREEN 5
DEVIATIONS
*STI3OF4*
BAR SPC BAR SPC
-2
0
0
+1 0
+1 -2
+1
+1
+1
PRESS<H> FOR HELP)
FIG. 7F
US. Patent
Apr. 2, 1996
Sheet 9 of 10
5,504,315
FIG.9
200
US. Patent
Apr. 2, 1996
Sheet 10 of 10
5,504,315
'sweep
2d
FIGJOB
5,504,315
1
2
lVIEANS AND METHOD FOR NON-CONTACT
BAR CODE LABEL VERIFICATION
tioning subsystems: a bar code printing system and a bar
code reading system. It is the shortcomings in either or both
This is a continuation of application Ser. No. 07/592,021,
?led Sep. 28, 1990, now US. Pat. No. 5,218,190.
code veri?cation system.
Among the problems occurring as a result of faulty
of these two subsystems that often necessitate a third, a bar
LA
printing systems are insuf?cient contrast between bars and
spaces (collectively referred to in the art as “elements”) of
TABLE OF CONTENTS
BACKGROUND OF THE INVENTION
1.1 Field of the Invention
1.2 Description of Prior Art
2. SUMMARY OF THE INVENTION
3. BRIEF DESCRIPTION OF THE DRAWINGS
4. DETAILED DESCRIPTION OF SPECIFIC EMBODI~
MENTS
a bar code label, unintentional bar width growth or loss due
to ink spread or shrinkage, ink voids or specs or other
10
printing errors. Bar code reading systems fail due to hard
ware problems such as maladjusted or ineffective sensors,
emitters, or processors in reading apparatus, and, in addition,
15
4.1 Overview of Veri?er Operation
4.2 Functional Description
4.2.1 CALIBRATE
4.2.2 AUTO VERIFY
4.2.3 DECODE DIAGNOSTICS
4.2.4 REVIEW DATA
4.2.5 OPTIONS
4.2.6 USER ID
4.3 Hardware Setup
4.3.1 Scanning Module
tively identify existing or potential problems in the printing
20
mance potential. For example, bar code printers might use a
designed to monitor print quality trends during the printing
25
30
of speci?cation. Alternatively, downstream bar code system
users, warehouse inventory managers, for example, might
products, or to note bar code labels that will require special
handling as they move through the system. An article by one
of the present inventors on the subject of bar code veri?ca
tion is instructive in pointing out potential bar code prob
lems, and potential veri?cation solutions. See “Opinion” by
35
Tina Barkan at: “Automatic I.D. News,” November 1988.
Previously, two types of veri?ers, both requiring contact
of the scanner with the bar code label, have been employed.
The ?rst, a contact-wand, uses a light emitting source at the
end of a pencil-looking wand which is guided manually over
4.4.4 Re?ectance Compensation for High-Density
Labels
5. CONCLUSION
WHAT IS CLAIMED IS:
ABSTRACT
process and stop printing as bar codes begin to be printed out
use information derived from a bar code veri?er to alert
him/her to the need to print new labels for a group of
4.3.3(c) Analog Circuitry
4.4.1 Calibration
4.4.2 Software Generated Indices and Information
4.4.3 AUTO VERIFY Method
and reading systems, thus allowing the user to adjust the bar
code system to derive its maximum e?iciency and perfor
veri?cation program as part of a quality control scheme
4.3.3(a) Microprocessor
4.3.3(b) Memory
4.3.3(f) Other
4.4 Software Setup
programming of the processor in the reading apparatus.
For these reasons, those who employ bar code systems
often have need for a veri?cation system which will effec
4.3.2 Electrical Interface Cable
4.3.3 Processor unit
4.3.3(c) Gate Array
4.3.3(d) Communications
due to user mistakes such as improper positioning of the
scanner relative to the bar code label of interest or improper
40
the bar code label by the user. Light emitted from the light
source is re?ected by the bar code label pattern and received
by a detector also in the wand. This type of veri?er requires
a single pass of the wand over the bar code label to check the
label and acquire the appropriate information. A second type
I. BACKGROUND OF THE INVENTION
45
1.1 Field of the Invention
In inventory-intensive wholesale and retail operations, bar
coding systems have become popularly employed in track
ing the ?ow of products. Bar coding systems frequently
include not only printing and reading equipment, but also
50
means for veri?cation. Veri?cation is a process by which a
Plessey, etc.) and industry group (e.g., ANSI, LOGMARS,
The known optical scanning veri?er systems have not
> proven to be altogether satisfactory for a variety of reasons.
First, contact-type veri?ers are inconvenient. Furthermore,
by virtue of the fact that they am designed to block out
ambient lighting conditions, contact-type veri?ers are not
bar code label is analyzed to determine if it has been printed
in accordance with print speci?cations dictated by the par
ticular bar code symbology (e.g., UPC, Code 39, MSI/
of prior art veri?er is the laser-based veri?er which also
requires contact between the head of the scanner unit and the
bar code label. However, the laser-based veri?er checks the
bar code label multiple times as the laser beam sweeps
rapidly back and forth across the label.
55
IATA, etc.) against which it was printed.
The present invention relates generally to optical scanning
systems for use in bar coding systems. More particularly, the
accurately predictive of bar code readability under various
reading conditions a?ecting noncontact~type readers. Sec
ond, analysis of quality and readability of bar code labels in
prior art veri?ers has not been as descriptive and instructive
as often desired. Third, prior art veri?ers have not had the
present invention relates to portable, non-contact bar code 60 added capability of being usable as bar code readers. Fourth,
veri?er arrangements and method by which the quality and
prior-an laser-based veri?ers have generally not been con
readability of scanned bar code labels are measured, ana
veniently portable due to their large size. Fifth, prior-art
lyzed, and reported in a convenient and inexpensive way.
veri?ers have been expensive due to their large number of
1.2 Description of Prior Art
The advantages of bar coding systems are well~known. In
order for a bar code system to e?‘ectively handle inventory
information, it must comprise at least two properly func
components required for signal processing. Finally, due to
65
the use of separate technology for veri?cation and reading,
bar code veri?ers have not been accurately predictive of a
reader’s ability to read a particular bar code label.
5,504,315
3
4
2. SUMMARY OF THE INVENTION
When a target label is subsequently scanned for veri?ca
tion, a map of perceived widths of a target label is likewise
The present invention overcomes some of the drawbacks
generated; the veri?cation scanning is performed under
of the prior art. A portable, conveniently usable, relatively
ambient conditions similar to the calibration-pattern scan
and at the same standard distance. Applying the previously
computed correction factors to the information represented
inexpensive non-contact bar code veri?er is provided which
will test bar code labels removed some arbitrary, but con
stant distance from the veri?er. The bar code veri?er can
in the map results in a more accurate representation of the
calibrate its operation according to the distance by which it
is removed from the bar code label being analyzed. The
calibration approach helps compensate for variations in, e. g.,
target label.
provided for analysis of print contrast quality in bar code
known to the veri?er software. By scanning both calibration
labels.
Additionally, a bar coder veri?er is provided that can also
standard labels, the veri?er creates a contrast scale against
which contrast levels derived in the normal operation of the
veri?er are compared. Once calibration has been performed
for a speci?c scanner module orientation (distance and
angle) relative to the bar code label of interest, the veri?er
In one embodiment, the veri?er calibrates itself for arbi
the motor speed of the veri?er scanner subsystem and other 10 trary, but constant lighting conditions affecting its operation.
veri?er characteristics.
The two bar code calibration standards used for measure
ment calibration are of different contrast levels—both levels
Further, according to the present invention, means are
function as a bar code reader.
Also, according to the present invention, means are pro
vided for verifying a bar code label using a wavelength of
light and scanning technology similar to those that will
is ready for operation in its normal mode. Alternatively, of
subsequently be used by reading apparatus.
course, a single calibration standard may be used.
Additionally, means are provided for determining the
absolute dimensions of bar code label elements.
The present invention includes bar code label veri?er
According to another feature of the present invention,
methods are provided for identifying and decoding bar code
labels and, subsequently, issuing diagnostic reports charac
apparatus for use in measuring and analyzing the quality and
terizing their readability. A target bar code label scanned by
readability of printed bar code labels (“target labels”). The
apparatus includes means for acquiring digital and analog
the veri?er is classi?ed as a member of a certain symbology
information characterizing a bar code label (sometimes
referred to herein as “re?ectivity data”), coupled with means
three step method:
for processing and analyzing that information, and for
reporting bar code label readability and print quality indices
as derived from the analog and digital information.
Visible laser light emitted by veri?er emitter means is
(e. g., C39, C93, UPC, etc) by an application of the following
1) Identify the target label’s boundaries by locating its
3O
2) Check the number of transitions (i.e., bar-to- space or
space-to-bar), because certain symbologies can have
only certain numbers of transitions; and
re?ected from a series of “white” (comparatively more
re?ective) spaces and “black” (comparatively less-re?ec
tive) bars comprising a bar code label, and, subsequently is
3) Attempt a character-by-character decode of the sym
35
veri?er is to assume that the target label of interest belongs
to a certain symbology or group of symbologies.
According to another feature of the invention, means are
series of data corresponding to binary digital re?ectivity
levels as measured by said scan means. The data series are
derived by the processor.
45
In accordance with the non-contact feature of the present
invention, a method is provided by , which the veri?er
for an arbitrary, but constant distance and angle of the
scanner module (comprising emitter and scan means) rela
tive to the bar code label of interest. Calibration is accom
plished by scanning one or two calibration standard patterns
55
Calculation of label print contrast index;
Characterization of label print quality rating as measured
by bar width growth/loss, element absolute widths and
width ratios;
Calculation of percent decode index,
Calculation of margins rating;
Calculation of weighted “scannability” index.
from scanning a calibration standard pattern under then~
ambient conditions (at an arbitrary standard distance) to
determine re?ectivity data corresponding to a plurality of
A veri?er processor unit is preferably equipped with
output means including a display screen, printer terminal,
and a scrim output port. Input means comprising a keyboard
points on the calibration standard pattern. The veri?er uses
the calibration-standard data to develop a “map” of the
perceived widths of the various bars and spaces comprising
the calibration standard pattem. These perceived widths can
be rendered less than optimally accurate by, e.g., variations
in scanner motor speed. The actual widths of the calibration
pattem bars and spaces are known, however; this enables the
veri?er to compute appropriate correction factors to com
pensate for such inaccuracies.
provided for analysis of print contrast and quality of bar
code labels. Software processing of both analog re?ectivity
data and digital re?ectivity data yield a plurality of functions
and indices re?ecting print contrast and quality, respectfully.
Functions performed and indices produced by the veri?er
processor using digital and analog data in normal operation
include:
Identi?cation of symbology and data content of label;
software calibrates its measuring parameters to compensate
of known element (bar and space) size and print quality.
Notably, the veri?er analyzes the re?ectivity data received
bologies passed by step #2.
According to another feature of the invention, the veri?er
can be limited in the possible symbologies it recognizes and
attempts to analyze. That is, a user may specify that the
received by veri?er scan means. Raw signal processing
means yield a series of data corresponding to analog re?ec
tivity levels as measured by said scan means and, other
stored in random access memory (RAM) using direct
memory access (DMA) operations. From RAM, the data are
accessible to the veri?er processor and become the basis for
a number of software functions performed and indices
margins;
are also provided. Processor software functions are menu
driven to enable the user to determine the mode of operation
of the veri?er.
Additional hardware features of the present invention
65
include a scanner gun trainer for standardizing scanner
orientation relative to bar code labels of interest; visible
laser-based diode emitter means; use of direct memory
5,504,315
5
6
access (DMA) hardware internal to microprocessor to
acquire laser scan information (digital and analog); use of
Turning now to FIG. 1, a bar code label veri?er 100
constituting one illustrative embodiment of the present
custom application modules for switching applications.
invention is shown. A scanning module 105 is operatively
Additional software features of the present invention
attached to a processor unit 110 via an electrical interface
include downward application of the veri?er as a bar code
cable 115. A trigger 120 functions to initiate a scan operation
reader; certain software generated print quality and read
by the scanning module 105. Laser light is emitted in a beam
ability indices which are new to the art.
from an emitting means located behind a scanning window
Information derived by the veri?er of the present inven
tion may be stored and/or employed in control and analytical
functions related to bar code system quality as commonly
recognized in the art.
These and other features of the invention will become
apparent hereinafter. It will be understood that the present
invention comprises many separate novel features which can
be employed individually or in combination and, can be
arranged in various con?gurations or orders to accomplish
substantially the same results and objects. Accordingly, any
125. The scanning window 125 and associated components
(e.g., laser emitter components and optical components)
may be of a design similar to that shown in U.S. Pat. No.
4,897,532, “Portable Laser Diode Scanning Head,” by
Swartz et al., issuedlan. 30, 1990. The laser beam sweeps
back and forth rapidly in a motion horizontal to the long axis
of the rectangular scanning window 125 (shown from the
15
side). FIG. 2 shows generally a bar code label 200. As
emitted laser light impinges on a remotely located bar code
label 200, it is re?ected to varying degrees by the bars 205
description of arrangements of equipment and methods
given in the following or preceding explanation should be
and spaces 210 comprising the bar code label 200. Re?ected
An example of a veri?er employing features of the present
invention in one exemplary embodiment, is the Laser Chek
to the intensity of radiation impringing upon it.
light is detected by a radiation sensitive scan means also
understood to be illustrative and exemplary in nature, and is 20 located behind scanning window 125. Said scan means
not intended to be self-limiting in any manner whatsoever.
functions to produce an analog electrical signal proportional
In order to calibrate veri?er operation for the unknown
distance and angle of the emitting means and scan means
25 relative to the subject bar code labels, a calibration routine
H is included as Appendix D in the parent application, which
is executed which entails the user scanning two calibration
H by Symbol Technologies, Inc. As an aid to understanding
the present invention, the User Manual for the Laser Chek
issued as U.S. Pat. No. 5,218,190 (hereby incorporated by
standard labels of known characteristics. The perceived
reference). Additionally, source code for the Laser Chek II
software is included as Appendix E in the parent application,
widths and contrast of bars and spaces constituting the
calibration standard labels are compared to previously stored
which issued as U.S. Pat. No. 5,218,190 (hereby incorpo 30 known widths and contrast in order to derive conversion
rated by reference).
factors to be used subsequently in relating relative scan data
to absolute distances and contrast levels.
Three states of operation are provided for veri?er opera
tion. A programming state is provided for use in allowing
3. BRIEF DESCRIPTION OF THE DRAWINGS
35 veri?er users to alter and customize veri?er operational
FIG. 1 shows in general an exemplary speci?c embodi
parameters. A calibration state is provided by which users
ment of the present invention.
will calibrate the veri?er for the arbitrary, but constant
FIG. 2 shows an enlarged view of a bar code label.
conditions under which it will verify bar code labels in
normal operation state. Finally, a normal operation state is
FIGS. 3A-3G show the effects of signal processing on the
provided for scanning bar code labels of interest.
In normal operation, ?ight re?ected from a subject label
raw re?ectivity signal derived by veri?er sensing means.
FIG. 4A shows generally an exemplary speci?c embodi
ment of the present invention as arranged during operation;
FIG. 4B is a block diagram of certain components of the
embodiment.
FIG. 5 shows an exemplary menu structure for the veri?er
of the present invention.
FIGS. 6A & 6B illustrate generally the appearance of
black and gray calibration standards.
200 is sensed by scan means located in scanning module
105, behind scanning window 125. Conventional signal
45
processing occurs locally to the scanning module 105 and in
the unit 110, and results in twenty-eight series of data points,
each series corresponding to a binary digital representation
of the light re?ected from the bar code label during one
emitting means sweep. FIG. 3A illustrates the step-by-step
eifect of processing on the raw re?ectivity signal derived
FIGS. 7A-7F show exemplary analysis report screens
50 from scan means. An analog-to—digital converter located in
used to report various information derived by a veri?er
operating in so-called AUTO VERIFY mode.
the scanning module converts the analog signal into a binary
FIGS. 8A-D show exemplary analysis report screens used
to report various information derived by a veri?er operating
in so-called DECODE DIAGNOSTICS mode.
signal is converted to a time-based count of relative per
signal Subsequently, in the unit 110, that binary digital
FIG. 9 shows the orientation of the laser scan beam
ceived transition widths. That is, a clocking digitizer creates
discrete data points corresponding to the perceived time
spacing between re?ectivity level transitions. Only a repre
emitted by the veri?er relative to the bar code label of
interest in normal operation.
sentative number of points are shown in FIG. 3A for
illustration. It will be understood that one data point will be
55
created by the clocking digitizer for each transition per
FIG. 10 shows differing possible placements of the veri
ceived. It will further be appreciated that the series of data
labeled “Time Transition Intervals” is representative of the
relative distance between re?ectivity level transitions
detected by scan means. These data are placed in random
access memory (RAM) storage by direct memory access
?er scanning means relative to the label of interest which are
illustrative of the need for calibration.
4. DETAILED DESCRIPTION OF SPECIFIC
EMBODIMENTS.
4.1 Overview of Veri?er Operation
65
(DMA) operations. Immediately thereafter, the scanning
module 125 acquires another series of data, this series
corresponding to analog re?ectivity levels detected by the
5,504,315
7
8
scan means during one emitting means sweep. FIG. 3B
505, the veri?er functions to set the maximum/minimum
illustrates this step-by-step eifect of signal processing on the
raw re?ectivity signal derived from scan means. A digitizer
contrast limits and adjust the veri?er measuring parameters
for a given scanning module 105 orientation (distance and
creates discrete data points corresponding to the analog
re?ectivity levels perceived by the scan means and further
angle) relative to the bar code label 200 of interest. AUTO
VERIFY mode 515 and DECODE DIAGNOSTICS mode
ampli?ed by a differential ampli?er. The digitizer and the
differential ampli?er circuitry are disclosed further in the
section “Hardware Setup”. It will be appreciated that the
510 are used to scan bar code labels of interest and,
subsequently generate information characterizing them. In
series of data labeled “Digitized Analog Signal” is repre
sentative of the re?ectivity level detected by scan means. 10
Again, this series of data is transferred into RAM in the
processor unit via DMA operations, as disclosed hereinafter.
DECODE DIAGNOSTICS mode 510 is used to derive
similar information when the user already knows the sym
bology of the bar code label of interest. In REVIEW DATA
mode 520, the veri?er is functional to review saved analysis
With all 29 sets of data in place RAM, the scanning
operation is complete.
A processor like a Hitachi HD64180 in the processor unit
110 accesses the data in RAM storage as needed in the
sessions performed under AUTO VERIFY mode 515.
OPTIONS mode 525 functions to allow the veri?er user to
software performance of functions and calculation of indices
to be speci?ed hereinafter. It will be appreciated that the
Hitachi HD64180 is also equipped to execute the DMA
transfers of scan data into RAM.
select certain veri?er features of diagnostic considerations
and actual contents of the diagnostic reports. USER ID mode
20 530 allows the user to select, create, or delete speci?c user
identi?cation codes.
4.2.1 CALIBRATE
According to the non-contact feature of the present inven
Subsequent processing of the analog and digital data sets
decodes and identi?es the scanned bar code label and yields
a plurality of indices characterizing its readability and print
quality.
4.2 Functional Description
AUTO VERIFY mode 515, the veri?er automatically dis
criminates between symbologies currently enabled for
searching and issues a diagnostic report on the type, content,
readability and print quality of the scanned bar code label
tion, bar code label 200 may be scanned by the scanning
25
In operation, a bar code veri?er 100 according to the
present invention functions as described hereinafter.
FIG. 4A shows the bar code veri?er 100 as connected and
module 105 removed some arbitrary, but constant distance
and oriented at some unknown, but constant, angle relative
to the label 200. Calibration of the veri?er for the arbitrary
conditions is accomplished by means of a calibration routine
situated during normal operation. The processor unit 110,
in which one or more calibration standard bar code labels of
interface cable 115, and scanning module 105 are function
known element (bar and space) dimensions and spacing and
ally connected. The scanning module 105 is preferably
print contrast is scanned.
In order to ensure the accuracy of bar code diagnostics
reporting, the user calibrates the veri?er before its ?rst use,
and subsequently re-calibrates whenever the veri?er orien
tation (distance and angle) relative to bar code labels of
interest is changed. In one embodiment, when CALIBRATE
hand-held by the user and means are provided for attaching
the processor unit 110 to the user’s belt for portability and
convenience in use. The trigger 120 is activated by the user
and serves to initiate a scan operation once the scanning 35
module 105 has been properly positioned above the bar code
label 200 of interest.
An important feature of the present invention lies in the
mode 515 is selected, the veri?er prompts the user to scan
?rst the black calibration standard 600 shown in FIG. 6A
followed by the gray calibration standard 605 shown in FIG.
6B. Alternatively, the veri?er control software may be
designed so that only a single label is scanned. Once this is
ability to make measurements at arbitrary, but constant
orientation of veri?er scanner module 105 relative to the bar 40
code label 200 of interest. In order to assist the user in
done, the veri?er calibration for that scanning orientation is
maintaining constancy of scanner module orientation, a
complete. Scan distance and angle must remain relatively
plexiglass scanner module trainer 400 is provided. The
scanning window end of the scanning module 105 ?ts into
constant in subsequent scans performed in AUTO VERIFY
a receptacle slot 402 on the trainer 400. The base 404 of the 45 mode 515 or DECODE DIAGNOSTICS mode 510. Scanner
module trainer 400 may be employed as one way of ensuring
this. Upon repositioning, the scanner must be re-calibrated
code label 200 of interest. The trainer 400 provides a
for the new scan distance and angle.
convenient way of maintaining a particular scanning module
Software components of the calibration system will
orientation relative to bar code label 200 after the veri?er has
become apparent hereinafter.
been calibrated for that orientation.
As shown in FIGS. 4A and 4B, the portable processor unit
4.2.2 AUTO VERIFY
trainer 400 rests on a surface in the same plane as the bar
110 is equipped with a keyboard 405 for receiving user input
at appropriate times during veri?er operation; a central
A veri?er according to the present invention operating in
AUTO VERIFY mode 515 performs diagnostics tests based
processing unit (CPU) 406 for performing various control
and computation program functions described herein; a
memory unit 407 accessible to the CPU 406 for storing
program instructions and data (which of course may com
prise DRAMs, SRAMs, ROMs, etc., in various combina
on re?ectivity information derived from the scan of a
55
particular bar code label of interest. If calibration has not
occurred, choosing AUTO VERIFY 505 from the menu
leads directly to the unit monitor 410 displaying a prompt
message requesting that the user calibrate before diagnostic
tions as desired); and a monitor 410 for issuing menu
choices and decode reports to the user at appropriate times
scanning can occur.
during the veri?er operation. A host computer port 415 for
AUTO VERIFY mode 505 prompts the user to scan the bar
connecting to a host computer and printer port 420 are
available for use in the corresponding output modes. In one
code label of interest and subsequently presents a diagnostic
report based on (a) data derived from that scanning attempt,
compared with (b) standard pro?le data, e.g., data coneem
embodiment, the processor unit 110 is battery operated.
After calibration has occurred, the veri?er operating in
In operation, the veri?er is menu driven. FIG. 5 shows the 65 ing element widths, margins, tolerances, number of transi
menu structure representing veri?er function choices avail
tions, etc., for various bar code label classes (e.g., Code 39,
able to the user in one embodiment. In CALIBRATE mode
etc.) stored in the memory unit 407. FIGS. 7A-E show the
5,504,315
10
series of screens that would be used to report diagnostic
Possible reasons for a DECODE DIAGNOSTICS decode
information derived from a bar code label scan. The user
failure include:
may use the OPTIONS mode 525 choice to customize the
information reported as well as the form in which it is
No start/stop character;
Bad check digit;
Margin out of speci?cation;
Bad character placement;
Minimum Re?ective Difference (contrast) below read
reported. It will be apparent from the discussion in subse
quent passages how the veri?er processor derives the infor
mation reported in the diagnostics report from the digital and
analog re?ectivity signals.
ability;
FIG. 7A shows the processor unit monitor Analysis
Screen 1 on which the veri?er reports:
The date and time of the analysis;
1O
The symbology (code type) of the scanned bar code label;
The encoded data content of the scanned bar code label;
The scannability trend index (STI), a weighted value of
reports available for review by REVIEW DATA mode 520,
readability based on fat/thin element measurements,
the veri?er internal memory must be enabled through the
percent decode, and contrast; ‘and,
The American National Standards Institute (ANSI) speci
OPTIONS 525 main menu choice as can be seen from FIG.
5. Selecting REVIEW DATA mode 520 from the main menu
immediately calls up to the processor unit monitor 410 the
?rst screen of the diagnostic report for the last label scan
?cation grade assigned to the scanned bar code label.
FIG. 7B shows processor unit monitor Analysis Screen 2
performed under AUTO VERIFY mode 515. Other diag
on which the veri?er reports:
nostic report screens may be reuieved by the user by
Ratio of wide to narrow label elements (bars and spaces);
appropriate input commands issued through the processor
unit keyboard.
Element growth/loss (deviation from expected widths);
Left and right margin status;
Percent decode, the number of expected successful
decodes of the label in 100 attempts; and,
Minimum re?ectance di?erence (contrast).
Incorrect number of data characters.
4.2.4 REVIEW DATA
A REVIEW DATA mode 520, selected from the veri?er
main menu allows the user to review diagnostic reports from
previous AUTO VERIFY scans. To make the diagnostic
25
4.2.5 OPTIONS
An OPTIONS mode 525, selected from the veri?er main
menu, allows the user to customize the operation of the
30
veri?er in regard to the symbologies recognized; the indus
try group standards to be applied to the diagnostic analyses;
clock operation; form of diagnostics reports; and, selection
of diagnostic report output.
Symbology: Through this choice, the user may de?ne
bar code label of interest as can be seen on the two different
which symbology types and variants will be diagnosed by
example screens.
FIG. 7D shows processor unit monitor Analysis Screen 4
35
the veri?er operating in AUTO VERIFY or DECODE
DIAGNOSTICS mode. If the symbology is a variable length
code, the user may specify the lengths to be diagnosed.
FIG. 7C shows two possible processor unit monitor
Analysis Screens 3—labeled 3A and B—on which the
veri?er reports wide/narrow element attributes. The contents
of this report might vary according to the symbology of the
on which the veri?er reports absolute bar/space measure~
ments for each character.
Legal symbologies might include, but not be limited to,
FIG. 7E shows processor unit monitor Analysis Screen 5
on which the veri?er reports deviations from average for the
element widths each character.
UPC/EAN/JAN, CODABAR, IATA, I25, D25, C39, C93,
C128. For UPC code types, for example, after choosing the
symbologies, the user is prompted to choose among the
following UPC variants: UPC A, UPC E, EAN 8, BAN 13,
SUPP 2, or SUPP 5. Similarly, having selected a multi
length symbology, the user is prompted to selectively enable
In the event of an unsuccessful decode attempt in AUTO
VERIFY mode 515, the veri?er issues diagnostic reports
like those in FIGS. 7A-E that indicate failure of the veri?er
to read the label- and, as much other information as is
possible.
or disable the various code lengths available.
45
Industry Group: Through this choice, the user may specify
a particular industry group standard which will be applied to
the bar code diagnostics analyses performed in AUTO
4.2.3 DECODE DIAGNOSTICS
In DECODE DIAGNOSTICS mode 510 a veri?er accord
VERIFY or DECODE DIAGNOSTICS mode.
Clock: Through this choice, the user may initialize the
ered during a scan of a bar code label of known symbology
and issues the user a general diagnostics report. After 50 time and date so that diagnostic reports can include time and
ing to the present invention analyzes re?ectivity data gath
selecting DECODE DIAGNOSTICS mode 510 from the
date of testing.
veri?er main menu, the user is prompted to select the
Reports: Through this choice, the user can customize the
form of the diagnostic reports issued by the veri?er operat
ing in AUTO VERIFY mode 515. Any of the Analysis
symbology of the bar code label of interest and, subse—
quently, to scan the bar code label. As before, the veri?er
compares scanned data from the bar code label with standard
pro?le data for various bar code label classes stored in the
memory unit 407.
FIG. 8A shows the screen that so prompts the user. FIG.
55
Screens shown in FIGS. 7A-7E can be selectively enabled/
disabled by the user.
Output: Through this choice, the user is allowed to select
the destination of the diagnostic report output. Available
choices include: output port 415, printer port 420, and
8B prompts a scan operation which may be initiated by the
internal memory.
user. If the bar code label scan is successful, the veri?er will
issue a diagnostics report as shown in FIG. 8C. That report
4.2.6 USER ID
indicates the code type of the bar code label, the encoded
In USER ID mode 530, a veri?er operating according to
data content, and a general readability index of the label.
the present invention allows the user to select, create, or
In the event of an unsuccessful decode attempt, the
delete user identi?cation passwords for storing and retriev
veri?er may issue a partial diagnostics report as shown in 65 ing individual customized veri?er options selected in a
FIG. 8D which delineates as much of the diagnostics data as
session.
possible and, indicates why the decode attempt failed.
4.3 Hardware Setup
5,504,315
11
12
In one embodiment of the present invention, a bar code
the scanning module 105 for the purpose of alerting the user
to the completion of a successful decode attempt.
4.3.3 Processor unit
Processor unit 110 is preferably a solid state, hand-held,
electronic portable terminal for recording, storing and trans
label veri?er 100 comprises a scanning module 105 for
directing a beam of radiation at a subject bar code 200, and
for receiving re?ected radiation representative of the con
stituency of the bar code label 200. Veri?er 100 further
comprises a processor unit 100, operatively connected to
scanning module 105 by means of an electrical interface
cable 115. The processor unit 110 may be a solid state,
hand-held, electronic portable terminal for recording, stor
ing and transmitting ?eld data entered either through the
scanning module 105 via the interface cable 115, or from the
mitting ?eld data entered either through the scanning mod
10
(voltage regulation) system of integrated chips, and some
analog circuitry for treatment of analog re?ectivity data
user directly via the keyboard 405. Alternatively, the pro
cessor unit 110 and scanning module 105 may be con
structed as an integral unit.
received from the scanning module 110. A customer replace
able 32KB or 64KB EPROM (custom application module)
is provided as an additional feature for changing the appli
cation program.
4.3.1 Scanning Module
The scanning module 105 is preferably a derivative of the
publicly available LS-2000 scanner gun manufactured and
4.3.3(a) Microprocessor
distributed by Symbol Technologies, Inc., the assignee of
this invention; aspects of this scanner gun are described in
the aforementioned U.S. Pat. No. 4,897,532, “Portable Laser
Diode Scanning Head,” by Swartz et al. A modi?ed scanner
board allows scanning module 105 to acquire analog re?ec
tivity data and transfer it to the processor unit 110 via
20
closed in the Hitachi HD64180 Data Book (January 1988).
4.3.3(b) Memory
it has extra hardware, operates as a regular scanner as well.
25
In one embodiment, memory of three sorts is employed by
the veri?er of the present invention. See Appendix C,
included in the parent application, which issued as U.S. Pat.
No. 5,218,190 (hereby incorporated by reference), for an
processor unit 110 and visa versa. In one embodiment, the
cable transmits the following signals:
digital bar pattern;
Microprocessor is preferably of a type like the Hitachi
64180. This device is a Z-80 code compatible eight bit
microprocessor with an on-board memory management unit,
two UART’s, two sixteen bit timers, an interrupt controller,
direct memory access circuitry, and other features as dis
interface cable 115. So, the scanning module 105, although
4.3.2 Electrical Interface Cable
Interface cable 115 is a standard l0-pin cable assembly
used to conduct signals from the scanner module 105 to the
ule 105 via the interface cable 115, or from the user directly
via the a keyboard 405. Processor unit 110 is provided with
a microprocessor, random access memory, a gate array for
implementation of all terminal logic, a power management
30
address map.
Read only memory (ROM), in the form of a 64KB run
time system (RTS) erasable programmable read only
analog VIDEO;
memory (EPROM), is used to store the run time terminal
“start of scan edge”;
operation program.
trigger;
decode LED;
laser beam enable;
power supply; and
A 32KB or 64KB customer replaceable EPROM, also
known
as a custom application module (CAM), is provided
35
for application programs. The veri?er application resides in
the CAM. The run time system EPROM will determine
which size CAM is inserted and make appropriate arrange
ments.
ground.
The ‘digital bar pattern’ signal constitutes the digital
40
The CAM is preferably accessible to the user, for
characterizes the relative spatial relationships between bars
example, under a battery compartment cover. Notably, by
replacing the CAM with a suitably programmed CAM in the
and spaces comprising the bar code label of interest 200. As
explained previously, this signal is timed in the terminal to
bar code reader, thus getting “double duty” out of the veri?er
re?ectivity data derived from the scan means. The signal
determine relative temporal relationships between bars and
conventional manner, the user may operate the veri?er as a
45
apparatus.
spaces, which relationships can later be converted to abso
The veri?er of the present invention uses CMOS static
lute spatial relationships using data acquired during calibra
random access memory (RAM) chips. A veri?er might be
equipped with, for example, 128KB or 256KB RAM
depending on the number of populated RAM chip sites.
tion.
The ‘analog VIDEO’ signal is the analog re?ectivity
signal exactly as it comes from the scan means. Terminal 50
under “Analog Circuitry”.
the present invention is more conveniently portable, and less
expensive than prior art veri?ers. In large part, these advan
The ‘start of scan edge’ signal originates in the scanning
module 105 and is used to mark the start of a left-to-right or
right-to-left laser beam sweep. This signal is vital to proper
55
terminal interpretation of the digital and analog re?ectivity
data coming from the scanning module 105.
The ‘trigger’ signal is used by the scanning module 105
array handles osm of the I/O functions including LCD select,
real time clock, keyscan, write protection, interrupts, laser
DMA and output latches for some communications and
60
RS~232 signals. The gate array also generates the I/O select
signals 'for controlling latches and tri-state buffers located
external to the device.
In addition, the gate array generates the run time system
(RTS) and Custom Application Module (CAM) EPROM
for a bar code label scan in response to depression of the
trigger 120 by the user.
The ‘decode LED’ signal originates in the processor unit
110 and is used to control a light emitting diode (LED) on
tages are related to the use of a custom gate array to handle
most of the terminal control functions. That custom gate
to signal the processor unit to turn ‘ON’ the laser beam in
response to depression of the trigger 120 by the user.
The ‘laser beam enable’ signal originates in the processor
unit 110 in response to the receipt of the ‘trigger’ signal from
the scanning module 105. This signal enables the laser beam
4.3.3(c) Gate Array.
According to one stated advantage of the present inven
tion over the prior art, a bar code label veri?er according to
processing of the ‘analog VIDEO’ signal is described below
65
enable signals, as well as RAM select signals for the various
RAM memory devices.
4.3.3(d) Communications
5,504,315’
13
14
An RS-232 board is provided for communication between
the processor unit 110 and a host computer. The RS-232
board contains the necessary voltage convertors and drivers
for true RS~232 level signals.
An external serial interface device (ESID) connector is
A veri?er according to the present invention includes
software means for the implementation of a plurality of
functions related to calibration, to label identi?cation or to
analysis of readability and print quality.
5
provided to accommodate use of any one of a plurality of
existing contact or non-contact scanners, including the
LS-2000 laser scanner that is part of the LaserChek II
invention,‘ the orientation of the veri?er scanning module
105 relative to the bar code label 200 of interest is assumed
to be unknown. Part of the software function of the proces
(Symbol Technologies, Inc.) bar code veri?er designed
according to this invention. Data output to this interface is
output through a UART located in the 64180 microproces_
sor. Signals are provided which allow the terminal software
to determine which peripheral device is attached to the prot
and so adjust its response accordingly. Data input from the
peripheral to the interface is directed to an I/O controller,
and to the UART in the microprocessor. Data input from a
wand or scanner will be input through the I/O controller;
ASCII data from any other peripheral device may be input
into the built-in UART in the microprocessor.
The analog re?ectivity signal derived in the scanner
module 105 is not handled by the ESID interface. It is
sor is to calibrate the measurement scheme of the veri?er for
a particular scan distance and angle.
Two challenges are introduced by the non-contact feature
of the veri?er: (1) “teaching” the veri?er to measure dis
tances (widths of bar code elements, etc.) at an arbitrary, but
15
constant scanning distance and angle and, (2) “teaching” the
veri?er how to measure contrast at an arbitrary, but constant
scanning distance and angle.
The former problem-how to measure distances——relates
to the fact that the veri?er sensor measures re?ectivity
versus time as opposed to re?ectivity versus distance. The
emitter means produces a scan beam across the bar code
label. This scan beam 900 is illustrated in FIG. 9 in relation
handled instead by analog circuitry in the terminal as
described below.
4.3.3(e) Analog Circuitry
According to one feature of the present invention, means
4.4.1 Calibration.
In accordance with the non-contact feature of the present
25
are provided for measuring re?ectivity contrast characteris
tics of bar code label 200. As previously described, an
to a bar code label 200 being scanned. Of course, the image
of the laser light emitted by the emitter means actually looks
like a small dot; the continuous beam image 900 is due to the
fact that the dot is sweeping side-to-side at a rapid pace. FIG.
10 illustrates how placement of a bar code label 200 at an
analog signal which represents the non-discrete re?ectivity
unknown distance from the emitter means of the scanning
levels perceived by scan means is derived by the scanner
module 105 will render the veri?er unable to discern abso
module 105. That signal appears at one of the contacts 30 lute widths of bar code elements. It will be apparent in view
coming down interface cable 115 and varies between zero
of this disclosure that a certain time, tsweep, is required for a
and three volts peak according to the character and compo
right-to~left or a left-to-right beam sweep along the laser
sition of the bar code label of interest 200. In the processor
path 1000 regardless of where in the beam path the bar code
unit 110, this signal is called VIDEO.
The VIDEO signal goes from the interface cable 115 to a
differential ampli?er. The differential ampli?er con?gura
label 200 is placed. Therefore, without calibration, the
35
veri?er has no way of distinguishing between a bar 20 mils
wide placed six inches from the scan window 125 and a bar
40 mils wide placed twice as far away.
In addition, as the dot sweeps back and forth, the motor
that drives the emitter varies in speed. At either the left or the
40
right end of the projected laser path 1000, the motor has zero
velocity because it is turning around. As it starts back toward
the center of the laser path 1000, it accelerates to its
maximum velocity before it reaches the middle of the scan
tion effectively nulls out any common mode noise that
comes into the processor unit 110 with the desired signal.
The ampli?er multiplier function increases the amplitude of
the signal by a factor of 1.5, so that an analog signal varying
between zero and four-and-one-half volts is directed into a
digitizer chip.
A state machine drives the digitizer with the proper timing
for sampling the analog input at the highest possible rate
consistent with the microprocessor speed. Data from the
digitizer are stored directly into RAM using the direct
reaches a stop at the other end of the laser path 1000. This
memory access (DMA) port on the microprocessor. The
distance measurement without a calibration method.
state machine coordinates data transfer to RAM.
4.3.3(f) Other
beam 900. It begins to decelerate again before it eventually
varying velocity further complicates the matter of absolute
The latter problem with non-contact veri?cation—“teach
ing” the veri?er to properly measure contrast at a distance
To accommodate the lower output voltage of NICAD 50 relates to the fact that incidental ambient lighting effects the
batteries, where used, a low resistance HEXFET transistor is
way the veri?er sensing means perceives light re?ected from
used in a voltage regulator circuit. The gate voltage of the
the bar code label. Part of the rating of the readability of bar
HEHJET is controlled by a CMOS op-arnp which compares
code labels depends on the contrast level—the difference
the regulated voltage to a reference voltage. When the power
between the re?ectivity level of the bars 205 and that of the
is on, the op-amp’s negative supply becomes a diode drop 55 spaces 210 that comprise the label 200. Contrast differences
above —l0V. When the battery voltage drops below that
are frequently taken into account in the design of the optical
needed to maintain the desired regulated voltage, the output
system in a veri?er, but the contrast problem can usefully be
of the op-arnp will go to its negative rail. This will result in
addressed in the calibration process as well.
the largest lVgSl and, therefore, the smallest possible voltage
In order to avoid inconsistencies in measurement of
drop across the HEXFET.
60 distances and contrast, the present invention provides a
The processor unit 110 uses all CMOS technology. An
software calibration method by which these two non-contact
eight line by twenty character (64Xl20) dots graphics
problems are corrected. At the user level, calibration consists
Supertwist display is used to provide‘ low power consump
of selecting CALIBRATE MODE 505, and then scanning a
tron.
black calibration standard 600 and a gray calibration stan
Printer port 420 consists of a six pin connector and is 65 dard 605 in response to prompts from the veri?er.
compatible with, for example, the PDT HI printer port.
4.4 Software Setup
Then, internally to the veri?er, the distance by which the
scanning module is removed from the bar code label is
5,504,315
15
16
determined by observing differences in the perceived widths
known standards, a number of indices that characterize
quality and readability of bar code labels can be calculated
for scanned bar code labels of interest. In AUTO VERIFY or
and spacing of bar code elements on the black and gray
calibration standards 600, 605-——all of which elements are or
known equal size and placed at equal distances from one
DECODE DIAGNOSTICS mode, the veri?er acquires
twenty-nine series of data—twenty-eight digital and one
another. The data points acquired by the calibration scan
operations are divided into zones, called bins-256 bytes
comprising each bin which represent re?ectivity data
acquired in equi-time sweep segments. The true absolute
analog—which represent the re?ectivity levels perceived by
the sensing element in the veri?er scanning module. Ideally,
the twenty-eight digital sweeps should contain identical
measurements. In reality, chances are that they will vary
widths or the calibration standard elements are stored in
memory accessible to the processor. In one embodiment, 10 slightly from one to another. The ?rst twenty-six data series
are used strictly to derive percent decode as shown herein
each pair of adjacent transitions, and, therefore, each bar or
after. The next data series (the twenty-seventh and twenty
space, is 30 mils wide. Bins usually hold two or three
eight) are used for all other digital calculations. The ?nal
transitions. The conversion of bar code element data from
data series (the twenty-ninth) is theanalog series and is used
time to distance units can thus be readily accomplished by
the processor. As an example, a particular bin might contain
two adjacent transitions which are 150 data points (data
for contrast analysis as disclosed hereinafter.
Software routines derive a plurality of indices from the
digital data, analog data, and a combination of analog and
digital data.
points being acquired at equi-time intervals) apart. Since it
is known that the transition-to-transition width should be 30
mils, a conversion factor of l50-to-30 or 5-to-l data points
to-mils is calculated for that bin. The conversion factors,
diiferent for each bin, are stored for use in normal operation
(AUTO VERIFY or DECODE DIAGNOSTICS modes).
Once the veri?er has been calibrated for a particular scan
20
distance, it converts data characterizing temporal relation
ships it acquires through the sensor into data re?ecting
spatial relationships and, further, into absolute distance data
25
by use of this conversion scheme.
In addition, contrast levels perceived by the scan means
during the calibration scan operations can be compared to
expected contrast levels for the known black and gray
Digital Processing: Binary digital re?ectivity data yield
30
calibration standards 600, 605 and, subsequently, measure
ment sensitivity can be adjusted for the ambient lighting
conditions affecting the veri?er scan means. Contrast levels
are measured for the calibration standards 600, 605 by again
the following indices and information about the bar code
label of interest:
Absolute widths of elements (bars and spaces);
Average absolute widths of wide and narrow elements
(bars or spaces) and wide-to-nairow ratio;
Average width of bars and spaces;
‘Number of transitions;
Size of bar code margins;
Percent decode
Absolute widths of bars and spaces are determined by the
application of the calibration conversion factors derived for
each bin during the calibration step. Transition widths are
measured in time, not distance as disclosed in “Overview of
Veri?er Operation”. The temporal relationship between tran
sitions is converted to a spatial relationship using the con
dividing the scan sweep into zones—or bins-each com~ 35 version scale calculated during calibration.
prising 256 bytes, and ?nding the difference between the
Average widths of wide and narrow elements—whether
darkest (least re?ective) and the lightest (most re?ective)
‘ bars or spaces—are calculated from binary digital re?ectiv
points in each of the bins. The black bars on the black
calibration standard 600 represent absolute black—or as
close to it as is possible with printed labels. The gray bars on
the Fay calibration standard 605 represents the lightest bar
coloring reliably readable by the veri?er sensor.
Speci?cally, contrast is read from the analog re?ectivity
data as the di?’erence between the intensity of light re?ected
by spaces and that of the light re?ected by bars. So, on a
ity data by averaging the absolute widths of transition
(high—to-low-to-high or low-to-high-to-low). The ratio of the
average width of wide elements to that of the narrow
45
contrast scale with levels l-lO, an eight is a high contrast
level and a two is a low contrast level. Now, black and gray
calibration standards 600, 605 are printed at known contrast
applying the calibration-generated scale for temporal-to
spatial conversions.
levels, one with high contrast and one with low contrast as
previously shown. During calibration, a contrast level for
each bin on each label is derived. Now, for each bin there
exists a high contrast level index, derived from the black
calibration standard 600, and a low contrast level index,
elements is calculated.
The average absolute width of bars and the average
absolute width of spaces are calculated from binary digital
data. A bar is identi?ed as a bar by virtue of its lower
re?ectivity level. Indices corresponding to the average width
of bars and the average width of spaces are calculated by
The number of transitions—high-to-low or low—to-high—
50
is calculated by counting the number of changes in digital
level in the series of data characterizing the digitized re?ec
tivity levels.
Bar code margins 215, the regions to either side of the bar
derived from the gray calibration standard 605. Thus, a
and space sequence in a bar code label, are shown in FIG.
calibration scale relating perceived contrast levels to actual 55 2. According to the various symbology speci?cations, they
contrast levels is derived for each bin in the measuring
are set at certain absolute or relative widths but are always
sweep. The scale can be illustrated graphically by imagining
wider than any other bar code elements by some set mul
a graph on which the x-axis represents perceived re?ectivity
levels and the y-axis represents actual re?ectivity levels. A
line is de?ned between the two points derived in calibra
tion-a dark and a light standard. Linear, interpolation can
be used to derive an actual contrast level (relative to the
tiple. Margins are identi?ed by the software of the present
invention as positions where there is a wide-to-narrow ratio
60
of adjacent elements that exceeds 6-to-l.
'
Percent decode is a standard, index re?ective of the
probability that a single scan of a bar code would result in
a successful decode. In a well designed bar code scanning
known standards) for any label for which a perceived
contrast level has been found.
system, that number will approach 100%. Percent decode is
4.4.2 Software Generated Indices and Information
65 determined by attempting to decode each of the ?rst twenty
Once the veri?er software has been “taught”, via calibra
tion, how to measure distances and contrast levels against
six digital data series, and then determining the percent of
those attempts ending with a successful decode.
5,504,315
17
18
Analog Processing: Analog processing consists of con
trast analysis. Analog re?ectivity, data are analyzed bin~
wise-as in the calibration operations-for the highest and
lowest re?ectivity level in each bin. The contrast is the
(3) Attempt to decode bar code character~by-character for
symbologies not eliminated in step #2.
In the ?rst step, bar code margins are identi?ed. Accord
ing to symbologies speci?cations there is to be a large
difference between the highest and lowest re?ectivity value.
amount of white space o?C either side of a bar code label. In
The perceived contrast in each bin is converted to actual
contrast using the scale and method outlined above. The
average of the bin-wise contrast is the contrast for the entire
bar code label.
In order to avoid inaccurate contrast ratings due to periph
order to identify these margins, and thereby locate the bar
eral label print, the veri?er analyzes only analog data that
code data among the scan data, the veri?er software looks at
transition widths of the binary digitized scan data acquired
by the scan operation. A margin is identi?ed by the software
10
actually correspond to the bar code label area. The bar code
area is determined by the digital measurements and decode
routine. Bin-wise contrast analysis is performed only on the
analog data corresponding to the label itself. Thus, non-bar
code printing near the bar code label does not distort contrast
as a wide element adjacent to a narrow element with
wide-to-narrow ratio between them of at least 6-to-l. Having
identi?ed both margins, the veri?er software “knows” which
of the scan data characterize the bar code itself-those data
15
ratings.
In general, higher contrast levels correspond to better
readability. The high-end of the contrast scale is represented
between the margins.
Having properly discerned the bar code margins and,
thereby, the bar code region, the software proceeds to
eliminate certain possible symbologies by counting the
number of binary transitions (high-to-low and low~to-high)
in the bar code region. Only certain numbers of transitions
by the contrast level derived by the scan of the black
calibration standard. There is low-end contrast level below 20 are allowed for certain symbologies. For instance, for Code
39, each data character must have ten transitions, except for
which the sensing means in the veri?er scanning module is
the last one which must have nine. Accordingly, a bar code
unable to reliably discern the difference in bars and spaces.
label with a number of transitions other than 19, 29, 39, etc.
That level is represented by the contrast level recorded from
the scan of the gray calibration standard.
cannot possibly be a Code 39 label. Similar restrictions
Digital and Analog Processing: An important aspect of
veri?cation is the ability of the veri?er to accurately predict
the readability of the bar code labels being tested. Along
these lines, another feature of the present invention is a
weighted index of ?ve digital and analog factors that in?u
ence general readability of a bar code label. Those ?ve
factors are:
25
to low security-—or con?dence—~level. As known in the art,
security levels re?ect the con?dence a decoder can have in
30
Bar Width Ratio;
Percent Decode;
Margins; and,
Digital Measurements;
particular symbology, that symbology is abandoned and the
veri?er software moves on to check the next symbology in
the security level table.
In the event of a decode attempt still unsuccessful after all
possible symbologies have been exhausted, the veri?er
reports an unsuccessful decode attempt and lists as much
No. 5,218,190 (hereby incorporated by reference), shows the
scheme for varied weighting of the factors. Pseudo code
45
The accuracy of scan data can be reduced if the width of
an element (bar or space) of a bar code label is less than the
spot size of the laser beam, because the radiation re?ected
from such an element is less than from, e.g., an element that
is wider than the spot size. In an embodiment of the present
without a priori knowledge of the symbology type. In the
speci?c embodiment described heretofore, this feature is
invention, this factor is taken into account by increasing the
computed re?ectance of spaces, and decreasing the com
puted re?ectance of bars. The following table shows a
convenient set of adjustment values as explained below:
called AUTO VERIFY mode 515.
In AUTO VERIFY mode 515, the veri?er automatically
identi?es a scanned bar code label as belonging to one of the
known symbologies enabled for identi?cation by the user.
The method used to identify the symbology of and decode
a bar code characterized by binary digital data derived from
performed in the processor unit.
60
The method for AUTO VERIFY is:
(1) Locate bar code label data among scan data by
identifying bar code margins;
(2) Count number of binary digital transistors between bar
code margins and eliminate symbologies requiring dif
ferent numbers of transitions; and,
information about the label as is possible.
It will be recognized that at the completion of this three
step AUTO VERIFY routine, the software will have not only
identi?ed the symbology of the scanned bar code label, but
also decoded its data contents.
4.4.4 Re?ectance Compensation for High-Density Labels
4.4.3 AUTO VERIFY Method
As disclosed, a veri?er according to the present invention
comprises a feature by which a bar code label is identi?ed
as belonging to a particular symbology and is decoded
a scan operation is implemented as a software function
the accuracy of a particular decode attempt. With higher
security level codes, the decoder has a greater level of
con?dence that, if the bar code is decoded to yield particular
data contents, those contents are correct. Therefore, the user
can have a greater degree of con?dence in the ?nal answer.
35 If a character cannot be decoded using the conventions of a
Label Contrast.
The bar code label of interest is assigned a score from 0
to 100 for each of the factors. In the index, each of the ?ve
scores is weighted, according to its absolute level. Lower
scores are more heavily weighted. Table I (Appendix A),
included in the parent application, which issued as U.S. Pat.
(Appendix B), included in the parent application, which
issued as U.S. Pat. No. 5,218,190 (hereby incorporated by
reference), re?ects the weighting scheme.
apply to other symbologies.
Finally, a character-by-character decode attempt is made
for each remaining possible symbology in order from high
65
Narrowest element size
Percentage increase/decrease
27
8
9
10
11
12
13
36
34
32
26
22
19
6
mils
mils
mils
mils
mils
mils
The re?ectances of the elements read in a bar code label are