1
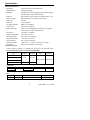
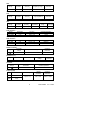
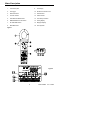
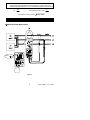
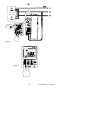
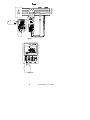
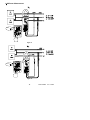
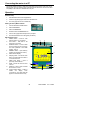
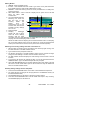
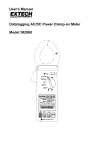
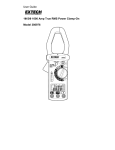
User's Manual
Datalogging AC/DC Power Clamp-on Meter
Model 382065/382068
Table of Contents
Specifications
General Specifications …………………………………………………………. 3
Range Specifications……………………………………………………………. 3
Safety Information ……………………………………………….………………. 5
Meter and Display Descriptions………………………………..……….……… 6
Measurements
AC/DC Power Measurements………………………………………………….. 7
AC/DC Voltage Measurements………………………………………………… 16
AC/DC Current Measurements………………………………………….……… 17
Resistance and Continuity Measurements…………………………….……… 18
Diode Tests …………………….…………….……………………………..…… 19
Min/Max Mode ………………………………….……………………………..…… 19
Peak Detector ………………………………….……………………………..…… 19
Data Hold .………………………………….…………………………………..…… 19
Datalogging …………………………………….……………………………...…... 20
Connecting the Meter to a PC.….….….….….….….….….….….….…..….….. 21
Wiring and Protocol........................................................................................ 24
Maintenance
Battery Replacement ..………………………………….…………………..…… 26
Cleaning ………………………………….……………………………..……….. 26
Repair and Calibration Services ………………………………………….……. 26
Tech Support Hotlines..………………………………….………………………. 26
Introduction
Congratulations on your purchase of the Extech 382065/382068 Datalogging AC/DC
Power Clamp-on Meter. Measurements include DC and AC True Power, Apparent Power,
Power Factor, and True RMS Voltage, Current, & Watts. Status indication for Lead/Lag
and PF is included as well as dual displays of KW + PF, KVA + PF, V + A, A + Hz, and V +
Hz. The frequency of Voltage and Current measurements can be displayed also.
Datalogger and RS-232 PC interface features are built into the meter. The Datalogger/Data
Acquisition Software package is for exclusive use with the Model 382065/382068 Clamp
on Power Datalogger. Windows® 95, 98, NT, 2000, ME and XP operating systems are
supported. Users can download readings stored in the datalogger to a PC, program
sample rates for datalogging, remotely monitor readings, and save readings to ASCII files
for export to spreadsheet and other programs. Careful use will provide years of reliable
service.
2
Model 382068 V3.0 4/2005
Specifications
General Specifications
Main display
4-digit (10,000 count) multi-function LCD
Bargraph display
40-segment bargraph
Datalogger
4000 data point continuous logging (25 point manual logging)
Peak hold
Built-in detector captures positive and negative peaks to .1ms
Maximum voltage
600Vrms between any terminal and earth ground
Meter power
9V battery
Battery life
30 hours (approx.)
with MIN / MAX and Peak detect recording
Low battery indication
Battery icon is displayed
Auto power off
After 30 minutes (approx.)
Display update rate
2 times per second (Bargraph); 5 times per second (Digits),
(once every 6 seconds for the KW function)
Jaw opening
For Cables φ 1.8” (46mm)
Operating temperature
32 to 122 F (0 to 50 C)
o
o
Operating Humidity
R.H. < 80% non-condensing.
Storage temperature
14 to 140 F (-10 to 60 C)
o
o
o
Storage Humidity
RH < 70% non-condensing
Dimensions/Weight
10.24 x 3.66 x 1.77" (260 x 93 x 45mm) / 1 lb. (450g)
Accessories
Range Specifications
Carrying case, test leads, and 9V battery
o
o
o
o
Accuracy specs are ± (reading + no. of digits) at 64 to 82 F (18 to 28 C) and RH to 80%
True power & Apparent power measurements (600KW Max.)
Frequency
Input
Resolution
Accuracy
range
Overload
protection
V<130V, A<150A
V>130V, A<150A
0.01
±(2%+5)
0.1
±(2%+1)
45Hz to 500Hz
600V/1100A
Range*
Resolution
Accuracy
Frequency Range
0.30 to 1.00
± (4% + 10d)
0.001
10Hz to 5KHz
0.00 to 0.30
Not specified
*Minimum voltage: 100V AC, Minimum Current: 20A AC
Sensitivity
>100V / 10A
V<130V, A>150A
V>130V, A>150A
Power Factor
DCA
Range
2 to 1000A
Resolution
Accuracy
Overload protection
0.1A
±(1.5% + 5)
1100A
3
Model 382068 V3.0 4/2005
ACA
Range
Resolution
Accuracy
Frequency range
Overload
protection
2 to 1000A
0.1A
±(1.5% + 5)
45Hz to 500Hz
1100A
Crest factor < 3 for stated accuracy
DCV
Range
Resolution
Accuracy
2 to 600V
0.1V
±(0.5% + 5)
Input impedance
Overload
protection
1MΩ
600V
ACV
Range
Resolution
Accuracy
2 to 600V
0.1V
± (0.5%+5)
Crest factor < 3 for stated accuracy
Input
Frequency
impedance
range
45Hz to 500Hz
1MΩ
Overload
protection
600Vrms
Peak indication
Range
Resolution
20A~80A
0.1A
80A~1000A
0.1A
Peak detect acquisition time .1ms
Accuracy
±(10% + 10)
±(6% + 10)
Overload protection
1100A
1100A
Peak indication
Range
Resolution
20V~80V
0.1V
80V~600V
0.1V
Peak detect acquisition time .1ms
Accuracy
±(10% + 10)
±(6% + 10)
Overload protection
600Vrms
600Vrms
Audible continuity
Continuity
Range
beeper
Open circuit voltage
Overload
protection
3.2V
600Vrms
< 50 Ω
Resistance ( Ω )
Range
Resolution
Accuracy
10KΩ
1Ω
±(1% + 5)
Open circuit
voltage
3.2 V
Overload
protection
600Vrms
Diode test
Range
Resolution
Overload protection
0.001V
600Vrms
Frequency (Hz)
Range
Resolution
1KHz
0.1Hz
5KHz
10 Hz
Accuracy
±(0.5% + 5)
4
Voltage
sensitivity
10V or 10A
Overload
protection
600V / 1100A
Model 382068 V3.0 4/2005
Safety Information
1. Read the following safety information carefully before attempting to operate or service
the meter.
2. Read all operating instructions before use.
3. To avoid damage to the instrument do not exceed the published input limits.
4. Do not use the meter or test leads if they appear damaged. Use extreme caution when
working around bare conductors or bus bars. Accidental contact with a conductor could
result in electric shock.
5. Use the meter only as specified in this manual otherwise the protection provided by the
meter may be impaired.
6. Use caution when working with voltages above 60VDC or 30VAC RMS. Such voltages
pose a shock hazard.
7. Before taking resistance or continuity measurements, disconnect the circuit from the
main power supply and disconnect all loads from the circuit.
8.
Safety Specifications:
• Installation categories III
• Pollution degree 2
• Altitude: 2000m max
• Indoor use only
Safety symbols
Caution: Refer to this manual before using the meter.
Dangerous voltages.
Meter is protected throughout by double insulation or reinforced insulation.
When servicing, use only specified replacement parts.
Complies with EN-61010-1, IEC 1010-2-32
5
Model 382068 V3.0 4/2005
Meter Description
1.
Transformer jaws
9.
2.
Jaw trigger
10. RS-232 PC Interface Jack
3.
Data Hold button
11. COM terminal
4.
Function selector
12. VΩHz terminal
5.
Peak Detector READ button
13. Low battery indication
6.
MIN/MAX/PEAK function button
14. Analog Display
7.
DC A/W ZERO button
15. Bargraph Display
8.
RECORD button
16. Units Symbols
LCD display
Figure 1
HOLD
Hz
V
OFF
1000A
KW
3 3W
3 4W
WL123MEMREADP P- HOLDMAX- MIN
3 3W3 4W
Hz
KVA
PF lead lag
RECORD
KW
KVA
K
600V
MAX CAT
WL123MEMREADP P-HOLDMAX- MIN
3 3W3 4W
Hz
KVA
PF lead lag
RECORD
Figure 2
KW
KVA
K
6
Model 382068 V3.0 4/2005
AC/DC Power Measurements
AC/DC 1φ2W Power (W) and Power Factor (PF) Measurements
HOLD
Hz
V
OFF
1000A
KW
3 3W
3 4W
PF
lag
KW
PF
lag
KW
600V
MAX CAT
600V
MAX CAT
Figure 3
WARNING
Do not clamp on to a conductor when zeroing the jaw's
residual magnetic field until the LCD reads zero.
1. With the clamp jaws empty, turn the clamp meter on by setting the rotary switch to the KW
position (refer to figure 3).
2. Insert the test leads into the input terminals (black lead to COM and red lead to '+').
3. Connect the probe end of the black test lead to the neutral line.
4. Connect the probe end of the red lead to the power line.
5. Clamp the meter onto the conductor where the red test lead is connected.
6. The power clamp will automatically select the appropriate range.
7. Read the Watt (middle of display) and PF (top display) values on the LCD.
8. Press the READ button to scroll through the dual displays of KW + PF, A + V, and KVA + PF.
7
Model 382068 V3.0 4/2005
Note: When calculating KVAR, the KVAR accuracy greatly depends on V, A and KW
measurement accuracy (especially when PF is very close to 1). To get a more accurate
value when PF is greater than 0.91 (φ < 25°), use the following equation for a pure sine wave
PF =
KW
KVA
KVA (Apparent Power): KVA =
V *A
1000
KVAR (Reactive Power): KVAR= (KVA)2 − (KW) 2
Note: The "+" sign printed on the jaw must face the power source.
3φ3W AC/DC Power Measurement
HOLD
Hz
V
OFF
1000A
KW
3 3W
3 4W
WL12
3 3W
PF
lag
KW
WL12
3 3W
WL12
PF
lag
3 3W
KW
600V
600V
MAX CAT
MAX CAT
Figure 4
8
Model 382068 V3.0 4/2005
A. With the Clamp jaws empty, turn the meter on by setting the rotary switch to the 3φ3W
position. WL12 will appear on the upper left side of the LCD prompting the user to take a
WRS (L2 L1) measurement.
1. Insert the test leads into the input terminals (black to COM terminal and red to '+').
2. Select one phase (eg. S or L2) as COM and connect the probe end of the black lead to
that phase (eg. S or L2).
3. Connect the probe end of the red test lead to the second phase (eg. R or L1).
4. Clamp the meter onto the same phase as the red test lead (eg. R or L1).
5. The meter will automatically select the proper range.
6. Wait until the reading is stable (about 6 seconds), and then press the READ button.
WL23 will appear prompting the user to take a measurement of WTS (WL3 L2).
B. Measure WTS (L3 L2) (refer to figure 5).
1. Disconnect the red test lead from the phase where the clamp is connected.
2. Connect the red test lead to the third phase (eg. T or L3).
3. Clamp onto the third phase (where the red test lead is connected; eg. T or L3).
4. The meter will automatically select the proper range.
5. Wait until the reading is stable (about 6 seconds) and then press the READ button.
C. The power clamp will process these measurements and display the result.
WL123 appears in the upper left corner of the LCD and the 3φ3W power
measurement is displayed in watts (this value is now stored in meter memory).
The following equations are provided for your information.
W3φ3W = WRS(L1L2) + WTS(L3L2)
KVA3φ 3W = K W 2 3φ 3W + KVAR 2 3φ 3W
PF 3φ 3W =
KW 3φ 3W
KVA3φ 3W
Notes:
1. Once a phase is designated as common (COM) it should remain as such in all
subsequent measurements. For example, if the S (or L2) phase is selected, S
(or L2) phase is connected to COM during the measurements of WRS (or
WL1L2) and WTS (or WL3L2) in 3φ 3W unbalanced power.
2. The "+" sign printed on the jaw must face the power source.
3. In 3φ3W unbalanced power measurements, if either WRS or WTS is negative
(connection error) ensure that all test lead and clamp connections are correct.
9
Model 382068 V3.0 4/2005
HOLD
Hz
V
OFF
1000A
KW
3 3W
WL 23
3 4W
3 3W
WL 23
PF
lag
3 3W
KW
WL 23
3 3W
PF
lag
KW
600V
MAX CAT
600V
MAX CAT
Figure 5
WL123
HOLD
3 3W
PF
lag
KW
Figure 6
600V
MAX CAT
10
Model 382068 V3.0 4/2005
3φ4W AC/DC Power Measurement
HOLD
Hz
V
OFF
1000A
KW
3 3W
3 4W
WL1
3 4W
WL1
3 4W
WL1
PF
PF
lag
KW
lag
3 4W
KW
600V
600V
MAX CAT
MAX CAT
Figure 7
HOLD
Hz
V
OFF
1000A
KW
3 3W
3 4W
WL 2
3 4W
WL 2
PF
lag
3 4W
KW
WL 2
3 4W
PF
lag
KW
600V
600V
MAX CAT
MAX CAT
Figure 8
11
Model 382068 V3.0 4/2005
HOLD
Hz
V
OFF
1000A
KW
3 3W
WL 3
3 4W
WL 3
PF
3 4W
lag
3 4W
KW
WL 3
3 4W
PF
lag
KW
600V
MAX CAT
600V
MAX CAT
Figure 9
WL123
HOLD
3 4W
PF
lag
KW
600V
MAX CAT
Figure 10
12
Model 382068 V3.0 4/2005
A. Measure WR (L1) / PFR (L1) (refer to figure 6).
1. With the jaw enclosure empty, turn the meter on by setting the rotary switch to the 3φ4W
position.
2. Insert the test leads into the input terminals (black lead to the COM terminal and red to '+').
3. Connect the black lead's probe end to the neutral line.
4. Connect the red lead's probe end to the first phase (eg. R or L1).
5. Clamp on to the same phase as the red test lead (eg. R or L1).
6. The meter will automatically select the proper range.
7. Wait until the reading is stable (about 6 seconds) then press the READ button. WL1 will
disappear and WL2 will appear prompting the user to take a WS (L2) / PFS (L2) measurement.
B. Measure WS (L2)/PFS (L2) (refer to figure 7)
1. Disconnect the red test lead from the phase where the jaws are clamped.
2. Connect the red test lead to the second phase (eg. S or L2).
3. Clamp onto the phase where the red test lead is connected (eg. S or L2 phase)
4. The meter will automatically select the proper range.
5. Wait until the reading is stable (about 6 seconds) then press the READ button. WL2 will
disappear and WL3 will appear prompting the user to take a WT (L3) / PFT (L3) measurement.
C. Measure WT (L3)/PFT (L3) (refer to figure 8)
1. Disconnect the red test lead from the phase where the meter's jaws are clamped.
2. Connect the red test lead to the third phase (eg. T or L3 phase).
3. Clamp onto the phase where the red test lead is now connected (eg. T or L3).
4. The meter will automatically select the proper range.
5. Wait until the reading is stable (about 6 seconds) and then press the READ button. WL3 will
disappear from the upper left hand area of the LCD.
6. The meter will process these three sets of data (refer to figure 9) and display the 3φ4W
power measurement (WL123 will be displayed). The 3φ4W measurement will then be
stored in memory. The following equations are provided for your information.
W3φ4W = WR(L1) + WS(L2) WT(L3)
KVA3φ 4W = K W 2 3φ 4W + KVAR 2 3φ 4W
PF 3φ 4W =
KW 3φ 4W
KVA3φ 4W
Notes:
1. The "+" sign printed on jaw must face the power source.
2. For 3φ4W power measurements, WR or WS and WT must be positive. If any are
negative, check the test lead and clamp connections for polarity errors.
13
Model 382068 V3.0 4/2005
1φ3W Power Measurement
HOLD
Hz
V
OFF
1000A
KW
3 3W
3 4W
WL12
3 3W
PF
lag
KW
WL12
3 3W
WL12
PF
lag
3 3W
KW
600V
600V
MAX CAT
MAX CAT
Figure 11
HOLD
Hz
V
OFF
1000A
KW
WL 23
3 3W
WL 23
PF
3 3W
lag
3 4W
3 3W
KW
WL 23
3 3W
PF
lag
KW
600V
MAX CAT
600V
MAX CAT
Figure 12
14
Model 382068 V3.0 4/2005
1φ3W power measurements are similar to 3φ3W
unbalanced power measurement except for the
nomenclature. Two measurements are required:
WRS (L1G) and WTS (L2G).
WL123
HOLD
3 3W
A. Measure WRS (L1G) (refer to figure 11).
PF
lag
1. With the Clamp jaws empty, turn the meter on by
setting the rotary switch to the 3φ3W position.
KW
2. Insert the test leads into the input terminals.
3. Connect the probe end of the black lead to
ground.
4. Connect the probe end of the red lead to the
second phase (eg. L1).
600V
5. Clamp onto the second phase (eg. L1).
MAX CAT
6. The meter will automatically select the proper
range.
7. Wait until the reading is stable (about 6 seconds)
and then press the READ button.
8. WL23 will appear prompting the user to take the
WTS (L2G) measurement.
Figure 13
B. Measure WTS or WL2G (refer to figure 12).
1. Disconnect the red test lead from the phase where the jaws are clamped.
2. Connect the red test lead to the L2 line.
3. Clamp onto the L2 line (where the red test lead is connected).
4. The meter will automatically select the proper range.
5. Wait until the reading is stable (about 6 seconds) and then press the READ button.
C. The power clamp sums the two values, displays the result, and stores the 1φ3W
power measurement in memory. Note the following equation:
W1φ3W = WRST = WRS(L1G) + WTS(L2G)
15
Model 382068 V3.0 4/2005
Current and Voltage Measurements
AC, DC, and AC+DC Voltage Measurements
HOLD
Hz
V
OFF
1000A
KW
3 3W
3 4W
Hz
V
600V
MAX CAT
Figure 14
Warning: The maximum input is 600V. Do not attempt to take voltage measurements
that exceed this limit; electrical shock and damage to the clamp meter can result.
1. Set the rotary switch to the 'V' position (refer to figure 14).
2. Insert the test leads into the input terminals (black lead to COM and red to '+').
3. Connect the probe ends of the test leads in PARALLEL to the circuit to be measured.
4. The meter will automatically select the appropriate range and units (AC or DC).
5. Read the voltage and frequency values displayed on the LCD.
Note: The sensitivity for frequency measurements is 10V. The frequency range is 45 –
500Hz. If the frequency is less than 45 Hz, the LCD will display "------".
16
Model 382068 V3.0 4/2005
AC, DC, and AC+DC Current Measurements
A
HOLD
Hz
V
Hz
OFF
1000A
KW
A
3 3W
3 4W
Hz
A
600V
600V
1.
2.
CAT
MAX CAT
Figure 15
Set the rotary switch to the '1000A' position (refer to figure 15).
For DC, press and hold the ZERO button until a beep is heard to zero the reading; the
LCD will display “- - - -” while zeroing.
3.
Press the trigger to open the jaw.
4.
Fully enclose the conductor to be measured. Do not allow a gap between the two jaw
halves when measuring.
5.
The clamp will automatically select the appropriate range.
6.
Read the current and frequency values displayed on the LCD.
Note: The current sensitivity for frequency measurements is 10A. The frequency range
is 45 - 500Hz. If the frequency is less than 45 Hz, the LCD will display "------"
17
Model 382068 V3.0 4/2005
Resistance and Continuity Measurements
Warning: Before taking any in-circuit resistance measurements, remove
power from the circuit under test and discharge all capacitors.
1.
Set the function switch to the Ω position for both resistance and continuity
measurements.
2.
Connect the black test lead to the COM terminal and the red test lead to the '+'
terminal.
3.
Connect the test leads to the circuit being measured and read the displayed
resistance value. Refer to Figure 16.
4.
For Continuity measurements, an audible tone will sound when the reading is below
50Ω.
HOLD
Hz
V
OFF
1000A
KW
3 3W
3 4W
K
600V
MAX CAT
Figure 16
18
Model 382068 V3.0 4/2005
Diode and Continuity Measurements
1.
Connect red test lead to the " + " terminal and black test lead to the "COM"
terminal.
2. Set the range switch to the diode test position "
".
3. Connect the red test lead to the anode side and black test lead to the cathode side
of the diode being tested.
4. Read the forward voltage value on LCD. The value for a good diode is 0.3VDC for
germanium diodes and 0.7VDC for silicon diodes.
5. If the test lead connection is reversed, the digital reading should reflect an open
circuit condition if the diode is good.
6. Continuity measurement: When the reading is below 50mV an audible tone will
sound.
MIN/MAX Recording
1. Set the Function Switch to the Voltage or Current position.
2. To record and view MIN and MAX values while taking measurements, press the MIN
MAX button.
3. Now while measurements are being taken, the display only the MIN or the MAX
reading. Use the MIN MAX button to toggle between MIN and MAX readings. The LCD
will display MIN or MAX as selected.
4. To exit this mode, press and hold the MIN MAX button until the MIN and MAX display
icons disappear from the LCD.
Peak Detection
Peak Detect mode is used to capture fast transients signals (to 0.1ms) such as those
caused by motor startup surges or arc welding equipment switching.
1. Set the Function Switch to the Current or Voltage position.
2. Engage the Peak detector by pressing and holding the READ button until a short beep
is heard. (Note that if the button is held longer, a longer beep will sound and the meter
will be in the datalogging view mode; refer to the datalogging section for more info).
3. The LCD will display 'P-P+' when the Peak Detect mode is accessed correctly. Use the
PEAK button to toggle between ' P+ Max' (captures positive polarity peaks) and 'PMIN' (captures negative polarity peaks).
4. To exit the Peak mode, press and hold the PEAK button for two seconds (until the Pand P+ icons disappear).
5. Take a Voltage or Current measurement on a transient signal and the display will show
the peak of the pulse. The fastest surge the meter can detect is 0.1ms.
Data Hold
1. To freeze a displayed reading, press the HOLD key.
2. The HOLD icon will appear on the top of the LCD to let the user know that the meter is
in the Data Hold mode.
3. To return the meter to the normal operation mode, press the HOLD key again. The
HOLD icon will extinguish.
19
Model 382068 V3.0 4/2005
Datalogging
Single mode
1. Single mode datalogging records one reading at a time.
2. To record one reading, press the RECORD key until one beep heard. (Note that if the
button is held longer, 2 beeps will sound and the meter will be in continuous mode; see
below). The record number (1 through 25 or FULL) will briefly appear on the LCD.
3. The meter can store up to 25 readings. When the memory is full, FULL will display.
4. To view the readings, press and hold the READ button until two tones are heard. The
second tone is longer and louder than the first.
5. Now use the yellow
and keys to scroll through the recorded readings.
Continuous mode (for use with PC interface only)
1. In continuous mode the meter records one reading after another automatically. Up to
4000 records can be recorded.
2. Press and hold the RECORD until two tones are heard (not available in 3φ3W and 3φ
4W function positions). The meter will begin recording data and the RECORD icon will
appear on the LCD.
3. To exit the Record mode, press and hold the RECORD button until the RECORD
display icon disappears.
4. Readings can only be transferred to a PC with optional Windows® software and
interface cable. Instructions for use are provided with optional software/hardware kit.
Clearing Datalog Data
1. Turn the meter off and hold down the RECORD button while turning the meter on.
2. Release the RECORD key when CLR appears. The datalog memory is now clear.
20
Model 382068 V3.0 4/2005
Connecting the meter to a PC
The Model 382065 includes an attachment that affixes to the bottom of the meter via its
banana jacks. The PC interface cable is hardwired to this attachment. Connect the other
end (DB-9) of the cable to an available PC com port.
Operation
Software Setup
1.
Start Windows® and close all applications.
2.
Insert the supplied program disk in the CD-ROM drive.
3.
The Setup program will run automatically.
Starting the Clamp Meter Software
1.
Click the Windows® START button.
2.
Select PROGRAMS.
3.
Select CLAMPMETER.
4.
Double click the CLAMPMETER icon.
5.
Click on the appropriate COM port when prompted.
6.
The Main Software Screen will appear (see below).
Main Software Screen
1. GRAPH button – Press to view
real-time data in x-y plot format.
2. LIST button – View data in list
format as it’s recorded.
3. TIME SET button – Press to allow
the PC system time to be used by
the meter (reflected in the TIME
window - item 8)
4. MEMORY button – Open Memory
window (see subsequent section).
5. Meter Remote Display
6. Sampling Rate – The rate at which
data is recorded while the meter is
connected to the PC.
7. OPEN FILE button – Open a
previously saved data file.
8. TIME – Shows the time from item
3 above.
9. SAVE AS – Click to open new data
file in which to record.
10. Communication Status – COM1 or
COM2
will
display
when
connection is good. NO COM will
appear if communication is faulty.
2
3
4
1
5
8
6
9
7
10
21
Model 382068 V3.0 4/2005
Memory Window
1. REMAIN – Meter’s available memory.
2. ID Code – User selectable reference number. Type number in the yellow field below
the ID CODE button then press the ID CODE button to confirm.
3. MEMORY – Total meter memory (amount of memory available when no readings are
stored in the logger).
4. REAL TIME CLOCK – Click on this bar to display the PC system clock in the field
below the REAL TIME
1
2
CLOCK button.
5. List of downloaded data sets:
Recording time shows the
date and time of data
6
recording,
FUNC1
and
3
FUNC2
show
the
7
4
measurement types for the
recorded data, and Records
indicates how many readings
are in the set.
6. Download status.
5
7. Sampling
–
Datalogger
Sample rate (rate at which
meter will record readings
remotely). With the meter
connected, click in the yellow field below the SAMPLING button and type in the desired
sampling rate. Click the Sampling button to confirm.
NOTE: This differs from the Sampling rate in the Main Software screen. The Sampling
rate in the Main Software window is the rate that the PC records the measurements
made by the meter while connected to the PC (this is known as data acquisition).
Measuring and recording readings with meter connected to PC
1. With the meter connected to the PC and with the meter and the program running, click
the SAVE AS button on the Main Software window.
2. Type a filename when prompted and click OK.
3. The filename will appear on the Main Software window and the computer will begin
storing the meter readings in real time to the file named in above step.
4. The Main Software window will display the meter readings and the number of records
recorded.
5. To change the rate at which the readings are taken, click on the yellow field below the
SAMPLING button. Type in the desired sample rate when prompted.
6. Click STOP RECORDING button on the Main Software button when desired. The data
will remain in the file named earlier. Open the file at a later time using the OPEN FILE
button on the Main Software window.
Remotely datalog readings with the clamp meter
1. Press and hold the RECORD button on the meter until the audible tone beeps twice.
2. The meter will begin recording at the rate programmed in the MEMORY window (not
the Main Software window).
3. The RECORD display icon will switch on during the recording session.
4. Press and hold the RECORD button until one audible tone beeps to stop recording.
The RECORD display icon will switch off.
22
Model 382068 V3.0 4/2005
Transfer (Download) remotely recorded readings to a PC
1. Connect the meter to the PC, open the software program, and turn the meter on.
2. Open the Memory window by clicking on the MEMORY button in the Main Software
window.
3. All of the sets contained within the clamp meter datalogger will be transferred to the PC
at this time.
4. All of the sets will be listed in the Memory window. In the example Memory window
above, there is one set with 3 records (readings).
5. Double click on a set to open the data file. At that point the data can be printed, saved,
plotted, and viewed using the menu selection in the data window.
Import a stored data file in a spreadsheet
1. Open the spreadsheet program, select OPEN FILE from the FILE menu.
2. From the FILES OF TYPE in the OPEN window, choose ALL FILES from the pull-down
menu.
3. Located and select the desired file.
4. The Text Import Wizard will appear.
5. Click on the FINISH button in the Text Import Window.
23
Model 382068 V3.0 4/2005
Wiring and Protocol
Wiring
In order to ignore hardware handshake, the wiring should be configured as shown in the
diagram below (left). The RTS must be pulled low (-10V to -12V). Note: In QBASIC, add
RS in the OPEN statement. The diagram at right is the DB-9 connector schematic.
5
PIN 2 RX
PIN 3 TX
1
9
PIN 4 DTR
6
PIN 5 GND
PIN 2
RX
PIN 4
DTR
PIN 6 DSR
PIN 3
TX
PIN 6
DSR
PIN 7 RTS
PIN 4
DTR
PIN 7
RTS
PIN 5
GND
PIN 8
CTS
PIN 8 CTS
NOTE: For some computers, a 9-pin (male) to 25-pin (female) adapter is required. The wiring
for such an adapter is shown below:
FG
RXD
TXD
DTR
GND
DSR
RTS
CTS
RI
G
1
2
3
4
5
6
7
8
9
8
3
2
20
7
6
4
5
22
FG
RXD
TXD
DTR
GND
DSR
RTS
CTS
RI
G
Clamp Meter PC Interface activation
No action required. Once connected to a PC, the meter is ready to communicate.
Datalogging activation
To start recording, press the clamp meter’s RECORD button (RECORD appears on the
LCD). To stop recording, press the RECORD button again (RECORD icon switches off).
Default RS-232 Settings
Baud Rate: 9600; Stop bit: 1; Data bits: 8; Parity: None
Communicating with the Clamp Meter
To request data from the Clamp Meter, send a SPACE character to the Clamp meter from
the PC (the ASCII code for the SPACE bar is 20 hex). Having received a character, the
meter will send a 9 byte string. Refer to the following sections.
Decoding the 9 Data Bytes
Each byte of the 9 byte string contains specific information and is used for a specific
purpose. The information contained in the 9 byte string is shown in the following table:
Byte 1 Byte 2
02
Function
Byte 3
Byte 4
Lower LCD
Byte 5
Byte 6
Upper LCD
24
Byte 7
Status1
Byte 8
Status 2
Byte 9
03
Model 382068 V3.0 4/2005
Byte 1
This byte is fixed. If its value is not 02, the interface is compromised or the meter is
defective.
Byte 2
The 7 bits in Byte 2 represent the meter’s selected mode of operation (its function).
Bit 7
X
Bit 6
Volts
Bit 5
Amps
Bit 4
Bit 3
Bit 2
Kilowatt 3 phase / 3 wire 3 phase / 4 wire
Bit 1
Resistance
Bit 0
Diode
Bytes 3, 4, 5, and 6
Bytes 3 & 4 represent the lower LCD display reading in hex. Bytes 5 & 6 represent the
meter’s upper LCD reading in hex (for an ‘E0’ ‘DE’ value for bytes 3 through 6 the meter is
in OVERLOAD condition, meaning that the measurement it is taking is out of range).
Byte 7
Byte 7 is the ‘Status 1’ byte representing the state of the LCD display indicators.
Bit 7
Bt (low battery)
Bit 6
Minus sign for
lower LCD display
Bit 5
Record
Bit 4
Max
Bit 3
Min
Bit 2
Hold
Bit 1
00
01
10
Bit 0
PF/KW
V/A
PF/KVA
Byte 8
Byte 8 is the ‘Status 2’ byte representing the state of the LCD display indicators.
Bit 7
n/a
Bit 6
P-
Bit 5
Bit 4
P+ Minus sign
for upper
LCD
display
Bit 3
Upper decimal
(refer to bit 2
for selection)
Bit 2
00 = 100
01 = 10-1
10 = 10-2
11 = 10-3
Bit 1
Upper decimal
(refer to bit 0
for selection)
Bit 0
00 = 100
01 = 10-1
10 = 10-2
11 = 10-3
Byte 9
End byte is fixed (03).
Commands
"D" + Year + Month + Date + Hour + Minute + Second
(1 Byte + 1 Byte + 1 Byte + 1 Byte + 1 Byte + 1 Byte + 1 Byte)
Function: Programs the meter’s clock
"Y" (1 Byte)
Function: Load the number of Recorded Sets + Last Address + Sampling + ID Code
(1 Byte + 2 Bytes + 1 Byte + 1 Byte)
"U" (1 Byte)
Function: Download Recorded Data
00 55 AA 00 + First Recorded Set + 00 55 AA 00 + Second Recorded Set +...
Each set contains: Time + Function + Down LCD + Up LCD + Status1 + Status2 +...
(6 Bytes + 1 Byte + 1 Byte + 2 Byte + 1 Byte + 1 Byte + 1 Byte)
25
Model 382068 V3.0 4/2005
Maintenance
Battery Replacement
Warning: To prevent electrical hazard or shock, turn off the clamp meter
and disconnect the test leads before removing the back cover.
When the 9V battery expires, the LCD will display the battery icon. To replace the battery:
1. Set the Range switch to the OFF position.
2. Remove the meter's three rear screws and carefully open the meter housing.
3. Replace the 9V battery and re-assemble the meter housing.
Cleaning
Periodically wipe the case with a dry cloth; do not use abrasives or solvents.
Warranty
EXTECH INSTRUMENTS CORPORATION warrants this instrument to be free of defects
in parts and workmanship for one year from date of shipment (a six month limited warranty
applies to sensors and cables). If it should become necessary to return the instrument for
service during or beyond the warranty period, contact the Customer Service Department at
(781) 890-7440 ext. 210 for authorization or visit our website www.extech.com for contact
information. A Return Authorization (RA) number must be issued before any product is
returned to Extech. The sender is responsible for shipping charges, freight, insurance and
proper packaging to prevent damage in transit. This warranty does not apply to defects
resulting from action of the user such as misuse, improper wiring, operation outside of
specification, improper maintenance or repair, or unauthorized modification. Extech
specifically disclaims any implied warranties or merchantability or fitness for a specific
purpose and will not be liable for any direct, indirect, incidental or consequential damages.
Extech's total liability is limited to repair or replacement of the product. The warranty set
forth above is inclusive and no other warranty, whether written or oral, is expressed or
implied.
Calibration and Repair Services
Extech offers repair and calibration services for the products we sell. Extech also
provides NIST certification for most products. Call the Customer Service Department for
information on calibration services available for this product. Extech recommends that
annual calibrations be performed to verify meter performance and accuracy.
Support line (781) 890-7440
Technical support: Extension 200; E-mail: [email protected]
Repair & Returns: Extension 210; E-mail: [email protected]
Product specifications subject to change without notice
For the latest version of this User’s Guide, Software updates, and other
up-to-the-minute product information, visit our website: www.extech.com
Extech Instruments Corporation, 285 Bear Hill Rd., Waltham, MA 02451
Copyright © 2005 Extech Instruments Corporation
All rights reserved including the right of reproduction in whole or in part in any form.
26
Model 382068 V3.0 4/2005