1
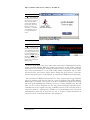
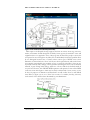
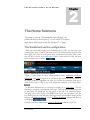
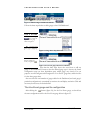
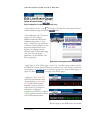
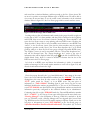
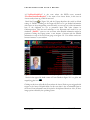
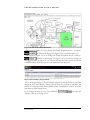
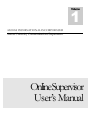
1
Volume
AXCESS INTERNATIONAL INCORPORATED
Axcess University Communications Department
OnlineSupervisor
User’s Manual
AXCESS UNIVERSITY COMMUNICATIONS DEPARTMENT
Online Supervisor User’s Manual
© Axcess International Incorporated
3208 Commander Drive
Corporate U.S. Phone 800.588.6080 • Fax 972.407.9085
http://www.axcessinc.com
Table of Contents
INTRODU CTION
Introduction
CAPTER
CHAPTE R
1
1
4
The Video Submenu
16
Camera List page
16
Download Viewers page
16
Logging onto OnlineSupervisor
2
Logging Error
3
CHAPTE R
Initial Dashboard
3
The Map Submenu
17
Axcess Hospital Facility
4
View Site Map page
17
Zones and Axcess Hardware
4
Locate Person page
18
Locate Asset page
18
CHAPTE R
5
2
The Home Submenu
5
CHAPTE R
The Dashboard and its Configuration
5
The Reports Submenu
19
Live-Event Gauge
6
Activity Reports page
19
Alert Reports page
21
Movement Reports page
21
Management reports page
22
CHAPTE R
3
6
The Activity Submenu
13
Device-Event Page
13
Alerts Page
14
MY
Notifications Page
15
Intentionally Left Blank
23
Audits Page
15
Live Events Page
15
Index
24
NOTE S
O N L I N E S U P E R V I S O R
U S E R ’ S
M A N U A L
Introduction
Introduction
H
ere you, the reader, are considered to be a User. Viewing the figure below,
observe how the User fits into the OnlineSupervisor distributed system
through a browser environment. The User may view incoming RFID event
data in real time, known as Live-Event. The RFID event data is also stored
in databases. The stored data and the browser environment allow a User to manipulate
RFID event data into desired or required forms. However, the OnlineSupervisor
features a User is allowed to participate in is determined by the permissions granted by
the User’s (your) administrator.
R F I D
D A T A
E V E N T
T O
T H E
U S E R
n An ActiveTag,TM
Activator, and Network
Reader/Receiver each have a
unique identification number (ID).
These three pieces can share their
IDs over radio frequencies
(RFID).If this special sharing
happens, an event is said to have
occurred.
o The ActiveTagTM
Network Reader/Receiver
packages the three IDs into RFID
event data. The receiver then puts
the data on a network where it
reaches a special router known as a
Data Collection Format Router or
DCFR.
Figure 0: Online Supervisor as a Distributed System
p After some database
work, the AXSI LogServer routes
conditioned data .to the
OLSLogger where it can be
displayed in the browser to you, the
USER.
©AXCESS INTERNATIONAL, Inc
750.015.001 R00
1
5/4/2007
O N L I N E S U P E R V I S O R
U S E R ’ S
M A N U A L
1
Chapter
Logging onto and out of
OnlineSupervisor
OnlineSupervisor is used exclusively in a browser environment,
and so usual browser navigation rules apply.
I
t is assumed that the you, the User, have entered a proper IP address into the
browser so that the OnlineSupervisor login page is presented as in figure 1.1. If
there are any questions with respect to the browser environment, or with a
proper IP address, please refer to your administrator before proceeding.
Logging onto OnlineSupervisor
L O G I N
S T E P S
n Notice the three
white text boxes to the right of
the “User Login” label in
Figure 1.1 The boxes that
need the user’s input are:
If there are any questions
about these input parameters,
refer to your administrator.
Figure1.1: OnlineSupervisor’s Login Page
o Enter your login
information and click on the
LOGIN button. Note that
your password will not be
exposed.
Figure 1.2 User Login Information and LOGIN button
©AXCESS INTERNATIONAL, Inc
750.015.001 R00
2
5/4/2007
O N L I N E S U P E R V I S O R
L O G I N
U S E R ’ S
M A N U A L
E R R O R
n After “clicking the
LOGIN button, if there is an
error message as in Figure 1.3,
click on the “OK” button.
This action should bring up
the Login Page (Figure 1.1)
Re-enter your User Login
information, or check with
your administrator that your
User Login information is
correct.
Figure 1.3 Login Failure message
O L S
L O G O U T
n If your User Login
information was valid, you will
see the OnlineSupervisor Home
page through your browser. To
Logout of OnlineSupervisor,
click on the “Logout” text in the
Submenu of OnlineSupervisor’s
Home Page. Once you have
logged out you should see the
OLS Login page
Figure 1.4 Home Page Submenu Logout
In order to demonstrate some of the functionality and features of OnlineSupervisor (OLS),
and its associated AXCESS RFID tags, readers, and activators, we will assume a fictitious
facility known as Axcess Hospital. Although this facility is fictional, it incorporates and exhibits
many of the characteristics of a “real world” facility. Facility characteristics such as current
personnel location, asset location, and the facility’s sitemap may be of interest to a customer.
Another customer may have a totally different set of priorities for RFID events at their facility.
Two constraints in an RFID environment are, if an object of interest may be tagged and what
type of tag should be used. Note that there are a variety AXCESS tags that produce different
RFID events. For example, some tags may send data on temperature or ammonia level along
with their tag ID. OnlineSupervisor will keep a history of a variety of RFID events. This will
allow you the USER to manipulate the data and generate meaningful exportable reports.
OnlineSupervisor is also capable of showing you RFID events that occur in real time. Some of
these events will be of a “higher priority”, and allow you to take immediate action. Note that in
OnlineSupervisor there may be more than one way to navigate to desired information or
solution. Let’s look at our facility and make some assumptions.
©AXCESS INTERNATIONAL, Inc
750.015.001 R00
3
5/4/2007
O N L I N E S U P E R V I S O R
U S E R ’ S
M A N U A L
Figure 1.5 The Fictional AXCESS Hospital Facility.
With respect to the Hospital site map, suppose that there are various Axcess tags, activators,
readers, and cameras located throughout the facility. Some tags may be attached to assets and
equipment that is not supposed to move. Other tags may be attached to people or assets that
are expected to move throughout the facility. We are immediately faced with a problem. How
do we distinguish between areas of interest where various types of RFID events occur?
Distinction is achieved with the “Zone”. The Zone is both a physical entity and an idea. Zones
are somewhat constrained by the proximity of tags to activators and readers. Zones are not
necessarily bound by walls, ceilings, or floors, because electromagnetic waves can be absorbed,
reflected, or pass through walls, ceilings, and floors. A Zone could also be defined outside in
an open area. However, with AXCESS’ RFID experience and expertise, Zones and the RFID
events that occur with respect to them may be closely correlated with a room, rooms, or area.
So here, for purposes of illustration and introduction we will confine Zones to well-defined
areas. Below, in figure 1.6, we see a “Zone” that consists of a corridor (the idea), activators,
and a camera. Zones will have been determined by your administrator.
Figure 1.6 Example of a Zone.
©AXCESS INTERNATIONAL, Inc
750.015.001 R00
4
5/4/2007
O N L I N E S U P E R V I S O R ’ S
U S E R
M A N U A L
2
Chapter
The Home Submenu
The coining of the term “The Information Super Highway” also
yielded some words to describe parts of a User’s browser. This context
might help us better interpret terms like “dashboard” or “gauges”.
The Dashboard and its configuration
When first successfully logging onto OnlineSupervisor (OLS), you may have seen
something like figure 2.1 below. The Home menu is the initial menu that appears when
first logging into OLS. Note the green down arrowhead that indicates which menu
item you are at in OLS. If we were at the “Activity” menu section of OLS, the green
arrow would be next to Activity.
Figure 2.1 Initial Dashboard of the Home Submenu
Figure 2.1 also shows the three Home submenu items, Dashboard, Configure
Dashboard, and Logout. Logout we’ve seen before. We see the Dashboard section of
the Home submenu is highlighted in white. So to refine the statements made above,
when we first login to OLS we are at the Dashboard submenu of the Home menu.
At this initial dashboard we see a message requesting us to “Click Here…”.We are
preparing to configure our dashboard with gauges. There are nine different gauges that
we may add to the dashboard. The first gauge we will add is the Live-Event gauge.
This gauge allows the USER to view RFID events in real time. In order to view the
Live-Event gauge, the AXCESS Inc. OLS Logger needs to be installed. Clicking on the
message with respect to figure 2.1 or the Configure Dashboard submenu will allow us
to add gauges.
Click the “Add New” button in the Configure Dashboard submenu, Figure 2.2.
©AXCESS INTERNATIONAL, Inc
750.015.001 R00
5
5/4/2007
O N L I N E S U P E R V I S O R
U S E R ’ S
M A N U A L
Figure 2.2 Initial Configure Dashboard submenu
Follow the three steps below to add a gauge to the OLS Dashboard.
A D D
A
G A U G E
n
After clicking the
button, observe the
dropdown box of gauge
selections in figure 2.3.
o
Choose the “LiveEvent” gauge by highlighting
it.
Figure 2.3 Gauge choice drop-down box
p
Click the “Next”
button to confirm your
choice, as in figure 2.4
Figure 2.4 Live-Event gauge about to be confirmed.
Note that the three steps above also reveal how to add any
gauge to the Dashboard. However, after the desired gauge type is chosen, the future
configuration steps are then dependent upon which gauge was chosen. For our
purposes we will configure and investigate the “Live-Event” gauge first, and do the like
for the other gauges later.
Also note that the total number of gauges added to the Dashboard, and each gauge’s
particular configuration is constrained by monitor size and display resolution. Trial and
error may be necessary for desired effect.
The Live-Event gauge and its configuration
After clicking the
button (figure 2.4), for the Live-Event gauge, we should see
the next configuration task for the Live-Event gauge below in figure 2.5.
©AXCESS INTERNATIONAL, Inc
750.015.001 R00
6
5/4/2007
O N L I N E S U P E R V I S O R
U S E R ’ S
M A N U A L
Figure 2.5 Edit box at “0”in the Edit Live-Event Gauge
In the edit box we see a zero.
The range of the edit box is 0 through 20. Enter a
number within the range and click the
button.
After clicking the “Save” button, as
in figure 2.5, the Configure
Dashboard submenu should now
exhibit the gauge name of “LiveEvent”. Note, if we now clicked the
“Add New” button, in figure 2.6, the
drop-down menu that we saw in
figure 2.3 would appear and we
would be ready to add another gauge.
Also, if you have the proper
permission, you may edit the “LiveEvent” gauge here.
Figure 2.6 Live-Event gauge created.
Recall figure 0. The OLS Logger on the User ‘s machine must connect with the
DCFR service and the LogServer Service, in order to view “Live-Events”, and access
the database. Let us look at the “Live-Event” gauge we’ve created. With respect to
figure 2.6, click on
to view the “Live-Event” gauge.
In figure 2.7, the Current Time
will be the local machine’s time.
The red flashing LogServer and
DCFR indicate that the client
machine is trying to connect to
Figure 2.7 Live-Events initially connecting
these services. A connection is
indicated by a solid green
LogServer and DCFR, as in figure
2.8. As a general rule, items colored
red in OLS require attention.
Figure 2.8 Client connected to distributed services
Recall in figure 0 that RFID events are entered
©AXCESS INTERNATIONAL, Inc
750.015.001 R00
7
5/4/2007
O N L I N E S U P E R V I S O R
U S E R ’ S
M A N U A L
and stored into a relational database, and then posted to the Live -Event viewer. We
are now in a position to investigate different types of RFID events. We will be able to
view events in near real time, or use the stored events’ information via the relational
database. Below in figure 2.9 is the Live-Event gauge with its controls and two events.
Figure 2.9 Live-Event Gauge, with two RFID events.
Looking at the top line of information and controls in the gauge from left to right, we
see the time of the User’s client machine, and that OLS is connected to the LogServer
and DCFR. Next we see Live-Event’s controls. Checking the “Pause checkbox” will
cause the Live-Event screen to stop updating with new RFID events. Checking the
“Beep checkbox” allows OLS to issue an audible sound whenever a new RFID event
“arrives” to the Live-Event viewer (Note that the client machine must be properly
equipped to produce sound). Next is the “Event filter dropdown box” at its default
position, which is to allow the Live-Event gauge to display all possible RFID events.
The “Display” button is used in accordance with the “Event filter dropdown box”,
and will be discussed later. The “Popup dropdown box” refers to the type of
information that will be displayed when the popup , to the left of an RFID event, is
double clicked. Lastly, there is a control to increase or decrease the font size of the
RFID events in the Live-Event gauge.
Let’s look at an RFID event and dissect the information it yields. As mentioned
earlier, red messages in OLS usually require attention so we’ll look at figure 2.10, and
discuss the information from left to right
Figure 2.10 Information in a RFID event
First is the popup. Second is the “yyyy/mm/dd hh:mm:ss” time stamp of the event.
Next is the event’s individual identification number, here it’s “10991364”. This number
distinguishes this event from all other events in the database. Also, notice that the
“EVT:” prefix stands for “Event”, as in an RFID event. The next piece of
information is, “TAG: 12300116”. Recalling figure 0, each Axcess Tag has its own
individual identification number programmed into it. The rest of the information in
event EVT: 10991364 were derived from the tag identification number associated with
information previously configured in the relational database by an administrator.
Continuing from left to right, “PID:0014”stands for “Personal IDentification number
0014”. “-PANIC-”, is the event type. Event types will be discussed in more detail soon.
“Nursing Manager” is the description of what tag 12300116 is attached to. In this
case, tag 12300116 is with a Nursing Manager who has triggered their Axcess Panic
Tag. Recall that red in OLS Live-Event usually requires a response. Finally, we see the
last piece of information of event “EVT:10991364” in the Live-Event gauge as,
“@1stFloorNorthEast FirstFloorNorthEastReader5”. The symbol “@” is read as
©AXCESS INTERNATIONAL, Inc
750.015.001 R00
8
5/4/2007
O N L I N E S U P E R V I S O R
U S E R ’ S
M A N U A L
“at”.“1stFloorNorthEast” is the zone where the RFID event occurred.
“FirstFloorNorthEastReader5” is the name of an Axcess device, in this case an
Axcess reader, where tag 12300116 was read.
Recall the Popup
of figure 2.10 and the Popup dropdown box with its default
setting of “Details”. Clicking on the Popup will allow us to get detailed information
with respect to the corresponding event. Secondly, we can copy any of the information
here to the clipboard for use as parameter input with other features in
Onlinesupervisor. This idea and technique is very important and useful. For our
simulated “-PANIC-” event we can see where more detailed information might be
pertinent. Clicking the Popup creates a new instance a browser with the detailed
information on top of the Live-Event gauge as in figure 2.11. You will also notice two
browser instances on your taskbar.
Figure 2.11 Event Details is where information may be copied to the clipboard.
Notice in the upper left hand corner of Event Details in figure 2.11 is a globe and
magnifying glass icon.
Clicking on this icon will yield the Zone where the Axcess Panic tag was triggered with
respect to the Axcess Hospital facility. In this case there is also an animated figure in
the Zone. Event information may be copied to the clipboard from here. Also, we have
image options offered by the operating system
©AXCESS INTERNATIONAL, Inc
750.015.001 R00
9
5/4/2007
O N L I N E S U P E R V I S O R
U S E R ’ S
M A N U A L
Figure 2.12 Zone location detail information.
With regard to figure 2.9, if we change the Popup dropdown box to “Location”,
and click on the Popup as in figure 2.10 we would see figure 2.12
With regard to figure 2.9, if we change the Popup dropdown box to “History”,
and click on the Popup as in figure 2.10 we would see a history of
the triggered panic tag, figure 2.13, as it moves through the facility and is read by the
AXCESS readers. We could copy the event numbers to the clipboard.
Figure 2.13 Event history of tag 12300116
..We’ve investigated most of the information in figure 2.9 except for the “Event filter
dropdown box” and “Display” button. We are now in a position to introduce and
classify all of the 16 current Axcess’ RFID events. Combinations of these 16 events
may make up other named events.
If we change the drop box to “User Defined”,
“Display” button, we see figure 2.14.
©AXCESS INTERNATIONAL, Inc
750.015.001 R00
10
and click the
5/4/2007
O N L I N E S U P E R V I S O R
U S E R ’ S
M A N U A L
We see “Alert Event” and
“Normal Event” as the two
broad categories of events.
Checking the check boxes of
the events of interest and
clicking the “OK” button will
allow OLS to display only the
desired events in the Live-Event
viewer. Changing the filter drop
box to
will
cause the Live-Event viewer to
display only alert events.
This completes the Live-Event
gauge.
Figure 2.14The RFID Event Types
Let’s add a zone oriented gauge to the dashboard.
Click
and click the “Add New”
button. Choose “Current Staff” from the drop down box, as was done in figure
2.3, and click the “Next” button. Pick the staff in the zone of interest by clicking the
blue left arrow
to assign the zone as in figure 2.15. Click the “save” button to finish
the adding a current staff gauge to the dashboard.
While we are in the configure
dashboard submenu, let’s add a
“Camera View” gauge to the
dashboard. Click the “Add New”
button, open the gauge choice
dropdown box, select “Camera
View”, and click the “Next”
Figure2.15 Staff zone assignment
button. (If your facility has
camera devices you may see them
in the Zones as per figure 1.6.)
Select the desired camera from
the dropdown box, and click the
“save” button.
©AXCESS INTERNATIONAL, Inc
750.015.001 R00
11
5/4/2007
O N L I N E S U P E R V I S O R
U S E R ’ S
M A N U A L
The Configure Dashboard
submenu should look something
like figure 2.16. Clicking on the blue
arrows will manipulate the gauge’s
positions with respect to one
another when the gauges are
viewed in the Dashboard. Figure
2.17 exhibits the three gauges
added to the dashboard. Note the
Popups to the left of the gauges.
Figure 2.16 Three gauges added and configured.
Figure 2.17 Dashboard with three gauges
Above we see the Live-Event gauge, the Current Staff in zone OB-GYN 150 gauge, and an
OB corridor Camera View gauge in the Dashboard of Onlinesupervisor.
We’ve seen how people, assets, and devices may be tagged. We’ve also seen how other data
may be associated with people, assets, and tags through the database a priori to an RFID event.
We know that each RFID event has its own “EVT” event number and timestamp. The rest of
this manual exhibits OLS’ manipulation of RFID events and the data associated with them.
©AXCESS INTERNATIONAL, Inc
750.015.001 R00
12
5/4/2007
O N L I N E S U P E R V I S O R
U S E R ’ S
M A N U A L
3
Chapter
The Activity Submenu
Features in the Activity submenu combine RFID events in the
database into useful information. An Activity may also be defined with
the inclusion of some soft logic. Browser rules for navigation still apply.
Figure 3.1 is the “Activity Submenu”. Device-Events’ is the initial page opened, after
having clicked the
“Activity” tab. We’ve seen Live-Events before.
Figure 3.1 Activity submenu
The Device-Event page
In figure 3.2 we may fill in
various fields and click the
search
button, or click
the search button to get the
device events that occurred
from 12:00 a.m. of the current
day to the present time. See
figure 3.3.
Figure 3.2 Device-Event search box
Figure 3.3 Device Event Log
In figure 3.3, next to the map popup, are icons.
The icons stand for an asset
event, a person event, and a device event respectively. Clicking on the event number
“11104123”, in figure 3.3 for example, yields more in depth information.
©AXCESS INTERNATIONAL, Inc
750.015.001 R00
13
5/4/2007
O N L I N E S U P E R V I S O R
U S E R ’ S
M A N U A L
Figure 3.4 Event Details for event 11104123
Figure 3.4 shows more information for event number 11104123. Note that the zone,
location, tag number, description, and picture of the asset “Temp Monitor 1” were
configured and associated in the database by your administrator. For whatever reason,
tag 12300133 was read by an Axcess reader, and the event number and time stamp
were associated with the tag of the temperature monitor. All of the information above
was then combined in the database as a record.
The Alerts page
Alerts events occur via
soft logic rules designed by
your administrator. These
rule based events are not to
be confused by the alert
events of figure 2.14. Enter
the event number and click
search, or just click search.
Figure 3.5 Alerts search box
©AXCESS INTERNATIONAL, Inc
750.015.001 R00
14
5/4/2007
O N L I N E S U P E R V I S O R
U S E R ’ S
M A N U A L
The Notifications page
Notification events occur when Onlinesupervisor e-mails recipients about other
The soft logic rules governing OnlineSupervisor’s’
events that have occurred.
notification policy were designed by your administrator. Clicking the Notification
Search box search button
will yield something similar to figure 3.6. Clicking the
event number will yield detail information as in figure 3.4
Figure 3.6 Notification event information
The Audits page
Audit events occur when an Axcess tag is read, but no associated information about
the tag is currently in the database. It could actually be that a tag has not been enrolled,
or that an intruder has simulated a tag with their hardware. Clicking the search button
on the “Audit Search” box will give a complete list of audit events as seen in figure 3.7.
An audit event posting has the icon.
Figure 3.7 Complete Audit list.
First note the bottom of figure 3.7. There are many pages of audits since we clicked the
search button without entering any parameters in the “Audit Search” box. Figure 3.7
represents a complete historical list of audit events. We could click on an event
number, but if there is no information associated with the tag, no detailed information
will be available to display. In figure 2.9, we see an example of the violet colored audit
event in the Live-Event gauge.
The Live Events page
This is the same as the Live-Event gauge we have seen before, except that thirty
consecutive events may be viewed at one time.
©AXCESS INTERNATIONAL, Inc
750.015.001 R00
15
5/4/2007
O N L I N E S U P E R V I S O R
U S E R ’ S
M A N U A L
4
Chapter
The Video Submenu
If your facility is equipped with cameras, the “Video Submenu” is one place where
live camera views or archived video may be observed. Axcess video software may need
to be installed.
The Camera List page
After clicking the video tab, the “Camera List” page is the default page.
After clicking a camera in the
“Select a Camera” list, that
camera’s view with live video
will appear to the right of the
list.
Figure 4.1 Camera List
The Download Viewers page
Figure 4.2 Download Video Viewers
Check with your administrator before downloading any software!
©AXCESS INTERNATIONAL, Inc
750.015.001 R00
16
5/4/2007
O N L I N E S U P E R V I S O R
U S E R ’ S
M A N U A L
5
Chapter
The Map Submenu
Here we may look at maps of Zones, and locate people and assets with respect to the
Zones that have been designated within a facilities’ site map.
We see the map submenu in figure 5.1 below.
Figure 5.1 Map Submenu
Here we will use the historic stored data with respect to a zone, person, or asset and
with respect to facility’s site map. The “View Site Map” is the default page.
The View Site Map page
The initial View Site Map
page will produce a list of
zones as in figure 5.2. Click
on the zone to get the
associated zone with respect
to the site map. In this in
example the first floor
cafeteria was clicked to
produce figure 5.3. In the
“Cafeteria Zone” we can also
see Axcess devices.
Figure 5.2 Site Map list
Figure 5.3 1st Floor Cafeteria Zone
©AXCESS INTERNATIONAL, Inc
750.015.001 R00
17
5/4/2007
O N L I N E S U P E R V I S O R
U S E R ’ S
M A N U A L
The Locate Person page
When first entering the Locate Person page, we see a locate person list as in figure 5.4.
Next to a person’s name is the familiar location popup.
which is the movement history popup.
12300105.
Next we see a new popup
Here we’ll click on the history popup of tag
Figure 5.4 Locate Person list
After clicking the history popup
in figure 5.4, by looking at the
blue one “1” in figure 5.5, we can
see that the owner of the tag
12300105 first walked up to Suite
150. If we clicked on the “1”, we
would get the event log details
that we have seen similar to figure
3.4.The “2” and the “3” represent
tag reads that occurred in Suite
150. The historical tag read “4”
event shows tag 12300105
probably left Suite 150.
If were at the Locate Asset page,
we would get a list of assets
similar to figure 5.4. We could
then investigate the asset’s
location,
or the asset’s
location history.
Figure 5.5 Person Location Histories
©AXCESS INTERNATIONAL, Inc
750.015.001 R00
18
5/4/2007
O N L I N E S U P E R V I S O R
U S E R ’ S
M A N U A L
6
Chapter
The Reports Submenu
The reports submenu is shown in figure 6.1. Activity Reports is the default page.
Figure 6.1 Reports Submenu
All reports are generated in a similar manner. Every report needs a start date of interest
and an end date of interest. The span of time that the report covers may be further
refined by adding desired times to the time fields in the edit boxes. If a required field is
not properly filled in, the edit box will change color.
The Activity Reports page
We are somewhat familiar with activities from chapter 2. The Activity Reports allows
for three different types of activity reports as seen in figure 6.2.
Figure 6.2 Available Activity Reports
What distinguishes the reports is a parameter of interest. For Activity Reports, the
different parameters of interest are tag id, zone id, or zone. To illustrate report
generation we’ll click on Activity By Zone ID.
After clicking Activity By Zone ID, we would see figure 6.3 below.
©AXCESS INTERNATIONAL, Inc
750.015.001 R00
19
5/4/2007
O N L I N E S U P E R V I S O R
U S E R ’ S
M A N U A L
Figure 6.3 Zone Activity Report
Choose the desired zone via the drop down box, enter the dates or dates and times,
and click the “OK” button to generate the report.
Figure 6.4 Generated Activity Report for Zone ID OB-GYN 150
In figure 6.4, at the top of the report frame, we see controls to print the report, export
the report as an rpt file, and search the report. These report controls will be available
for all reports generated. Note that all reports will be generated similarly.
©AXCESS INTERNATIONAL, Inc
750.015.001 R00
20
5/4/2007
O N L I N E S U P E R V I S O R ’ S
U S E R
M A N U A L
The Alert Reports page
Figure 6.5 shows the Alert Reports page. Click on one of the five different types of
reports, complete the information in the edit boxes, and click the “OK” button to
generate the desired report as was done in figure 6.4.
Figure 6.5 Available Alert Reports
The Movement Reports page
Figure 6.6 shows the Movement Reports page. Click on asset or person movement
history. Choose the desired person or asset from the dropdown box, enter the desired
time parameters, and click the “OK” button to generate a report.
Figure 6.6 Available Movement Reports
©AXCESS INTERNATIONAL, Inc
750.015.001 R00
21
5/4/2007
O N L I N E S U P E R V I S O R
U S E R ’ S
M A N U A L
The Management Reports page
Figure 6.7 shows the Management Reports page. Click on Assets by Type, or Staff by
Type to instantly generate a report. No parameter input is needed for these reports.
Figure 6.7 Available Management Reports
Clicking on Assets by Type, we see a report generated of the tagged assets at Axcess
Hospital in figure 6.8. The report may be printed or exported.
Figure 6.8 Assets by Type Report
©AXCESS INTERNATIONAL, Inc
750.015.001 R00
22
5/4/2007
O N L I N E S U P E R V I S O R
©AXCESS INTERNATIONAL, Inc
750.015.001 R00
U S E R ’ S
M A N U A L
23
My Notes
5/4/2007
Index
A
H
P
@ Symbol, 9
Home submenu, 3
Panic event, 11
Activator, 1
History person, 18
Personal ID, 9
Activity report, 19
Person Lost, 11
Audit, 5
I
J
K
L
Audit event, 11
Live event, 6
B
Linkage alarm, 11
S
Locate person pg,
Site map, 17
Activity menu, 13
Alert Event, 11
Alert page, 14
Alert report, 20
Asset event, 11
Asset lost, 11
Battery low, 11
Popup, 8
R
Reader, 1
Reader fail, 11
Receiver, 1
RFID, 1
19
C
Login, 2
T
Login failed, 3
Tag, 1
Camera list, 16
Logout, 3
Tamper event, 11
Camera view, 11
Login page, 2
Temperature evt,
Clipboard, 9
LogServer, 1
Current time, 7
D
M
Time stamp, 8
Management rpt,
Dashboard, 3
22
Database, 1
Map submenu, 17
Detailed inf., 9
Movement report,
Device event, 13
Door event, 11
E
Event, 1
21
F
U
V
Video submenu,
16
N
Viewers, 16
Normal event, 11
View sitemap, 17
Notification page,
Z
Event details, 9
EVT, 8
11
Time, 7
15
O
Zone, 4
OLS, 3
Filter box, 8
OLSLogger, 5
G
OLSRule, 6
Gauge, 3
©AXCESS INTERNATIONAL, Inc
750.015.001 R00
24
5/4/2007
©AXCESS INTERNATIONAL, Inc
750.015.001 R00
25
5/4/2007