1
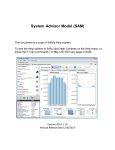
7th Annual North American Passive House Conference September 27-30, 2012 Denver CO Photovoltaics (PV) Otto Van Geet, PE Principal Engineer National Renewable Energy Laboratory (NREL) 7th Annual North American Passive House Conference September 27-30, 2012 Denver CO Session Learning Objectives: 1. Understand PV system options and benefits, 2. Understand what conditions are needed to minimize installation costs and maximize electricity production, 3. Be able to use a sizing tools for estimating system size, costs, and energy production, 4. Understand what PV Ready design means 5. Be able to integrate PV Ready design principles in their PHIUScertified buildings. Van Geet Home 3 Van Geet Home http://www.nrel.gov/docs/fy04osti/32765.pdf 9300 ft 9600 HDD 0 CDD 3000 sqft. Off grid high mass passive solar Average ANNUAL total energy = 150 gal propane ½ cord firewood 1.2 kW PV ASHRAE 2001 1st Place Technology Award winner 4 Simple Direct Drive PV System 5 AC PV System with Inverter 6 PV Technology Overview Direct conversion of sunlight into DC electricity DC converted to AC by inverter Solid-state electronics, nomoving parts High reliability, warranties of 20 years or more PV modules are wired in series and parallel to meet voltage and current requirements 7 Photovoltaic Cell Structure Cover (e.g.,glass) Transparent adhesive Antireflection coating Front contact Current Back contact and cover n-type semiconductor p-type semiconductor Power out (W) x 100% Solar cell efficiency (%) = ——————————— Area (m2) x 1000 W/m2 10% efficiency = 100 W/m2 or about 10 W/ft2 PANEL area 8 PV Cells PV Cells are wired in series to increase voltage... and in parallel to increase current 9 PV is Modular Cells are assembled into Modules... and modules into arrays. 10 Solar PV Photovoltaics Types Single Crystal * Multi-Crystal * Thin Film * Cadmium Telluride * CIGS Efficiencies: 14 to 23% 13 to 17% 6 to 11% 10% to 11% 12% to 14% 11 Building-Integrated Photovoltaics Glazing Glazing Standing Seam Shingles Single-Ply 13 Photovoltaics System (grid connected) 14 Total Area Required for PV Varies by technology, tilt, and location Roof mount - sloped roof, flush-mounted power densities of 11 DCwatt (W)/square foot (ft2) crystalline Flat roof, slope panel = 8 DC-W/ft2 Ground mount: System Type Fixed Tilt Energy Density (DC-W/ft2) Single Axis Tracking Energy Density (DC-W/ft2) Crystalline Silicon 4 3.3 Thin Film 3.3 2.7 Hybrid High Efficiency 4.8 3.9 15 PV Cells “I-V Curve” Short Circuit Current Current (Amps) Maximum Power Point Open Circuit Voltage Voltage (Volts) Optimal voltage changes with sunlight and temperature 16 IV Curve: Voltage and Temperature Voltage (Volts) of each cell depends on the material’s band gap (eV), Goes down slightly with increasing temperature Allow for airflow around PV 17 PV Module Nameplate Rating “Rated Power” is the output of a PV module under standard reference conditions 1 kW/m2 sunlight, 25 C ambient temperature 1 m/s wind speed. ASTM E1036-96, Standard Test Method for Electrical Performance of Nonconcentrator Terrestrial Photovoltaic Modules and Arrays Using Reference Cells 18 PV Module Nameplate Example 19 “Balance of System” Efficiency 60-82% Module Efficiency 6-20% Diodes and Connections 99-99.7% Soiling 30-99.5% I and V Mismatch 97-99.7% Transformer 97-99% Inverter 88-98% AC Wiring 98-99.3% DC Wiring 97-99% 20 Module Price ($/Watt) Price of PV Modules 35 30 25 20 15 10 $1.00 5 0 1970 1975 1980 1985 1990 1995 2000 2005 2010 2015 Year Source: EIA 2005 data 21 Price of PV Systems Source: EIA 2005 data 22 Costs: Use PERFORMANCE SPECS (kWh/year) not specific manufacture or kW. Provide clear requirements and evaluation criteria Costs depend on: • Size – bigger is better: • Balance of system costs including structures, inverters, electrical and interconnection. Lowest cost is direct roof attachment such as standing seam metal roof – Installed approx. $4/Wdc for 100kW Ballasted or racks – add $0.3/W Ground mount fixed tilt – add $0.35/W Single axis tracking (over 300 kW) – add $0.7/W Carports – add $0.6/W (careful w/ snow and ice) High efficiency modules (GT 17%) add $0.5/W 23 Priorities: Where to Install Solar 1. On the “Built Environment” where unshaded – size to capacity (pipes & wires) and load (kWh & thermal) a. On existing building roofs that have an expected life of at least 15 more years and can accept added load. Reduces solar load on building. NEPA categorical exclusion. b. On ALL new buildings – all new building should be “solar ready”, see http://www.nrel.gov/docs/fy10osti/46078.pdf c. Over parking areas, pedestrian paths, etc. – energy generation and nice amenity. 2. On compromised lands such as landfills & brownfields. a. Saves green fields for nature. 3. IF installed on green fields minimize site disturbance, plant native low height vegetation as needed. 24 Roof Characteristics Ideal – Install PV on new roof, require 25 year roof warranty W/ PV installed (PV comes with 25 year warranty). Acceptable – Install PV on roof with at least a 15 year expected life. Roof MUST be able to accept added weight and wind load of PV – Typically 2 lbs/square ft. Do not install PV on lightweight roofs such as mobile homes or on roofs in poor condition. 25 General Solar Guidelines Avoid shading from trees, buildings, etc. (especially during peak sunlight hours) Check the zoning laws for the proposed site to ensure that future, neighboring construction will not cast shade on the array. Determine where a future solar array might be placed. If the roof is sloped, the south-facing section will optimize the system performance; keep the south-facing section obstruction-free if possible. Minimize rooftop equipment to maximize available open area for solar collector placement. General Solar Guidelines The type of roof installed can greatly affect the cost of installing solar later. The roof must be capable of carrying the load of the solar equipment. PV – between 2 and 6 lb/ft2 ST – between 2 and 5.5 lb/ft2 The wind loads on rooftop solar equipment must be analyzed in order to ensure that the roof structure is sufficient. If it is going to be a rack mounted system, consider installing the mounting hardware at the time the roof is installed and use flashings for every penetration. If the collectors will be placed on the roof, check if the roof installation carries a warranty. Determine if the roof warranty contract has terms involving solar installation. Make sure all equipment is in compliance with the current version of the National Electrical Code. Additional Guidelines for PV Identify electrical panel location for PV system inter-connections, and keep space available in the electrical panel for a PV circuit breaker Specify panel capacity sufficient to accommodate proposed PV system size power generation plus size of breaker protecting main panel. NEC allows for the sum of these two sources of power to be 20% greater than the panel rating. Consult the local authority having jurisdiction. Lay out the locations for the inverter and the balance of system (BOS) components. Identify the inter-connection restrictions for the location of the building site that apply to grid-tied PV systems. Begin by reviewing interconnection standards at http://www.dsireusa.org/ Net M etering www.dsireusa.org / May 2012 ME: 660 WA: 100 co-ops & munis: 100 MT: 50* ND: 100* MN: 40 OR: 25/2,000* NH: 1,000 WY: 25* UT: 25/2,000* CO: 2,000 RI: 5,000* IA: 500* IL: 40* OH: no limit* IN: 1,000* KS: 25/200* MO: 100 co-ops & munis: 10/25 KY: 30* NM: 80,000* AR: 25/300 PA: 50/3,000/5,000* NJ: no limit* DC DE: 25/100/2,000 co-ops & munis: 25/100/500 MD: 2,000 WV: 25/50/500/2,000 GA: 10/100 FL: 2,000 HI: 100 * NY: 10/25/500/1,000/2,000* DC: 1,000 LA: 25/300 AK: 25* State policy VA: 20/500* NC: 1,000* OK: 100* AZ: no limit* CT: 2,000* MI: 150* NE: 25 NV: 1,000* CA: 1,000* MA: 60/1,000/2,000/10,000* WI: 20/100* co-ops & munis: 10/25 VT: 20/250/2,200 KIUC: 50 Voluntary utility program(s) only PR: 25/1,000 43 states + DC & PR have adopted a net metering policy State policy applies to certain utility types only (e.g., investor-owned utilities) Note: Numbers indicate individual system capacity limit in kW. Some limits vary by customer type, technology and/or application. Other limits might also apply. This map generally does not address statutory changes until administrative rules have been adopted to implement such changes. Solar Assessment – PV is VERY shade sensitive Once site preliminary assessment has been completed. What you want to know: Estimated system size Estimated production (kWh/yr ) Estimated cost Some economic analysis 30 Utility Interconnection- Where to land the power? Backfeed Breaker in Building Panel (Sum of Main Breaker and PV breaker not to exceed 120% of panel rating for commercial building, 100% for residential) Too big?- Survey Loads and reduce main breaker rating Too big?- Upgrade Panel Too big?- Line-side-tap Too big?- Upgrade Electrical Service Line 1 Line 2 100 225A max 31 Roof Access Issues Large Commercial Building (Axis > 250 ft) 4 ft Walkways 8 ft x 4 ft Venting Opportunities Every 20 ft Along Walkway http://irecusa.org/wp-content/uploads/2010/10/Brooks-Fire-Guidelines-Webinar-Nov2010.pdf 32 energy PV System Size and Energy Delivery Net Zero on Annual Average Basis Utility Load Solar January June Month December Solar System Size Prated =< L ηbosIave Prated = rated PV power (kW) L = Daily Load on PV (kWh/day) I ave = average daily solar radiation (sun hours/day) Annual Electricity Generation Egen = Prated ηbosIave 365 ηbos = balance of system efficiency, typically 0.77 33 U.S. & Germany Comparison Germany USA Pop. (2006) 82 M 298 M Pop. Density (per/km2) 230 31 Annual electricity use per capita - MWh (2006) 6.4 12.5 Average electrify rate ¢/kWh (2006 USD) 22.2 10.4 (ranges from 5-17) Total Installed W p per capita (2009) ~100 ~5 34 PV Watts PV Watts v1 and v2 • Photovoltaic Analysis • Select default values or input customized system parameters for size, electric cost, array type, tilt angle, and azimuth angle • Typical Meteorological Year weather data for the selected location (TMY files) used to calculate incident solar radiation and PV cell temperature for each hour of the year Benefits • • • • Easy to use Very Quick Useful for users of all technical levels Widely accepted tool 35 PV Watts v2 Flex Viewer - http://gisatnrel.nrel.gov/PVWatts_Viewer/index.html Solar Grid Data (40 km grid) Send the location data to PVWatts v2 36 PV Watts v2 37 PV Net Zero Energy Home Example in Boulder, CO Annual Energy use = 6000 kWh PV on south facing roof sloped at 20 degrees produces 1458 kWh/kW Annual with 0.8 derate factor 6000 kWh/1458kWh/kW = 4.1 kW Expected cost at $4/W = $16.4K before incentives Area required = 4100 W/11W/sq ft = 373 sq ft. 38 IMBY In My Backyard (IMBY) • Use a cursor to track the area outline, tool returns the feasible system size • Looks up incentives, rebates, system costs • Runs the production calculation using PVWatts v1 Benefits • Calculates system size for the user • Quick PVWatts calculation run time Interactive, and allows the user to modify all calculated values 39 RETScreen International Excel based integrated worksheets that run a suite of EE and RE technologies • Photovoltaic • Solar Thermal • Wind • Small Hydro • Biomass • Ground Source Heat Pump • Combined Heat & Power (CHP) • Energy Efficiency 40 RETScreen Five Step Standard Analysis Energy Model Cost Analysis Emissions Reduction Financial Analysis Sensitivity & Risk Analysis Benefits Comprehensive Training Resources On-line webcasts, presentations, instructor notes Case studies, assignments, worked-out solutions Detailed user manual e-textbook Clean Energy Legal Toolkit Free Download http://www.retscreen.net/ 41 System Advisor Model Sophisticated software tool that can run very detailed RE models Photovoltaics Solar Hot Water Concentrating Solar Power Small Wind Large Wind Geothermal Power 42 System Advisor Model (SAM) Detailed Economic Models Cost of generating electricity (LCOE) Type of financing Applicable tax credits and incentives Can model variety of rate structures Benefits TRNSYS calculation engine Flexible ways to display data Can run basic models, or component based models Full time user support and development team Capable of running parametric simulations Free download https://www.nrel.gov/analysis/sam/ 43 SAM 44 Resources Solar Energy Resources • NREL http://www.nrel.gov/rredc/ • Firstlook: http://firstlook.3tiergroup.com/ • TMY or Weather Data http://rredc.nrel.gov/solar/old_data/nsrdb/1991-2005/tmy3/ State and Utility Incentives and Utility Policies • http://www.dsireusa.org Solar PV Analytical Tools • • • • • Solar Advisor Model (SAM): https://www.nrel.gov/analysis/sam/ HOMER: https://analysis.nrel.gov/homer/ PVWatts: http://www.nrel.gov/rredc/pvwatts/ RETScreen: http://www.retscreen.net/ IMBY: http://www.nrel.gov/eis/imby/ 45 Questions? [email protected] NREL CAMPUS