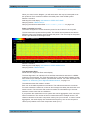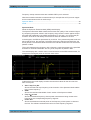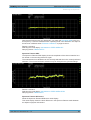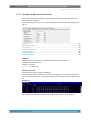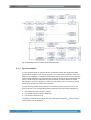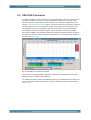
1
R&S®FS‑K101/103/105PC R&S®FSV‑K101/103/105 R&S®FSQ‑K101/103/105 EUTRA / LTE Uplink PC Software User Manual (=8éSZ) User Manual Test & Measurement 1308.9135.42 ─ 15 This manual covers the following products. ● R&S®FSQ-K101 (1308.9058.02) ● R&S®FSQ-K103 (1309.9097.02) ● R&S®FSQ-K105 (1309.9516.02) ● R&S®FSV-K101 (1310.9100.02) ● R&S®FSV-K103 (1310.9200.02) ● R&S®FSV-K105 (1309.9780.02) ● R&S®FS-K101PC (1309.9922.02) ● R&S®FS-K103PC (1309.9945.02) ● R&S®FS-K105PC (1309.9968.02) The R&S®FS-K10xPC versions are available for the following spectrum and signal analyzers ● R&S®FSG ● R&S®FSQ ● R&S®FSV ● R&S®FSVR ● R&S®FSW The contents of the manual correspond to version 3.40 or higher. © 2014 Rohde & Schwarz GmbH & Co. KG Mühldorfstr. 15, 81671 München, Germany Phone: +49 89 41 29 - 0 Fax: +49 89 41 29 12 164 E-mail: [email protected] Internet: www.rohde-schwarz.com Subject to change – Data without tolerance limits is not binding. R&S® is a registered trademark of Rohde & Schwarz GmbH & Co. KG. Trade names are trademarks of the owners. The following abbreviations are used throughout this manual: R&S®FS-K101-/K103/-K105 is abbreviated as R&S FS-K101/-K103/K105. R&S®FS‑K101/103/105PC Contents Contents 1 Introduction............................................................................................ 7 1.1 Requirements for UMTS Long-Term Evolution.......................................................... 7 1.2 Long-Term Evolution Uplink Transmission Scheme................................................. 9 1.2.1 SC-FDMA........................................................................................................................9 1.2.2 SC-FDMA Parameterization..........................................................................................10 1.2.3 Uplink Data Transmission............................................................................................. 10 1.2.4 Uplink Reference Signal Structure................................................................................ 11 1.2.5 Uplink Physical Layer Procedures................................................................................ 11 1.3 References................................................................................................................... 13 2 Welcome............................................................................................... 14 2.1 Licensing the Software............................................................................................... 14 2.2 Installing the Software................................................................................................ 17 2.3 Connecting the Computer to an Analyzer................................................................ 17 2.3.1 Instrument Configuration...............................................................................................17 2.3.2 Figuring Out IP Addresses............................................................................................ 20 2.4 Application Overview..................................................................................................23 2.5 Configuring the Software........................................................................................... 25 2.5.1 Configuring the Display................................................................................................. 26 2.5.2 Configuring the Software...............................................................................................27 3 Measurements and Result Displays...................................................29 3.1 Numerical Results....................................................................................................... 30 3.2 Measuring the Power Over Time............................................................................... 33 3.3 Measuring the Error Vector Magnitude (EVM)..........................................................35 3.4 Measuring the Spectrum............................................................................................ 38 3.4.1 Frequency Sweep Measurements................................................................................ 38 3.4.2 I/Q Measurements.........................................................................................................41 3.5 Measuring the Symbol Constellation........................................................................ 46 3.6 Measuring Statistics................................................................................................... 48 3.7 3GPP Test Scenarios.................................................................................................. 50 4 General Settings...................................................................................52 User Manual 1308.9135.42 ─ 15 3 R&S®FS‑K101/103/105PC Contents 4.1 Configuring the Measurement................................................................................... 52 4.1.1 Defining General Signal Characteristics....................................................................... 52 4.1.2 Configuring the Input.....................................................................................................53 4.1.3 Configuring the Input Level........................................................................................... 54 4.1.4 Configuring the Data Capture....................................................................................... 56 4.1.5 Configuring Measurement Results................................................................................58 4.1.6 Configuring Time Alignment Measurements................................................................. 61 4.2 Configuring MIMO Measurement Setups.................................................................. 61 4.3 Triggering Measurements.......................................................................................... 63 4.4 Spectrum Settings...................................................................................................... 64 4.4.1 Configuring SEM and ACLR Measurements.................................................................64 4.4.2 Configuring Spectrum Flatness Measurements............................................................ 66 4.5 Advanced Settings...................................................................................................... 66 4.5.1 Controlling I/Q Data.......................................................................................................67 4.5.2 Configuring the Baseband Input....................................................................................67 4.5.3 Using Advanced Input Settings..................................................................................... 68 4.5.4 Configuring the Digital I/Q Input.................................................................................... 69 4.5.5 Global Settings..............................................................................................................69 5 Demod Settings....................................................................................71 5.1 Configuring Uplink Signal Demodulation................................................................. 71 5.1.1 Configuring the Data Analysis.......................................................................................71 5.1.2 Compensating Signal Errors......................................................................................... 74 5.2 Defining Uplink Signal Characteristics..................................................................... 75 5.2.1 Defining the Physical Signal Characteristics.................................................................75 5.2.2 Configuring the Physical Layer Cell Identity..................................................................77 5.2.3 Configuring Subframes................................................................................................. 78 5.3 Defining Advanced Signal Characteristics............................................................... 83 5.3.1 Configuring the Demodulation Reference Signal.......................................................... 83 5.3.2 Configuring the Sounding Reference Signal................................................................. 85 5.3.3 Defining the PUSCH Structure......................................................................................88 5.3.4 Defining the PUCCH Structure......................................................................................90 5.3.5 Defining the PRACH Structure......................................................................................92 5.3.6 Defining Global Signal Characteristics..........................................................................93 User Manual 1308.9135.42 ─ 15 4 R&S®FS‑K101/103/105PC Contents 6 Analyzing Measurement Results........................................................ 95 7 Data Management................................................................................ 98 7.1 Importing and Exporting I/Q Data.............................................................................. 98 7.2 Managing Frame Data................................................................................................. 99 7.3 Customizing Reference Symbols............................................................................ 100 7.4 Importing and Exporting Limits............................................................................... 101 8 Measurement Basics......................................................................... 102 8.1 Symbols and Variables............................................................................................. 102 8.2 Overview.................................................................................................................... 103 8.3 The LTE Uplink Analysis Measurement Application............................................. 103 8.3.1 Synchronization...........................................................................................................104 8.3.2 Analysis.......................................................................................................................105 8.4 MIMO Measurement Guide....................................................................................... 107 8.4.1 MIMO Measurements with Signal Analyzers.............................................................. 107 8.4.2 MIMO Measurements with Oscilloscopes................................................................... 111 8.5 Performing Time Alignment Measurements........................................................... 113 8.6 SRS EVM Calculation................................................................................................114 9 Remote Commands........................................................................... 116 9.1 Overview of Remote Command Suffixes................................................................ 116 9.2 Introduction............................................................................................................... 117 9.2.1 Long and Short Form.................................................................................................. 117 9.2.2 Numeric Suffixes......................................................................................................... 118 9.2.3 Optional Keywords...................................................................................................... 118 9.2.4 | (Vertical Stroke).........................................................................................................118 9.2.5 SCPI Parameters........................................................................................................ 119 9.3 Remote Commands to Select a Result Display......................................................121 9.4 Remote Commands to Perform Measurements..................................................... 122 9.5 Remote Commands to Read Numeric Results....................................................... 123 9.6 Remote Commands to Read Trace Data................................................................. 130 9.6.1 Using the TRACe[:DATA] Command.......................................................................... 130 9.6.2 Reading Out Limit Check Results............................................................................... 140 9.7 Remote Commands to Configure General Settings.............................................. 150 User Manual 1308.9135.42 ─ 15 5 R&S®FS‑K101/103/105PC Contents 9.7.1 Remote Commands for General Settings................................................................... 150 9.7.2 Configuring MIMO Measurement Setups....................................................................157 9.7.3 Using a Trigger............................................................................................................160 9.7.4 Configuring Spectrum Measurements.........................................................................161 9.7.5 Remote Commands for Advanced Settings................................................................ 164 9.8 Remote Commands to Configure the Demodulation.............................................167 9.8.1 Remote Commands for UL Demodulation Settings.................................................... 167 9.8.2 Remote Commands for UL Signal Characteristics......................................................171 9.8.3 Remote Commands for UL Advanced Signal Characteristics.....................................178 9.9 Configuring the Software......................................................................................... 189 9.10 Managing Files.......................................................................................................... 190 List of Commands..............................................................................192 Index....................................................................................................197 User Manual 1308.9135.42 ─ 15 6 R&S®FS‑K101/103/105PC Introduction Requirements for UMTS Long-Term Evolution 1 Introduction Currently, UMTS networks worldwide are being upgraded to high speed downlink packet access (HSDPA) in order to increase data rate and capacity for downlink packet data. In the next step, high speed uplink packet access (HSUPA) will boost uplink performance in UMTS networks. While HSDPA was introduced as a 3GPP Release 5 feature, HSUPA is an important feature of 3GPP Release 6. The combination of HSDPA and HSUPA is often referred to as HSPA. However, even with the introduction of HSPA, the evolution of UMTS has not reached its end. HSPA+ will bring significant enhancements in 3GPP Release 7. The objective is to enhance the performance of HSPA-based radio networks in terms of spectrum efficiency, peak data rate and latency, and to exploit the full potential of WCDMAbased 5 MHz operation. Important features of HSPA+ are downlink multiple input multiple output (MIMO), higher order modulation for uplink and downlink, improvements of layer 2 protocols, and continuous packet connectivity. In order to ensure the competitiveness of UMTS for the next 10 years and beyond, concepts for UMTS long term evolution (LTE) have been investigated. The objective is a high-data-rate, low-latency and packet-optimized radio access technology. Therefore, a study item was launched in 3GPP Release 7 on evolved UMTS terrestrial radio access (EUTRA) and evolved UMTS terrestrial radio access network (EUTRAN). LTE/ EUTRA will then form part of 3GPP Release 8 core specifications. This introduction focuses on LTE/EUTRA technology. In the following, the terms LTE or EUTRA are used interchangeably. In the context of the LTE study item, 3GPP work first focused on the definition of requirements, e.g. targets for data rate, capacity, spectrum efficiency, and latency. Also commercial aspects such as costs for installing and operating the network were considered. Based on these requirements, technical concepts for the air interface transmission schemes and protocols were studied. Notably, LTE uses new multiple access schemes on the air interface: orthogonal frequency division multiple access (OFDMA) in downlink and single carrier frequency division multiple access (SC-FDMA) in uplink. Furthermore, MIMO antenna schemes form an essential part of LTE. In an attempt to simplify protocol architecture, LTE brings some major changes to the existing UMTS protocol concepts. Impact on the overall network architecture including the core network is being investigated in the context of 3GPP system architecture evolution (SAE). ● ● ● Requirements for UMTS Long-Term Evolution......................................................... 7 Long-Term Evolution Uplink Transmission Scheme................................................. 9 References..............................................................................................................13 1.1 Requirements for UMTS Long-Term Evolution LTE is focusing on optimum support of packet switched (PS) services. Main requirements for the design of an LTE system are documented in 3GPP TR 25.913 [1] and can be summarized as follows: User Manual 1308.9135.42 ─ 15 7 R&S®FS‑K101/103/105PC Introduction Requirements for UMTS Long-Term Evolution ● Data Rate: Peak data rates target 100 Mbps (downlink) and 50 Mbps (uplink) for 20 MHz spectrum allocation, assuming two receive antennas and one transmit antenna are at the terminal. ● Throughput: The target for downlink average user throughput per MHz is three to four times better than Release 6. The target for uplink average user throughput per MHz is two to three times better than Release 6. ● Spectrum efficiency: The downlink target is three to four times better than Release 6. The uplink target is two to three times better than Release 6. ● Latency: The one-way transit time between a packet being available at the IP layer in either the UE or radio access network and the availability of this packet at IP layer in the radio access network/UE shall be less than 5 ms. Also C-plane latency shall be reduced, e.g. to allow fast transition times of less than 100 ms from camped state to active state. ● Bandwidth: Scaleable bandwidths of 5 MHz, 10 MHz, 15 MHz, and 20 MHz shall be supported. Also bandwidths smaller than 5 MHz shall be supported for more flexibility. ● Interworking: Interworking with existing UTRAN/GERAN systems and non-3GPP systems shall be ensured. Multimode terminals shall support handover to and from UTRAN and GERAN as well as inter-RAT measurements. Interruption time for handover between EUTRAN and UTRAN/GERAN shall be less than 300 ms for realtime services and less than 500 ms for non-realtime services. ● Multimedia broadcast multicast services (MBMS): MBMS shall be further enhanced and is then referred to as E-MBMS. ● Costs: Reduced CAPEX and OPEX including backhaul shall be achieved. Costeffective migration from Release 6 UTRA radio interface and architecture shall be possible. Reasonable system and terminal complexity, cost, and power consumption shall be ensured. All the interfaces specified shall be open for multivendor equipment interoperability. ● Mobility: The system should be optimized for low mobile speed (0 to 15 km/h), but higher mobile speeds shall be supported as well, including high speed train environment as a special case. ● Spectrum allocation: Operation in paired (frequency division duplex / FDD mode) and unpaired spectrum (time division duplex / TDD mode) is possible. ● Co-existence: Co-existence in the same geographical area and co-location with GERAN/UTRAN shall be ensured. Also, co-existence between operators in adjacent bands as well as cross-border co-existence is a requirement. ● Quality of Service: End-to-end quality of service (QoS) shall be supported. VoIP should be supported with at least as good radio and backhaul efficiency and latency as voice traffic over the UMTS circuit switched networks. ● Network synchronization: Time synchronization of different network sites shall not be mandated. User Manual 1308.9135.42 ─ 15 8 R&S®FS‑K101/103/105PC Introduction Long-Term Evolution Uplink Transmission Scheme 1.2 Long-Term Evolution Uplink Transmission Scheme 1.2.1 SC-FDMA During the study item phase of LTE, alternatives for the optimum uplink transmission scheme were investigated. While OFDMA is seen optimum to fulfil the LTE requirements in downlink, OFDMA properties are less favourable for the uplink. This is mainly due to weaker peak-to-average power ratio (PAPR) properties of an OFDMA signal, resulting in worse uplink coverage. Thus, the LTE uplink transmission scheme for FDD and TDD mode is based on SCFDMA with a cyclic prefix. SC-FDMA signals have better PAPR properties compared to an OFDMA signal. This was one of the main reasons for selecting SC-FDMA as LTE uplink access scheme. The PAPR characteristics are important for cost-effective design of UE power amplifiers. Still, SC-FDMA signal processing has some similarities with OFDMA signal processing, so parameterization of downlink and uplink can be harmonized. There are different possibilities how to generate an SC-FDMA signal. DFT-spreadOFDM (DFT-s-OFDM) has been selected for EUTRA. The principle is illustrated in figure 1-1. For DFT-s-OFDM, a size-M DFT is first applied to a block of M modulation symbols. QPSK, 16QAM and 64 QAM are used as uplink EUTRA modulation schemes, the latter being optional for the UE. The DFT transforms the modulation symbols into the frequency domain. The result is mapped onto the available sub-carriers. In EUTRA uplink, only localized transmission on consecutive sub-carriers is allowed. An N point IFFT where N>M is then performed as in OFDM, followed by addition of the cyclic prefix and parallel to serial conversion. Fig. 1-1: Block Diagram of DFT-s-OFDM (Localized Transmission) User Manual 1308.9135.42 ─ 15 9 R&S®FS‑K101/103/105PC Introduction Long-Term Evolution Uplink Transmission Scheme The DFT processing is therefore the fundamental difference between SC-FDMA and OFDMA signal generation. This is indicated by the term DFT-spread-OFDM. In an SCFDMA signal, each sub-carrier used for transmission contains information of all transmitted modulation symbols, since the input data stream has been spread by the DFT transform over the available sub-carriers. In contrast to this, each sub-carrier of an OFDMA signal only carries information related to specific modulation symbols. 1.2.2 SC-FDMA Parameterization The EUTRA uplink structure is similar to the downlink. An uplink radio frame consists of 20 slots of 0.5 ms each, and 1 subframe consists of 2 slots. The slot structure is shown in figure 1-2. SC-FDMA symbols, where = 7 for the normal cyclic prefix Each slot carries and = 6 for the extended cyclic prefix. SC-FDMA symbol number 3 (i.e. the 4th symbol in a slot) carries the reference signal for channel demodulation. Fig. 1-2: Uplink Slot Structure Also for the uplink, a bandwidth agnostic layer 1 specification has been selected. The table below shows the configuration parameters in an overview table. 1.2.3 Uplink Data Transmission In uplink, data is allocated in multiples of one resource block. Uplink resource block size in the frequency domain is 12 sub-carriers, i.e. the same as in downlink. However, not all integer multiples are allowed in order to simplify the DFT design in uplink signal processing. Only factors 2, 3, and 5 are allowed. The uplink transmission time interval (TTI) is 1 ms (same as downlink). User data is carried on the Physical Uplink Shared Channel (PUSCH) that is determined by the transmission bandwidth NTx and the frequency hopping pattern k0. User Manual 1308.9135.42 ─ 15 10 R&S®FS‑K101/103/105PC Introduction Long-Term Evolution Uplink Transmission Scheme The Physical Uplink Control Channel (PUCCH) carries uplink control information, e.g. CQI reports and ACK/NACK information related to data packets received in the downlink. The PUCCH is transmitted on a reserved frequency region in the uplink. 1.2.4 Uplink Reference Signal Structure Uplink reference signals are used for two different purposes: on the one hand, they are used for channel estimation in the eNodeB receiver in order to demodulate control and data channels. On the other hand, the reference signals provide channel quality information as a basis for scheduling decisions in the base station. The latter purpose is also called channel sounding. The uplink reference signals are based on CAZAC (Constant Amplitude Zero AutoCorrelation) sequences. 1.2.5 Uplink Physical Layer Procedures For EUTRA, the following uplink physical layer procedures are especially important: Non-synchronized random access Random access may be used to request initial access, as part of handover, when transiting from idle to connected, or to re-establish uplink synchronization. The structure is shown in figure 1-3. Fig. 1-3: Random Access Structure, principle User Manual 1308.9135.42 ─ 15 11 R&S®FS‑K101/103/105PC Introduction Long-Term Evolution Uplink Transmission Scheme Multiple random access channels may be defined in the frequency domain within one access period TRA in order to provide a sufficient number of random access opportunities. For random access, a preamble is defined as shown in figure 1-4. The preamble sequence occupies TPRE = 0.8 ms and the cyclic prefix occupies TCP = 0.1 ms within one subframe of 1 ms. During the guard time TGT, nothing is transmitted. The preamble bandwidth is 1.08 MHz (72 sub-carriers). Higher layer signalling controls in which subframes the preamble transmission is allowed, and the location in the frequency domain. Per cell, there are 64 random access preambles. They are generated from Zadoff-Chu sequences. Fig. 1-4: Random Access Preamble The random access procedure uses open loop power control with power ramping similar to WCDMA. After sending the preamble on a selected random access channel, the UE waits for the random access response message. If no response is detected then another random access channel is selected and a preamble is sent again. Uplink scheduling Scheduling of uplink resources is done by eNodeB. The eNodeB assigns certain time/ frequency resources to the UEs and informs UEs about transmission formats to use. Scheduling decisions affecting the uplink are communicated to the UEs via the Physical Downlink Control Channel (PDCCH) in the downlink. The scheduling decisions may be based on QoS parameters, UE buffer status, uplink channel quality measurements, UE capabilities, UE measurement gaps, etc. Uplink link adaptation As uplink link adaptation methods, transmission power control, adaptive modulation and channel coding rate, as well as adaptive transmission bandwidth can be used. Uplink timing control Uplink timing control is needed to time align the transmissions from different UEs with the receiver window of the eNodeB. The eNodeB sends the appropriate timing-control commands to the UEs in the downlink, commanding them to adapt their respective transmit timing. Hybrid automatic repeat request (ARQ) The Uplink Hybrid ARQ protocol is already known from HSUPA. The eNodeB has the capability to request retransmissions of incorrectly received data packets. User Manual 1308.9135.42 ─ 15 12 R&S®FS‑K101/103/105PC Introduction References 1.3 References [1] 3GPP TS 25.913: Requirements for E-UTRA and E-UTRAN (Release 7) [2] 3GPP TR 25.892: Feasibility Study for Orthogonal Frequency Division Multiplexing (OFDM) for UTRAN enhancement (Release 6) [3] 3GPP TS 36.211 v8.3.0: Physical Channels and Modulation (Release 8) [4] 3GPP TS 36.300: E-UTRA and E-UTRAN; Overall Description; Stage 2 (Release 8) [5] 3GPP TS 22.978: All-IP Network (AIPN) feasibility study (Release 7) [6] 3GPP TS 25.213: Spreading and modulation (FDD) [7] Speth, M., Fechtel, S., Fock, G., and Meyr, H.: Optimum Receiver Design for Wireless Broad-Band Systems Using OFDM – Part I. IEEE Trans. on Commun. Vol. 47 (1999) No. 11, pp. 1668-1677. [8] Speth, M., Fechtel, S., Fock, G., and Meyr, H.: Optimum Receiver Design for OFDM-Based Broadband Transmission – Part II: A Case Study. IEEE Trans. on Commun. Vol. 49 (2001) No. 4, pp. 571-578. User Manual 1308.9135.42 ─ 15 13 R&S®FS‑K101/103/105PC Welcome Licensing the Software 2 Welcome The EUTRA/LTE measurement software makes use of the I/Q capture functionality of the following spectrum and signal analyzers to enable EUTRA/LTE TX measurements conforming to the EUTRA specification. ● R&S FSQ ● R&S FSG ● R&S FSV ● R&S FSVR ● R&S FSW ● R&S RTO This manual contains all information necessary to configure, perform and analyze such measurements. ● ● ● ● ● Licensing the Software............................................................................................14 Installing the Software.............................................................................................17 Connecting the Computer to an Analyzer............................................................... 17 Application Overview...............................................................................................23 Configuring the Software.........................................................................................25 2.1 Licensing the Software The software provides the following general functionality. ● To capture and analyze I/Q data from an R&S®FSW, R&S®FSV, R&S®FSVR, R&S®FSQ, R&S®FSG or R&S®RTO. ● To read and analyze I/Q data from a file. License type You can purchase two different license types for the software. ● R&S®FS-K10xPC This license supports software operation with and without an R&S instrument (analyzer or oscilloscope). The software works with a connection to an analyzer but also supports the analysis of data stored in a file. This license type requires a smartcard reader (dongle). ● R&S®FSV/FSQ-K10x This license requires a connection to an R&S®FSV, R&S®FSVR, R&S®FSQ or R&S®FSG. The license must be installed on the analyzer. Using the smartcard reader (dongle) Before you can use the software, you have to load the license(s) on a smartcard (if you already have one) or order a new smartcard (R&S FSPC). New license types are available as registered licenses (see below). User Manual 1308.9135.42 ─ 15 14 R&S®FS‑K101/103/105PC Welcome Licensing the Software You can use the smart card together with the USB smart card reader (for SIM format) supplied with the software. Alternatively, you can insert the smart card (full format) in a reader that is connected to or built into your PC. Note that support for problems with the smart card licensing can only be guaranteed if the supplied USB smart card reader (for SIM format) is used. 1. With the delivery of the R&S FSPC you got a smart card and a smart card reader. 2. Remove the smart card. 3. Insert the smart card into the reader. If the OMNIKEY label faces upward, the smart card has to be inserted with the chip facedown and the angled corner facing away from the reader. 4. After pushing the smart card completely inside the USB smart card reader, you can use it together with the software. When you insert the USB Smartcard reader into the PC, the drivers will be loaded. If your PC does not already have drivers installed for this reader, the hardware will not be detected and the software will not work. In this case, install the required driver manually. On the CD, it is in the folder \Install\USB SmartCard Reader Driver Files, named according to the pro- User Manual 1308.9135.42 ─ 15 15 R&S®FS‑K101/103/105PC Welcome Licensing the Software cessor architecture (OMNIKEY3x21_x86... or OMNIKEY3x21_x64). Detailed information on the file content and the download location for updated drivers can be found in the ReadMe.txt file in the same folder. You may have problems locking a computer while the card is inserted, because MS Windows tries to get log-in information from the card immediately after you have locked the computer. Solve this issue by changing a registry entry. Either execute the registry file DisableCAD.reg in the same folder the USM Smartcard reader installation files are located. Or manually change the entry. ● Open the Windows Start Menu and select the "Run" item. ● Enter "regedit" in the dialog to open the system reigistry. ● Navigate to HKEY_LOCAL_MACHINE\SOFTWARE\Microsoft\Windows\CurrentVersion\ policies\system. ● Set the value of DisableCAD to 0. Note that security policies may prevent you from editing the value. Contact your IT administrator if you have problems with editing the value or installing the drivers. Ordering licenses In case of registered licenses, the license key code is based on the serial number of the R&S FSPC smartcard. Thus, you need to know the serial number when you order a new license. 1. Start the software (without a connected dongle). 2. Press the SETUP key. 3. Press the "Dongle License Info" softkey. The software opens the "Rohde & Schwarz License Information" dialog box. 4. Connect the smartcard / dongle to the computer. User Manual 1308.9135.42 ─ 15 16 R&S®FS‑K101/103/105PC Welcome Installing the Software 5. Press the "Check Licenses" button. The software shows all current licenses. The serial number which is necessary to know if you need a license is shown in the "Serial" column. The "Device ID" also contains the serial number. 6. To enter a new license code, press the "Enter License Key Code" button. 2.2 Installing the Software For information on the installation procedure see the release notes of the software. 2.3 Connecting the Computer to an Analyzer In order to be able to communicate with an analyzer (R&S FSQ, R&S FSG, R&S FSV, R&S FSVR or R&S FSW) or oscilloscope (R&S RTO family), you have to connect it to a computer. You can use the IEEE bus (GPIB) or a local area network (LAN). Requirements To be able to capture I/Q data, you need one of the signal analyzers or oscilloscopes mentioned above. If you are using an R&S FSQ, you must ● use firmware 3.65 or higher to be able to establish a connection via TCP/IP or ● install the RSIB passport driver on the computer. The driver is available for download at http://www.rohde-schwarz.com/appnote/ 1EF47 To establish a connection, you also have to determine the network address of the analyzer and set it up in the LTE software. 2.3.1 Instrument Configuration The functionality necessary to establish the connection to the test equipment is part of the "Analyzer Config / MIMO Setup" tab of the "General Settings" dialog box. The software supports simultaneous connections to several analyzers or oscilloscopes. Using a combination of analyzers and oscilloscopes is also possible. The software automatically detects if you have connected an analyzer or an oscilloscope. On the whole, you can perform measurement on up to eight input channels. Each input channel captures one I/Q data stream. If you use a spectrum or signal analyzer, one input channel corresponds to one instrument's RF input. Thus, the required number of analyzers depends on the number of I/Q User Manual 1308.9135.42 ─ 15 17 R&S®FS‑K101/103/105PC Welcome Connecting the Computer to an Analyzer data streams you want to measure. The analyzers have to be connected to each other with one analyzer controlling the other instruments by providing the trigger. If you use an oscilloscope, the number of required instruments depends on the number of channels available on the oscilloscope. ● ● 2.3.1.1 General Instrument Configuration........................................................................... 18 Instrument Connection Configuration......................................................................19 General Instrument Configuration The general analyzer or oscilloscope configuration determines the general MIMO setup. The purpose of the general MIMO setup is to assign an analyzer or oscilloscope channel to a particular I/Q data stream. For successful measurements, you have to configure each instrument individually in the "Analyzer Configuration" table. The number of table rows depends on the number of antennas you have selected. Input Channel Shows the number of the analyzer in the test setup or the channel number of an oscilloscope. If you are using several instruments, the first input channel always represents the controlling (master) instrument. VISA RSC Opens a dialog box to configure the instrument connection in the network (see chapter 2.3.1.2, "Instrument Connection Configuration", on page 19. If you perform MIMO measurements with several instruments, you have to establish a network connection for each instrument. Number of Channels Defines the number of channels of an oscilloscope that you want to use. The number of instruments to configure is reduced if you use an instrument with more than one channel. The software also adjusts the contents of the "Analyzer Input Channel". If you perform the measurement with one or more signal analyzers (for example R&S FSW), the number of channels has to be "1". SCPI command: User Manual 1308.9135.42 ─ 15 18 R&S®FS‑K101/103/105PC Welcome Connecting the Computer to an Analyzer CONFigure:ACONfig<instrument>:NCHannels on page 158 Analyzer Input Channel Assigns one of the I/Q data streams (input channel) to a particular oscilloscope channel. The "Analyzer Input Channel" has no effect if you use only instruments that have a single input channel. SCPI command: CONFigure:ACONfig<instrument>:ICSequence on page 158 2.3.1.2 Instrument Connection Configuration The "Instrument Connection Configuration" dialog box contains functionality that is necessary to successfully establish a connection in a network of analyzers. The dialog box contains several elements. Interface Type Selects the type of interface you want to use. You have to connect the analyzer or oscilloscope via LAN interface or the IEEE bus (GPIB). Number Selects the number of the interface if the PC has more than one interfaces (e.g. several LAN cards). Address Defines the address of the instrument. The type of content depends on the interface type. ● GPIB Address Primary GPIB address of the analyzer. Possible values are in the range from 0 to 31. The default GPIB address for an R&S instruments is 20. Available for IEEE bus systems using the IEEE 488 protocol. The interface type is GPIB. ● IP Address or Computer Name Name or host address (TCP/IP) of the computer. Available for LAN bus systems using either the VXI-11 protocol or a Rohde&Schwarz specific protocol (RSIB). The interface type is either LAN (VXI-11) or LAN (RSIB). User Manual 1308.9135.42 ─ 15 19 R&S®FS‑K101/103/105PC Welcome Connecting the Computer to an Analyzer Contact your local IT support for information on free IP addresses. – The RSIB protocol is supported by all firmware version of the R&S analyzers and oscilloscopes. – ● The VXI-11 protocol is supported as of R&S FSQ firmware version 3.65 and by all firmware version of the R&S FSV(R), R&S FSG and oscilloscopes. Complete VISA Resource String Allows you to enter the complete VISA resource string manually. A VISA string is made up out of the elements mentioned above, separated by double colons (::), e.g. GPIB::20::INSTR. Available for interface type "Free Entry". Subsystem Shows the subsystem in use. Typically you do not have to change the subsystem. VISA RSC Shows or defines the complete VISA resource string. SCPI command: CONFigure:ACONfig<instrument>:ADDRess on page 157 Test Connection Button that tests the connection. If the connection has been established successfully, the software returns a PASSED message. If not, it shows a FAILED message. 2.3.2 Figuring Out IP Addresses Each of the supported instruments logs its network connection information in a different place. Find instructions on how to find out the necessary information below. 2.3.2.1 Figuring Out the Address of an R&S FSQ or R&S FSG Follow these steps to figure out GPIB or IP address of an R&S FSQ or R&S FSG. Figuring Out the GPIB address 1. Press the SETUP key. 2. Press the "General Setup" softkey. 3. Press the "GPIB" softkey. The R&S FSQ / FSG opens a dialog box that shows its current GPIB address. Figuring Out the IP address 1. Press the SETUP key. User Manual 1308.9135.42 ─ 15 20 R&S®FS‑K101/103/105PC Welcome Connecting the Computer to an Analyzer 2. Press the "General Setup" softkey. 3. Press the "Configure Network" softkey. 4. Press the "Configure Network" softkey. The MS Windows "Network Connections" dialog box opens. 5. Select the "Local Area Connection" item. The "Local Area Connection Status" dialog box opens. 6. Select the "Support" tab. The "Support" tab shows the current TCP/IP information of the R&S FSQ. 2.3.2.2 Figuring Out the Address of an R&S FSV or R&S FSVR Follow these steps to figure out the GPIB or IP address of an R&S FSV or R&S FSVR. Figuring Out the GPIB address 1. Press the SETUP key. 2. Press the "General Setup" softkey. 3. Press the "GPIB" softkey. 4. Press the "GPIB Address" softkey. The R&S FSV(R) opens a dialog box that shows its current GPIB address. Figuring Out the IP address 1. Press the SETUP key. 2. Press the "General Setup" softkey. 3. Press the "Network Address" softkey. 4. Press the "IP Address" softkey. User Manual 1308.9135.42 ─ 15 21 R&S®FS‑K101/103/105PC Welcome Connecting the Computer to an Analyzer The R&S FSV(R) opens a dialog box that contains information about the LAN connection. 2.3.2.3 Figuring Out the Address of an R&S FSW Follow these steps to figure out the GPIB or IP address of an R&S FSW. Figuring Out the GPIB address 1. Press the SETUP key. 2. Press the "Network + Remote" softkey. The R&S FSW opens the "Network & Remote" dialog box. 3. Select the "GPIB" tab. The R&S FSW shows information about the GPIB connection, including the GPIB address. Figuring Out the IP address 1. Press the SETUP key. 2. Press the "Network + Remote" softkey. The R&S FSW opens the "Network & Remote" dialog box and shows its current IP address in the corresponding field. User Manual 1308.9135.42 ─ 15 22 R&S®FS‑K101/103/105PC Welcome Application Overview 2.3.2.4 Figuring Out the Address of an R&S RTO Follow these steps to figure out the network address of an R&S RTO. ► Press the SETUP key. The R&S RTO opens a dialog box that contains general information about the system. 2.4 Application Overview Starting the application To start the software, use either the shortcut on the computer desktop or the entry in the Microsoft Windows Start menu. If you run the software on an analyzer, access the software via the "Mode" menu. ► Press the MODE key and select "EUTRA/LTE". User Manual 1308.9135.42 ─ 15 23 R&S®FS‑K101/103/105PC Welcome Application Overview Presetting the software When you first start the software, all settings are in their default state. After you have changed any parameter, you can restore the default state with the PRESET key. Note that using the preset function also presets an analyzer if one is connected and you capture the data from the hardware. CONFigure:PRESet on page 189 Using the preset if the software has been installed on an R&S FSQ, R&S FSG, R&S FSV, R&S FSVR or R&S FSW presets the software and the analyzer and exits the LTE software. SCPI command: *RST Elements and layout of the user interface The user interface of the LTE measurement application is made up of several elements. User Manual 1308.9135.42 ─ 15 24 R&S®FS‑K101/103/105PC Welcome Configuring the Software 1 = Header table. The header table shows basic information like measurement frequency or sync state. 2 = Diagram area. The diagram area contains the measurement results. You can display it in full screen or split screen mode. The result display is separated in a header that shows the title etc. and the diagram area that show the actual results. 3 = Status bar. The status bar contains information about the current status of the measurement and the software. 4 = Hotkeys. Hotkeys contain functionality to control the measurement process. 5 = Softkeys. Softkeys contain functionality to configure and select measurement functions. 6 = Hardkeys. Hardkeys open new softkey menus. The status bar The status bar is located at the bottom of the display. It shows the current measurement status and its progress in a running measurement. The status bar also shows warning and error messages. Error messages are generally highlighted. Display of measurement settings The header table above the result displays shows information on hardware and measurement settings. The header table includes the following information ● Freq The analyzer RF frequency. ● Mode Link direction, duplexing, cyclic prefix and maximum number of physical resource blocks (PRBs) / signal bandwidth. ● CP/Cell Grp/ID Shows the cell identity information. ● Sync State The following synchronization states may occur: – OK The synchronization was successful. – FAIL The synchronization has failed. SCPI Command: [SENSe]:SYNC[:STATe]? on page 123 ● Master Ref Level Shows the reference level of the master analyzer. ● Capture Time/Frame Shows the capture length in ms. In PRACH analysis mode, it also shows the preamble that is currently analyzed. 2.5 Configuring the Software This chapter contains information about general software functionality. User Manual 1308.9135.42 ─ 15 25 R&S®FS‑K101/103/105PC Welcome Configuring the Software 2.5.1 Configuring the Display The "Display" menu contains functionality to improve the display and documentation of results. ► Press the DISP key. The application features four screens (or result displays). Each of the screens may contain a different result display. The number of visible screens depends on the screen layout. Full screen mode In full screen mode, the application shows the contents a single screen. ► Press the "Full Screen" softkey. If you have configured more than one result displays, these are still working in the background. Split screen mode In split screen mode, the application shows the contents of two screens, either screen A and screen B or screen C and screen D. ► Press the "Split Screen" softkey. If you have configured more than two result displays, these are still working in the background. 2x2 split screen mode In 2x2 split screen mode, the application shows the contents of four screens. ► Press the "2x2 Split Screen" softkey. Limitations For the Spectrum Emission Mask, ACLR and Time Alignment measurements, a maximum of two screens is possible. By default, the software shows the results in all four screens. The screens are labeled A to D to the right of the measurement diagrams. The label of the currently active screen is highlighted green ( ). The currently active screen is the one settings are applied to. Switch between the screens with the "Screen A", "Screen B", "Screen C" and "Screen D" hotkeys. The background color of the software by default is black. Apply another color via the "Color Selection" softkey and the corresponding dialog box. User Manual 1308.9135.42 ─ 15 26 R&S®FS‑K101/103/105PC Welcome Configuring the Software For documentation purposes the software provides a hardcopy function that lets you save the current results in one of the following formats. ● bmp ● gif ● jpeg ● png ● tiff Use the "Hardcopy to Clipboard" function to take a screenshot. DISPlay[:WINDow<n>]:SELect on page 189 2.5.2 Configuring the Software The "Setup" menu contains various general software functions. ► Press the SETUP key to access the "Setup" menu. Configure Analyzer Connection Opens the "General Settings" dialog box. For more information see "MIMO Analyzer Configuration" on page 62. Data Source (Instr File) Selects the general input source (an instrument or a file). For more information see "Selecting the Input Source" on page 54. Dongle License Info Opens the "Rohde & Schwarz License Information" dialog box. The dialog box contains functionality to add new (registered) licenses. For more information see chapter 2.1, "Licensing the Software", on page 14. "Check Licenses" Looks for all smartcards connected to the computer and returns their characteristics like the serial number of the smartcard or its device ID. Note that the smartcard has to be connected to figure out its properties. "Enter License Key Code" Opens an input field to manually enter a new license key code. A key code consists of 30 digits. "Process License File" Opens a dialog box to select a file (xml format) that contains a license. Opening that file automatically adds a new license. Show Logging Opens a dialog box that contains a log of all messages that the software has shown in the status bar. Use the message log for debugging purposes in case any errors occur. You can refresh and clear the contents of the log or copy the contents of the system log to the clipboard. "Refresh" User Manual 1308.9135.42 ─ 15 Updates the contents of the log. 27 R&S®FS‑K101/103/105PC Welcome Configuring the Software "Clear All" Deletes all entries in the log. "Copy to Clipboard" Copies the contents of the log to the clipboard. System Info Opens a dialog box that contains information about the system like driver versions or the utility software. You can use this information in case an analyzer does not work properly. User Manual 1308.9135.42 ─ 15 28 R&S®FS‑K101/103/105PC Measurements and Result Displays 3 Measurements and Result Displays The LTE measurement analyzer features several measurements to examine and analyze different aspects of an LTE signal. The source of the data that is processed is either a live signal or a previously recorded signal whose characteristics have been saved to a file. For more information see "Selecting the Input Source" on page 54. In both cases, you can perform a continuous or a single measurement. Continuous measurements capture and analyze the signal continuously and stop only after you turn it off manually. ► Press the "Run Cont" softkey to start and stop continuous measurements. Single measurements capture and analyze the signal over a particular time span or number of frames. The measurement stops after the time has passed or the frames have been captured. ► Press the "Run Sgl" softkey to start a single measurement. You can also repeat a measurement based on the data that has already been captured, e.g. if you want to apply different demodulation settings to the same signal. ► Press the "Refresh" softkey to measure the signal again. This chapter provides information on all types of measurements that the LTE measurement analyzer supports. Note that all measurements are based on the I/Q data that is captured except the Spectrum Emission Mask and the Adjacent Channel Leakage Ratio. Those are based on a frequency sweep the analyzer performs for the measurement. SCPI command: INITiate[:IMMediate] on page 122 INITiate:REFResh on page 122 ● ● ● ● ● ● ● Numerical Results................................................................................................... 30 Measuring the Power Over Time............................................................................ 33 Measuring the Error Vector Magnitude (EVM)........................................................ 35 Measuring the Spectrum......................................................................................... 38 Measuring the Symbol Constellation.......................................................................46 Measuring Statistics................................................................................................ 48 3GPP Test Scenarios..............................................................................................50 User Manual 1308.9135.42 ─ 15 29 R&S®FS‑K101/103/105PC Measurements and Result Displays Numerical Results 3.1 Numerical Results Result Summary The Result Summary shows all relevant measurement results in numerical form, combined in one table. ▶ Press the "Display (List Graph)" softkey so that the "List" element turns green to view the Result Summary. Remote command: DISPlay[:WINDow<n>]:TABLe on page 122 Contents of the result summary The contents of the result summary depend on the analysis mode you have selected. The first screenshot shows the results for PUSCH/PUCCH analysis mode, the second one those for PRACH analysis mode. User Manual 1308.9135.42 ─ 15 30 R&S®FS‑K101/103/105PC Measurements and Result Displays Numerical Results The table is split in two parts. The first part shows results that refer to the complete frame. It also indicates limit check results where available. The font of 'Pass' results is green and that of 'Fail' results is red. By default, the software checks the limits defined by the standard. You can also import customized limits. In that case the software evaluates those limits instead of the predefined ones. For more information see chapter 7.4, "Importing and Exporting Limits", on page 101. Note: The EVM results on a frame level (first part of the table) are calculated as defined by 3GPP at the edges of the cyclic prefix. The other EVM results (lower part of the table) are calculated at the optimal timing position in the middle of the cyclic prefix. Because of inter-symbol interference, the EVM calculated at the edges of the cyclic prefix is higher than the EVM calculated in the middle of the cyclic prefix. Note: In some cases, it is not possible to calculate the I/Q Gain Imbalance and the I/Q Quadrature Error. The reason may be that the subframe selection is set to "All". In that case the software only displays the results if there is a result in all subframes. Try and search through individual subframes to find a subframe that provides those results. EVM PUSCH QPSK Shows the EVM for all QPSK-modulated resource elements of the PUSCH channel in the analyzed frame. FETCh:SUMMary:EVM:USQP[:AVERage]? on page 127 EVM PUSCH 16QAM Shows the EVM for all 16QAM-modulated resource elements of the PUSCH channel in the analyzed frame. FETCh:SUMMary:EVM:USST[:AVERage]? on page 127 EVM PUSCH 64QAM Shows the EVM for all 64QAM-modulated resource elements of the PUSCH channel in the analyzed frame. FETCh:SUMMary:EVM:USSF[:AVERage]? on page 127 EVM DRMS PUSCH QPSK Shows the EVM of all DMRS resource elements with QPSK modulation of the PUSCH in the analyzed frame. FETCh:SUMMary:EVM:SDQP[:AVERage]? on page 125 User Manual 1308.9135.42 ─ 15 31 R&S®FS‑K101/103/105PC Measurements and Result Displays Numerical Results EVM DRMS PUSCH 16QAM Shows the EVM of all DMRS resource elements with 16QAM modulation of the PUSCH in the analyzed frame. FETCh:SUMMary:EVM:SDST[:AVERage]? on page 126 EVM DRMS PUSCH 64QAM Shows the EVM of all DMRS resource elements with 64QAM modulation of the PUSCH in the analyzed frame. FETCh:SUMMary:EVM:SDSF[:AVERage]? on page 125 EVM PUCCH Shows the EVM of all resource elements of the PUCCH channel in the analyzed frame. FETCh:SUMMary:EVM:UCCH[:AVERage]? on page 126 EVM DMRS PUCCH Shows the EVM of all DMRS resource elements of the PUCCH channel in the analyzed frame. FETCh:SUMMary:EVM:UCCD[:AVERage]? on page 126 EVM PRACH Shows the EVM of all resource elements of the PRACH channel in the analyzed frame. FETCh:SUMMary:EVM:UPRA[:AVERage]? on page 127 By default, all EVM results are in %. To view the EVM results in dB, change the EVM Unit. The second part of the table shows results that refer to a specifc selection of the frame. The statistic is always evaluated over the slots. The header row of the table contains information about the selection you have made (like the subframe). EVM All Shows the EVM for all resource elements in the analyzed frame. FETCh:SUMMary:EVM[:ALL][:AVERage]? on page 124 EVM Phys Channel Shows the EVM for all physical channel resource elements in the analyzed frame. A physical channel corresponds to a set of resource elements carrying information from higher layers. PUSCH, PUCCH and PRACH are physical channels. For more information see 3GPP 36.211. FETCh:SUMMary:EVM:PCHannel[:AVERage]? on page 125 EVM Phys Signal Shows the EVM for all physical signal resource elements in the analyzed frame. The reference signal is a physical signal. For more information see 3GPP 36.211. FETCh:SUMMary:EVM:PSIGnal[:AVERage]? on page 125 Frequency Error Shows the difference in the measured center frequency and the reference center frequency. FETCh:SUMMary:FERRor[:AVERage]? on page 128 Sampling Error Shows the difference in measured symbol clock and reference symbol clock relative to the system sampling rate. FETCh:SUMMary:SERRor[:AVERage]? on page 129 I/Q Offset Shows the power at spectral line 0 normalized to the total transmitted power. FETCh:SUMMary:IQOFfset[:AVERage]? on page 128 User Manual 1308.9135.42 ─ 15 32 R&S®FS‑K101/103/105PC Measurements and Result Displays Measuring the Power Over Time I/Q Gain Imbalance Shows the logarithm of the gain ratio of the Q-channel to the I-channel. FETCh:SUMMary:GIMBalance[:AVERage]? on page 128 I/Q Quadrature Error Shows the measure of the phase angle between Q-channel and I-channel deviating from the ideal 90 degrees. FETCh:SUMMary:QUADerror[:AVERage]? on page 129 Power Shows the average time domain power of the allocated resource blocks of the analyzed signal. FETCh:SUMMary:POWer[:AVERage]? on page 129 Crest Factor Shows the peak-to-average power ratio of captured signal. FETCh:SUMMary:CRESt[:AVERage]? on page 124 3.2 Measuring the Power Over Time This chapter contains information on all measurements that show the power of a signal over time. Capture Buffer...............................................................................................................33 Power vs Symbol x Carrier............................................................................................34 Time Alignment Error.................................................................................................... 34 Capture Buffer The Capture Buffer result display shows the complete range of captured data for the last data capture. The x-axis represents time. The maximum value of the x-axis is equal to the Capture Time. The y-axis represents the amplitude of the captured I/Q data in dBm (for RF input). The green bar at the bottom of the diagram represents the frame that is currently analyzed. A blue vertical line at the beginning of the green bar in the Capture Buffer display represents the subframe start. Additionally, the diagram contains the "Start Offset" value. This value is the time difference between the subframe start and capture buffer start. User Manual 1308.9135.42 ─ 15 33 R&S®FS‑K101/103/105PC Measurements and Result Displays Measuring the Power Over Time When you zoom into the diagram, you will see that the bar may be interrupted at certain positions. Each small bar indicates the useful parts of the OFDM symbol. Remote command: Selecting the result display: CALCulate<n>:FEED 'PVT:CBUF' Querying results: TRACe:DATA? Querying the subframe start offset: FETCh:SUMMary:TFRame? on page 130 Power vs Symbol x Carrier The Power vs Symbol x Carrier shows the power for each carrier in each symbol. The horizontal axis represents the symbols. The vertical axis represents the carriers. Different colors in the diagram area represent the power. The color map for the power levels is provided above the diagram area. Remote command: Selecting the result display: CALCulate<n>:FEED 'SPEC:PVSC' Querying results: TRACe:DATA? Time Alignment Error Starts the Time Alignment Error result display. The time alignment is an indicator of how well the transmission antennas in a MIMO system are synchronized. The Time Alignment Error is the time delay between a reference antenna (for example antenna 1) and another antenna. For more information see chapter 8.5, "Performing Time Alignment Measurements", on page 113. The software shows the results in a table. Each row in the table represents one antenna. The reference antenna is not shown. For each antenna the maximum, minimum and average time delay that has been measured is shown. The minimum and maximum results are calculated only if the measurement covers more than one subframe. If you perform the measurement on a system with carrier aggregation, each row represents one antenna. The number of lines increases because of multiple carriers. The reference antenna of the main component carrier (CC1) is not shown. In case of carrier aggregation, the result display also evaluates the frequency error of the component carrier (CC2) relative to the main component carrier (CC1). User Manual 1308.9135.42 ─ 15 34 R&S®FS‑K101/103/105PC Measurements and Result Displays Measuring the Error Vector Magnitude (EVM) In any case, results are only displayed if the transmission power of both antennas is within 15 dB of each other. Likewise, if only one antenna transmits a signal, results will not be displayed (for example if the cabling on one antenna is faulty). You can select the reference antenna via "Antenna Selection" in the MIMO Configuration. When you perform a time alignment measurement, the software also displays the Power Spectrum result display. Remote command: Selecting the result display: CALCulate<screenid>:FEED 'PVT:TAER' Querying results: FETCh:TAERror[:CC<cci>]:ANTenna<antenna>[:AVERage]? on page 130 Selecting reference antenna: CONFigure[:LTE]:UL:MIMO:ASELection on page 158 3.3 Measuring the Error Vector Magnitude (EVM) This chapter contains information on all measurements that show the error vector magnitude (EVM) of a signal. The EVM is one of the most important indicators for the quality of a signal. For more information on EVM calculation methods refer to chapter 8, "Measurement Basics", on page 102. EVM vs Carrier..............................................................................................................35 EVM vs Symbol.............................................................................................................36 EVM vs Sym x Carr.......................................................................................................37 EVM vs Subframe......................................................................................................... 38 EVM vs Carrier Starts the EVM vs Carrier result display. This result display shows the Error Vector Magnitude (EVM) of the subcarriers. With the help of a marker, you can use it as a debugging technique to identify any subcarriers whose EVM is too high. The results are based on an average EVM that is calculated over the resource elements for each subcarrier. This average subcarrier EVM is determined for each analyzed slot in the capture buffer. If you analyze all slots, the result display contains three traces. ● Average EVM This trace shows the subcarrier EVM averaged over all slots. ● Minimum EVM This trace shows the lowest (average) subcarrier EVM that has been found over the analyzed slots. ● Maximum EVM This trace shows the highest (average) subcarrier EVM that has been found over the analyzed slots. User Manual 1308.9135.42 ─ 15 35 R&S®FS‑K101/103/105PC Measurements and Result Displays Measuring the Error Vector Magnitude (EVM) If you select and analyze one slot only, the result display contains one trace that shows the subcarrier EVM for that slot only. Average, minimum and maximum values in that case are the same. For more information see "Subframe Selection" on page 59 The x-axis represents the center frequencies of the subcarriers. On the y-axis, the EVM is plotted either in % or in dB, depending on the EVM Unit. Remote command: Selecting the result display: CALCulate<n>:FEED 'EVM:EVCA' Querying results: TRACe:DATA? EVM vs Symbol Starts the EVM vs Symbol result display. This result display shows the Error Vector Magnitude (EVM) of the OFDM symbols. You can use it as a debugging technique to identify any symbols whose EVM is too high. The results are based on an average EVM that is calculated over all subcarriers that are part of a particular OFDM symbol. This average OFDM symbol EVM is determined for all OFDM symbols in each analyzed slot. If you analyze all subframes, the result display contains three traces. ● Average EVM This trace shows the OFDM symbol EVM averaged over all slots. ● Minimum EVM This trace shows the lowest (average) OFDM symbol EVM that has been found over the analyzed slots. ● Maximum EVM This trace shows the highest (average) OFDM symbol EVM that has been found over the analyzed slots. If you select and analyze one slot only, the result display contains one trace that shows the OFDM symbol EVM for that slot only. Average, minimum and maximum values in that case are the same. For more information see "Subframe Selection" on page 59 User Manual 1308.9135.42 ─ 15 36 R&S®FS‑K101/103/105PC Measurements and Result Displays Measuring the Error Vector Magnitude (EVM) The x-axis represents the OFDM symbols, with each symbol represented by a dot on the line. The number of displayed symbols depends on the Subframe Selection and the length of the cyclic prefix. Any missing connections from one dot to another mean that the analyzer could not determine the EVM for that symbol. In case of TDD signals, the result display does not show OFDM symbols that are not part of the measured link direction. On the y-axis, the EVM is plotted either in % or in dB, depending on the EVM Unit. Remote command: Selecting the result display: CALCulate<n>:FEED 'EVM:EVSY' Querying results: TRACe:DATA? EVM vs Sym x Carr The EVM vs Symbol x Carrier shows the EVM for each carrier in each symbol. The horizontal axis represents the symbols. The vertical axis represents the carriers. Different colors in the diagram area represent the EVM. The color map for the power levels is provided above the diagram area. Remote command: Selecting the result display: CALCulate<n>:FEED 'EVM:EVSC' Querying results: TRACe:DATA? User Manual 1308.9135.42 ─ 15 37 R&S®FS‑K101/103/105PC Measurements and Result Displays Measuring the Spectrum EVM vs Subframe Starts the EVM vs Subframe result display. This result display shows the Error Vector Magnitude (EVM) for each subframe. You can use it as a debugging technique to identify a subframe whose EVM is too high. The result is an average over all subcarriers and symbols of a specific subframe. The x-axis represents the subframes, with the number of displayed subframes being 10. On the y-axis, the EVM is plotted either in % or in dB, depending on the EVM Unit. Remote command: Selecting the result display: CALCulate<n>:FEED 'EVM:EVSU' Querying results: TRACe:DATA? 3.4 Measuring the Spectrum This chapter contains information on all measurements that show the power of a signal in the frequency domain. In addition to the I/Q measurements, spectrum measurements also include two frequency sweep measurements, the Spectrum Emission Mask and the Adjacent Channel Leakage Ratio. 3.4.1 Frequency Sweep Measurements The Spectrum Emission Mask (SEM) and Adjacent Channel Leakage Ratio (ACLR) measurements are the only frequency sweep measurements available for the EUTRA/LTE measurement software. They do not use the I/Q data all other measurements use. Instead those measurements sweep the frequency spectrum every time you run a new measurement. Therefore it is not possible to to run an I/Q measurement and then view the results in the frequency sweep measurements and vice-versa. Also because each of the frequency sweep measurements uses different settings to obtain signal data it is not possible to run a frequency sweep measurement and view the results in another frequency sweep measurement. User Manual 1308.9135.42 ─ 15 38 R&S®FS‑K101/103/105PC Measurements and Result Displays Measuring the Spectrum Frequency sweep measurements are available if RF input is selected. Note that unwanted emissions measurements (for example the ACLR) are not supported for measurements with an oscilloscope. Spectrum Mask............................................................................................................. 39 ACLR.............................................................................................................................40 Spectrum Mask Starts the Spectrum Emission Mask (SEM) result display. The Spectrum Emission Mask measurement shows the quality of the measured signal by comparing the power values in the frequency range near the carrier against a spectral mask that is defined by the 3GPP specifications. In this way, you can test the performance of the DUT and identify the emissions and their distance to the limit. In the diagram, the SEM is represented by a red line. If any measured power levels are above that limit line, the test fails. If all power levels are inside the specified limits, the test is passed. The software labels the limit line to indicate whether the limit check has passed or failed. The x-axis represents the frequency with a frequency span that relates to the specified EUTRA/LTE channel bandwidths. On the y-axis, the power is plotted in dBm. The result display also contains some numerical results for the SEM measurement, for example the total signal power or the limit check result. A table above the result display contains the numerical values for the limit check at each check point: ● ● ● ● Start / Stop Freq Rel Shows the start and stop frequency of each section of the Spectrum Mask relative to the center frequency. RBW Shows the resolution bandwidth of each section of the Spectrum Mask Freq at Δ to Limit Shows the absolute frequency whose power measurement being closest to the limit line for the corresponding frequency segment. Power Abs Shows the absolute measured power of the frequency whose power is closest to the limit. The software evaluates this value for each frequency segment. User Manual 1308.9135.42 ─ 15 39 R&S®FS‑K101/103/105PC Measurements and Result Displays Measuring the Spectrum ● ● Power Rel Shows the distance from the measured power to the limit line at the frequency whose power is closest to the limit. The software evaluates this value for each frequency segment. Δ to Limit Shows the minimal distance of the tolerance limit to the SEM trace for the corresponding frequency segment. Negative distances indicate the trace is below the tolerance limit, positive distances indicate the trace is above the tolerance limit. Remote command: Selecting the result display: CALCulate<n>:FEED 'SPEC:SEM' Querying results: TRACe:DATA? ACLR Starts the Adjacent Channel Leakage Ratio (ACLR) measurement. The ACLR measurement analyzes the power of the transmission (TX) channel and the power of the two neighboring channels (adjacent channels) to the left and right of the TX channel. Thus, the ACLR measurement provides information about the power in the adjacent channels as well as the leakage into these adjacent channels. The x-axis represents the frequency with a frequency span that relates to the specified EUTRA/LTE channel and adjacent channel bandwidths. On the y-axis, the power is plotted in dBm. By default the ACLR settings are based on the selected LTE Channel Bandwidth. You can change the assumed adjacent channel carrier type and the Noise Correction. User Manual 1308.9135.42 ─ 15 40 R&S®FS‑K101/103/105PC Measurements and Result Displays Measuring the Spectrum The software provides a relative and an absolute ACLR measurement mode that you can select with the "ACLR (REL ABS)" softkey. ● In case of the relative measurement mode, the power for the TX channel is an absolute value in dBm. The power of the adjacent channels are values relative to the power of the TX channel. ● In case of the absolute measurement mode, the power for both TX and adjacent channels are absolute values in dBm. In addition, the ACLR measurement results are also tested against the limits defined by 3GPP. In the diagram, the limits are represented by horizontal red lines. ACLR table A table above the result display contains information about the measurement in numerical form: ● ● ● ● Channel Shows the channel type (TX, Adjacent or Alternate Channel). Bandwidth Shows the bandwidth of the channel. Spacing Shows the channel spacing. Channel Power Shows the absolute or relative power of the corresponding channel. Remote command: Selecting the result display: CALCulate<n>:FEED 'SPEC:ACP' Querying results: CALCulate<n>:MARKer<m>:FUNCtion:POWer:RESult[:CURRent]? TRACe:DATA? Querying limit check results: CALCulate<n>:LIMit<k>:ACPower:ACHannel:RESult? on page 140 CALCulate<n>:LIMit<k>:ACPower:ALTernate:RESult? on page 141 CALCulate<n>:LIMit<k>:FAIL? on page 141 3.4.2 I/Q Measurements Power Spectrum............................................................................................................42 Inband Emission............................................................................................................42 Spectrum Flatness........................................................................................................ 43 User Manual 1308.9135.42 ─ 15 41 R&S®FS‑K101/103/105PC Measurements and Result Displays Measuring the Spectrum Spectrum Flatness SRS................................................................................................44 Spectrum Flatness Difference.......................................................................................44 Channel Group Delay....................................................................................................45 Power Spectrum Starts the Power Spectrum result display. This result display shows the power density of the complete capture buffer in dBm/Hz. The displayed bandwidth depends on bandwidth or number of resource blocks you have set. For more information see "Channel Bandwidth / Number of Resource Blocks" on page 75. The x-axis represents the frequency. On the y-axis the power level is plotted. Remote command: Selecting the result display: CALCulate<screenid>:FEED 'SPEC:PSPE' Querying results: TRACe:DATA? Inband Emission Starts the Inband Emission result display. This result display shows the relative power of the unused resource blocks (yellow trace) and the inband emission limit lines (red trace) specified by the LTE standard document 3GPP TS36.101. The measurement is evaluated over the currently selected slot in the currently selected subframe. The currently selected subframe depends on your selection. Note that you have to select a specific subframe and slot to get valid measurement results. User Manual 1308.9135.42 ─ 15 42 R&S®FS‑K101/103/105PC Measurements and Result Displays Measuring the Spectrum You can also display the inband emissions for the allocated resource block in addition to the unused resource blocks when you select the Inband Emissions All result display. Remote command: Selecting the result display: CALCulate<screenid>:FEED 'SPEC:IE' Selecting the result display: CALCulate<screenid>:FEED 'SPEC:IEA' Qurying results: TRACe:DATA? Spectrum Flatness Starts the Spectrum Flatness result display. This result display shows the relative power offset caused by the transmit channel. The measurement is evaluated over the currently selected slot in the currently selected subframe. The currently selected subframe depends on your selection. The x-axis represents the frequency. On the y-axis, the channel flatness is plotted in dB. User Manual 1308.9135.42 ─ 15 43 R&S®FS‑K101/103/105PC Measurements and Result Displays Measuring the Spectrum Note that the limit lines are only displayed if you match the Operating Band to the center frequency. Limits are defined for each operating band in the standard. The shape of the limit line is different when "Extreme Conditions" on page 66 are on. Remote command: Selecting the result display: CALCulate<n>:FEED 'SPEC:SFL' Querying results: TRACe:DATA? Spectrum Flatness SRS The Spectrum Flatness SRS display shows the amplitude of the channel transfer function based on the sounding reference signal. The measurement is evaluated over the currently selected slot in the currently selected subframe. The slot and subframe selection may be changed in the general settings. Remote command: Selecting the result display: CALCulate<n>:FEED 'SPEC:SFSR' Querying results: TRACe:DATA Spectrum Flatness Difference Starts the Spectrum Flatness Difference result display. This result display shows the level difference in the spectrum flatness result between two adjacent physical subcarriers. User Manual 1308.9135.42 ─ 15 44 R&S®FS‑K101/103/105PC Measurements and Result Displays Measuring the Spectrum The measurement is evaluated over the currently selected slot in the currently selected subframe. The currently selected subframe depends on your selection. The x-axis represents the frequency. On the y-axis, the power is plotted in dB. Remote command: Selecting the result display: CALCulate<n>:FEED 'SPEC:SFD' Querying results: TRACe:DATA? Channel Group Delay Starts the Channel Group Delay result display. This result display shows the group delay of each subcarrier. The measurement is evaluated over the currently selected slot in the currently selected subframe. The currently selected subframe depends on your selection. The x-axis represents the frequency. On the y-axis, the group delay is plotted in ns. Remote command: Selecting the result display: CALCulate<n>:FEED 'SPEC:GDEL' Querying results: TRACe:DATA? User Manual 1308.9135.42 ─ 15 45 R&S®FS‑K101/103/105PC Measurements and Result Displays Measuring the Symbol Constellation 3.5 Measuring the Symbol Constellation This chapter contains information on all measurements that show the constellation of a signal. Constellation Diagram...................................................................................................46 DFT Precod Constellation............................................................................................. 46 Evaluation Range for the Constellation Diagram.......................................................... 47 Constellation Diagram Starts the Constellation Diagram result display. This result display shows the inphase and quadrature phase results and is an indicator of the quality of the modulation of the signal. In the default state, the result display evaluates the full range of the measured input data. You can filter the results in the Constellation Selection dialog box. The ideal points for the selected modulation scheme are displayed for reference purposes. The constellation diagram also contains information about the current evaluation range. In addition, it shows the number of points that are displayed in the diagram. Remote command: Selecting the result display: CALCulate<n>:FEED 'CONS:CONS' Querying results: TRACe:DATA? DFT Precod Constellation Starts the DFT Precod Constellation result display. This result display shows the inphase and quadrature phase results. It shows the data without the DFT precoding. The result display evaluates the full range of the measured input data. You can filter the results in the Constellation Selection dialog box. User Manual 1308.9135.42 ─ 15 46 R&S®FS‑K101/103/105PC Measurements and Result Displays Measuring the Symbol Constellation Remote command: Selecting the result display: CALCulate<screenid>:FEED 'CONS:DFTC' Evaluation Range for the Constellation Diagram The "Evaluation Range" dialog box defines the type of constellation points that are displayed in the Constellation Diagram. By default the software displays all constellation points of the data that have been evaluated. However, you can filter the results by several aspects. ● ● ● ● Modulation Filters the results to include only the selected type of modulation. Allocation Filters the results to include only a particular type of allocation. Symbol Filters the results to include only a particular OFDM symbol. Carrier Filters the results to include only a particular subcarrier. The result display is updated as soon as you make the changes. Note that the constellation selection is applied to all windows in split screen mode if the windows contain constellation diagrams. Remote command: not supported User Manual 1308.9135.42 ─ 15 47 R&S®FS‑K101/103/105PC Measurements and Result Displays Measuring Statistics 3.6 Measuring Statistics This chapter contains information on all measurements that show the statistics of a signal. CCDF............................................................................................................................ 48 Allocation Summary...................................................................................................... 48 Bit Stream..................................................................................................................... 49 CCDF Starts the Complementary Cumulative Distribution Function (CCDF) result display. This result display shows the probability of an amplitude exceeding the mean power. For the measurement, the complete capture buffer is used. The x-axis represents the power relative to the measured mean power. On the y-axis, the probability is plotted in %. Remote command: Selecting the result display: CALCulate<n>:FEED 'STAT:CCDF' Querying results: TRACe:DATA? Allocation Summary Starts the Allocation Summary result display. This result display shows the results of the measured allocations in tabular form. User Manual 1308.9135.42 ─ 15 48 R&S®FS‑K101/103/105PC Measurements and Result Displays Measuring Statistics The rows in the table represent the allocations. A set of allocations form a subframe. The subframes are separated by a dashed line. The columns of the table contain the follwing information: ● ● ● ● ● ● ● Subframe Shows the subframe number. Allocation ID Shows the type / ID of the allocation. Number of RB Shows the number of resource blocks assigned to the current PDSCH allocation. Offset RB Shows the resource block offset of the allocation. Modulation Shows the modulation type. Power Shows the power of the allocation in dBm. EVM Shows the EVM of the allocation. The unit depends on your selection. Remote command: Selecting the result display: CALCulate<n>:FEED 'STAT:ASUM' Querying results: TRACe:DATA? Bit Stream Starts the Bit Stream result display. This result display shows the demodulated data stream for each data allocation. Depending on the Bit Stream Format, the numbers represent either bits (bit order) or symbols (symbol order). Selecting symbol format shows the bit stream as symbols. In that case the bits belonging to one symbol are shown as hexadecimal numbers with two digits. In the case of bit format, each number represents one raw bit. Symbols or bits that are not transmitted are represented by a "-". If a symbol could not be decoded because the number of layers exceeds the number of receive antennas, the application shows a "#" sign. User Manual 1308.9135.42 ─ 15 49 R&S®FS‑K101/103/105PC Measurements and Result Displays 3GPP Test Scenarios The table contains the following information: ● ● ● ● ● ● Subframe Number of the subframe the bits belong to. Allocation ID Channel the bits belong to. Codeword Code word of the allocation. Modulation Modulation type of the channels. Symbol Index or Bit Index Shows the position of the table row's first bit or symbol within the complete stream. Bit Stream The actual bit stream. Remote command: Selecting the result display: CALCulate<n>:FEED 'STAT:BSTR' Querying results: TRACe:DATA? 3.7 3GPP Test Scenarios 3GPP defines several test scenarios for measuring user equipment. These test scenarios are described in detail in 3GPP TS 36.521-1. The following table provides an overview which measurements available in the LTE software are suited to use for the test scenarios in the 3GPP documents. Table 3-1: Test scenarios for E-TMs as defined by 3GPP (3GPP TS 36.521-1) Test scenario Test described in Measurement UE Maximum Output Power chapter 6.2.2 Power (➙ Result Summary) Maximum Power Reduction chapter 6.2.3 Power (➙ Result Summary) Additional Maximum Power Reduction chapter 6.2.4 Power (➙ Result Summary) User Manual 1308.9135.42 ─ 15 50 R&S®FS‑K101/103/105PC Measurements and Result Displays 3GPP Test Scenarios Test scenario Test described in Measurement Configured UE-transmitted Output Power chapter 6.2.5 Power (➙ Result Summary) Minimum Output Power chapter 6.3.2 Power (➙ Result Summary) Transmit Off Power chapter 6.3.3 n/a On/Off Time Mask chapter 6.3.4 n/a Power Control chapter 6.3.5 n/a Frequency Error chapter 6.5.1 Frequency Error (➙ Result Summary) Transmit Modulation chapter 6.5.2.1 EVM results chapter 6.5.2.2 I/Q Offset (➙ Result Summary) chapter 6.5.2.3 Inband Emission chapter 6.5.2.4 Spectrum Flatness Occupied Bandwidth chapter 6.6.1 Occupied Bandwidth1 Out of Band Emission chapter 6.6.2.1 Spectrum Emission Mask chapter 6.6.2.2 Spectrum Emission Mask chapter 6.6.2.3 ACLR chapter 6.6.3.1 Spurious Emissions1 chapter 6.6.3.2 Spurious Emissions1 chapter 6.6.3.3 Spurious Emissions1 Transmit Intermodulation chapter 6.7 ACLR Time Alignment chapter 6.8 Time Alignment Spurious Emissions 1these measurements are available in the Spectrum application of the Rohde & Schwarz signal and spectrum analyzers (for example the R&S FSW) User Manual 1308.9135.42 ─ 15 51 R&S®FS‑K101/103/105PC General Settings Configuring the Measurement 4 General Settings The following chapter contains all settings that are available in the "General Settings" dialog box. ● ● ● ● ● Configuring the Measurement.................................................................................52 Configuring MIMO Measurement Setups................................................................61 Triggering Measurements....................................................................................... 63 Spectrum Settings...................................................................................................64 Advanced Settings.................................................................................................. 66 4.1 Configuring the Measurement The general settings contain various settings that configure the general measurement setup. You can find the signal characteristics in the "General Settings" dialog box. ● ● ● ● ● ● Defining General Signal Characteristics................................................................. 52 Configuring the Input...............................................................................................53 Configuring the Input Level..................................................................................... 54 Configuring the Data Capture................................................................................. 56 Configuring Measurement Results..........................................................................58 Configuring Time Alignment Measurements........................................................... 61 4.1.1 Defining General Signal Characteristics The general signal characteristics contain settings to describe the general physical attributes of the signal. The signal characteristics are part of the "General Settings" tab of the "General Settings" dialog box. Selecting the LTE Mode................................................................................................52 Defining the Signal Frequency...................................................................................... 53 Selecting the LTE Mode The LTE mode is a combination of the "Standard" (always 3GPP LTE), the "Duplexing" mode and the "Link Direction". The choices you have depend on the set of options you have installed. ● option FSx-K100(PC) enables testing of 3GPP LTE FDD signals on the downlink User Manual 1308.9135.42 ─ 15 52 R&S®FS‑K101/103/105PC General Settings Configuring the Measurement ● ● ● ● ● option FSx-K101(PC) enables testing of 3GPP LTE FDD signals on the uplink option FSx-K102(PC) enables testing of 3GPP LTE MIMO signals on the downlink option FSx-K103(PC) enables testing of 3GPP MIMO signals on the uplink option FSx-K104(PC) enables testing of 3GPP LTE TDD signals on the downlink option FSx-K105(PC) enables testing of 3GPP LTE TDD signals on the uplink FDD and TDD are duplexing methods. ● FDD mode uses different frequencies for the uplink and the downlink. ● TDD mode uses the same frequency for the uplink and the downlink. Downlink (DL) and Uplink (UL) describe the transmission path. ● Downlink is the transmission path from the base station to the user equipment. The physical layer mode for the downlink is always OFDMA. Uplink is the transmission path from the user equipment to the base station. The ● physical layer mode for the uplink is always SC-FDMA. The software shows the currently selected LTE mode (including the bandwidth) in the header table. Remote command: Link direction: CONFigure[:LTE]:LDIRection on page 151 Duplexing mode: CONFigure[:LTE]:DUPLexing on page 150 Defining the Signal Frequency For measurements with an RF input source, you have to match the center frequency of the analyzer to the frequency of the signal. The software shows the current center frequency in the header table. The available frequency range depends on the hardware configuration of the analyzer you are using. Remote command: Center frequency: [SENSe]:FREQuency:CENTer[:CC<cci>] on page 151 4.1.2 Configuring the Input The input settings control the basic configuration of the input. The input source selection is part of the "General Settings" tab of the "General Settings" dialog box. For more information on advanced input configuration see chapter 4.5, "Advanced Settings", on page 66. Selecting the Input Source............................................................................................ 54 User Manual 1308.9135.42 ─ 15 53 R&S®FS‑K101/103/105PC General Settings Configuring the Measurement Selecting the Input Source The input source selects the source of the data you'd like to analyze. You can either analyze a live signal or a signal that has been recorded previously and whose characteristics have been saved to a file. You can select the input source from the "Source" dropdown menu. ● ● ● ● RF Captures and analyzes the data from the RF input of the spectrum analyzer in use. Baseband (BB) Captures and analyzes the data from the baseband input of the spectrum analyzer in use. Note that you have to use an analyzer that supports analog baseband input if you select that input source. Digital I/Q Captures and analyzes the data from the digital baseband input of the spectrum analyzer in use. Note that you have to use an analyzer that supports digital baseband input if you select that input source. File Analyzes data that has been recorded already and has been saved to a file. If selected, the software asks you to select a file from a dialog box after you have initiated a measurement. If the file contents are not valid or the file could not be found, the software shows an error message. A connection to an analyzer or a dongle is required to successfully load a file. For more information see chapter 7.1, "Importing and Exporting I/Q Data", on page 98. Remote command: Input source selection: SENSe:INPut on page 151 Loading I/Q data from file: MMEMory:LOAD:IQ:STATe on page 190 4.1.3 Configuring the Input Level The level settings contain settings that control the input level of any analyzer in the measurement setup. You can control the input level for any of the input channels you are using separately from the dropdown menu next to the "Level Settings" label. The level settings are part of the "General Settings" tab of the "General Settings" dialog box. User Manual 1308.9135.42 ─ 15 54 R&S®FS‑K101/103/105PC General Settings Configuring the Measurement Defining a Reference Level...........................................................................................55 Attenuating the Signal................................................................................................... 56 Defining a Reference Level The reference level is the power level the analyzer expects at the RF input. Keep in mind that the power level at the RF input is the peak envelope power in case of signals with a high crest factor like LTE. To get the best dynamic range, you have to set the reference level as low as possible. At the same time, make sure that the maximum signal level does not exceed the reference level. If it does, it will overload the A/D converter, regardless of the signal power. Measurement results may deteriorate (e.g. EVM). This applies especially for measurements with more than one active channel near the one you are trying to measure (± 6 MHz). Note that the signal level at the A/D converter may be stronger than the level the application displays, depending on the current resolution bandwidth. This is because the resolution bandwidths are implemented digitally after the A/D converter. You can either specify the RF Reference Level (in dBm) or Baseband Reference Level (in V), depending on the input source. You can also use automatic detection of the reference level with the "Auto Level" function. If active, the software measures and sets the reference level to its ideal value before each sweep. This process slightly increases the measurement time. You can define the measurement time of that measurement with the Auto Level Track Time (➙ "Advanced" tab). Automatic level detection also optimizes RF attenuation. Automatic level detection is available for an RF input source. The software shows the current reference level of the first input channel (including RF and external attenuation) in the header table. Remote command: Manual (RF): CONFigure:POWer:EXPected:RF<instrument> on page 152 Manual (BB): CONFigure:POWer:EXPected:IQ<instrument> on page 152 Automatic: [SENSe]:POWer:AUTO<instrument>[:STATe] on page 152 Auto Level Track Time: [SENSe]:POWer:AUTO<instrument>:TIME on page 166 User Manual 1308.9135.42 ─ 15 55 R&S®FS‑K101/103/105PC General Settings Configuring the Measurement Attenuating the Signal Attenuation of the signal may become necessary if you have to reduce the power of the signal that you have applied. Power reduction is necessary, for example, to prevent an overload of the input mixer. You can attenuate the signal at the RF input of one of the analyzers in the measurement setup (mechanical or RF attenuation) or attenuate the signal externally (external attenuation). If you attenuate or amplify the signal either way, the software adjusts the numeric and graphical results accordingly. In case of graphical power result displays, it moves the trace(s) vertically by the specified value. Positive values correspond to an attenuation and negative values correspond to an amplification. The range of the RF attenuation depends on the hardware you are using in the measurement setup. For details refer to its data sheet. If the attenuation you have set is not supported by the hardware, the software corrects the attenuation and shows a corresponding message. The software shows the RF and external attenuation level in the header table next to the reference level. Remote command: RF attenuation: INPut<n>:ATTenuation<instrument> on page 153 External attenuation: DISPlay[:WINDow<n>]:TRACe<t>:Y[:SCALe]:RLEVel: OFFSet on page 153 4.1.4 Configuring the Data Capture The data capture settings contain settings that control the amount of data and the way that the software records the LTE signal. The data capture settings are part of the "General Settings" tab of the "General Settings" dialog box. Capture Time................................................................................................................ 56 Overall Frame Count.....................................................................................................57 Number of Frames to Analyze...................................................................................... 57 Auto According to Standard.......................................................................................... 57 Capture Time Defines the capture time. User Manual 1308.9135.42 ─ 15 56 R&S®FS‑K101/103/105PC General Settings Configuring the Measurement The capture time corresponds to the time of one sweep. Hence, it defines the amount of data the software captures during one sweep. By default, the software captures 20.1 ms of data to make sure that at least one complete LTE frame is captured in one sweep. The software shows the current capture time (including the frame number) in the header table. Remote command: [SENSe]:SWEep:TIME on page 153 Overall Frame Count Turns the manual selection of the number of frames to capture (and analyze) on and off. If the overall frame count is active, you can define a particular number of frames to capture and analyze. The measurement runs until all required frames have been analyzed, even if it takes more than one sweep. The results are an average of the captured frames. If the overall frame count is inactive, the analyzer analyzes all complete LTE frames currently in the capture buffer. Remote command: [SENSe][:LTE]:FRAMe:COUNt:STATe on page 153 Number of Frames to Analyze Sets the number of frames that you want to capture and analyze. If the number of frames you have set last longer than a single sweep, the analyzer continues the measurement until all frames have been captured. The parameter is read only if ● ● the overall frame count is inactive, the data is captured according to the standard. Remote command: [SENSe][:LTE]:FRAMe:COUNt on page 154 Auto According to Standard Turns automatic selection of the number of frames to capture and analyze on and off. If active, the analyzer evaluates the number of frames as defined for EVM tests in the LTE standard. If inactive, you can set the number of frames you want to analyze. This parameter is not available if the overall frame count is inactive. Remote command: [SENSe][:LTE]:FRAMe:COUNt:AUTO on page 154 User Manual 1308.9135.42 ─ 15 57 R&S®FS‑K101/103/105PC General Settings Configuring the Measurement 4.1.5 Configuring Measurement Results The measurement result settings contain settings that define certain aspects of the results that are displayed. The result settings are part of the "General Settings" tab of the "General Settings" dialog box. EVM Unit....................................................................................................................... 58 Bit Stream Format......................................................................................................... 58 Carrier Axes.................................................................................................................. 59 Subframe Selection.......................................................................................................59 Slot Selection................................................................................................................ 60 Preamble Selection....................................................................................................... 60 Antenna Selection......................................................................................................... 60 EVM Unit Selects the unit for graphic and numerical EVM measurement results. Possible units are dB and %. Remote command: UNIT:EVM on page 155 Bit Stream Format Selects the way the bit stream is displayed. The bit stream is either a stream of raw bits or of symbols. In case of the symbol format, the bits that belong to a symbol are shown as hexadecimal numbers with two digits. Examples: Fig. 4-1: Bit stream display in uplink application if the bit stream format is set to "symbols" User Manual 1308.9135.42 ─ 15 58 R&S®FS‑K101/103/105PC General Settings Configuring the Measurement Fig. 4-2: Bit stream display in uplink application if the bit stream format is set to "bits" Remote command: UNIT:BSTR on page 155 Carrier Axes Selects the scale of the x-axis for result displays that show results of OFDM subcarriers. ● X-axis shows the frequency of the subcarrier ● X-axis shows the number of the subcarrier Remote command: UNIT:CAXes on page 155 Subframe Selection Selects a particular subframe whose results the software displays. You can select a particular subframe for the following measurements. Result Summary, EVM vs. Carrier, EVM vs. Symbol, EVM vs. Symbol x Carrier, Inband Emission, Channel Flatness, Spectrum Flatness SRS, Channel Group Delay, Spectrum Flatness Difference, Power vs Symbol x Carrier, Constellation Diagram, DFT Precoded Constellation, Allocation Summary, Bit Stream and Time Alignment. If ---All--- is selected, either the results from all subframes are displayed at once or a statistic is calculated over all analyzed subframes. Selecting a subframe is not possible in PRACH analysis mode. Selecting "All" either displays the results over all subframes or calculates a statistic over all subframes that have been analyzed. User Manual 1308.9135.42 ─ 15 59 R&S®FS‑K101/103/105PC General Settings Configuring the Measurement Example: Subframe selection If you select all subframes ("All"), the software shows three traces. One trace shows the subframe with the minimum level characteristics, the second trace shows the subframe with the maximum level characteristics and the third subframe shows the averaged level characteristics of all subframes. ● ● ● PK: peak value AV: average value MI: minimum value If you select a specific subframe, the software shows one trace. This trace contains the results for that subframe only. Remote command: [SENSe][:LTE]:SUBFrame:SELect on page 156 Slot Selection Selects a particular slot whose measurement results you want to see. You can select a particular slot for the following measurements. Result Summary, EVM vs Carrier, EVM vs Symbol, EVM vs Symbol x Carrier, Inband Emission, Channel Flatness, Spectrum Flatness SRS, Channel Group Delay, Spectrum Flatness Difference, Power vs Symbol x Carrier, Constellation Diagram, DFT Precoded Constellation Diagram and Time Alignment. In PRACH analysis mode, you can not select a particular slot. Remote command: [SENSe][:LTE]:SLOT:SELect on page 156 Preamble Selection Selects a particular preamble for measurements that analyze individual preambles. Selecting preambles is available in PRACH analysis mode. Remote command: [SENSe][:LTE]:PREamble:SELect on page 156 Antenna Selection Selects the antenna you want to display the results for. User Manual 1308.9135.42 ─ 15 60 R&S®FS‑K101/103/105PC General Settings Configuring MIMO Measurement Setups For more information see "MIMO Configuration" on page 62. Remote command: [SENSe][:LTE]:ANTenna:SELect on page 155 4.1.6 Configuring Time Alignment Measurements The Time Alignment measurement settings contain settings that define certain aspects of this measurement. The Time Alignment measurement settings are part of the "General Settings" tab of the "General Settings" dialog box. Carrier Aggregation.......................................................................................................61 Carrier Aggregation The software supports Time Alignment Error measurements with carrier aggregation. Select the number of carriers from the "Number of Component Carriers" dropdown menu. If you select more than one carrier, define the frequency of the other carrier in the "CC2 Frequency" field. The "CC2 Demod Settings" button opens a dialog box to configure the signal characteristics of the second carrier. This dialog contains a selection of the demodulation settings. For more information see chapter 5, "Demod Settings", on page 71. Note that the software shows measurement results for the second component carrier even if only one antenna of the second component carrier is attached (i.e. no combiner is used). Remote command: CONFigure:NOCC on page 157 [SENSe]:FREQuency:CENTer[:CC<cci>] on page 151 CC2 Demod settings: see chapter 9.8, "Remote Commands to Configure the Demodulation", on page 167 4.2 Configuring MIMO Measurement Setups The MIMO settings contain settings to configure a MIMO test setup and control the instruments in that test setup. User Manual 1308.9135.42 ─ 15 61 R&S®FS‑K101/103/105PC General Settings Configuring MIMO Measurement Setups The MIMO settings are part of the "Analyzer Config / MIMO Setup" tab of the "General Settings" dialog box. MIMO Configuration...................................................................................................... 62 MIMO Analyzer Configuration....................................................................................... 62 MIMO Configuration Selects the antenna configuration and test conditions for a MIMO system. The MIMO configuration selects the number of transmit antennas for selected channels in the system. MIMO configurations are supported for the PUSCH, the PUCCH and the Sounding Reference Signal (SRS). For each channel you can select from a 1-, 2- or 4-antenna configuration. In setups with multiple antennas, the antenna selection defines the antenna you'd like to test. Note that as soon as you have selected a transmission on more than one antenna for one of the channels, the corresponding number of antennas becomes available for testing. Antenna 1 Tests antenna 1 only. Antenna 2 Tests antenna 2 only. Antenna 3 Tests antenna 3 only. Antenna 4 Tests antenna 4 only. All Tests all antennas in the test setup in consecutive order (1-2-3-4). A corresponding number of analyzers is required. Remote command: CONFigure[:LTE]:UL:MIMO:SRS:CONFig on page 159 CONFigure[:LTE]:UL:MIMO:PUCCh:CONFig on page 159 CONFigure[:LTE]:UL:MIMO:PUSCh:CONFig on page 159 CONFigure[:LTE]:UL:MIMO:ASELection on page 158 MIMO Analyzer Configuration For a comprehensive description see chapter 2.3, "Connecting the Computer to an Analyzer", on page 17. User Manual 1308.9135.42 ─ 15 62 R&S®FS‑K101/103/105PC General Settings Triggering Measurements 4.3 Triggering Measurements The trigger settings contain settings that control triggered measurements. You can select a trigger for any of the four possible analyzers in the measurement setup separately by selecting one of the analyzers from the dropdown menu next to the "Trigger Settings" label. The trigger settings are part of the "General Settings" tab of the "General Settings" dialog box. Configuring the Trigger A trigger allows you to capture those parts of the signal that you are really interested in. While the software runs freely and analyzes all signal data in its default state, no matter if the signal contains information or not, a trigger initiates a measurement only under certain circumstances (the trigger event). The software supports several trigger modes or sources. ● ● ● ● Free Run Starts the measurement immediately and measures continuously. External The trigger event is the level of an external trigger signal. The measurement starts when this signal meets or exceeds a specified trigger level at the "Ext Trigger/ Gate" input. Some measurement devices have several trigger ports. When you use one of these, you can additionally select the trigger port (1 to 3) you want to use. IF Power The trigger event is the IF power level. The measurement starts when the IF power meets or exceeds a specified power trigger level. Trigger Unit FS-Z11 The R&S FS-Z11 is a trigger unit designed to control triggers in MIMO measurement setups. Note that the trigger unit is not compatible with oscilloscope measurements. For more information see "Measurements with the R&S FS-Z11 trigger unit" on page 110 and the documentation of the R&S FS-Z11. You can define a power level for an external and an IF power trigger. For most trigger sources you can select the trigger slope. The trigger slope defines whether triggering occurs when the signal rises to the trigger level or falls down to it. User Manual 1308.9135.42 ─ 15 63 R&S®FS‑K101/103/105PC General Settings Spectrum Settings The measurement starts as soon as the trigger event happens. It may become necessary to start the measurement some time after the trigger event. In that case, define a trigger offset (or trigger delay). The trigger offset is the time that should pass between the trigger event and the start of the measurement. The trigger offset may be a negative time. The trigger offset is then called a pretrigger. The trigger offset is available for all trigger modes, except free run. Remote command: For a comprehensive list of commands to define trigger characteristics see chapter 9.7.3, "Using a Trigger", on page 160. 4.4 Spectrum Settings The spectrum settings contain settings to configure frequency sweep measurements (ACLR and SEM). You can find the spectrum settings in the "General Settings" dialog box. 4.4.1 Configuring SEM and ACLR Measurements The SEM (Spectrum Emission Mask) and ACLR (Adjacent Channel Leakage Ratio) settings contain settings that define aspects of those measurements. The SEM and ACLR settings are part of the "Spectrum" tab of the "General Settings" dialog box. Number of TX Channels................................................................................................64 SEM Requirement.........................................................................................................65 Assumed Adjacent Channel Carrier..............................................................................65 Noise Correction........................................................................................................... 65 Auto Gating................................................................................................................... 65 Number of TX Channels The software allows you to perform ACLR and SEM measurements on systems that support carrier aggregation. Measurements on one or two TX channels are supported. For the second TX channel, you can select the bandwidths as defined by 3GPP. For more information see "Channel Bandwidth / Number of Resource Blocks" on page 75. User Manual 1308.9135.42 ─ 15 64 R&S®FS‑K101/103/105PC General Settings Spectrum Settings In case of ACLR measurements with carrier aggregation, the measurement frequency is not the frequency of one of the carriers, but lies somewhere in between the carrier frequencies, depending on the bandwidths you have selected for the two carriers. The carriers have to be next to each other for the measurement to work reliably. Remote command: CONFigure[:LTE]:UL:CABW on page 162 SEM Requirement Selects the type of spectrum emission mask used for the Out of Band emission measurement. The software supports general and specific (additional) spectrum emission masks. The specific spectrum emission masks contain additional SEM requirements. The additional requirements masks to use for the measurement depend on the network signalled value "NS_03", "NS_04", "NS_06" or "NS_07". If "NS_06" or "NS_07" is indicated in the cell, use SEM requirement "NS_06_07". Remote command: [SENSe]:POWer:SEM:UL:REQuirement on page 162 Assumed Adjacent Channel Carrier Selects the assumed adjacent channel carrier for the ACLR measurement. The supported types are EUTRA of same bandwidth, 1.28 Mcps UTRA, 3.84 Mcps UTRA and 7.68 Mcps UTRA. Note that not all combinations of LTE Channel Bandwidth settings and Assumed Adj. Channel Carrier settings are defined in the 3GPP standard. Remote command: [SENSe]:POWer:ACHannel:AACHannel on page 163 Noise Correction Turns noise correction on and off. Note that the input attenuator makes a clicking noise after each sweep if you are using the noise correction in combination with the auto leveling process. Remote command: [SENSe]:POWer:NCORrection on page 163 Auto Gating Turns gating for SEM and ACLR measurements on and off. If on, the software evaluates the on-periods of an LTE TDD signal only. The software determines the location and length of the on-period from the "TDD UL/DL Allocations" and the "Configuration of the Special Subframe". Note that the automatic cyclic prefix mode detection is not supported if you have turned on Auto Gating. In that case, you have to select the cyclic prefix mode manually. Auto gating is available for TDD measurements in combination with an external or IF power trigger. User Manual 1308.9135.42 ─ 15 65 R&S®FS‑K101/103/105PC General Settings Advanced Settings If you are using an external trigger, the DUT has to send an LTE frame trigger. Remote command: [SENSe]:SWEep:EGATe:AUTO on page 163 4.4.2 Configuring Spectrum Flatness Measurements The spectrum flatness settings contain settings that define certain aspects of those measurements. The Spectrum Flatness measurement settings are part of the "General Settings" tab of the "General Settings" dialog box. Operating Band Index................................................................................................... 66 Extreme Conditions.......................................................................................................66 Operating Band Index Selects one of the 40 operating bands for spectrum flatness measurements as defined in TS 36.101. The operating band defines the frequency band and the dedicated duplex mode. Remote command: [SENSe][:LTE]:SFLatness:OBANd on page 164 Extreme Conditions Turns extreme conditions on and off. If you turn the extreme conditions on, the software will modify the limit lines for the limit check of the spectral flatness measurement. Remote command: [SENSe][:LTE]:SFLatness:ECONditions on page 164 4.5 Advanced Settings The advanced settings contain settings to configure the signal input and some global measurement analysis settings. You can find the advanced settings in the "General Settings" dialog box. ● ● ● ● ● Controlling I/Q Data.................................................................................................67 Configuring the Baseband Input..............................................................................67 Using Advanced Input Settings...............................................................................68 Configuring the Digital I/Q Input.............................................................................. 69 Global Settings........................................................................................................69 User Manual 1308.9135.42 ─ 15 66 R&S®FS‑K101/103/105PC General Settings Advanced Settings 4.5.1 Controlling I/Q Data The I/Q settings contain settings that control the I/Q data flow. The I/Q settings are part of the "Advanced" tab of the "General Settings" dialog box. Swap I/Q....................................................................................................................... 67 File Source Offset......................................................................................................... 67 Swap I/Q Swaps the real (I branch) and the imaginary (Q branch) parts of the signal. Remote command: [SENSe]:SWAPiq on page 164 File Source Offset Defines the location in an I/Q data file where the analysis starts. Remote command: INPut:IQ:FSOFfset on page 165 4.5.2 Configuring the Baseband Input The baseband settings contain settings that configure the baseband input. The baseband settings are part of the "Advanced" tab of the "General Settings" dialog box. High Impedance............................................................................................................ 67 Balanced....................................................................................................................... 68 Low Pass.......................................................................................................................68 Dither.............................................................................................................................68 High Impedance Selects the impedance of the baseband input. By default (high impedance is off), the impedance is 50 Ω. If you turn the high impedance on, the impedance changes to 1 kΩ or 1 MΩ, depending on the configuration of the analyzer. User Manual 1308.9135.42 ─ 15 67 R&S®FS‑K101/103/105PC General Settings Advanced Settings High impedance is available for a baseband input source. Remote command: INPut:IQ:IMPedance on page 165 Balanced Turns symmetric (or balanced) input on and off. If active, a ground connection is not necessary. If you are using an assymetrical (unbalanced) setup, the ground connection runs through the shield of the coaxial cable that is used to connect the DUT Balancing is available for a baseband input source. Remote command: INPut:IQ:BALanced[:STATe] on page 165 Low Pass Turns an anti-aliasing low pass filter on and off. The filter has a cut-off frequency of 36 MHz and prevents frequencies above from being mixed into the usable frequency range. Note that if you turn the filter off, harmonics or spurious emissions of the DUT might be in the frequency range above 36 MHz and might be missed. You can turn it off for measurement bandwidths greater than 30 MHz. The low pass filter is available for a baseband input source. Remote command: [SENSe]:IQ:LPASs[:STATe] on page 166 Dither Adds a noise signal into the signal path of the baseband input. Dithering improves the linearity of the A/D converter at low signal levels or low modulation. Improving the linearity also improves the accuracy of the displayed signal levels. The signal has a bandwidth of 2 MHz with a center frequency of 38.93 MHz. Dithering is available for a baseband input source. Remote command: [SENSe]:IQ:DITHer[:STATe] on page 166 4.5.3 Using Advanced Input Settings The advanced input settings contain settings that configure the RF input. The advanced input settings are part of the "Advanced" tab of the "General Settings" dialog box. For more information see "Defining a Reference Level" on page 55. User Manual 1308.9135.42 ─ 15 68 R&S®FS‑K101/103/105PC General Settings Advanced Settings 4.5.4 Configuring the Digital I/Q Input The digital I/Q settings contain settings that configure the digital I/Q input. The digital I/Q settings are part of the "Advanced" tab of the "General Settings" dialog box. Sampling Rate (Input Data Rate).................................................................................. 69 Full Scale Level.............................................................................................................69 Sampling Rate (Input Data Rate) Defines the data sample rate at the digital baseband input. The sample rate is available for a digital baseband input source. Remote command: INPut<n>:DIQ:SRATe on page 167 Full Scale Level Defines the voltage corresponding to the maximum input value of the digital baseband input. Remote command: INPut<n>:DIQ:RANGe[:UPPer] on page 166 4.5.5 Global Settings The global settings contain settings that are independent of other settings. The global settings are part of the "Advanced" tab of the "General Settings" dialog box. Couple Screens.............................................................................................................69 Stop Run Continuous On Limit Check Fail....................................................................70 Couple Screens Couples and decouples markers that have the same x-axis unit in the top and bottom result displays (e.g. both result displays have a frequency axis). In case of the constellation diagram, the constellation selection is also coupled to the marker. User Manual 1308.9135.42 ─ 15 69 R&S®FS‑K101/103/105PC General Settings Advanced Settings Stop Run Continuous On Limit Check Fail Stops a continuous measurement if the signal fails any limit check in the currently active result display. For example, the measurement would stop on an EVM PUSCH QPSK limit check fail if the result summary is active. User Manual 1308.9135.42 ─ 15 70 R&S®FS‑K101/103/105PC Demod Settings Configuring Uplink Signal Demodulation 5 Demod Settings The following chapter contains all settings that are available in the "Demodulation Settings" dialog box. ● ● ● Configuring Uplink Signal Demodulation.................................................................71 Defining Uplink Signal Characteristics.................................................................... 75 Defining Advanced Signal Characteristics.............................................................. 83 5.1 Configuring Uplink Signal Demodulation The uplink demodulation settings contain settings that describe the signal processing and the way the signal is measured. You can find the demodulation settings in the "Demod Settings" dialog box. ● ● Configuring the Data Analysis.................................................................................71 Compensating Signal Errors................................................................................... 74 5.1.1 Configuring the Data Analysis The data analysis settings contain setting that control the data analysis. The data analysis settings are part of the "Downlink Demodulation Settings" tab of the "Demodulation Settings" dialog box. Analysis Mode...............................................................................................................72 Channel Estimation Range........................................................................................... 72 EVM with Exclusion Period........................................................................................... 72 Analyze TDD Transient Slots........................................................................................ 72 Compensate DC Offset................................................................................................. 72 Scrambling of Coded Bits..............................................................................................72 Auto Demodulation........................................................................................................73 Subframe Configuration Detection................................................................................ 73 Suppressed Interference Synchronization.................................................................... 74 Multicarrier Filter........................................................................................................... 74 User Manual 1308.9135.42 ─ 15 71 R&S®FS‑K101/103/105PC Demod Settings Configuring Uplink Signal Demodulation Analysis Mode Selects the channel analysis mode. You can select from "PUSCH/PUCCH" mode and "PRACH" mode. PUSCH/PUCCH mode analyzes the PUSCH and PUCCH. This is the default. PRACH mode analyzes the PRACH only. In PRACH analysis mode no subframe or slot selection is available. Instead you can select a particular preamble that the results are shown for. Note that PRACH analysis mode does not support all result displays. Remote command: [SENSe][:LTE]:UL:DEMod:MODE on page 168 Channel Estimation Range Selects the method for channel estimation. You can select if only the pilot symbols are used to perform channel estimation or if both pilot and payload carriers are used. Remote command: [SENSe][:LTE]:UL:DEMod:CESTimation on page 168 EVM with Exclusion Period Turns exclusion periods for EVM measurements as defined in 3GPP TS 36.521 on and off. The exclusion period affects the PUSCH data EVM of the first and last symbol. The software automatically determines the length of the exclusion period according to 3GPP TS 36.521-1. The exclusion period has no effect on the EVM vs Carrier and EVM vs Symbol x Carrier result displays. Remote command: [SENSe][:LTE]:UL:DEMod:EEPeriod on page 168 Analyze TDD Transient Slots Includes or excludes the transient slots present after a switch from downlink to uplink in the analysis. If on, the transient slots are not included in the measurement. Remote command: [SENSe][:LTE]:UL:DEMod:ATTSlots on page 168 Compensate DC Offset Turns DC offset compensation when calculating measurement results on and off. According to 3GPP TS 36.101 (Annex F.4), the analyzer removes the carrier leakage (I/Q origin offset) from the evaluated signal before it calculates the EVM and in-band emissions. Remote command: [SENSe][:LTE]:UL:DEMod:CDCoffset on page 169 Scrambling of Coded Bits Turns the scrambling of coded bits for the PUSCH on and off. User Manual 1308.9135.42 ─ 15 72 R&S®FS‑K101/103/105PC Demod Settings Configuring Uplink Signal Demodulation The scrambling of coded bits affects the bitstream results. Fig. 5-1: Source for bitstream results if scrambling for coded bits is on and off Remote command: [SENSe][:LTE]:UL:DEMod:CBSCrambling on page 169 Auto Demodulation Turns automatic demodulation on and off. If active, the analyzer automatically detects the characteristics of each subframe in the signal (resource allocation of the signal). Two methods of detection are supported: ● Subframe Configuration This method automatically determines the characteristics for each subframe as shown in the Subframe Configuration Table. The table is populated accordingly. ● Subframe Configuration & DMRS Auto Demodulation, DMRS Auto Detection (On) This method automatically detects the PUSCH and SRS (i.e. no PUCCH can be detected). To determine these characteristics, the software detects the CAZAC base parameters. Thus, the DMRS configuration parameters are not required for the synchronization and therefore are not available using this method. Note however that it is not possible to derive the DMRS configuration parameters from the CAZAC base parameters so that the disabled DMRS configuration parameters do not reflect the current parameters used for the synchronization. Also note that it can happen that the software successfully synchronizes on non-3GPP signals without a warning. Automatic demodulation is not available if the Suppressed Interference Synchronization is active. Remote command: [SENSe][:LTE]:UL:DEMod:ACON on page 169 Subframe Configuration Detection Turns the detection of the subframe configuration on and off. User Manual 1308.9135.42 ─ 15 73 R&S®FS‑K101/103/105PC Demod Settings Configuring Uplink Signal Demodulation Upon activation, the software compares the current demodulated LTE frame to the subframe configuration you have set. Only if the signal is consistent with the configuration, the software will further analyze the LTE frame. If inactive, the software analyzes the signal even if it is not consistent with the current subframe configuration. Subframe configuration detection is available if "Auto Demodulation" is turned off. Remote command: [SENSe][:LTE]:UL:FORMat:SCD on page 169 Suppressed Interference Synchronization Turns suppressed interference synchronization on and off. If active, the synchronization on signals containing more than one user equipment (UE) is more robust. Additionally, the EVM is lower in case the UEs have different frequency offsets. Note that Auto Demodulation is not supported in this synchronization mode and the EVM may be higher in case only one UE is present in the signal. Remote command: [SENSe][:LTE]:UL:DEMod:SISYnc on page 170 Multicarrier Filter Turns the suppression of interference of neighboring carriers on and off. Remote command: [SENSe][:LTE]:UL:DEMod:MCFilter on page 170 5.1.2 Compensating Signal Errors The tracking settings contain settings that compensate for various common signal errors that may occur. The tracking settings are part of the "Downlink Demodulation Settings" tab of the "Demodulation Settings" dialog box. Phase............................................................................................................................ 74 Timing........................................................................................................................... 75 Phase Specifies whether or not the measurement results should be compensated for common phase error. When phase compensation is used, the measurement results will be compensated for phase error on a per-symbol basis. "Off" Phase tracking is not applied. "Pilot Only" Only the reference signal is used for the estimation of the phase error. User Manual 1308.9135.42 ─ 15 74 R&S®FS‑K101/103/105PC Demod Settings Defining Uplink Signal Characteristics "Pilot and Payload" Both reference signal and payload resource elements are used for the estimation of the phase error. Remote command: [SENSe][:LTE]:UL:TRACking:PHASe on page 170 Timing Specifies whether or not the measurement results should be compensated for timing error. When timing compensation is used, the measurement results will be compensated for timing error on a per-symbol basis. Remote command: [SENSe][:LTE]:UL:TRACking:TIME on page 170 5.2 Defining Uplink Signal Characteristics The uplink signal characteristics contain settings to describe the physical attributes and structure of an uplink LTE signal. You can find the signal characteristics in the "Demod Settings" dialog box. ● ● ● Defining the Physical Signal Characteristics...........................................................75 Configuring the Physical Layer Cell Identity............................................................77 Configuring Subframes........................................................................................... 78 5.2.1 Defining the Physical Signal Characteristics The physical signal characteristics contain settings to describe the physical attributes of an uplink LTE signal. The physical settings are part of the "Uplink Signal Characteristics" tab of the "Demodulation Settings" dialog box. Channel Bandwidth / Number of Resource Blocks Specifies the channel bandwidth and number of resource blocks (RB). The channel bandwidth and number of resource blocks (RB) are interdependent. Currently, the LTE standard recommends six bandwidths (see table below). The software also calculates the FFT size, sampling rate, occupied bandwidth and occupied carriers from the channel bandwidth. Those are read only. User Manual 1308.9135.42 ─ 15 75 R&S®FS‑K101/103/105PC Demod Settings Defining Uplink Signal Characteristics Channel Bandwidth [MHz] 1.4 3 5 10 15 20 Number of Resource Blocks 6 15 25 50 75 100 Sample Rate [MHz] 1.92 3.84 7.68 15.36 30.72 30.72 FFT Size 128 256 512 1024 2048 2048 The software shows the currently selected LTE mode (including the bandwidth) in the header table. Remote command: CONFigure[:LTE]:UL[:CC<cci>]:BW on page 171 Cyclic Prefix The cyclic prefix serves as a guard interval between OFDM symbols to avoid interferences. The standard specifies two cyclic prefix modes with a different length each. The cyclic prefix mode defines the number of OFDM symbols in a slot. ● ● ● Normal A slot contains 7 OFDM symbols. Extended A slot contains 6 OFDM symbols. The extended cyclic prefix is able to cover larger cell sizes with higher delay spread of the radio channel. Auto The application automatically detects the cyclic prefix mode in use. The software shows the currently selected cyclic prefix in the header table. Remote command: CONFigure[:LTE]:UL[:CC<cci>]:CYCPrefix on page 171 Configuring TDD Frames TDD frames contain both uplink and downlink information separated in time with every subframe being responsible for either uplink or downlink transmission. The standard specifies several subframe configurations or resource allocations for TDD systems. TDD UL/DL Allocations Selects the configuration of the subframes in a radio frame in TDD systems. The UL/DL configuration (or allocation) defines the way each subframe is used: for uplink, downlink or if it is a special subframe. The standard specifies seven different configurations. User Manual 1308.9135.42 ─ 15 76 R&S®FS‑K101/103/105PC Demod Settings Defining Uplink Signal Characteristics Configuration Subframe Number and Usage 0 1 2 3 4 5 6 7 8 9 0 D S U U U D S U U U 1 D S U U D D S U U D 2 D S U D D D S U D D 3 D S U U U D D D D D 4 D S U U D D D D D D 5 D S U D D D D D D D 6 D S U U U D S U U D U = uplink D = downlink S = special subframe Conf. of Special Subframe In combination with the cyclic prefix, the special subframes serve as guard periods for switches from uplink to downlink. They contain three parts or fields. ● DwPTS The DwPTS is the downlink part of the special subframe. It is used to transmit downlink data. ● GP The guard period makes sure that there are no overlaps of up- and downlink signals during a switch. ● UpPTS The UpPTS is the uplink part of the special subframe. It is used to transmit uplink data. The length of the three fields is variable. This results in several possible configurations of the special subframe. The LTE standard defines 10 different configurations for the special subframe. However, configurations 8 and 9 only work for a normal cyclic prefix. If you select configurations 8 or 9 using an extended cyclic prefix or automatic detection of the cyclic prefix, the software will show an error message. Remote command: Subframe: CONFigure[:LTE]:UL[:CC<cci>]:TDD:UDConf on page 172 Special subframe: CONFigure[:LTE]:UL[:CC<cci>]:TDD:SPSC on page 172 5.2.2 Configuring the Physical Layer Cell Identity The physical signal characteristics contain settings to describe the physical attributes of an uplink LTE signal. The physical settings are part of the "Uplink Signal Characteristics" tab of the "Demodulation Settings" dialog box. User Manual 1308.9135.42 ─ 15 77 R&S®FS‑K101/103/105PC Demod Settings Defining Uplink Signal Characteristics Configuring the Physical Layer Cell Identity The cell ID, cell identity group and physical layer identity are interdependent parameters. In combination they are responsible for synchronization between network and user equipment. The physical layer cell ID identifies a particular radio cell in the LTE network. The cell identities are divided into 168 unique cell identity groups. Each group consists of 3 physical layer identities. According to cell (1) ( 2) N ID 3 N ID N ID N(1) = cell identity group, {0...167} N(2) = physical layer identity, {0...2} there is a total of 504 different cell IDs. If you change one of these three parameters, the software automatically updates the other two. The Cell ID determines ● ● ● ● ● ● the reference signal grouping hopping pattern the reference signal sequence hopping the PUSCH demodulation reference signal pseudo-random sequence the cyclic shifts for PUCCH formats 1/1a/1b and sequences for PUCCH formats 2/2a/2b the pseudo-random sequence used for scrambling the pseudo-random sequence used for type 2 PUSCH frequency hopping The software shows the currently selected cell ID in the header table. Remote command: Cell ID: CONFigure[:LTE]:UL[:CC<cci>]:PLC:CID on page 173 Cell Identity Group: CONFigure[:LTE]:UL[:CC<cci>]:PLC:CIDGroup on page 173 Identity: CONFigure[:LTE]:UL[:CC<cci>]:PLC:PLID on page 174 5.2.3 Configuring Subframes An LTE frame consists of 10 subframes. Each individual subframe may have a different resource block configuration. This configuration is shown in the "Subframe Configuration Table". The application supports two ways to determine the characteristics of each subframe. ● Automatic demodulation of the channel configuration and detection of the subframe characteristics. In case of automatic demodulation, the contents of the table are determined according to the signal currently evaluated. For more information see "Auto Demodulation" on page 73. ● Custom configuration of the configuration of each subframe. In case of manual configuration, you can customize the table according to the signal that you expect. The signal is demodulated even if the signal does not fit the User Manual 1308.9135.42 ─ 15 78 R&S®FS‑K101/103/105PC Demod Settings Defining Uplink Signal Characteristics decription in the table or, in case of Physical Detection, only if the frame fits the description in the table. Remote command: Conf. subframes: CONFigure[:LTE]:UL:CSUBframes on page 175 Frame number offset A frame number offset is also available. The frame number offset assigns a number to the demodulated frame in order to identify it in a series of transmitted (and captured) frames. Remote command: CONFigure[:LTE]:UL:SFNO on page 174 ● ● 5.2.3.1 Individual Subframe Configuration.......................................................................... 79 Enhanced Settings..................................................................................................81 Individual Subframe Configuration The "Subframe Configuration Table" contains the characteristics for each subframe. The software supports a maximum uplink LTE frame size of 10 subframes. The subframe number in the table depends on the number of "Configurable Subframes" that you have defined or that have been detected in case of automatic demodulation. Each row in the table represents one subframe or one allocation if the subframe is a cluster of allocations. Subframe Number.........................................................................................................79 Enable PUCCH............................................................................................................. 80 Enable PUSCH............................................................................................................. 80 Modulation.....................................................................................................................80 Enhanced Settings........................................................................................................ 80 Number of RB............................................................................................................... 80 Offset RB.......................................................................................................................80 Subframe Number Shows the number of a subframe. User Manual 1308.9135.42 ─ 15 79 R&S®FS‑K101/103/105PC Demod Settings Defining Uplink Signal Characteristics Note that, depending on the TDD configuration, some subframes may not be available for editing. The analyzer labels those subframes "(not used)". Enable PUCCH Turns the PUCCH in the corresponding subframe on and off. Remote command: CONFigure[:LTE]:UL[:CC<cci>]:SUBFrame<subframe>:ALLoc:CONT on page 175 Enable PUSCH Turns the PUSCH in the corresponding subframe on and off. If you turn on a PUSCH, "Modulation", "Number of RBs" and "Offset RB" become available. Remote command: CONFigure[:LTE]:UL[:CC<cci>]:SUBFrame<subframe>:ALLoc:CONT on page 175 Modulation Selects the modulation scheme for the corresponding PUSCH allocation. The modulation scheme is either QPSK, 16QAM or 64QAM. Remote command: CONFigure[:LTE]:UL[:CC<cci>]:SUBFrame<subframe>:ALLoc:MODulation on page 176 Enhanced Settings Opens a dialog box to configure enhanced functionality for selected channels in each subframe. For more information see Enhanced Settings. Number of RB Sets the number of resource blocks the PUSCH allocation covers. The number of resource blocks defines the size or bandwidth of the PUSCH allocation. Remote command: CONFigure[:LTE]:UL[:CC<cci>]:SUBFrame<subframe>:ALLoc[: CLUSter<cluster>]:RBCount on page 175 Offset RB Sets the resource block at which the PUSCH allocation begins. Make sure not to allocate PUSCH allocations into regions reserved for PUCCH allocations. Remote command: CONFigure[:LTE]:UL[:CC<cci>]:SUBFrame<subframe>:ALLoc[: CLUSter<cluster>]:RBOFfset on page 175 User Manual 1308.9135.42 ─ 15 80 R&S®FS‑K101/103/105PC Demod Settings Defining Uplink Signal Characteristics 5.2.3.2 Enhanced Settings The "Enhanced Settings" contain functionality to define enhanced characteristics for selected channels. Enhanced PUSCH Configuration.................................................................................. 81 Enhanced Demodulation Reference Signal Configuration............................................81 Enhanced PUCCH Configuration..................................................................................82 Enhanced PUSCH Configuration Configures the PUSCH in individual subframes. Note that you have to select more than one antenna for the PUSCH transmission to access these parameters. For more information see "MIMO Configuration" on page 62. Resource Allocation Type 1 Turns a clustered PUSCH allocation an and off. If on, a second row is added to the corresponding allocation. This second row represents the second cluster. You can define the number of resource block and the offset resource block for each cluster. All other parameters (power, modulation etc.) are the same for both clusters. Precoding Settings If you are using a clustered PUSCH, you can also define the number of layers for any allocation and the codebook index. The number of layers of an allocation in combination with the number of code words determines the layer mapping. The available number of layers depends on the number of transmission antennas. Thus, the maximum number of layers you can select is four. The codebook index determines the precoding matrix. The available number of indices depends on the number of transmission antennas in use. The range is from 0 to 23. Remote command: CONFigure[:LTE]:UL[:CC<cci>]:SUBFrame<subframe>:ALLoc:RATO on page 178 CONFigure[:LTE]:UL[:CC<cci>]:SUBFrame<subframe>:ALLoc:PRECoding: CLMapping on page 176 CONFigure[:LTE]:UL[:CC<cci>]:SUBFrame<subframe>:ALLoc:PRECoding: CBINdex on page 176 Enhanced Demodulation Reference Signal Configuration Configures the Demodulation Reference Signal in individual subframes. User Manual 1308.9135.42 ─ 15 81 R&S®FS‑K101/103/105PC Demod Settings Defining Uplink Signal Characteristics n(2)_DMRS Defines the part of the demodulation reference signal index that is part of the uplink scheduling assignment. Thus, this part of the index is valid for corresponding UE and subframe only. The index applies when multiple shifts within a cell are used. It is used for the calculation of the DMRS sequence. Cyclic Shift Field If Activate-DMRS-With OCC is on, the "Cyclic Shift Field" becomes available to define the cyclic shift field. The Cyclic Shift Field is signalled by the PDCCH downlink channel in DCI format 0 and 4. It selects n(2)_DMRS and the orthogonal sequence (OCC) for signals according to LTE release 10. If the "Cyclic Shift Field" is off, the demodulation reference signal is configured by the n(2)_DMRS parameter. Remote command: CONFigure[:LTE]:UL[:CC<cci>]:SUBFrame<subframe>:ALLoc:PUSCh: NDMRs on page 177 CONFigure[:LTE]:UL[:CC<cci>]:SUBFrame<subframe>:ALLoc:PUSCh: CSField on page 177 Enhanced PUCCH Configuration Configures the PUSCH in individual subframes. n_PUCCH Defines the n_PUCCH parameter for the selected subframe. Available only if you have selected "Per Subframe" for the N_PUCCH. PUCCH Format Selects the PUCCH format for the selected subframe. Available only if you have selected "Per Subframe" for the Format. Remote command: n_PUCCH: CONFigure[:LTE]:UL[:CC<cci>]:SUBFrame<subframe>:ALLoc: PUCCh:NPAR on page 177 Format: CONFigure[:LTE]:UL[:CC<cci>]:SUBFrame<subframe>:ALLoc: PUCCh:FORMat on page 176 User Manual 1308.9135.42 ─ 15 82 R&S®FS‑K101/103/105PC Demod Settings Defining Advanced Signal Characteristics 5.3 Defining Advanced Signal Characteristics The uplink advanced signal characteristics contain settings that describe the detailed structure of an uplink LTE signal. You can find the advanced signal characteristics in the "Demod Settings" dialog box. ● ● ● ● ● ● Configuring the Demodulation Reference Signal.................................................... 83 Configuring the Sounding Reference Signal........................................................... 85 Defining the PUSCH Structure................................................................................88 Defining the PUCCH Structure................................................................................90 Defining the PRACH Structure................................................................................92 Defining Global Signal Characteristics....................................................................93 5.3.1 Configuring the Demodulation Reference Signal The demodulation reference signal settings contain settings that define the physical attributes and structure of the demodulation reference signal. This reference signal helps to demodulate the PUSCH. The demodulation reference signal settings are part of the "Uplink Advanced Signal Characteristics" tab of the "Demodulation Settings" dialog box. Sequence...................................................................................................................... 83 Group Hopping..............................................................................................................84 Sequence Hopping........................................................................................................84 Relative Power PUSCH................................................................................................ 84 Activate-DMRS-With OCC............................................................................................ 84 n(1)_DMRS................................................................................................................... 85 Delta Sequence Shift.................................................................................................... 85 Relative Power PUCCH................................................................................................ 85 Sequence Selects the definition the demodulation reference signal is based on. "3GPP" User Manual 1308.9135.42 ─ 15 The structure of the DRS is based on the 3GPP standard. If you are using a DRS based on 3GPP, you have to set all parameters in the "Demodulation Reference Signal" settings group. They have to be the same as those of the signal generator. 83 R&S®FS‑K101/103/105PC Demod Settings Defining Advanced Signal Characteristics "I/Q File" The structure of the DRS is customized. Move the file that contains the signal definition into the default directory. For more information see chapter 7.3, "Customizing Reference Symbols", on page 100. Remote command: CONFigure[:LTE]:UL[:CC<cci>]:DRS:SEQuence on page 180 Group Hopping Turns group hopping for the demodulation reference signal on and off. The group hopping pattern is based on 17 hopping patterns and 30 sequence shift patterns. It is generated by a pseudo-random sequence generator. If on, PUSCH and PUCCH use the same group hopping pattern. Remote command: CONFigure[:LTE]:UL[:CC<cci>]:DRS:GRPHopping on page 179 Sequence Hopping Turns sequence hopping for the uplink demodulation reference signal on and off. Sequence hopping is generated by a pseudo-random sequence generator. Remote command: CONFigure[:LTE]:UL[:CC<cci>]:DRS:SEQHopping on page 180 Relative Power PUSCH Defines the power of the DMRS relative to the power level of the PUSCH allocation in the corresponding subframe (PDMRS_Offset). The effective power level of the DMRS depends on the allocation of the subframe and is calculated as follows. PDMRS = PUE + PPUSCH + PDMRS_Offset The relative power of the DMRS is applied to all subframes. The power of the PUSCH (PPUSCH) may be different in each subframe. Remote command: CONFigure[:LTE]:UL[:CC<cci>]:DRS[:PUSCh]:POWer on page 180 Activate-DMRS-With OCC Turns the configuration of the demodulation reference signal on a subframe basis via the "Cyclic Shift Field" on and off. If on, the "Cyclic Shift Field" becomes available. Otherwise, the demodulation reference signal is configured by the n(2)_DMRS parameter. Note that this parameter is automatically turned on if at least one of the physical channels uses more than one antenna. For more information see Enhanced Settings and MIMO Configuration. Remote command: CONFigure[:LTE]:UL[:CC<cci>]:DRS:AOCC on page 178 User Manual 1308.9135.42 ─ 15 84 R&S®FS‑K101/103/105PC Demod Settings Defining Advanced Signal Characteristics n(1)_DMRS Defines the part of the demodulation reference signal index that is broadcasted. It is valid for the whole cell. The index applies when multiple shifts within a cell are used. It is used for the calculation of the DMRS sequence. The n_DMRS parameter can be found in 3GPP TS36.211 V8.5.0, 5.5.2.1.1 Reference signal sequence. Remote command: CONFigure[:LTE]:UL[:CC<cci>]:DRS:NDMRs on page 179 Delta Sequence Shift Defines the delta sequence shift ΔSS. The standard defines a sequence shift pattern fss for the PUCCH. The corresponding sequence shift pattern for the PUSCH is a function of fssPUCCH and the delta sequence shift. For more information refer to 3GPP TS 36.211, chapter 5.5.1.3 "Group Hopping". Remote command: CONFigure[:LTE]:UL[:CC<cci>]:DRS:DSSHift on page 179 Relative Power PUCCH Defines the power of the DMRS relative to the power level of the PUCCH allocation in the corresponding subframe (PDMRS_Offset). The effective power level of the DMRS depends on the allocation of the subframe and is calculated as follows. PDMRS = PUE + PPUCCH + PDMRS_Offset The relative power of the DMRS is applied to all subframes. The power of the PUCCH (PPUCCH) may be different in each subframe. Remote command: CONFigure[:LTE]:UL[:CC<cci>]:DRS:PUCCh:POWer on page 179 5.3.2 Configuring the Sounding Reference Signal The sounding reference signal settings contain settings that define the physical attributes and structure of the sounding reference signal. The sounding reference signal settings are part of the "Uplink Advanced Signal Characteristics" tab of the "Demodulation Settings" dialog box. User Manual 1308.9135.42 ─ 15 85 R&S®FS‑K101/103/105PC Demod Settings Defining Advanced Signal Characteristics Present..........................................................................................................................86 SRS Subframe Conf......................................................................................................86 SRS BW Conf. C_SRS................................................................................................. 86 SRS MaxUpPts............................................................................................................. 86 Conf. Index I_SRS........................................................................................................ 86 SRS Bandwidth B_SRS................................................................................................ 87 Transm. Comb. k_TC....................................................................................................87 SRS Rel Power............................................................................................................. 87 Hopping BW b_hop....................................................................................................... 87 Freq. Domain Pos. n_RRC........................................................................................... 88 SRS Cyclic Shift N_CS................................................................................................. 88 A/N + SRS Simultaneous TX........................................................................................ 88 Present Includes or excludes the sounding reference signal (SRS) from the test setup. Remote command: CONFigure[:LTE]:UL:SRS:STAT on page 183 SRS Subframe Conf. Defines the subframe configuration of the SRS. The subframe configuration of the SRS is specific to a cell. The UE sends a shortened PUCCH/PUSCH in these subframes, regardless of whether the UE is configured to send an SRS in the corresponding subframe or not. Remote command: CONFigure[:LTE]:UL:SRS:SUConfig on page 183 SRS BW Conf. C_SRS Defines the bandwidth configuration of the SRS. The bandwidth configuration is a cell specific parameter that, in combination with the SRS bandwidth and the channel bandwidth, defines the length of the souunding reference signal sequence. For more information on the calculation refer to 3GPP TS 36.211 chapter 5.5.3 "Sounding Reference Signal". Remote command: CONFigure[:LTE]:UL:SRS:CSRS on page 181 SRS MaxUpPts Turns the parameter srs_MaxUpPts on and off. srs_MaxUpPts controls the SRS transmission in the UpPTS field in TDD systems. If on, the SRS is transmitted in a frequency range of the UpPTS field that does not overlap with resources reserved for PRACH preamble 4 transmissions. To avoid an overlap, the number of SRS resource blocks otherwise determined by C_SRS and B_SRS is reconfigured. Remote command: CONFigure[:LTE]:UL:SRS:MUPT on page 182 Conf. Index I_SRS Defines the configuration index of the SRS. User Manual 1308.9135.42 ─ 15 86 R&S®FS‑K101/103/105PC Demod Settings Defining Advanced Signal Characteristics The configuration index ISRS is a cell specific parameter that determines the SRS periodicity (TSRS) and the SRS subframe offset (Toffset). The effects of the configuration index on TSRS and Toffset depends on the duplexing mode. For more information refer to 3GPP TS 36.213, Table 8.2-1 (FDD) and 8.2-2 (TDD). Remote command: CONFigure[:LTE]:UL:SRS:ISRS on page 182 SRS Bandwidth B_SRS Defines the parameter BSRS. BSRS is a UE specific parameter that defines the bandwidth of the SRS. The SRS either spans the entire frequency bandwidth or uses frequency hopping when several narrowband SRS cover the same total bandwidth. The standard defines up to four bandwidths for the SRS. The most narrow SRS bandwidth (BSRS = 3) spans four resource blocks and is available for all channel bandwidths. The other three values of BSRS define more wideband SRS bandwidths. Their availability depends on the channel bandwidth. The availability of SRS bandwidths additionally depends on the bandwidth configuration of the SRS (CSRS). For more information refer to 3GPP TS 36.211, chapter 5.5.3.2 "Mapping to Physical Resources" for the Sounding Reference Signal. Remote command: CONFigure[:LTE]:UL:SRS:BSRS on page 181 Transm. Comb. k_TC Defines the transmission comb kTC. The transmission comb. is a UE specific parameter. For more information refer to 3GPP TS 36.211, chapter 5.5.3.2 "Mapping to Physical Resources" for the Sounding Reference Signal. Remote command: CONFigure[:LTE]:UL:SRS:TRComb on page 183 SRS Rel Power Defines the power of the SRS relative to the power of the corresponding UE (PSRS_Offset). The effective power level of the SRS is calculated as follows. PSRS = PUE + PSRS_Offset The relative power of the SRS is applied to all subframes. Remote command: CONFigure[:LTE]:UL:SRS:POWer on page 182 Hopping BW b_hop Defines the parameter bhop. User Manual 1308.9135.42 ─ 15 87 R&S®FS‑K101/103/105PC Demod Settings Defining Advanced Signal Characteristics bhop is a UE specific parameter that defines the frequency hopping bandwidth. SRS frequency hopping is active if bhop < BSRS. For more information refer to 3GPP TS 36.211, chapter 5.5.3.2 "Mapping to Physical Resources" for the Sounding Reference Signal. Remote command: CONFigure[:LTE]:UL:SRS:BHOP on page 181 Freq. Domain Pos. n_RRC Defines the parameter nRRC. nRRC is a UE specific parameter and determines the starting physical resource block of the SRS transmission. For more information refer to 3GPP TS 36.211, chapter 5.5.3.2 "Mapping to Physical Resources" for the Sounding Reference Signal. Remote command: CONFigure[:LTE]:UL:SRS:NRRC on page 182 SRS Cyclic Shift N_CS Defines the cyclic shift (nCS) used for the generation of the SRS CAZAC sequence. Because the different shifts of the same Zadoff-Chu sequence are orthogonal to each other, applying different SRS cyclic shifts can be used to schedule different UE to simultaneously transmit their SRS. Remote command: CONFigure[:LTE]:UL:SRS:CYCS on page 182 A/N + SRS Simultaneous TX Turns simultaneous transmission of the Sounding Reference Signal (SRS) and ACK/ NACK messages (via PUCCH) on and off. By turning the parameter on, you allow for simultaneous transmission of PUCCH and SRS in the same subframe. If off, the SRS not transmitted in the subframe for which you have configured simultaneous transmission of PUCCH and SRS. Note that simultaneous transmission of SRS and PUCCH is available only if the PUCCH format is either 1, 1a, 1b or 3. The other PUCCH formats contain CQI reports which are not transmitted with the SRS. Remote command: CONFigure[:LTE]:UL:SRS:ANST on page 181 5.3.3 Defining the PUSCH Structure The PUSCH structure settings contain settings that describe the physical attributes and structure of the PUSCH. The PUSCH structure setup is part of the "Uplink Advanced Signal Characteristics" tab of the "Demodulation Settings" dialog box. User Manual 1308.9135.42 ─ 15 88 R&S®FS‑K101/103/105PC Demod Settings Defining Advanced Signal Characteristics Frequency Hopping Mode.............................................................................................89 Info. in Hopping Bits...................................................................................................... 89 PUSCH Hopping Offset.................................................................................................89 Number of Subbands.................................................................................................... 89 Frequency Hopping Mode Selects the frequency hopping mode of the PUSCH. Several hopping modes are supported. ● None No frequency hopping. ● Inter Subframe Hopping PUSCH changes the frequency from one subframe to another. ● Intra Subframe Hopping PUSCH also changes the frequency within a subframe. Remote command: CONFigure[:LTE]:UL[:CC<cci>]:PUSCh:FHMode on page 183 Info. in Hopping Bits Defines the information available in the hopping bits according to the PDCCH DCI format 0 hopping bit definition. The information in the hopping bits determines whether type 1 or type 2 hopping is used in the subframe and, in case of type 1, additionally determines the exact hopping function to use. For more information on PUSCH frequency hopping refer to 3GPP TS36.213. Remote command: CONFigure[:LTE]:UL[:CC<cci>]:PUSCh:FHOP:IIHB on page 184 PUSCH Hopping Offset Defines the PUSCH Hopping Offset NRBHO. The PUSCH Hopping Offset determines the first physical resource block and the maximum number of physical resource blocks available for PUSCH transmission if PUSCH frequency hopping is active. Remote command: CONFigure[:LTE]:UL[:CC<cci>]:PUSCh:FHOFfset on page 184 Number of Subbands Defines the number of subbands reserved for PUSCH. For more information refer to 3GPP TS 36.211, chapter 5.5.3.2 "Mapping to Physical Resources" for the Sounding Reference Signal. Remote command: CONFigure[:LTE]:UL[:CC<cci>]:PUSCh:NOSM on page 184 User Manual 1308.9135.42 ─ 15 89 R&S®FS‑K101/103/105PC Demod Settings Defining Advanced Signal Characteristics 5.3.4 Defining the PUCCH Structure The PUCCH structure settings contain settings that describe the physical attributes and structure of the PUCCH. The PUSCH structure setup is part of the "Uplink Advanced Signal Characteristics" tab of the "Demodulation Settings" dialog box. No. of RBs for PUCCH..................................................................................................90 Delta Shift......................................................................................................................90 N(1)_cs..........................................................................................................................91 N(2)_RB........................................................................................................................ 91 Format...........................................................................................................................91 N_PUCCH.....................................................................................................................91 No. of RBs for PUCCH Defines the number of resource blocks reserved for PUCCH. The resource blocks for PUCCH are always allocated at the edges of the LTE spectrum. In case of an even number of PUCCH resource blocks, half of the available PUCCH resource blocks is allocated on the lower, the other half on the upper edge of the LTE spectrum (outermost resource blocks). In case of an odd number of PUCCH resource blocks, the number of resource blocks on the lower edge is one resource block larger than the number of resource blocks on the upper edge of the LTE spectrum. If you select the "Auto" menu item, the software automatically detects the number of RBs. Remote command: CONFigure[:LTE]:UL:PUCCh:NORB on page 185 Delta Shift Defines the delta shift parameter. The delta shift is the difference between two adjacent PUCCH resource indices with the same orthogonal cover sequence (OC). It determines the number of available sequences in a resource block that can be used for PUCCH formats 1/1a/1b. For more information refer to 3GPP TS36.211, chapter 5.4 "Physical Uplink Control Channel". Remote command: CONFigure[:LTE]:UL:PUCCh:DESHift on page 185 User Manual 1308.9135.42 ─ 15 90 R&S®FS‑K101/103/105PC Demod Settings Defining Advanced Signal Characteristics N(1)_cs Defines the number of cyclic shifts used for PUCCH format 1/1a/1b in a resource block used for a combination of the formats 1/1a/1b and 2/2a/2b. Only one resource block per slot can support a combination of the PUCCH formats 1/1a/1b and 2/2a/2b. The number of cyclic shifts available for PUCCH format 2/2a/2b N(2)_cs in a block with combination of PUCCH formats is calculated as follows. N(2)_cs = 12 - N(1)_cs - 2 For more information refer to 3GPP TS36.211, chapter 5.4 "Physical Uplink Control Channel". Remote command: CONFigure[:LTE]:UL:PUCCh:N1CS on page 185 N(2)_RB Defines bandwidth in terms of resource blocks that are reserved for PUCCH formats 2/2a/2b transmission in each subframe. Since there can be only one resource block per slot that supports a combination of the PUCCH formats 1/1a/1b and 2/2a/2b, the number of resource block(s) per slot available for PUCCH format 1/1a/1b is determined by N(2)_RB. For more information refer to 3GPP TS36.211, chapter 5.4 "Physical Uplink Control Channel". Remote command: CONFigure[:LTE]:UL:PUCCh:N2RB on page 185 Format Selects the format of the PUCCH. You can define the PUCCH format for all subframes or define the PUCCH format for each subframe individually. ● ● F1, F1a, F1b, F2, F2a, F2b, F3 Selects the PUCCH format globally for every subframe. Per Subframe You can select the PUCCH format for each subframe separately in the Enhanced Settings of the "Subframe Configuration". Note that formats F2a and F2b are only supported for normal cyclic prefix length. For more information refer to 3GPP TS36.211, table 5.4-1 "Supported PUCCH Formats". Remote command: CONFigure[:LTE]:UL:PUCCh:FORMat on page 186 N_PUCCH Defines the resource index for PUCCH format 1/1a/1b respectively 2/2a/2b. You can select the PUCCH format manually or allow the software to determine the PUCCH format automatically based on the measurement. User Manual 1308.9135.42 ─ 15 91 R&S®FS‑K101/103/105PC Demod Settings Defining Advanced Signal Characteristics It is also possible to define NPUCCH on a subframe level by selecting the "Per Subframe" menu item. For more information see chapter 5.2.3, "Configuring Subframes", on page 78. Remote command: CONFigure[:LTE]:UL:PUCCh:NPAR on page 186 5.3.5 Defining the PRACH Structure The PRACH structure settings contain settings that describe the physical attributes and structure of the PUCCH. The PRACH structure setup is part of the "Uplink Advanced Signal Characteristics" tab of the "Demodulation Settings" dialog box. PRACH Configuration................................................................................................... 92 Restricted Set................................................................................................................92 Frequency Offset...........................................................................................................92 Ncs Conf....................................................................................................................... 93 Logical Root Sequ. Idx.................................................................................................. 93 Sequence Index (v)....................................................................................................... 93 PRACH Preamble Mapping.......................................................................................... 93 PRACH Configuration Sets the PRACH configuration index as defined in the 3GPP TS 36.211, i.e. defines the subframes in which random access preamble transmission is allowed. The preamble format is automatically derived form the PRACH Configuration. Remote command: CONFigure[:LTE]:UL:PRACh:CONF on page 187 Restricted Set Selects whether a restricted preamble set (high speed mode) or the unrestricted preamble set (normal mode) will be used. Remote command: CONFigure[:LTE]:UL:PRACh:RSET on page 187 Frequency Offset For preamble formats 0-3, sets the PRACH Frequency Offset as defined in the 3GPP TS 36.211, i.e. determines the first physical resource block available for PRACH expressed as a physical resource block number. Remote command: CONFigure[:LTE]:UL:PRACh:FOFFset on page 187 User Manual 1308.9135.42 ─ 15 92 R&S®FS‑K101/103/105PC Demod Settings Defining Advanced Signal Characteristics Ncs Conf Selects the Ncs configuration, i.e. determines the Ncs value set according to TS 36.211, table 5.7.2.-2 and 5.7.2-3. Remote command: CONFigure[:LTE]:UL:PRACh:NCSC on page 188 Logical Root Sequ. Idx Selects the logical root sequence index. The logical root sequence index is used to generate preamble sequences. It is provided by higher layers. Remote command: CONFigure[:LTE]:UL:PRACh:RSEQ on page 188 Sequence Index (v) Defines the sequence index (v). The sequence index controls which of the 64 preambles available in a cell is used. If you select the "Auto" menu item, the software automatically selects the required sequence index. Remote command: CONFigure[:LTE]:UL:PRACh:SINDex on page 188 PRACH Preamble Mapping The frequency resource index fRA and the half frame indicator t1RA are neccessary to clearly specify the physical resource mapping of the PRACH in case a PRACH configuration index has more than one mapping alternative. If you turn on the "Auto Preamble Mapping", the software automatically detects fRA and t1RA. The values for both parameters are defined in table '5.7.1-4: Frame structure type 2 random access preamble mapping in time and frequency' (3GPP TS 36.211 v10.2.0). The frequency resource index and half frame indicator are available in TDD mode. Remote command: CONFigure[:LTE]:UL:PRACh:APM on page 187 CONFigure[:LTE]:UL:PRACh:FRINdex on page 188 CONFigure[:LTE]:UL:PRACh:HFINdicator on page 188 5.3.6 Defining Global Signal Characteristics The global settings contain settings that apply to the complete signal. The global settings are part of the "Uplink Advanced Signal Characteristics" tab of the "Demodulation Settings" dialog box. User Manual 1308.9135.42 ─ 15 93 R&S®FS‑K101/103/105PC Demod Settings Defining Advanced Signal Characteristics UE ID/n_RNTI............................................................................................................... 94 UE ID/n_RNTI Sets the radio network temporary identifier (RNTI) of the UE. Remote command: CONFigure[:LTE]:UL:UEID on page 189 User Manual 1308.9135.42 ─ 15 94 R&S®FS‑K101/103/105PC Analyzing Measurement Results 6 Analyzing Measurement Results The measurement software provides several tools to get more detailed information on the measurement results. The corresponding tools are part of the context menu. ► To access the context menu, click anywhere in the diagram grid with the right mouse button. Fig. 6-1: Context menu Using the marker You can use a marker to get the coordinates of a single point in the diagram area. ► Open the context menu and select the "Marker" menu item. When the marker is active, the software puts a check mark ( ) in front of the "Marker" menu item. When you turn it on, the software positions the marker on the trace maximum. After that you can move it around freely to any point of the trace. In result displays that contain more than one trace (for example EVM vs Carrier), you can select the trace the marker is positioned on (Peak, Minimum or Average trace) with the "Set Marker To" menu item. Note that "Set Marker To" is only available if a marker is already active. Marker positioning If you try to put the marker on a coordinate not occupied by the trace, the software puts the marker to the nearest trace maximum (if you place it above the trace) or the nearest trace minimum (if you place it below the trace). The marker coordinates are displayed in the upper left area of the diagram. The first number shows the vertical position, the second number the horizontal position of the marker including the units. User Manual 1308.9135.42 ─ 15 95 R&S®FS‑K101/103/105PC Analyzing Measurement Results If you want to reposition the marker on the trace maximum after moving it around, you have to first deactivate the marker and then reactivate it. To deactivate the marker, open the context menu and reselect the "Marker" menu item. Note that the marker is not available for all measurements and result displays. Displaying data points In result displays that contain a line trace only (for example the Power Spectrum), you can display the data points the trace is based on with the "Show Data Points" menu item. The data points are displayed in addition to the line trace. Some result displays already contain the data points by default (for example EVM vs Symbol). Note that information might get lost if you turn the data points off in these result displays. Zooming into the diagram area If you'd like to see parts of the diagram area in more detail, you can use the zoom. ► Open the context menu and select the "Zoom" menu item. The software opens a submenu with several zooming options. Fig. 6-2: Zooming options ● Zooming vertically and horizontally (XY) Click on any point in the diagram area and draw a rectangle with the mouse. The rectangle defines the part of the diagram area you are zooming into. ● Zooming horizontally (X) Click on any point in the diagram area and define the horizontal section of the diagram area you want to zoom into. ● Zooming vertically (Y) Click on any point in the diagram area and define the vertical section of the diagram area you want to zoom into. ● Zooming automatically (Auto XY) Automatically scales the diagram area so that the complete trace data is visible. Double-clicking on the diagram has the same effect. ● Restoring the default zoom The "Default Zoom" entry restores the default zoom. User Manual 1308.9135.42 ─ 15 96 R&S®FS‑K101/103/105PC Analyzing Measurement Results The software also provides functionality to restore the default zoom each time when the results are refreshed. ► Open the context menu and select the "Default Zoom on Update" menu item. Panning the trace If you'd like to see parts of the measurement results that are outside the diagram area, you can move the contents of the diagram area. To move the contents of the diagram area, click anywhere in the diagram area and drag the contents of the diagram area until the parts you'd like to see are visible. If there are parts of the trace data that are outside the visible display area, the software shows arrows to the right of the diagram area. The arrows point in the direction where the invisible trace data is. If parts of the trace data is outside the visible area, the arrows are yellow. If all data in a particular direction is outside the visible area, the arrows turn red. To make sure that the whole trace is always visible, you can use the automatic zoom ("Auto XY") available in the "Zoom" menu. ► Open the context menu and select the "Pan" menu item. The software opens a submenu with several panning options. Fig. 6-3: Panning options ● Panning vertically and horizontally (XY) Panning is possible in all directions. ● Panning horizontally (X) Panning is possible to the left and right. ● Panning vertically (Y) Panning is possible upwards and downwards. Copying an image to the clipboard If you want to document measurement results, you can move a copy of them to the clipboard of the operating system. ► Open the context menu and select the "Copy to Clipboard" menu item. User Manual 1308.9135.42 ─ 15 97 R&S®FS‑K101/103/105PC Data Management Importing and Exporting I/Q Data 7 Data Management For easy handling of special measurement configurations, the software allows you to import or export various kinds of data. 7.1 Importing and Exporting I/Q Data Instead of capturing data directly through hardware components, you can also analyze data that has been recorded previously and saved in a file. On the same lines, it is also possible to save the data that has been captured with an analyzer for further analysis at a later time or for documentation. You can store and load I/Q data in binary or ASCII format. For a correct display of the power, the I/Q data has to be scaled linearily in Volt (e.g. for the Capture Buffer result display). Loading I/Q data Load the contents of an I/Q data file into the software fast and easy by dragging and dropping the file somwhere into the user interface. The software updates the I/Q data to be measured automatically. All functionality to import and export data is in the "File" menu (or file manager) that you can access via the FILE key. ASCII format (.dat format) In case of the ASCII (.dat) format, the data is expected as I and Q values in alternating rows. <I value 1> <Q value 1> <I value 2> <Q value 2> (...) To be able to analyze previously recorded data, you have to set the input source to "File". When you start a measurement, the software will ask you to select a file that contains the data. To save data, enter the file manager and save the data with "Save IQ Data". Binary format (.iqw format) In case of the binary .iqw format, the data is expected in 32-bit floating point format. This format is also known as Little Endian, LSB Order or Intel format. User Manual 1308.9135.42 ─ 15 98 R&S®FS‑K101/103/105PC Data Management Managing Frame Data Example: The hexadecimal value 0x1D86E7BB would be decoded to -7.0655481E-3. For single antenna measurements, the order of the I/Q data is either IQIQIQ... or II...IQQ...Q. For MIMO measurements, you also have to consider the antenna in the order of the data, with alternating I and Q data for every antenna. [I/Q][antenna index]([symbol index]) Example: For a two antenna system, the string of data would like: I0(0),Q0(0),I1(0),Q1(0),I0(1),Q0(1),I1(1),Q1(1),I0(2),Q0(2),... Binary format (.iq.tar format) In case of the .iq.tar format, the I/Q data is stored in a compressed format with the file extension .iq.tar. An .iq.tar file contains I/Q data in binary format together with meta information that describes the nature and the source of data, e.g. the sample rate. The objective of the .iq.tar file format is to separate I/Q data from the meta information while still having both inside one file. In addition, the file format allows you to preview the I/Q data in a web browser, and allows you to include customized data. An .iq.tar file must contain the following files. ● I/Q parameter XML file Contains meta information about the I/Q data (e.g. sample rate). The filename can be defined freely, but there must be only one single I/Q parameter XML file inside an .iq.tar file. ● I/Q data binary file Contains the binary I/Q data of all channels. There must be only one single I/Q data binary file inside an .iq.tar file. Optionally, an .iq.tar file can contain the following file. ● I/Q preview XSLT file Contains a stylesheet to display the I/Q parameter XML file and a preview of the I/Q data in a web browser. 7.2 Managing Frame Data For fast access to the frame description (or structure of a signal), you can save it and again use it at a later time. To manage frame descriptions, enter the file manager and select "Save Demod Setup" to save the current setup or "Load Demod Setup" to restore a previously created setup. The frame decription contains the complete modulation structure of the signal. User Manual 1308.9135.42 ─ 15 99 R&S®FS‑K101/103/105PC Data Management Customizing Reference Symbols The frame structure is defined in the xml file format. The file contains all parameters that are part of the demodulation settings. If you want to define more than one allocation, you can do so by adding additional PRB entries (<PRB> element). Note the following restrictions for the frame description. ● You have to define at least one PRB. ● You can allocate a maximum of one frames. The example below shows a typical frame description. <FrameDefinition LinkDirection="uplink" TDDULDLAllocationConfiguration="0" RessourceBlocks="50" CP="auto" PhysLayCellIDGrp="Group 0" PhysLayID="ID 0" N_RNTI="0" N_f="0" NOfSubbands="4" N_RB_HO="4" NOfRB_PUCCH="4" DeltaShift="2" N1_cs="6" N2_RB="1" NPUCCH="0" DeltaOffset="0" PUCCHStructureFormat="F1 normal" N_c_fastforward="1600" HoppingBitInformation="0" FrequencyHopping="None" DemRefSeq="3GPP" DemPilBoostdBPUSCH="0" DemPilBoostdBPUCCH="0" GroupHop="0" SequenceHop="0" EnableN_PRS="1" Delta_ss="0" N_DMRS1="0" N_DMRS2="0" SoundRefSeq="3GPP" SoundRefBoostdB="0" SoundRefPresent="0" SoundRefSymOffs="13" SoundRefCAZAC_u="2" SoundRefCAZAC_q="0" SoundRefCAZAC_alpha="0" SoundRefCAZAC_mode="2" SoundRefB="0" SoundRefC="0" SRSSubframeConfiguration="0" SoundRefN_CS="0" SoundRefK_TC="0" SoundRefN_RRC="0" SoundRefb_hop="0" SoundRefI_SRS="0" SoundRefk0="24" SoundRefNumSubcarrier="132"> <Frame> <Subframe> <PRBs> <PRB Start="2" Length="10" Modulation="QPSK" PUCCHOn="0" BoostingdB="0"> </PRB> </PRBs> </Subframe> </Frame> <stControl PhaseTracking="1" TimingTracking="0" CompensateDCOffset="1" UseBitStreamScrambling="1" ChannelEstimationRange="2" AutoDemodulation="1"> </stControl> </FrameDefinition> 7.3 Customizing Reference Symbols The software supports the use of customized iq sequences for the reference signal. The sequence of symbols for the reference signal is a string of I/Q data. Customizing iq sequences For more information on customizing I/Q symbol sequences see chapter 7.1, "Importing and Exporting I/Q Data", on page 98. The length of the I/Q symbol sequence must be a multiple of 2. If not enough I/Q symbols are available for mapping, the I/Q symbols are repeated. User Manual 1308.9135.42 ─ 15 100 R&S®FS‑K101/103/105PC Data Management Importing and Exporting Limits Importing iq sequences The I/Q symbol definition file must be placed in the same folder as the EUTRA/LTE application binary ("%Program folder%\Rohde-Schwarz\EUTRA LTE" by default). The name of the Reference Symbols definition file must be EutraUL_Pilots.iqw 7.4 Importing and Exporting Limits In addition to the limits defined by the standard, you can create and use customized limits. After you have created the file, you have to name it Default.eutra_limits and copy it into the same folder as the software binary ("%Program folder%\RohdeSchwarz\EUTRA LTE" by default). The limits are automatically loaded when you start the software. The limits you can customize work for the Result Summary. Limits are defined in the xml file format. Any xml elements you do not want to define can be left out, either by making no entry or by deleting the corresponding element. <?xml version="1.0" encoding="utf-8"?> <Limits> <UL> <EVM> <PUSCHQPSK Mean="0.175"/><!--Unit: linear (1 = 0 dB, 0.1 = -20 dB)--> <PUSCH16QAM Mean="0.125"/><!--Unit: linear (1 = 0 dB, 0.1 = -20 dB)--> <PUSCH64QAM/><!--Unit: linear (1 = 0 dB, 0.1 = -20 dB)--> <PhysicalChannel/><!--Unit: linear (1 = 0 dB, 0.1 = -20 dB)--> <PhysicalSignal/><!--Unit: linear (1 = 0 dB, 0.1 = -20 dB)--> <All/><!--Unit: linear (1 = 0 dB, 0.1 = -20 dB)--> <DemodulationReference/><!--Unit: linear (1 = 0 dB, 0.1 = -20 dB)--> <SoundingReference/><!--Unit: linear (1 = 0 dB, 0.1 = -20 dB)--> </EVM> <FrequencyError/><!--Unit: [Hz]--> <SamplingClockError/><!--Unit [ppm]--> <IQOffset/><!--Unit: linear (1 = 0 dB, 0.1 = -20 dB)--> <IQGainImbalance/><!--Unit: linear (1 = 0 dB, 0.1 = -20 dB)--> <IQQuadraturError/><!--Unit: [°]--> <PowerTotalPhysChan/><!--Unit: [W]--> <PowerTotalDemodRef/><!--Unit: [W]--> <PowerTotalSoundingRef/><!--Unit: [W]--> <PowerTotal/><!--Unit: [W]--> <CrestFactor/><!--Unit: linear (1 = 0 dB, 10 = 10 dB)--> </UL> </Limits> User Manual 1308.9135.42 ─ 15 101 R&S®FS‑K101/103/105PC Measurement Basics Symbols and Variables 8 Measurement Basics This chapter provides background information on the measurements and result displays available with the LTE Analysis Software. ● ● ● ● ● ● Symbols and Variables......................................................................................... 102 Overview............................................................................................................... 103 The LTE Uplink Analysis Measurement Application............................................. 103 MIMO Measurement Guide...................................................................................107 Performing Time Alignment Measurements..........................................................113 SRS EVM Calculation........................................................................................... 114 8.1 Symbols and Variables The following chapters use various symbols and variables in the equations that the measurements are based on. The table below explains these symbols for a better understanding of the measurement principles. al,kâl,k data symbol (actual, decided) Al,k data symbol after DFT-precoding Δf, Δ coarse carrier frequency offset between transmitter and receiver (actual, coarse estimate) Δfres residual carrier frequency offset ζ relative sampling frequency offset Hl,k, l,k channel transfer function (actual, estimate) i time index îcoarse, îfine timing estimate (coarse, fine) k subcarrier index l SC-FDMA symbol index NDS number of SC-FDMA data symbols NFFT length of FFT Ng number of samples in cyclic prefix (guard interval) Ns number of Nyquist samples NTX number of allocated subcarriers Nk,l noise sample n index of modulated QAM symbol before DFT precoding Φl common phase error User Manual 1308.9135.42 ─ 15 102 R&S®FS‑K101/103/105PC Measurement Basics Overview ri received sample in the time domain R'k,l uncompensated received sample in the frequency domain rn,l equalized received symbols of measurement path after IDFT T duration of the useful part of an SC-FDMA symbol Tg duration of the guard interval Ts total duration of SC-FDMA symbol 8.2 Overview The digital signal processing (DSP) involves several stages until the software can present results like the EVM. The contents of this chapter are structered like the DSP. 8.3 The LTE Uplink Analysis Measurement Application The block diagram in figure 8-1 shows the general structure of the LTE uplink measurement application from the capture buffer containing the I/Q data up to the actual analysis block. After synchronization a fully compensated signal is produced in the reference path (purple) which is subsequently passed to the equalizer. An IDFT of the equalized symbols yields observations for the QAM transmit symbols an.l from which the data estimates ân,l are obtained via hard decision. Likewise a user defined compensation as well as equalization is carried out in the measurement path (cyan) and after an IDFT the observations of the QAM transmit symbols are provided. Accordingly, the measurement path might still contain impairments which are compensated in the reference path. The symbols of both signal processing paths form the basis for the analysis. User Manual 1308.9135.42 ─ 15 103 R&S®FS‑K101/103/105PC Measurement Basics The LTE Uplink Analysis Measurement Application Fig. 8-1: Block diagram for the LTE UL measurement application 8.3.1 Synchronization In a first step the areas of sufficient power are identified within the captured I/Q data stream which consists of the receive samples ri. For each area of sufficient power, the analyzer synchronizes on subframes of the uplink generic frame structure [3]. After this coarse timing estimation, the fractional part as well as the integer part of the carrier frequency offset (CFO) are estimated and compensated. In order to obtain an OFDM demodulation via FFT of length NFFT that is not corrupted by ISI, a fine timing is established which refines the coarse timing estimate. A phase tracking based on the reference SC-FDMA symbols is performed in the frequency domain. The corresponding tracking estimation block provides estimates for ● the relative sampling frequency offset ζ ● the residual carrier frequency offset Δfres ● the common phase error Φl According to references [7] and [8], the uncompensated samples R'k,l in the DFT-precoded domain can be stated as User Manual 1308.9135.42 ─ 15 104 R&S®FS‑K101/103/105PC Measurement Basics The LTE Uplink Analysis Measurement Application Rk' ,l Ak ,l H k ,l e jl e j 2 N S CPE N FFT k l SFO e j 2 N S N FFT f res T l res .CFO N k ,l (8 - 1) with ● the DFT precoded data symbol Ak,l on subcarrier k at SC-FDMA symbol l, ● the channel transfer function Hk,l, ● the number of Nyquist samples NS within the total duration TS, ● the duration of the useful part of the SC-FDMA symbol T=TS-Tg ● the independent and Gaussian distributed noise sample Nk,l Within one SC-FDMA symbol, both the CPE and the residual CFO cause the same phase rotation for each subcarrier, while the rotation due to the SFO depends linearly on the subcarrier index. A linear phase increase in symbol direction can be observed for the residual CFO as well as for the SFO. The results of the tracking estimation block are used to compensate the samples R'k,l completely in the reference path and according to the user settings in the measurement path. Thus the signal impairments that are of interest to the user are left uncompensated in the measurement path. After having decoded the data symbols in the reference path, an additional data-aided phase tracking can be utilized to refine the common phase error estimation. 8.3.2 Analysis The analysis block of the EUTRA/LTE uplink measurement application allows to compute a variety of measurement variables. EVM The most important variable is the error vector magnitude which is defined as EVM l ,k ~ rn,l aˆ n,l 2 E an,l (8 - 2) for QAM symbol n before precoding and SC-FDMA symbol l. Since the normalized average power of all possible constellations is 1, the equation can be simplified to EVM n,l ~ rn,l aˆ n,l (8 - 3) The average EVM of all data subcarriers is then User Manual 1308.9135.42 ─ 15 105 R&S®FS‑K101/103/105PC Measurement Basics The LTE Uplink Analysis Measurement Application EVM data 1 N DS NTX N LB 1 NTX 1 l 0 n 0 EVM n2,l (8 - 4) for NDS SC-FDMA data symbols and the NTX allocated subcarriers. I/Q imbalance The I/Q imbalance contained in the continuous received signal r(t) can be written as r t I st jQ st (8 - 5) where s(t) is the transmit signal and I and Q are the weighting factors describing the I/Q imbalance. We define that I:=1 and Q:=1+ΔQ. The I/Q imbalance estimation makes it possible to evaluate the modulator gain balance | 1 Q | (8 - 6) and the quadrature mismatch arg{1 Q} (8 - 7) based on the complex-valued estimate . Basic in-band emissions measurement The in-band emissions are a measure of the interference falling into the non-allocated resources blocks. The relative in-band emissions are given by Emissionsrelative RB Emissionsabsolute RB 1 TS N RB c 12 N RB 1 c tT Y t , f 2 S (8 - 8) where TS is a set |TS| of SC-FDMA symbols with the considered modulation scheme being active within the measurement period, ΔRB is the starting frequency offset between the allocated RB and the measured non-allocated RB (e.g. ΔRB=1 or ΔRB=-1 for the first adjacent RB), c is the lower edge of the allocated BW, and Y(t,f) is the frequency domain signal evaluated for in-band emissions. NRB is the number of allocated RBs . The basic in-band emissions measurement interval is defined over one slot in the time domain. User Manual 1308.9135.42 ─ 15 106 R&S®FS‑K101/103/105PC Measurement Basics MIMO Measurement Guide Other measurement variables Without going into detail, the EUTRA/LTE uplink measurement application additionally provides the following results: ● Total power ● Constellation diagram ● Group delay ● I/Q offset ● Crest factor ● Spectral flatness 8.4 MIMO Measurement Guide Performing MIMO measurements requires additional equipment that allows you to capture multiple data streams. ● Several signal analyzers, the number depending on the number of data streams you have to capture. Alternatively, you can use an oscilloscope with multiple channels, the number of channels also depending on the number of data streams you have to capture. ● At least one analyzer equipped with option R&S FS(x)-K103(PC) that unlocks MIMO functionality. True MIMO measurements are useful to verifiy MIMO precoding implementations for setups where it is not possible to decode the transmit data using only one antenna (e.g. applying spatial multiplexing MIMO precoding with more than 1 layer) and to measure the hardware performance of the MIMO transmitter hardware in a true MIMO measurement setup. 8.4.1 MIMO Measurements with Signal Analyzers MIMO measurements require multiple signal analyzers. The number depends on the number of data streams you have to capture. For valid measurement results, the frequencies of the analyzers in the test setup have to be synchronized. It is also necessary to configure the trigger system properly to capture the data simultaneously. Synchronizing the frequency The frequency of the analyzers in the test setup have to be synchronized. Thus, one of the analyzers (master) controls the other analyzers (slaves) in the test setup. The master analyzer has to be equipped with the LTE MIMO application and provides the reference oscillator source for the slave analyzers. ► Connect the REF OUT of the master to the REF IN connector of the slaves. Make sure to configure the slaves to use an external reference (➙ General Setup menu). User Manual 1308.9135.42 ─ 15 107 R&S®FS‑K101/103/105PC Measurement Basics MIMO Measurement Guide If you are using a measurement setup with several R&S signal generators (for example R&S SMW), the situation is similar. One of the generators controls the other via the external reference. ► Connect the REF OUT of the master to the REF IN of the slaves. Make sure to configure the slaves to use an external reference (➙ Reference Oscillator settings). Triggering MIMO measurements For valid MIMO measurements, it is crucial to capture all data streams simultaneously. To do so, you need a trigger signal provided by the DUT or the signal generator. The trigger signal has to be connected to all analyzers. If you have several signal generators in the setup, the master generator has to trigger the slave as well. The 8-2 shows a MIMO setup with two (or optional four) analyzers and one (or optional two) signal generators with two channels. Fig. 8-2: MIMO Hardware Setup You can use several trigger configurations, with or without additional hardware. Measurements with a delayed trigger signal Simultaneous capture of the I/Q data requires the trigger inputs of all instruments in the setup to be armed. User Manual 1308.9135.42 ─ 15 108 R&S®FS‑K101/103/105PC Measurement Basics MIMO Measurement Guide Arming a trigger does not happen immediately when you start a measurement, but is delayed slightly for a number of reasons, for example: ● Connecting several instruments with a LAN or GPIB connection usually causes a certain network delay. ● Tasks like the auto leveling function require some time to finish. Because of these factors, you have to make sure that the trigger event does not occur during this time frame. You can do so, for example, by configuring an appropriate delay time on the DUT. The exact delay depends on the GPIB or network condition and the input settings. You can estimate the delay by performing a single measurement on one analyzer. Measure the time it takes until the "DSP" indicator starts flashing. Note that this estimation also includes the time it takes to transfer the I/Q samples from the analyzer to the software. A typical delay to arm the trigger is 2 seconds per instrument. The minimum delay of the trigger signal must now be greater than the measured time multiplied with the number of measured antennas (the number of analyzers), because the spectrum analyzers are initialized sequentially. The usage of an LTE frame trigger is not possible for this measurement setup. Measurements with a frame trigger signal You can use a frame trigger if all transmitted LTE frames use the same frame configuration and contain the same data. In this case, the analyzers in the test setup capture data from different LTE frames but with the same content. This method to analyze data, however, raises one issue. The phase variations of the reference oscillators of the different signals that are transmitted are not the same, because the data is not captured simultaneously. The result is a phase error which degrades the EVM (see the figures below). An application for this measurement method is, for example, the test of the MIMO precoding implementation. Because of the bad EVM values, it is not recommended to use this test setup to measure hardware performance. User Manual 1308.9135.42 ─ 15 109 R&S®FS‑K101/103/105PC Measurement Basics MIMO Measurement Guide Fig. 8-3: Constellation diagram Fig. 8-4: EVM vs OFDM symbol number Measurements with the R&S FS-Z11 trigger unit The trigger unit R&S FS-Z11 is a device that makes sure that the measurement starts on all analyzers (master and slaves) at the same time. Connecting the trigger unit ► Connect the NOISE SOURCE output of the master analyzer to the NOISE SOURCE CONTROL input of the trigger unit. ► Connect the EXT TRIG inputs of all analyzers (master and slaves) to the TRIG OUT 1 to 4 (or 1 and 2 in case of measurements on two antennas) of the trigger unit. The order is irrelevant, that means it would be no problem if you connect the master analyzer to the TRIG OUT 2 of the trigger unit. With this setup, all analyzers (including the master analyzer) are triggered by the trigger unit. The trigger unit also has a TRIG INPUT connector that you can connect an external trigger to. If you are using an external trigger, the external trigger supplies the trigger event. If not, the analyzer noise source control supplies the trigger event. Note that if you do not use an external trigger, the TRIG INPUT must remain open. User Manual 1308.9135.42 ─ 15 110 R&S®FS‑K101/103/105PC Measurement Basics MIMO Measurement Guide To use the R&S FS-Z11 as the trigger source, you have to select it as the trigger source in the "General Settings" dialog box of the LTE measurement application. For more information see "Configuring the Trigger" on page 63. DUT Master Analyzer NOISE SOURCE RF OUTPUT 1 RF INPUT RF OUTPUT 2 TRIGGER INPUT RF OUTPUT 3 Slave Analyzer 1 RF OUTPUT 4 TRIGGER OUTPUT RF INPUT TRIGGER INPUT Slave Analyzer 1 FS-Z11 Trigger Unit TRIG INPUT TRIG MANUAL RF INPUT TRIG OUT 1 TRIGGER INPUT TRIG OUT 2 Slave Analyzer 1 TRIG OUT 3 NOISE SOURCE TRIG OUT 4 RF INPUT TRIGGER INPUT Cable Trigger Cable Trigger Optional (DUT with TRIGGER OUTPUT) Cable RF 8.4.2 MIMO Measurements with Oscilloscopes This part presents an approach to measure a MIMO signal transmitted on two or four antennas using the R&S®RTO1044 digital oscilloscope, 4 GHz, 4 channels and the R&S®FS-K102/103PC LTE MIMO downlink/uplink PC software. This has multiple advantages: ● Only one measurement instrument is required. This not only reduces the number of test instruments but also simplifies the test setup and cabling (no reference oscillator and trigger cabling, no additional hardware for synchronization required like the R&S®FS-Z11). ● The measurement time is reduced. For measuring LTE signals with the RTO it has to be equipped with the options R&S®RTO-B4 and R&S®RTO-K11. The hardware setup is illustrated in figure 8-5. All transmit antennas (TX) of the device under test (DUT) or an SMU are connected to the RF input of the RTO. Either two or optionally four antennas are attached. The LTE-Software runs on a PC and is connected to the RTO via a local area network (LAN). User Manual 1308.9135.42 ─ 15 111 R&S®FS‑K101/103/105PC Measurement Basics MIMO Measurement Guide Fig. 8-5: Test setup for LTE MIMO measurements with an oscilloscope To successfully connect the software to the oscilloscope, enter the correct network address in the "Analyzer Configuration" table and define the hardware properties (for example the number of input channels). Fig. 8-6: Configuration of the R&S RTO connection and input channels For configuring the number of active R&S RTO inputs the DUT MIMO configuration (2 Tx antennas or 4 Tx antennas) and the "Tx Antenna Selection" must be set. The DUT MIMO configuration describes which antennas are available and the Tx antenna selection defines how many I/Q data streams are captured and which antennas are assigned to the streams. To measure more than one antenna at once, "Tx Antenna Selection" must be set to "All", "Auto (2 Antennas)" or "Auto (4 Antennas)". ● "All": all available Tx antennas are measured and the antennas are assigned to the streams in ascending order. ● "Auto": the antenna assignment is automatically detected. In case of "Auto (2 Antennas)" two streams are captured. In case of "Auto (4 Antennas)" four streams are captured. The signal level of each R&S RTO input channel is measured and the reference level and attenuation settings are adjusted automatically. If a manual setting is preferred and for speed optimization, the automatic level adjustment can be disabled in the "General" tab of the "General Settings" dialog box. User Manual 1308.9135.42 ─ 15 112 R&S®FS‑K101/103/105PC Measurement Basics Performing Time Alignment Measurements 8.5 Performing Time Alignment Measurements The measurement software allows you to perform Time Alignment measurements between different antennas. You can perform this measurement in 2 Tx antenna MIMO setups. The result of the measurement is the Time Alignment Error. The Time Alignment Error is the time offset between a reference antenna (for example antenna 1) and another antenna. The Time Alignment Error results are summarized in the corresponding result display. A schematic description of the results is provided in figure 8-7. Fig. 8-7: Time Alignment Error (2 Tx antennas) Test setup Successful Time Alignment measurements require a correct test setup. A typical test setup is shown in figure 8-8. Fig. 8-8: Hardware setup For best measurement result accuracy it is recommended to use cables of the same length and identical combiners as adders. In the software, make sure to correctly apply the following settings. ● select a reference antenna in the MIMO Configuration dialog box (not "All") ● select more than one antenna in the MIMO Configuration dialog box ● select Codeword-to-Layer mapping "2/1" or "2/2" ● select an Auto Demodulation different to "Subframe Configuration & DMRS" ● the transmit signals of all available Tx antennas have to added together User Manual 1308.9135.42 ─ 15 113 R&S®FS‑K101/103/105PC Measurement Basics SRS EVM Calculation 8.6 SRS EVM Calculation In order to calculate an accurate EVM, a channel estimation needs to be done prior to the EVM calculation. However, the channel estimation requires a minimum of two resource elements containing reference symbols on a subcarrier. Depending on the current Channel Estimation Range setting, this means that either at least two reference symbols ("Pilot Only") or one reference symbol and at least one data symbol ("Pilot and Payload") need to be available on the subcarrier the EVM is to be measured. For PUSCH, PUCCH and PRACH regions, these conditions are normally fulfilled because the DMRS (= Demodulation Reference Signal) is already included. However, the SRS may also be located on subcarriers which do not occupy any other reference symbols (see figure 8-9). Fig. 8-9: No EVM can be measured for the SRS In this case it is not reasonable to calculate an EVM and no SRS EVM value will be displayed for the corresponding subframe. If the SRS subcarriers contain two DMRS symbols (or one DMRS and one PUSCH for "Pilot and Payload" channel estimation range) the SRS EVM can be measured (see figure 8-10). User Manual 1308.9135.42 ─ 15 114 R&S®FS‑K101/103/105PC Measurement Basics SRS EVM Calculation Fig. 8-10: The EVM of the complete SRS can be measured The SRS allocation might cover subcarriers which partly fulfill the conditions mentioned above and partly do not. In this case the EVM value given in the Allocation Summary will be calculated based only on the subcarriers which fulfill the above requirements (see figure 8-11). Fig. 8-11: The EVM for parts of the SRS can be measured User Manual 1308.9135.42 ─ 15 115 R&S®FS‑K101/103/105PC Remote Commands Overview of Remote Command Suffixes 9 Remote Commands When working via remote control, note that you have to establish a connection between your remote scripting tool and the software. Because the software runs directly on the PC and not an R&S instrument, you have to connect the remote scripting tool to your PC and not an instrument. 1. Start the software. 2. If you want to capture I/Q data from an analyzer, connect the software to that analyzer. 3. Start the remote scripting tool (e.g. Matlab) on the PC. 4. Connect the remote scripting tool to the local host (e.g. TCPIC:LocalHost) ● ● ● ● ● ● ● ● ● ● Overview of Remote Command Suffixes.............................................................. 116 Introduction........................................................................................................... 117 Remote Commands to Select a Result Display.................................................... 121 Remote Commands to Perform Measurements....................................................122 Remote Commands to Read Numeric Results..................................................... 123 Remote Commands to Read Trace Data..............................................................130 Remote Commands to Configure General Settings..............................................150 Remote Commands to Configure the Demodulation............................................ 167 Configuring the Software.......................................................................................189 Managing Files......................................................................................................190 9.1 Overview of Remote Command Suffixes This chapter provides an overview of all suffixes used for remote commands in the LTE application. Suffix Range Description <allocation> 0 to 99 Selects an allocation. <instrument> 1 to 8 Selects an instrument for MIMO measurements. <antenna> 2 to 4 Selects an antenna for MIMO measurements. <cci> 1 to 2 Selects a component carrier <cluster> 1 to 2 Selects a cluster (uplink only). <cwnum> 1 to n Selects a codeword. <k> Selects a limit line. Irrelevant for the LTE software. User Manual 1308.9135.42 ─ 15 116 R&S®FS‑K101/103/105PC Remote Commands Introduction Suffix Range <m> Description Selects a marker. Irrelevant for the LTE software. <n> 1 to 4 Selects a measurement window. <subframe> 0 to 39 Selects a subframe. <t> Selects a trace. Irrelevant for the LTE application. 9.2 Introduction Commands are program messages that a controller (e.g. a PC) sends to the instrument or software. They operate its functions ('setting commands') and request information ('query commands'). Some commands only work either way (setting only, query only), others work both ways (setting and query). The syntax of a SCPI command consists of a so-called header and, in most cases, one or more parameters. A query command must append a question mark after the last header element, even if it contains a parameter. A header contains one or more keywords, separated by a colon. Header and parameters are separated by a "white space" (ASCII code 0 to 9, 11 to 32 decimal, e.g. blank). If there is more than one parameter for a command, these are separated by a comma from one another. This chapter summarizes the most important characteristics that you need to know when working with SCPI commands. For a more complete description, refer to the manual of one of the R&S analyzers. Remote command examples Note that some remote command examples mentioned in this introductory chapter may not be supported by this application. 9.2.1 Long and Short Form The keywords have a long and a short form. You can use either the long or the short form, but no other abbreviations of the keywords. The short form is emphasized in upper case letter. Note however, that this emphasis only serves the purpose to distinguish the short from the long form in the manual. For the instrument, the case does not matter. User Manual 1308.9135.42 ─ 15 117 R&S®FS‑K101/103/105PC Remote Commands Introduction Example: SENSe:FREQuency:CENTer is the same as SENS:FREQ:CENT. 9.2.2 Numeric Suffixes Some keywords have a numeric suffix if the command can be applied to multiple instances of an object. In that case, the suffix selects a particular instance (e.g. a measurement window). Numeric suffixes are indicated by angular brackets (<n>) next to the keyword. If you don't use a suffix for keywords that support one, it is treated as a 1. Example: DISPlay[:WINDow<1...4>]:ZOOM:STATe enables the zoom in a particular measurement window, selected by the suffix at WINDow. DISPlay:WINDow4:ZOOM:STATe ON refers to window 4. 9.2.3 Optional Keywords Some keywords are optional and are only part of the syntax because of SCPI compliance. You can include them in the header or not. Note that if an optional keyword has a numeric suffix and you need to use the suffix, you have to include the optional keyword. Otherwise, the suffix is recognized as a 1. Optional keywords are emphasized with square brackets. Example: Without a numeric suffix in the optional keyword: [SENSe:]FREQuency:CENTer is the same as FREQuency:CENTer With a numeric suffix in the optional keyword: DISPlay[:WINDow<1...4>]:ZOOM:STATe DISPlay:ZOOM:STATe ON enables the zoom in window 1 (no suffix). DISPlay:WINDow4:ZOOM:STATe ON enables the zoom in window 4. 9.2.4 | (Vertical Stroke) A vertical stroke indicates alternatives for a specific keyword. You can use both keywords to the same effect. Example: [SENSe:]BANDwidth|BWIDth[:RESolution] In the short form without optional keywords, BAND 1MHZ would have the same effect as BWID 1MHZ. User Manual 1308.9135.42 ─ 15 118 R&S®FS‑K101/103/105PC Remote Commands Introduction 9.2.5 SCPI Parameters Many commands feature one or more parameters. If a command supports more than one parameter, these are separated by a comma. Example: LAYout:ADD:WINDow Spectrum,LEFT,MTABle Parameters may have different forms of values. ● ● ● ● ● 9.2.5.1 Numeric Values.....................................................................................................119 Boolean.................................................................................................................120 Text....................................................................................................................... 120 Character Strings.................................................................................................. 120 Block Data.............................................................................................................120 Numeric Values Numeric values can be entered in any form, i.e. with sign, decimal point or exponent. In case of physical quantities, you can also add the unit. If the unit is missing, the command uses the basic unit. Example: with unit: SENSe:FREQuency:CENTer 1GHZ without unit: SENSe:FREQuency:CENTer 1E9 would also set a frequency of 1 GHz. Values exceeding the resolution of the instrument are rounded up or down. If the number you have entered is not supported (e.g. in case of discrete steps), the command returns an error. Querying numeric values When you query numeric values, the system returns a number. In case of physical quantities, it applies the basic unit (e.g. Hz in case of frequencies). The number of digits after the decimal point depends on the type of numeric value. Example: Setting: SENSe:FREQuency:CENTer 1GHZ Query: SENSe:FREQuency:CENTer? would return 1E9 In some cases, numeric values may be returned as text. ● INF/NINF Infinity or negative infinity. Represents the numeric values 9.9E37 or -9.9E37. ● NAN Not a number. Represents the numeric value 9.91E37. NAN is returned in case of errors. User Manual 1308.9135.42 ─ 15 119 R&S®FS‑K101/103/105PC Remote Commands Introduction 9.2.5.2 Boolean Boolean parameters represent two states. The "ON" state (logically true) is represented by "ON" or a numeric value 1. The "OFF" state (logically untrue) is represented by "OFF" or the numeric value 0. Querying boolean parameters When you query boolean parameters, the system returns either the value 1 ("ON") or the value 0 ("OFF"). Example: Setting: DISPlay:WINDow:ZOOM:STATe ON Query: DISPlay:WINDow:ZOOM:STATe? would return 1 9.2.5.3 Text Text parameters follow the syntactic rules of keywords. You can enter text using a short or a long form. For more information see chapter 9.2.1, "Long and Short Form", on page 117. Querying text parameters When you query text parameters, the system returns its short form. Example: Setting: SENSe:BANDwidth:RESolution:TYPE NORMal Query: SENSe:BANDwidth:RESolution:TYPE? would return NORM 9.2.5.4 Character Strings Strings are either text or number. They have to be in straight quotation marks. You can use a single quotation mark - ' - or a double quotation mark - ". Example: INSTRument:DELete 'Spectrum' 9.2.5.5 Block Data Block data is a format which is suitable for the transmission of large amounts of data. The ASCII character # introduces the data block. The next number indicates how many of the following digits describe the length of the data block. In the example the 4 following digits indicate the length to be 5168 bytes. The data bytes follow. During the transmission of these data bytes all end or other control signs are ignored until all bytes are transmitted. #0 specifies a data block of indefinite length. The use of the indefinite format requires a NL^END message to terminate the data block. This format is useful User Manual 1308.9135.42 ─ 15 120 R&S®FS‑K101/103/105PC Remote Commands Remote Commands to Select a Result Display when the length of the transmission is not known or if speed or other considerations prevent segmentation of the data into blocks of definite length. 9.3 Remote Commands to Select a Result Display CALCulate<n>:FEED..................................................................................................... 121 DISPlay[:WINDow<n>]:TABLe.........................................................................................122 CALCulate<n>:FEED <DispType> This command selects the measurement and result display. Parameters: <DispType> Example: String containing the short form of the result display. See table below for details. CALC2:FEED 'PVT:CBUF' Select Capture Buffer to be displayed on screen B. Result display Parameter ACLR 'SPEC:ACP' Allocation Summary 'STAT:ASUM' Bitstream 'STAT:BSTR' Capture Buffer 'PVT:CBUF' CCDF 'STAT:CCDF' Constellation Diagram 'CONS:CONS' CSI RS Weights (Magnitude) 'BEAM:IRWM' CSI RS Weights (Phase) 'BEAM:IRWP' DFT Precoded Constellation 'CONS:DFTC' EVM vs Carrier 'EVM:EVCA' EVM vs Subframe 'EVM:EVSU' EVM vs Symbol 'EVM:EVSY' EVM vs Symbol x Carrier 'EVM:EVSC' Group Delay 'SPEC:GDEL' Inband Emission 'SPEC:IE' Power Spectrum 'SPEC:PSPE' Power vs Symbol x Carrier 'SPEC:PVSC' Spectrum Flatness 'SPEC:SFL' Spectrum Flatness Difference 'SPEC:SFD' Spectrum Flatness SRS 'SPEC:SFSR' User Manual 1308.9135.42 ─ 15 121 R&S®FS‑K101/103/105PC Remote Commands Remote Commands to Perform Measurements Result display Parameter Spectrum Emission Mask 'SPEC:SEM' Time Alignment Error 'PVT:TAER' DISPlay[:WINDow<n>]:TABLe <State> This command turns the result summary on and off. Parameters: <State> ON Turns the result summary on and removes all graphical results from the screen. OFF Turns the result summary off and restores the graphical results that were previously set. Example: DISP:TABL OFF Turns the result summary off. 9.4 Remote Commands to Perform Measurements INITiate[:IMMediate]....................................................................................................... 122 INITiate:REFResh.......................................................................................................... 122 [SENSe]:SYNC[:STATe]?............................................................................................... 123 INITiate[:IMMediate] This command initiates a new measurement sequence. With a frame count > 0, this means a restart of the corresponding number of measurements. In single sweep mode, you can synchronize to the end of the measurement with *OPC. In continuous sweep mode, synchronization to the end of the sweep is not possible. Example: INIT Initiates a new measurement. Usage: Event INITiate:REFResh This command updates the current I/Q measurement results to reflect the current measurement settings. No new I/Q data is captured. Thus, measurement settings apply to the I/Q data currently in the capture buffer. The command applies exclusively to I/Q measurements. It requires I/Q data. User Manual 1308.9135.42 ─ 15 122 R&S®FS‑K101/103/105PC Remote Commands Remote Commands to Read Numeric Results Example: INIT:REFR The application updates the IQ results Usage: Event [SENSe]:SYNC[:STATe]? This command queries the current synchronization state. Return values: <State> The string contains the following information. A zero represents a failure and a one represents a successful synchronization. If no compatible frame has been found, the command returns '0,0,0'. Example: SYNC:STAT? Would return, e.g. '1' for successful synchronization. Usage: Query only 9.5 Remote Commands to Read Numeric Results FETCh:SUMMary:CRESt:MAXimum?.............................................................................. 124 FETCh:SUMMary:CRESt:MINimum?............................................................................... 124 FETCh:SUMMary:CRESt[:AVERage]?............................................................................. 124 FETCh:SUMMary:EVM[:ALL]:MAXimum?.........................................................................124 FETCh:SUMMary:EVM[:ALL]:MINimum?..........................................................................124 FETCh:SUMMary:EVM[:ALL][:AVERage]?........................................................................124 FETCh:SUMMary:EVM:PCHannel:MAXimum?................................................................. 125 FETCh:SUMMary:EVM:PCHannel:MINimum?...................................................................125 FETCh:SUMMary:EVM:PCHannel[:AVERage]?................................................................ 125 FETCh:SUMMary:EVM:PSIGnal:MAXimum?.................................................................... 125 FETCh:SUMMary:EVM:PSIGnal:MINimum?..................................................................... 125 FETCh:SUMMary:EVM:PSIGnal[:AVERage]?................................................................... 125 FETCh:SUMMary:EVM:SDQP[:AVERage]?...................................................................... 125 FETCh:SUMMary:EVM:SDSF[:AVERage]?.......................................................................125 FETCh:SUMMary:EVM:SDST[:AVERage]?.......................................................................126 FETCh:SUMMary:EVM:UCCD[:AVERage]?......................................................................126 FETCh:SUMMary:EVM:UCCH[:AVERage]?......................................................................126 FETCh:SUMMary:EVM:UPRA[:AVERage]?...................................................................... 127 FETCh:SUMMary:EVM:USQP[:AVERage]?...................................................................... 127 FETCh:SUMMary:EVM:USSF[:AVERage]?.......................................................................127 FETCh:SUMMary:EVM:USST[:AVERage]?.......................................................................127 FETCh:SUMMary:FERRor:MAXimum?............................................................................ 128 FETCh:SUMMary:FERRor:MINimum?..............................................................................128 FETCh:SUMMary:FERRor[:AVERage]?........................................................................... 128 FETCh:SUMMary:GIMBalance:MAXimum?...................................................................... 128 FETCh:SUMMary:GIMBalance:MINimum?....................................................................... 128 User Manual 1308.9135.42 ─ 15 123 R&S®FS‑K101/103/105PC Remote Commands Remote Commands to Read Numeric Results FETCh:SUMMary:GIMBalance[:AVERage]?..................................................................... 128 FETCh:SUMMary:IQOFfset:MAXimum?........................................................................... 128 FETCh:SUMMary:IQOFfset:MINimum?............................................................................ 128 FETCh:SUMMary:IQOFfset[:AVERage]?.......................................................................... 128 FETCh:SUMMary:POWer:MAXimum?..............................................................................129 FETCh:SUMMary:POWer:MINimum?...............................................................................129 FETCh:SUMMary:POWer[:AVERage]?............................................................................ 129 FETCh:SUMMary:QUADerror:MAXimum?........................................................................ 129 FETCh:SUMMary:QUADerror:MINimum?......................................................................... 129 FETCh:SUMMary:QUADerror[:AVERage]?.......................................................................129 FETCh:SUMMary:SERRor:MAXimum?............................................................................ 129 FETCh:SUMMary:SERRor:MINimum?............................................................................. 129 FETCh:SUMMary:SERRor[:AVERage]?........................................................................... 129 FETCh:SUMMary:TFRame?........................................................................................... 130 FETCh:TAERror[:CC<cci>]:ANTenna<antenna>:MAXimum?..............................................130 FETCh:TAERror[:CC<cci>]:ANTenna<antenna>:MINimum?...............................................130 FETCh:TAERror[:CC<cci>]:ANTenna<antenna>[:AVERage]?.............................................130 FETCh:SUMMary:CRESt:MAXimum? FETCh:SUMMary:CRESt:MINimum? FETCh:SUMMary:CRESt[:AVERage]? This command queries the average crest factor as shown in the result summary. Return values: <CrestFactor> <numeric value> Crest Factor in dB. Example: FETC:SUMM:CRES? Returns the current crest factor in dB. Usage: Query only FETCh:SUMMary:EVM[:ALL]:MAXimum? FETCh:SUMMary:EVM[:ALL]:MINimum? FETCh:SUMMary:EVM[:ALL][:AVERage]? This command queries the EVM of all resource elements. Return values: <EVM> <numeric value> Minimum, maximum or average EVM, depending on the last command syntax element. The unit is % or dB, depending on your selection. Example: FETC:SUMM:EVM? Returns the mean value. Usage: Query only User Manual 1308.9135.42 ─ 15 124 R&S®FS‑K101/103/105PC Remote Commands Remote Commands to Read Numeric Results FETCh:SUMMary:EVM:PCHannel:MAXimum? FETCh:SUMMary:EVM:PCHannel:MINimum? FETCh:SUMMary:EVM:PCHannel[:AVERage]? This command queries the EVM of all physical channel resource elements. Return values: <EVM> <numeric value> Minimum, maximum or average EVM, depending on the last command syntax element. The unit is % or dB, depending on your selection. Example: FETC:SUMM:EVM:PCH? Returns the mean value. Usage: Query only FETCh:SUMMary:EVM:PSIGnal:MAXimum? FETCh:SUMMary:EVM:PSIGnal:MINimum? FETCh:SUMMary:EVM:PSIGnal[:AVERage]? This command queries the EVM of all physical signal resource elements. Return values: <EVM> <numeric value> Minimum, maximum or average EVM, depending on the last command syntax element. The unit is % or dB, depending on your selection. Example: FETC:SUMM:EVM:PSIG? Returns the mean value. Usage: Query only FETCh:SUMMary:EVM:SDQP[:AVERage]? This command queries the EVM of all DMRS resource elements with QPSK modulation of the PUSCH. Return values: <EVM> <numeric value> EVM in % or dB, depending on the unit you have set. Example: FETC:SUMM:EVM:SDQP? Returns the EVM of all DMRS resource elements with QPSK modulation. Usage: Query only FETCh:SUMMary:EVM:SDSF[:AVERage]? This command queries the EVM of all DMRS resource elements with 64QAM modulation of the PUSCH. User Manual 1308.9135.42 ─ 15 125 R&S®FS‑K101/103/105PC Remote Commands Remote Commands to Read Numeric Results Return values: <EVM> <numeric value> EVM in % or dB, depending on the unit you have set. Example: FETC:SUMM:EVM:SDSF? Returns the maximum EVM of all DMRS resource elements with 64QAM modulation. Usage: Query only FETCh:SUMMary:EVM:SDST[:AVERage]? This command queries the EVM of all DMRS resource elements with 16QAM modulation of the PUSCH. Return values: <EVM> <numeric value> EVM in % or dB, depending on the unit you have set. Example: FETC:SUMM:EVM:SDST? Returns the EVM of all DMRS resource elements with 16QAM modulation. Usage: Query only FETCh:SUMMary:EVM:UCCD[:AVERage]? This command queries the EVM of all DMRS resource elements of the PUCCH as shown in the result summary. Return values: <EVM> EVM in % or dB, depending on the unit you have set. Example: FETC:SUMM:EVM:UCCD? Returns the average EVM of all DMRS resource elements. Usage: Query only FETCh:SUMMary:EVM:UCCH[:AVERage]? This command queries the EVM of all resource elements of the PUCCH as shown in the result summary. Return values: <EVM> EVM in % or dB, depending on the unit you have set. Example: FETC:SUMM:EVM:UCCH? Returns the average EVM of all resource elements. Usage: Query only User Manual 1308.9135.42 ─ 15 126 R&S®FS‑K101/103/105PC Remote Commands Remote Commands to Read Numeric Results FETCh:SUMMary:EVM:UPRA[:AVERage]? This command queries the EVM of all resource elements of the PRACH as shown in the result summary. Return values: <EVM> EVM in % or dB, depending on the unit you have set. Example: FETC:SUMM:EVM:UPRA? Returns the average EVM of all resource elements. Usage: Query only FETCh:SUMMary:EVM:USQP[:AVERage]? This query returns the EVM for all QPSK-modulated resource elements of the PUSCH. Return values: <EVM> <numeric value> EVM in % or dB, depending on the unit you have set. Example: FETC:SUMM:EVM:USQP? Queries the PUSCH QPSK EVM. Usage: Query only FETCh:SUMMary:EVM:USSF[:AVERage]? This command queries the EVM for all 64QAM-modulated resource elements of the PUSCH. Return values: <EVM> <numeric value> EVM in % or dB, depending on the unit you have set. Example: FETC:SUMM:EVM:USSF? Queries the PUSCH 64QAM EVM. Usage: Query only FETCh:SUMMary:EVM:USST[:AVERage]? This query returns the the EVM for all 16QAM-modulated resource elements of the PUSCH. Return values: <EVM> EVM in % or dB, depending on the unit you have set. Example: FETC:SUMM:EVM:USST? Queries the PUSCH 16QAM EVM. Usage: Query only User Manual 1308.9135.42 ─ 15 127 R&S®FS‑K101/103/105PC Remote Commands Remote Commands to Read Numeric Results FETCh:SUMMary:FERRor:MAXimum? FETCh:SUMMary:FERRor:MINimum? FETCh:SUMMary:FERRor[:AVERage]? This command queries the frequency error. Return values: <FreqError> <numeric value> Minimum, maximum or average frequency error, depending on the last command syntax element. Default unit: Hz Example: FETC:SUMM:FERR? Returns the average frequency error in Hz. Usage: Query only FETCh:SUMMary:GIMBalance:MAXimum? FETCh:SUMMary:GIMBalance:MINimum? FETCh:SUMMary:GIMBalance[:AVERage]? This command queries the I/Q gain imbalance. Return values: <GainImbalance> <numeric value> Minimum, maximum or average I/Q imbalance, depending on the last command syntax element. Default unit: dB Example: FETC:SUMM:GIMB? Returns the current gain imbalance in dB. Usage: Query only FETCh:SUMMary:IQOFfset:MAXimum? FETCh:SUMMary:IQOFfset:MINimum? FETCh:SUMMary:IQOFfset[:AVERage]? This command queries the I/Q offset. Return values: <IQOffset> <numeric value> Minimum, maximum or average I/Q offset, depending on the last command syntax element. Default unit: dB Example: FETC:SUMM:IQOF? Returns the current IQ-offset in dB Usage: Query only User Manual 1308.9135.42 ─ 15 128 R&S®FS‑K101/103/105PC Remote Commands Remote Commands to Read Numeric Results FETCh:SUMMary:POWer:MAXimum? FETCh:SUMMary:POWer:MINimum? FETCh:SUMMary:POWer[:AVERage]? This command queries the total power. Return values: <Power> <numeric value> Minimum, maximum or average power, depending on the last command syntax element. Default unit: dBm Example: FETC:SUMM:POW? Returns the total power in dBm Usage: Query only FETCh:SUMMary:QUADerror:MAXimum? FETCh:SUMMary:QUADerror:MINimum? FETCh:SUMMary:QUADerror[:AVERage]? This command queries the quadrature error. Return values: <QuadError> <numeric value> Minimum, maximum or average quadrature error, depending on the last command syntax element. Default unit: deg Example: FETC:SUMM:QUAD? Returns the current mean quadrature error in degrees. Usage: Query only FETCh:SUMMary:SERRor:MAXimum? FETCh:SUMMary:SERRor:MINimum? FETCh:SUMMary:SERRor[:AVERage]? This command queries the sampling error. Return values: <SamplingError> <numeric value> Minimum, maximum or average sampling error, depending on the last command syntax element. Default unit: ppm Example: FETC:SUMM:SERR? Returns the current mean sampling error in ppm. Usage: Query only User Manual 1308.9135.42 ─ 15 129 R&S®FS‑K101/103/105PC Remote Commands Remote Commands to Read Trace Data FETCh:SUMMary:TFRame? This command queries the (sub)frame start offset as shown in the Capture Buffer result display. Note that you have to select a particular subframe; otherwise the command returns an error. Return values: <Offset> Time difference between the (sub)frame start and capture buffer start. Default unit: s Example: FETC:SUMM:TFR? Returns the (sub)frame start offset. Usage: Query only FETCh:TAERror[:CC<cci>]:ANTenna<antenna>:MAXimum? FETCh:TAERror[:CC<cci>]:ANTenna<antenna>:MINimum? FETCh:TAERror[:CC<cci>]:ANTenna<antenna>[:AVERage]? This command queries the time alignment error. Return values: <Time Alignment Error> Minimum, maximum or average time alignment error, depending on the last command syntax element. Default unit: s Example: FETC:TAER:ANT2? Returns the average time alignment error between the reference antenna and antenna 2 in s. Usage: Query only 9.6 Remote Commands to Read Trace Data ● ● Using the TRACe[:DATA] Command.................................................................... 130 Reading Out Limit Check Results......................................................................... 140 9.6.1 Using the TRACe[:DATA] Command This chapter contains information on the TRACe:DATA command and a detailed description of the characteristics of that command. The TRACe:DATA command queries the trace data or results of the currently active measurement or result display. The type, number and structure of the return values are specific for each result display. In case of results that have any kind of unit, the command returns the results in the unit you have currently set for that result display. User Manual 1308.9135.42 ─ 15 130 R&S®FS‑K101/103/105PC Remote Commands Remote Commands to Read Trace Data Note also that return values for results that are available for both downlink and uplink may be different. For several result displays, the command also supports various SCPI parameters in combination with the query. If available, each SCPI parameter returns a different aspect of the results. If SCPI parameters are supported, you have to quote one in the query. Example: TRAC2:DATA? TRACE1 The format of the return values is either in ASCII or binary characters and depends on the format you have set with FORMat[:DATA]. Following this detailed description, you will find a short summary of the most important functions of the command (TRACe[:DATA]?). ● ● ● ● ● ● ● ● ● ● ● ● ● ● ● ● ● ● ● ● 9.6.1.1 Adjacent Channel Leakage Ratio..........................................................................131 Allocation Summary.............................................................................................. 132 Bit Stream............................................................................................................. 132 Capture Buffer.......................................................................................................133 CCDF.................................................................................................................... 133 Channel and Spectrum Flatness...........................................................................134 Channel and Spectrum Flatness Difference......................................................... 134 Channel Flatness SRS..........................................................................................134 Channel Group Delay............................................................................................135 Constellation Diagram...........................................................................................135 EVM vs Carrier......................................................................................................136 EVM vs Subframe................................................................................................. 136 EVM vs Symbol.....................................................................................................136 EVM vs Symbol x Carrier...................................................................................... 137 Frequency Error vs Symbol...................................................................................137 Inband Emission....................................................................................................137 Power Spectrum....................................................................................................138 Power vs Symbol x Carrier....................................................................................138 Spectrum Emission Mask......................................................................................138 Return Value Codes..............................................................................................139 Adjacent Channel Leakage Ratio For the ACLR result display, the number and type of returns values depend on the parameter. ● TRACE1 Returns one value for each trace point. ● LIST Returns the contents of the ACLR table. For each channel, it returns three values. <bandwidth>, <spacing offset>, <power>, ... The channel order is: TX channel ➙ lower adjacent ➙ upper adjacent ➙ lower alternate ➙ upper alternate User Manual 1308.9135.42 ─ 15 131 R&S®FS‑K101/103/105PC Remote Commands Remote Commands to Read Trace Data The unit of the <bandwidth> and <spacing offset> is Hz. The unit of the power is either dBc or dBm, depending on the ACLR measurement mode (relative or absolute). Note that the TX channel does not have a <spacing offset>. NaN is returned instead. 9.6.1.2 Allocation Summary For the Allocation Summary, the command returns seven values for each line of the table. <subframe>, <allocation ID>, <number of RB>, <offset RB>, <modulation>, <absolute power>, <EVM>, ... The unit for <absolute power> is always dBm. The unit for <EVM> depends on UNIT:EVM. All other values have no unit. The <allocation ID> and <modulation> are encoded. For the code assignment see chapter 9.6.1.20, "Return Value Codes", on page 139. Note that the data format of the return values is always ASCII. Example: TRAC:DATA? TRACE1 would return: 0, -40, 10, 2, 2, -84.7431947342849, 2.68723483754626E-06, 0, -41, 0, 0, 6, -84.7431432845264, 2.37549449584568E-06, 0, -42, 0, 0, 6, -80.9404231343884, 3.97834623871343E-06, ... 9.6.1.3 Bit Stream For the Bit Stream result display, the command returns five values and the bitstream for each line of the table. <subframe>, <allocation ID>, <codeword>, <modulation>, <# of symbols/bits>, <hexadecimal/binary numbers>,... All values have no unit. The format of the bitstream depends on Bit Stream Format. The <allocation ID>, <codeword> and <modulation> are encoded. For the code assignment see chapter 9.6.1.20, "Return Value Codes", on page 139. For symbols or bits that are not transmitted, the command returns ● "FFF" if the bit stream format is "Symbols" User Manual 1308.9135.42 ─ 15 132 R&S®FS‑K101/103/105PC Remote Commands Remote Commands to Read Trace Data ● "9" if the bit stream format is "Bits". For symbols or bits that could not be decoded because the number of layer exceeds the number of receive antennas, the command returns ● "FFE" if the bit stream format is "Symbols" ● "8" if the bit stream format is "Bits". Note that the data format of the return values is always ASCII. Example: TRAC:DATA? TRACE1 would return: 0, -40, 0, 2, 0, 03, 01, 02, 03, 03, 00, 00, 00, 01, 02, 02, ... <continues like this until the next data block starts or the end of data is reached> 0, -40, 0, 2, 32, 03, 03, 00, 00, 03, 01, 02, 00, 01, 00, ... 9.6.1.4 Capture Buffer For the Capture Buffer result display, the command returns one value for each I/Q sample in the capture buffer. <absolute power>, ... The unit is always dBm. The following parameters are supported. ● 9.6.1.5 TRACE1 CCDF For the CCDF result display, the type of return values depends on the parameter. ● TRACE1 Returns the probability values (y-axis). <# of values>, <probability>, ... The unit is always %. The first value that is returned is the number of the following values. ● TRACE2 Returns the corresponding power levels (x-axis). <# of values>, <relative power>, ... The unit is always dB. The first value that is returned is the number of the following values. User Manual 1308.9135.42 ─ 15 133 R&S®FS‑K101/103/105PC Remote Commands Remote Commands to Read Trace Data 9.6.1.6 Channel and Spectrum Flatness For the Channel Flatness result display, the command returns one value for each trace point. <relative power>, ... The unit is always dB. The following parameters are supported. 9.6.1.7 ● TRACE1 Returns the average power over all subframes. ● TRACE2 Returns the minimum power found over all subframes. If you are analyzing a particular subframe, it returns nothing. ● TRACE3 Returns the maximum power found over all subframes. If you are analyzing a particular subframe, it returns nothing. Channel and Spectrum Flatness Difference For the Channel Flatness Difference result display, the command returns one value for each trace point. <relative power>, ... The unit is always dB. The number of values depends on the selected LTE bandwidth. The following parameters are supported. 9.6.1.8 ● TRACE1 Returns the average power over all subframes. ● TRACE2 Returns the minimum power found over all subframes. If you are analyzing a particular subframe, it returns nothing. ● TRACE3 Returns the maximum power found over all subframes. If you are analyzing a particular subframe, it returns nothing. Channel Flatness SRS For the Channel Flatness SRS result display, the command returns one value for each trace point. <relative power>, ... The unit is always dB. The following parameters are supported. ● TRACE1 Returns the average power over all subframes. ● TRACE2 User Manual 1308.9135.42 ─ 15 134 R&S®FS‑K101/103/105PC Remote Commands Remote Commands to Read Trace Data Returns the minimum power found over all subframes. If you are analyzing a particular subframe, it returns nothing. ● 9.6.1.9 TRACE3 Returns the maximum power found over all subframes. If you are analyzing a particular subframe, it returns nothing. Channel Group Delay For the Channel Group Delay result display, the command returns one value for each trace point. <group delay>, ... The unit is always ns. The number of values depends on the selected LTE bandwidth. The following parameters are supported. 9.6.1.10 ● TRACE1 Returns the average group delay over all subframes. ● TRACE2 Returns the minimum group delay found over all subframes. If you are analyzing a particular subframe, it returns nothing. ● TRACE3 Returns the maximum group delay found over all subframes. If you are analyzing a particular subframe, it returns nothing. Constellation Diagram For the Constellation Diagram, the command returns two values for each constellation point. <I[SF0][Sym0][Carrier1]>, <Q[SF0][Sym0][Carrier1]>, ..., <I[SF0][Sym0][Carrier(n)]>, <Q[SF0][Sym0][Carrier(n)]>, <I[SF0][Sym1][Carrier1]>, <Q[SF0][Sym1][Carrier1]>, ..., <I[SF0][Sym1][Carrier(n)]>, <Q[SF0][Sym1][Carrier(n)]>, <I[SF0][Sym(n)][Carrier1]>, <Q[SF0][Sym(n)][Carrier1]>, ..., <I[SF0][Sym(n)][Carrier(n)]>, <Q[SF0][Sym(n)] [Carrier(n)]>, <I[SF1][Sym0][Carrier1]>, <Q[SF1][Sym0][Carrier1]>, ..., <I[SF1][Sym0][Carrier(n)]>, <Q[SF1][Sym0][Carrier(n)]>, <I[SF1][Sym1][Carrier1]>, <Q[SF1][Sym1][Carrier1]>, ..., <I[SF1][Sym1][Carrier(n)]>, <Q[SF1][Sym1][Carrier(n)]>, <I[SF(n)][Sym(n)][Carrier1]>, <Q[SF(n)][Sym(n)][Carrier1]>, ..., <I[SF(n)][Sym(n)][Carrier(n)]>, <Q[SF(n)] [Sym(n)][Carrier(n)]> With SF = subframe and Sym = symbol of that subframe. The I and Q values have no unit. The number of return values depends on the constellation selection. By default, it returns all resource elements including the DC carrier. User Manual 1308.9135.42 ─ 15 135 R&S®FS‑K101/103/105PC Remote Commands Remote Commands to Read Trace Data The following parameters are supported. 9.6.1.11 ● TRACE1 Returns all constellation points included in the selection. ● TRACE2 Returns the constellation points of the reference symbols included in the selection. ● TRACE3 Returns the constellation points of the SRS included in the selection. EVM vs Carrier For the EVM vs Carrier result display, the command returns one value for each subcarrier that has been analyzed. <EVM>, ... The unit depends on UNIT:EVM. The following parameters are supported. 9.6.1.12 ● TRACE1 Returns the average EVM over all subframes ● TRACE2 Returns the minimum EVM found over all subframes. If you are analyzing a particular subframe, it returns nothing. ● TRACE3 Returns the maximum EVM found over all subframes. If you are analyzing a particular subframe, it returns nothing. EVM vs Subframe For the EVM vs Subframe result display, the command returns one value for each subframe that has been analyzed. <EVM>, ... The unit depends on UNIT:EVM. The following parameters are supported. ● 9.6.1.13 TRACE1 EVM vs Symbol For the EVM vs Symbol result display, the command returns one value for each OFDM symbol that has been analyzed. <EVM>, ... For measurements on a single subframe, the command returns the symbols of that subframe only. The unit depends on UNIT:EVM. User Manual 1308.9135.42 ─ 15 136 R&S®FS‑K101/103/105PC Remote Commands Remote Commands to Read Trace Data The following parameters are supported. ● 9.6.1.14 TRACE1 EVM vs Symbol x Carrier For the EVM vs Symbol x Carrier, the command returns one value for each resource element. <EVM[Symbol(0),Carrier(1)]>, ..., <EVM[Symbol(0),Carrier(n)]>, <EVM[Symbol(1),Carrier(1)]>, ..., <EVM[Symbol(1),Carrier(n)]>, ... <EVM[Symbol(n),Carrier(1)]>, ..., <EVM[Symbol(n),Carrier(n)]>, The unit depends on UNIT:EVM. Resource elements that are unused return NAN. The following parameters are supported. ● 9.6.1.15 TRACE1 Frequency Error vs Symbol For the Frequency Error vs Symbol result display, the command returns one value for each OFDM symbol that has been analyzed. <frequency error>,... The unit is always Hz. The following parameters are supported. ● 9.6.1.16 TRACE1 Inband Emission For the Inband Emission result display, the number and type of returns values depend on the parameter. ● TRACE1 Returns the relative resource block indices (x-axis values). <RB index>, ... The resource block index has no unit. ● TRACE2 Returns one value for each resource block index. <relative power>, ... The unit of the relative inband emission is dB. ● TRACE3 Returns the data points of the upper limit line. <limit>, ... The unit is always dB. User Manual 1308.9135.42 ─ 15 137 R&S®FS‑K101/103/105PC Remote Commands Remote Commands to Read Trace Data Note that you have to select a particular subframe to get results. 9.6.1.17 Power Spectrum For the Power Spectrum result display, the command returns one value for each trace point. <power>,... The unit is always dBm/Hz. The following parameters are supported. ● 9.6.1.18 TRACE1 Power vs Symbol x Carrier For the Power vs Symbol x Carrier, the command returns one value for each resource element. <P[Symbol(0),Carrier(1)]>, ..., <P[Symbol(0),Carrier(n)]>, <P[Symbol(1),Carrier(1)]>, ..., <P[Symbol(1),Carrier(n)]>, ... <P[Symbol(n),Carrier(1)]>, ..., <P[Symbol(n),Carrier(n)]>, with P = Power of a resource element. The unit is always dBm. Resource elements that are unused return NAN. The following parameters are supported. ● 9.6.1.19 TRACE1 Spectrum Emission Mask For the SEM measurement, the number and type of returns values depend on the parameter. ● TRACE1 Returns one value for each trace point. <absolute power>, ... The unit is always dBm. ● LIST Returns the contents of the SEM table. For every frequency in the spectrum emission mask, it returns nine values. <index>, <start frequency in Hz>, <stop frequency in Hz>, <RBW in Hz>, <limit fail frequency in Hz>, <absolute power in dBm>, <relative power in dBc>, <limit distance in dB>, <limit check result>, ... The <limit check result> is either a 0 (for PASS) or a 1 (for FAIL). User Manual 1308.9135.42 ─ 15 138 R&S®FS‑K101/103/105PC Remote Commands Remote Commands to Read Trace Data 9.6.1.20 Return Value Codes This chapter contains a list for encoded return values. <allocation ID> Represents the allocation ID. The value is a number in the range {1...-70}. ● 1 = Reference symbol ● 0 = Data symbol ● -1 = Invalid ● -40 = PUSCH ● -41 = DMRS PUSCH ● -42 = SRS PUSCH ● -50 = PUCCH ● -51 = DMRS PUCCH ● -70 = PRACH <codeword> Represents the codeword of an allocation. The range is {0...6}. ● 0 = 1/1 ● 1 = 1/2 ● 2 = 2/2 ● 3 = 1/4 ● 4 = 2/4 ● 5 = 3/4 ● 6 = 4/4 <modulation> Represents the modulation scheme. The range is {0...14}. ● 0 = unrecognized ● 1 = RBPSK ● 2 = QPSK ● 3 = 16QAM ● 4 = 64QAM ● 5 = 8PSK ● 6 = PSK ● 7 = mixed modulation ● 8 = BPSK <number of symbols or bits> In hexadecimal mode, this represents the number of symbols to be transmitted. In binary mode, it represents the number of bits to be transmitted. User Manual 1308.9135.42 ─ 15 139 R&S®FS‑K101/103/105PC Remote Commands Remote Commands to Read Trace Data TRACe[:DATA]? <Result> This command returns the trace data for the current measurement or result display. For more information see chapter 9.6.1, "Using the TRACe[:DATA] Command", on page 130. Query parameters: TRACE1 | TRACE2 | TRACE3 LIST Usage: Query only 9.6.2 Reading Out Limit Check Results ● ● 9.6.2.1 Checking Limits for Graphical Result Displays..................................................... 140 Checking Limits for Numerical Result Display...................................................... 142 Checking Limits for Graphical Result Displays CALCulate<n>:LIMit<k>:ACPower:ACHannel:RESult?.......................................................140 CALCulate<n>:LIMit<k>:ACPower:ALTernate:RESult?...................................................... 141 CALCulate<n>:LIMit<k>:FAIL?........................................................................................ 141 CALCulate<n>:MARKer<m>:FUNCtion:POWer:RESult[:CURRent]?................................... 141 CALCulate<n>:LIMit<k>:ACPower:ACHannel:RESult? <Result> This command queries the limit check results for the adjacent channels during ACLR measurements. Query parameters: <Result> ALL Queries the overall limit check results. REL Queries the channel power limit check results. ABS Queries the distance to the limit line. Return values: <LimitCheck> Returns two values, one for the upper and one for the lower adjacent channel. PASSED Limit check has passed. FAILED Limit check has failed. Example: User Manual 1308.9135.42 ─ 15 CALC:LIM:ACP:ACH:RES? ALL Queries the results of the adjacent channel limit check. 140 R&S®FS‑K101/103/105PC Remote Commands Remote Commands to Read Trace Data Usage: Query only CALCulate<n>:LIMit<k>:ACPower:ALTernate:RESult? <Result> This command queries the limit check results for the alternate channels during ACLR measurements. Query parameters: <Result> ALL Queries the overall limit check results. REL Queries the channel power limit check results. ABS Queries the distance to the limit line. Return values: <LimitCheck> Returns two values, one for the upper and one for the lower alternate channel. PASSED Limit check has passed. FAILED Limit check has failed. Example: CALC:LIM:ACP:ALT:RES? ALL Queries the results of the alternate channel limit check. Usage: Query only CALCulate<n>:LIMit<k>:FAIL? This command queries the limit check results for all measurements that feature a limit check. Return values: <LimitCheck> Returns two values, one for the upper and one for the lower adjacent or alternate channel. 0 Limit check has passed. 1 Limit check has failed. Example: CALC:LIM:FAIL? Queries the limit check of the active result display. Usage: Query only CALCulate<n>:MARKer<m>:FUNCtion:POWer:RESult[:CURRent]? <ResultType> This command queries the current results of the ACLR measurement or the total signal power level of the SEM measurement. User Manual 1308.9135.42 ─ 15 141 R&S®FS‑K101/103/105PC Remote Commands Remote Commands to Read Trace Data To get a valid result, you have to perform a complete measurement with synchronization to the end of the measurement before reading out the result. This is only possible for single sweeps. Suffix: <m> Query parameters: <ResultType> Return values: <Result> . 1 CPOW This parameter queries the signal power of the SEM measurement. SEMResults Power level in dBm. ACLRResults Relative power levels of the ACLR channels. The number of return values depends on the number of transmission and adjacent channels. The order of return values is: • <TXChannelPower> is the power of the transmission channel in dBm • <LowerAdjChannelPower> is the relative power of the lower adjacent channel in dB • <UpperAdjChannelPower> is the relative power of the upper adjacent channel in dB • <1stLowerAltChannelPower> is the relative power of the first lower alternate channel in dB • <1stUpperAltChannelPower> is the relative power of the first lower alternate channel in dB (...) • <nthLowerAltChannelPower> is the relative power of a subsequent lower alternate channel in dB • <nthUpperAltChannelPower> is the relative power of a subsequent lower alternate channel in dB 9.6.2.2 Example: CALC1:MARK:FUNC:POW:RES? Returns the current ACLR measurement results. Usage: Query only Checking Limits for Numerical Result Display CALCulate<n>:LIMit<k>:SUMMary:EVM[:ALL]:MAXimum:RESult?..................................... 143 CALCulate<n>:LIMit<k>:SUMMary:EVM[:ALL][:AVERage]:RESult?.................................... 143 CALCulate<n>:LIMit<k>:SUMMary:EVM:PCHannel:MAXimum:RESult?.............................. 143 CALCulate<n>:LIMit<k>:SUMMary:EVM:PCHannel[:AVERage]:RESult?............................. 143 CALCulate<n>:LIMit<k>:SUMMary:EVM:PSIGnal:MAXimum:RESult?.................................144 CALCulate<n>:LIMit<k>:SUMMary:EVM:PSIGnal[:AVERage]:RESult?................................144 CALCulate<n>:LIMit<k>:SUMMary:EVM:SDQP[:AVERage]:RESult?...................................144 CALCulate<n>:LIMit<k>:SUMMary:EVM:SDSF[:AVERage]:RESult?................................... 145 CALCulate<n>:LIMit<k>:SUMMary:EVM:SDST[:AVERage]:RESult?................................... 145 User Manual 1308.9135.42 ─ 15 142 R&S®FS‑K101/103/105PC Remote Commands Remote Commands to Read Trace Data CALCulate<n>:LIMit<k>:SUMMary:EVM:UCCD[:AVERage]:RESult?.................................. 145 CALCulate<n>:LIMit<k>:SUMMary:EVM:UCCH[:AVERage]:RESult?.................................. 146 CALCulate<n>:LIMit<k>:SUMMary:EVM:UPRA[:AVERage]:RESult?...................................146 CALCulate<n>:LIMit<k>:SUMMary:EVM:USQP[:AVERage]:RESult?...................................146 CALCulate<n>:LIMit<k>:SUMMary:EVM:USSF[:AVERage]:RESult?................................... 147 CALCulate<n>:LIMit<k>:SUMMary:EVM:USST[:AVERage]:RESult?................................... 147 CALCulate<n>:LIMit<k>:SUMMary:FERRor:MAXimum:RESult?......................................... 148 CALCulate<n>:LIMit<k>:SUMMary:FERRor[:AVERage]:RESult?........................................ 148 CALCulate<n>:LIMit<k>:SUMMary:GIMBalance:MAXimum:RESult?................................... 148 CALCulate<n>:LIMit<k>:SUMMary:GIMBalance[:AVERage]:RESult?.................................. 148 CALCulate<n>:LIMit<k>:SUMMary:IQOFfset:MAXimum:RESult?........................................148 CALCulate<n>:LIMit<k>:SUMMary:IQOFfset[:AVERage]:RESult?.......................................148 CALCulate<n>:LIMit<k>:SUMMary:QUADerror:MAXimum:RESult?.....................................149 CALCulate<n>:LIMit<k>:SUMMary:QUADerror[:AVERage]:RESult?....................................149 CALCulate<n>:LIMit<k>:SUMMary:SERRor:MAXimum:RESult?......................................... 149 CALCulate<n>:LIMit<k>:SUMMary:SERRor[:AVERage]:RESult?........................................ 149 CALCulate<n>:LIMit<k>:SUMMary:EVM[:ALL]:MAXimum:RESult? CALCulate<n>:LIMit<k>:SUMMary:EVM[:ALL][:AVERage]:RESult? This command queries the results of the EVM limit check of all resource elements. Return values: <LimitCheck> The type of limit (average or maximum) that is queried depends on the last syntax element. FAILED Limit check has failed. PASSED Limit check has passed. NOTEVALUATED Limits have not been evaluated. Example: CALC:LIM:SUMM:EVM:RES? Queries the limit check. Usage: Query only CALCulate<n>:LIMit<k>:SUMMary:EVM:PCHannel:MAXimum:RESult? CALCulate<n>:LIMit<k>:SUMMary:EVM:PCHannel[:AVERage]:RESult? This command queries the results of the EVM limit check of all physical channel resource elements. User Manual 1308.9135.42 ─ 15 143 R&S®FS‑K101/103/105PC Remote Commands Remote Commands to Read Trace Data Return values: <LimitCheck> The type of limit (average or maximum) that is queried depends on the last syntax element. FAILED Limit check has failed. PASSED Limit check has passed. NOTEVALUATED Limits have not been evaluated. Example: CALC:LIM:SUMM:EVM:PCH:RES? Queries the limit check. Usage: Query only CALCulate<n>:LIMit<k>:SUMMary:EVM:PSIGnal:MAXimum:RESult? CALCulate<n>:LIMit<k>:SUMMary:EVM:PSIGnal[:AVERage]:RESult? This command queries the results of the EVM limit check of all physical signal resource elements. Return values: <LimitCheck> The type of limit (average or maximum) that is queried depends on the last syntax element. FAILED Limit check has failed. PASSED Limit check has passed. NOTEVALUATED Limits have not been evaluated. Example: CALC:LIM:SUMM:EVM:PSIG:RES? Queries the limit check. Usage: Query only CALCulate<n>:LIMit<k>:SUMMary:EVM:SDQP[:AVERage]:RESult? This command queries the results of the EVM limit check of all PUSCH DMRS resource elements with a QPSK modulation. Return values: <LimitCheck> FAILED Limit check has failed. PASSED Limit check has passed. NOTEVALUATED Limits have not been evaluated. Example: User Manual 1308.9135.42 ─ 15 CALC:LIM:SUMM:EVM:SDQP:RES? Queries the limit check. 144 R&S®FS‑K101/103/105PC Remote Commands Remote Commands to Read Trace Data Usage: Query only CALCulate<n>:LIMit<k>:SUMMary:EVM:SDSF[:AVERage]:RESult? This command queries the results of the EVM limit check of all PUSCH DMRS resource elements with a 64QAM modulation. Return values: <LimitCheck> FAILED Limit check has failed. PASSED Limit check has passed. NOTEVALUATED Limits have not been evaluated. Example: CALC:LIM:SUMM:EVM:SDSF:RES? Queries the limit check. Usage: Query only CALCulate<n>:LIMit<k>:SUMMary:EVM:SDST[:AVERage]:RESult? This command queries the results of the EVM limit check of all PUSCH DMRS resource elements with a 16QAM modulation. Return values: <LimitCheck> FAILED Limit check has failed. PASSED Limit check has passed. NOTEVALUATED Limits have not been evaluated. Example: CALC:LIM:SUMM:EVM:SDST:RES? Queries the limit check. Usage: Query only CALCulate<n>:LIMit<k>:SUMMary:EVM:UCCD[:AVERage]:RESult? This command queries the results of the EVM limit check of all PUCCH DMRS resource elements. Return values: <LimitCheck> FAILED Limit check has failed. PASSED Limit check has passed. NOTEVALUATED Limits have not been evaluated. User Manual 1308.9135.42 ─ 15 145 R&S®FS‑K101/103/105PC Remote Commands Remote Commands to Read Trace Data Example: CALC:LIM:SUMM:EVM:UCCD:RES? Queries the limit check. Usage: Query only CALCulate<n>:LIMit<k>:SUMMary:EVM:UCCH[:AVERage]:RESult? This command queries the results of the EVM limit check of all PUCCH resource elements. Return values: <LimitCheck> FAILED Limit check has failed. PASSED Limit check has passed. NOTEVALUATED Limits have not been evaluated. Example: CALC:LIM:SUMM:EVM:UCCH:RES? Queries the limit check. Usage: Query only CALCulate<n>:LIMit<k>:SUMMary:EVM:UPRA[:AVERage]:RESult? This command queries the results of the EVM limit check of all PRACH resource elements. Return values: <LimitCheck> FAILED Limit check has failed. PASSED Limit check has passed. NOTEVALUATED Limits have not been evaluated. Example: CALC:LIM:SUMM:EVM:UPRA:RES? Queries the limit check. Usage: Query only CALCulate<n>:LIMit<k>:SUMMary:EVM:USQP[:AVERage]:RESult? This command queries the results of the EVM limit check of all PUSCH resource elements with a QPSK modulation User Manual 1308.9135.42 ─ 15 146 R&S®FS‑K101/103/105PC Remote Commands Remote Commands to Read Trace Data Return values: <LimitCheck> FAILED Limit check has failed. PASSED Limit check has passed. NOTEVALUATED Limits have not been evaluated. Example: CALC:LIM:SUMM:EVM:USQP:RES? Queries the limit check. Usage: Query only CALCulate<n>:LIMit<k>:SUMMary:EVM:USSF[:AVERage]:RESult? This command queries the results of the EVM limit check of all PUSCH resource elements with a 64QAM modulation. Return values: <LimitCheck> FAILED Limit check has failed. PASSED Limit check has passed. NOTEVALUATED Limits have not been evaluated. Example: CALC:LIM:SUMM:EVM:USSF:RES? Queries the limit check. Usage: Query only CALCulate<n>:LIMit<k>:SUMMary:EVM:USST[:AVERage]:RESult? This command queries the results of the EVM limit check of all PUSCH resource elements with a 16QAM modulation. Return values: <LimitCheck> FAILED Limit check has failed. PASSED Limit check has passed. NOTEVALUATED Limits have not been evaluated. Example: CALC:LIM:SUMM:EVM:USST:RES? Queries the limit check. Usage: Query only User Manual 1308.9135.42 ─ 15 147 R&S®FS‑K101/103/105PC Remote Commands Remote Commands to Read Trace Data CALCulate<n>:LIMit<k>:SUMMary:FERRor:MAXimum:RESult? CALCulate<n>:LIMit<k>:SUMMary:FERRor[:AVERage]:RESult? This command queries the result of the frequency error limit check. Return values: <LimitCheck> The type of limit (average or maximum) that is queried depends on the last syntax element. FAILED Limit check has failed. PASSED Limit check has passed. NOTEVALUATED Limits have not been evaluated. Example: CALC:LIM:SUMM:SERR:RES? Queries the limit check. Usage: Query only CALCulate<n>:LIMit<k>:SUMMary:GIMBalance:MAXimum:RESult? CALCulate<n>:LIMit<k>:SUMMary:GIMBalance[:AVERage]:RESult? This command queries the result of the gain imbalance limit check. Return values: <LimitCheck> The type of limit (average or maximum) that is queried depends on the last syntax element. FAILED Limit check has failed. PASSED Limit check has passed. NOTEVALUATED Limits have not been evaluated. Example: CALC:LIM:SUMM:GIMB:RES? Queries the limit check. Usage: Query only CALCulate<n>:LIMit<k>:SUMMary:IQOFfset:MAXimum:RESult? CALCulate<n>:LIMit<k>:SUMMary:IQOFfset[:AVERage]:RESult? This command queries the result of the I/Q offset limit check. User Manual 1308.9135.42 ─ 15 148 R&S®FS‑K101/103/105PC Remote Commands Remote Commands to Read Trace Data Return values: <LimitCheck> The type of limit (average or maximum) that is queried depends on the last syntax element. FAILED Limit check has failed. PASSED Limit check has passed. NOTEVALUATED Limits have not been evaluated. Example: CALC:LIM:SUMM:IQOF:MAX:RES? Queries the limit check. Usage: Query only CALCulate<n>:LIMit<k>:SUMMary:QUADerror:MAXimum:RESult? CALCulate<n>:LIMit<k>:SUMMary:QUADerror[:AVERage]:RESult? This command queries the result of the quadrature error limit check. Return values: <LimitCheck> The type of limit (average or maximum) that is queried depends on the last syntax element. FAILED Limit check has failed. PASSED Limit check has passed. NOTEVALUATED Limits have not been evaluated. Example: CALC:LIM:SUMM:QUAD:RES? Queries the limit check. Usage: Query only CALCulate<n>:LIMit<k>:SUMMary:SERRor:MAXimum:RESult? CALCulate<n>:LIMit<k>:SUMMary:SERRor[:AVERage]:RESult? This command queries the results of the sampling error limit check. Return values: <LimitCheck> The type of limit (average or maximum) that is queried depends on the last syntax element. FAILED Limit check has failed. PASSED Limit check has passed. NOTEVALUATED Limits have not been evaluated. User Manual 1308.9135.42 ─ 15 149 R&S®FS‑K101/103/105PC Remote Commands Remote Commands to Configure General Settings Example: CALC:LIM:SUMM:SERR:RES? Queries the limit check. Usage: Query only 9.7 Remote Commands to Configure General Settings ● ● ● ● ● Remote Commands for General Settings............................................................. 150 Configuring MIMO Measurement Setups..............................................................157 Using a Trigger......................................................................................................160 Configuring Spectrum Measurements...................................................................161 Remote Commands for Advanced Settings.......................................................... 164 9.7.1 Remote Commands for General Settings This chapter contains remote control commands necessary to control the general measurement settings. For more information see chapter 4.1, "Configuring the Measurement", on page 52. ● ● ● ● ● ● 9.7.1.1 Defining General Signal Characteristics............................................................... 150 Selecting the Input Source....................................................................................151 Configuring the Input Level................................................................................... 152 Configuring the Data Capture............................................................................... 153 Configuring Measurement Results........................................................................154 Configuring Time Alignment Measurements......................................................... 157 Defining General Signal Characteristics CONFigure[:LTE]:DUPLexing.......................................................................................... 150 CONFigure[:LTE]:LDIRection.......................................................................................... 151 [SENSe]:FREQuency:CENTer[:CC<cci>]..........................................................................151 CONFigure[:LTE]:DUPLexing <Duplexing> This command selects the duplexing mode. Parameters: <Duplexing> TDD Time division duplex FDD Frequency division duplex *RST: Example: User Manual 1308.9135.42 ─ 15 FDD CONF:DUPL TDD Activates time division duplex. 150 R&S®FS‑K101/103/105PC Remote Commands Remote Commands to Configure General Settings CONFigure[:LTE]:LDIRection <Direction> This command selects the link direction Parameters: <Direction> DL Downlink UL Uplink Example: CONF:LDIR DL EUTRA/LTE option is configured to analyze downlink signals. [SENSe]:FREQuency:CENTer[:CC<cci>] <Frequency> This command sets the center frequency for RF measurements. Parameters: <Frequency> <numeric value> Range: fmin to fmax *RST: 1 GHz Default unit: Hz 9.7.1.2 Example: Measurement on one carrier: FREQ:CENT 1GHZ Defines a center frequency of 1 GHz Example: Measurement on aggregated carriers: FREQ:CENT:CC1 850MHZ Defines a center frequency of 850 MHz for the first carrier. Selecting the Input Source SENSe:INPut.................................................................................................................151 SENSe:INPut <Source> This command selects the signal source. Parameters: <Source> RF Select radio frequency input as signal source. AIQ Select analog I/Q input (baseband) as signal source. DIQ Select digital I/Q input as signal source. Example: User Manual 1308.9135.42 ─ 15 INP DIQ Select digital I/Q as signal source. 151 R&S®FS‑K101/103/105PC Remote Commands Remote Commands to Configure General Settings 9.7.1.3 Configuring the Input Level [SENSe]:POWer:AUTO<instrument>[:STATe]...................................................................152 CONFigure:POWer:EXPected:RF<instrument>................................................................. 152 CONFigure:POWer:EXPected:IQ<instrument>..................................................................152 INPut<n>:ATTenuation<instrument>................................................................................ 153 DISPlay[:WINDow<n>]:TRACe<t>:Y[:SCALe]:RLEVel:OFFSet........................................... 153 [SENSe]:POWer:AUTO<instrument>[:STATe] <State> This command initiates a measurement that determines the ideal reference level. Parameters: <State> OFF Performs no automatic reference level detection. ON Performs an automatic reference level detection before each measurement. ONCE Performs an automatic reference level once. *RST: Example: ON POW:AUTO2 ON Activate auto level for analyzer number 2. CONFigure:POWer:EXPected:RF<instrument> <RefLevel> This command defines the reference level when the input source is RF. Parameters: <RefLevel> Example: *RST: -30 dBm Default unit: DBM CONF:POW:EXP:RF3 -20 Sets the radio frequency reference level used by analyzer 3 to -20 dBm. CONFigure:POWer:EXPected:IQ<instrument> <RefLevel> This command defines the reference level when the input source is baseband. Parameters: <RefLevel> <numeric value> Range: 31.6 mV to 5.62 V *RST: 1V Default unit: V Example: User Manual 1308.9135.42 ─ 15 CONF:POW:EXP:IQ2 3.61 Sets the baseband-reference level used by analyzer 2 to 3.61 V. 152 R&S®FS‑K101/103/105PC Remote Commands Remote Commands to Configure General Settings INPut<n>:ATTenuation<instrument> <Attenuation> This command sets the RF attenuation level. Parameters: <Attenuation> <numeric value> *RST: 5 dB Default unit: dB Example: INP:ATT 10 Defines an RF attenuation of 10 dB. DISPlay[:WINDow<n>]:TRACe<t>:Y[:SCALe]:RLEVel:OFFSet <Attenuation> This command selects the external attenuation or gain applied to the RF signal. Parameters: <Attenuation> <numeric value> *RST: 0 Default unit: dB Example: 9.7.1.4 DISP:TRAC:Y:RLEV:OFFS 10 Sets an external attenuation of 10 dB. Configuring the Data Capture [SENSe]:SWEep:TIME................................................................................................... 153 [SENSe][:LTE]:FRAMe:COUNt:STATe............................................................................. 153 [SENSe][:LTE]:FRAMe:COUNt........................................................................................ 154 [SENSe][:LTE]:FRAMe:COUNt:AUTO.............................................................................. 154 [SENSe]:SWEep:TIME <CaptLength> This command sets the capture time. Parameters: <CaptLength> Numeric value in seconds. Default unit: s Example: SWE:TIME 40ms Defines a capture time of 40 milliseconds. [SENSe][:LTE]:FRAMe:COUNt:STATe <State> This command turns manual selection of the number of frames you want to analyze on and off. User Manual 1308.9135.42 ─ 15 153 R&S®FS‑K101/103/105PC Remote Commands Remote Commands to Configure General Settings Parameters: <State> ON You can set the number of frames to analyze. OFF The analyzer analyzes a single sweep. *RST: Example: ON FRAM:COUN:STAT ON Turns manual setting of number of frames to analyze on. [SENSe][:LTE]:FRAMe:COUNt <Subframes> This command sets the number of frames you want to analyze. Parameters: <Subframes> <numeric value> *RST: Example: 1 FRAM:COUN:STAT ON FRAM:COUN:AUTO OFF Activates manual input of frames to be analyzed. FRAM:COUN 20 Analyzes 20 frames. [SENSe][:LTE]:FRAMe:COUNt:AUTO <State> This command turns automatic selection of the number of frames to analyze on and off. Parameters: <State> ON Selects the number of frames to analyze according to the LTE standard. OFF Turns manual selection of the frame number on. Example: 9.7.1.5 FRAM:COUN:AUTO ON Turns automatic selection of the analyzed frames on. Configuring Measurement Results UNIT:EVM.....................................................................................................................155 UNIT:BSTR................................................................................................................... 155 UNIT:CAXes..................................................................................................................155 [SENSe][:LTE]:ANTenna:SELect..................................................................................... 155 [SENSe][:LTE]:SLOT:SELect.......................................................................................... 156 [SENSe][:LTE]:PREamble:SELect................................................................................... 156 [SENSe][:LTE]:SUBFrame:SELect................................................................................... 156 User Manual 1308.9135.42 ─ 15 154 R&S®FS‑K101/103/105PC Remote Commands Remote Commands to Configure General Settings UNIT:EVM <Unit> This command selects the EVM unit. Parameters: <Unit> DB EVM results returned in dB PCT EVM results returned in % *RST: Example: PCT UNIT:EVM PCT EVM results to be returned in %. UNIT:BSTR <Unit> This command selects the way the bit stream is displayed. Parameters: <Unit> SYMbols Displays the bit stream using symbols BITs Displays the bit stream using bits *RST: Example: SYMbols UNIT:BSTR BIT Bit stream gets displayed using Bits. UNIT:CAXes <Unit> This command selects the scale of the x-axis for result displays that show subcarrier results. Parameters: <Unit> CARR Shows the number of the subcarriers on the x-axis. HZ Shows the frequency of the subcarriers on the x-axis. Example: UNIT:CAX HZ Selects frequency scale for the x-axis. [SENSe][:LTE]:ANTenna:SELect <Antenna> This command selects the antenna for which the results are shown. User Manual 1308.9135.42 ─ 15 155 R&S®FS‑K101/103/105PC Remote Commands Remote Commands to Configure General Settings Parameters: <Antenna> Number of the antenna. 1|2|3|4 Number of the antenna. ALL Shows the results for all antennas. *RST: Example: 1 SENS:ANT:SEL 2 Selects antenna 2. [SENSe][:LTE]:SLOT:SELect <Slot> This command selects the slot to analyze. Parameters: <Slot> S0 Slot 0 S1 Slot 1 ALL Both slots *RST: Example: ALL SLOT:SEL S1 Selects slot 1 for analysis. [SENSe][:LTE]:PREamble:SELect <Subframe> This command selects a particular preamble for measurements that analyze individual preambles. The command is available in PRACH analysis mode. Parameters: <Subframe> ALL Analyzes all preambles. <numeric value> Selects the premable to analyze. *RST: Example: ALL PRE:SEL ALL Analyzes all preambles. [SENSe][:LTE]:SUBFrame:SELect <Subframe> This command selects the subframe to be analyzed. User Manual 1308.9135.42 ─ 15 156 R&S®FS‑K101/103/105PC Remote Commands Remote Commands to Configure General Settings Parameters: <Subframe> ALL | <numeric value> ALL Select all subframes 0...39 Select a single subframe *RST: Example: 9.7.1.6 ALL SUBF:SEL ALL Select all subframes for analysis. Configuring Time Alignment Measurements Remote commands to configure Time Alignment measurements described elsewhere: ● [SENSe]:FREQuency:CENTer[:CC<cci>] on page 151 chapter 9.8, "Remote Commands to Configure the Demodulation", on page 167 CONFigure:NOCC......................................................................................................... 157 CONFigure:NOCC <Carriers> This command selects the number of component carriers evaluated in the Time Alignment measurement. Parameters: <Carriers> 1|2 *RST: Example: 1 CONF:NOCC 2 Selects 2 carriers. 9.7.2 Configuring MIMO Measurement Setups CONFigure:ACONfig<instrument>:ADDRess.................................................................... 157 CONFigure:ACONfig<instrument>:ICSequence.................................................................158 CONFigure:ACONfig<instrument>:NCHannels..................................................................158 CONFigure[:LTE]:UL:MIMO:ASELection...........................................................................158 CONFigure[:LTE]:UL:MIMO:PUCCh:CONFig.................................................................... 159 CONFigure[:LTE]:UL:MIMO:PUSCh:CONFig.................................................................... 159 CONFigure[:LTE]:UL:MIMO:SRS:CONFig........................................................................ 159 CONFigure:ACONfig<instrument>:ADDRess <Address> This command defines the network address of an analyzer or oscilloscope in the test setup. User Manual 1308.9135.42 ─ 15 157 R&S®FS‑K101/103/105PC Remote Commands Remote Commands to Configure General Settings Parameters: <Address> Example: String containing the address of the analyzer. Connections are possible via TCP/IP or GPIB. Depending on the type of connection, the string has the following syntax. 'GPIB[board]::<PrimaryAddress>[:: <SecondaryAddress>][::INSTR]' 'TCPIP[board]::<HostAddress>[:: <LANDeviceName>][::INSTR]' Elements in square brackets are optional. CONF:ACON:ADDR 'TCPIP::192.168.0.1' Defines a TCP/IP connection for the first analyzer in the test setup. CONF:ACON:ADDR 'GPIB::28' Defines a GPIB connection for the first analyzer in the test setup. CONFigure:ACONfig<instrument>:ICSequence <ICSequence> This command defines the sequence in which the oscilloscope channels are accessed. Parameters: <ICSequence> Example: String containing a sequence of four numbers between 1 and 4. Each number represents an input channel. CONF:ACON:ICS '1,3,2,4' Defines the sequence for an oscilloscope with four channels. The channels are subsequently accessed in the order 1 ➙ 3 ➙ 2 ➙ 4. CONFigure:ACONfig<instrument>:NCHannels <NCHannels> This command defines the number of oscilloscope channels you want to use. Parameters: <NCHannels> 1|2|3|4 The maximum number you can select depends on the number of channels of the oscilloscope you are using. Example: CONF:ACON:NCH 2 Defines a measurement on 2 channels. CONFigure[:LTE]:UL:MIMO:ASELection <Antenna> This command selects the antenna for measurements with MIMO setups. In case of Time Alignment measurements, the command selects the reference antenna. User Manual 1308.9135.42 ─ 15 158 R&S®FS‑K101/103/105PC Remote Commands Remote Commands to Configure General Settings Parameters: <Antenna> ANT1 | ANT2 | ANT3 | ANT4 Select a single antenna to be analyzed ALL Select all antennas to be analyzed Example: CONF:UL:MIMO:ASEL ANT2 Selects antenna 2 to be analyzed. CONFigure[:LTE]:UL:MIMO:PUCCh:CONFig <NofAntennas> This command selects the number of antennas for the PUCCH in a MIMO setup. Parameters: <NofAntennas> TX1 Use 1 antenna. TX2 Use 2 antennas. Example: CONF:UL:MIMO:PUCC:CONF TX1 The PUCCH is transmitted on one antenna. CONFigure[:LTE]:UL:MIMO:PUSCh:CONFig <NofAntennas> This command selects the number of antennas for the PUSCH in a MIMO setup. Parameters: <NofAntennas> TX1 Use 1 antenna. TX2 Use 2 antennas. TX4 Use 4 antennas. Example: CONF:UL:MIMO:PUSC:CONF TX1 The PUSCH is transmitted on one antenna. CONFigure[:LTE]:UL:MIMO:SRS:CONFig <NofAntennas> This command selects the number of antennas for the sounding reference signal in a MIMO setup. Parameters: <NofAntennas> TX1 Use 1 antenna. TX2 Use 2 antennas. TX4 Use 4 antennas. User Manual 1308.9135.42 ─ 15 159 R&S®FS‑K101/103/105PC Remote Commands Remote Commands to Configure General Settings Example: CONF:UL:MIMO:SRS:CONF TX1 The sounding reference signal is transmitted on one antenna. 9.7.3 Using a Trigger TRIGger[:SEQuence]:MODE...........................................................................................160 TRIGger[:SEQuence]:HOLDoff<instrument>..................................................................... 160 TRIGger[:SEQuence]:LEVel<instrument>[:EXTernal].........................................................160 TRIGger[:SEQuence]:LEVel<instrument>:POWer............................................................. 161 TRIGger[:SEQuence]:PORT<instrument>.........................................................................161 TRIGger[:SEQuence]:SLOPe.......................................................................................... 161 TRIGger[:SEQuence]:MODE <Source> This command selects the trigger source. Parameters: <Source> EXTernal Selects external trigger source. IMMediate Selects free run trigger source. POWer Selects IF power trigger source. *RST: Example: IMMediate TRIG:MODE EXT Selects an external trigger source. TRIGger[:SEQuence]:HOLDoff<instrument> <Offset> This command defines the trigger offset. Parameters: <Offset> <numeric value> *RST: 0s Default unit: s Example: TRIG:HOLD 5MS Sets the trigger offset to 5 ms. TRIGger[:SEQuence]:LEVel<instrument>[:EXTernal] <Level> This command defines the level for an external trigger. Parameters: <Level> User Manual 1308.9135.42 ─ 15 Range: 0.5 V to 3.5 V *RST: 1.4 V Default unit: V 160 R&S®FS‑K101/103/105PC Remote Commands Remote Commands to Configure General Settings Example: TRIG:LEV 2V Defines a trigger level of 2 V. TRIGger[:SEQuence]:LEVel<instrument>:POWer <Level> This command defines the trigger level for an IF power trigger. Parameters: <Level> Example: Default unit: DBM TRIG:LEV:POW 10 Defines a trigger level of 10 dBm. TRIGger[:SEQuence]:PORT<instrument> <Port> This command selects the trigger port for measurements with devices that have several trigger ports. (The R&S FSW, for example has several trigger ports.) Parameters: <Port> PORT1 PORT2 PORT3 Example: TRIG:PORT PORT1 Selects trigger port 1. TRIGger[:SEQuence]:SLOPe <Slope> This command selects the trigger slope. Parameters: <Slope> POSitive Triggers a measurement when the signal rises to the trigger level. NEGative Triggers a measurement when the signal falls to the trigger level. Example: TRIG:SLOP POS Selects a positive trigger slope. 9.7.4 Configuring Spectrum Measurements ● ● Configuring SEM and ACLR Measurements.........................................................162 Configuring Spectrum Flatness Measurements.................................................... 164 User Manual 1308.9135.42 ─ 15 161 R&S®FS‑K101/103/105PC Remote Commands Remote Commands to Configure General Settings 9.7.4.1 Configuring SEM and ACLR Measurements CONFigure[:LTE]:UL:CABW............................................................................................162 [SENSe]:POWer:SEM:UL:REQuirement...........................................................................162 [SENSe]:POWer:ACHannel:AACHannel...........................................................................163 [SENSe]:POWer:NCORrection........................................................................................ 163 [SENSe]:SWEep:EGATe:AUTO.......................................................................................163 CONFigure[:LTE]:UL:CABW <Bandwidth> This command selects the channel bandwidth(s) of the carriers in MC ACLR measurements. Parameters: <Bandwidth> B520 First carrier: 5 MHz, second carrier: 20 MHz bandwidth. B1020 First carrier: 10 MHz, second carrier: 20 MHz bandwidth. B1515 First carrier: 15 MHz, second carrier: 15 MHz bandwidth. B1520 First carrier: 15 MHz, second carrier: 20 MHz bandwidth. B2020 First carrier: 20 MHz, second carrier: 20 MHz bandwidth. USER Custom combination of bandwidths. Define the bandwidths of both carriers with CONFigure[:LTE]:UL[:CC<cci>]:BW on page 171. Example: CONF:UL:CABW USER CONF:UL:CC1:BW BW5_00 CONF:UL:CC2:BW BW5_00 Custom bandwidth combination: first carrier 5 MHz, second carrier 5 MHz. [SENSe]:POWer:SEM:UL:REQuirement <Requirement> This command selects the requirements for a spectrum emission mask. Parameters: <Requirement> GEN | NS3 | NS4 | NS67 GEN General spectrum emission mask. NS3 | NS4 | NS67 Spectrum emission masks with additional requirements. Example: User Manual 1308.9135.42 ─ 15 POW:SEM:UL:REQ NS3 Selects a spectrum emission mask with requirement for network signalled value NS3. 162 R&S®FS‑K101/103/105PC Remote Commands Remote Commands to Configure General Settings [SENSe]:POWer:ACHannel:AACHannel <Channel> This command selects the assumed adjacent channel carrier for ACLR measurements. Parameters: <Channel> EUTRA Selects an EUTRA signal of the same bandwidth like the TX channel as assumed adjacent channel carrier. UTRA128 Selects an UTRA signal with a bandwidth of 1.28MHz as assumed adjacent channel carrier. UTRA384 Selects an UTRA signal with a bandwidth of 3.84MHz as assumed adjacent channel carrier. UTRA768 Selects an UTRA signal with a bandwidth of 7.68MHz as assumed adjacent channel carrier. *RST: Example: EUTRA POW:ACH:AACH UTRA384 Selects an UTRA signal with a bandwidth of 3.84MHz as assumed adjacent channel carrier. [SENSe]:POWer:NCORrection <State> This command turns noise correction for ACLR measurements on and off. Parameters: <State> ON | OFF *RST: Example: OFF POW:NCOR ON Activates noise correction. [SENSe]:SWEep:EGATe:AUTO <State> This command turns auto gating for SEM and ACLR measurements on and off. This command is available for TDD measurements in combination with an external or IF power trigger. Parameters: <State> ON Evaluates the on-period of the LTE signal only. OFF Evaluates the complete signal. Example: User Manual 1308.9135.42 ─ 15 SWE:EGAT:AUTO ON Turns auto gating on. 163 R&S®FS‑K101/103/105PC Remote Commands Remote Commands to Configure General Settings 9.7.4.2 Configuring Spectrum Flatness Measurements [SENSe][:LTE]:SFLatness:ECONditions........................................................................... 164 [SENSe][:LTE]:SFLatness:OBANd................................................................................... 164 [SENSe][:LTE]:SFLatness:ECONditions <State> This command turns extreme conditions for spectrum flatness measurements on and off. Parameters: <State> ON | OFF *RST: Example: OFF SFL:ECON ON Turns extreme conditions on. [SENSe][:LTE]:SFLatness:OBANd <NofSubbands> This command selects the operating band for spectrum flatness Measurements. Parameters: <NofSubbands> <numeric value> Range: *RST: Example: 1 to 40 1 SFL:OBAN 10 Selects operating band 10. 9.7.5 Remote Commands for Advanced Settings This chapter contains all remote control commands to control the advanced settings. For more information on advanced settings see chapter 4.5, "Advanced Settings", on page 66. ● ● ● ● 9.7.5.1 Controlling I/Q Data...............................................................................................164 Configuring the Baseband Input............................................................................165 Using Advanced Input Settings............................................................................. 166 Configuring the Digital I/Q Input............................................................................ 166 Controlling I/Q Data [SENSe]:SWAPiq...........................................................................................................164 INPut:IQ:FSOFfset......................................................................................................... 165 [SENSe]:SWAPiq <State> This command turns a swap of the I and Q branches on and off. User Manual 1308.9135.42 ─ 15 164 R&S®FS‑K101/103/105PC Remote Commands Remote Commands to Configure General Settings Parameters: <State> ON | OFF *RST: Example: OFF SWAP ON Turns a swap of the I and Q branches on. INPut:IQ:FSOFfset <Offset> This command defines the location in an I/Q data file where the analysis starts. Parameters: <Offset> Time offset relative to the start offset of the I/Q data. Default unit: S Example: 9.7.5.2 INP:IQ:FSOF 0.2 Defines an offset of 0.2 seconds. Configuring the Baseband Input INPut:IQ:IMPedance.......................................................................................................165 INPut:IQ:BALanced[:STATe]........................................................................................... 165 [SENSe]:IQ:LPASs[:STATe]............................................................................................ 166 [SENSe]:IQ:DITHer[:STATe]........................................................................................... 166 INPut:IQ:IMPedance <Impedance> This command selects the input impedance for I/Q inputs. Parameters: <Impedance> LOW | HIGH *RST: Example: LOW INP:IQ:IMP LOW Selects low input impedance for I/Q input. INPut:IQ:BALanced[:STATe] <State> This command selects if the I/Q inputs are symmetrical (balanced) or asymmetrical (unbalanced) Parameters: <State> ON | OFF *RST: Example: User Manual 1308.9135.42 ─ 15 ON INP:IQ:BAL ON Specifies symmetrical (balanced) IQ inputs. 165 R&S®FS‑K101/103/105PC Remote Commands Remote Commands to Configure General Settings [SENSe]:IQ:LPASs[:STATe] <State> This command turns a baseband input lowpass filter on and off. Parameters: <State> ON | OFF *RST: Example: ON IQ:LPAS ON Activate the input lowpass. [SENSe]:IQ:DITHer[:STATe] <State> This command adds or removes a noise signal into the signal path (dithering). Parameters: <State> ON | OFF *RST: Example: 9.7.5.3 OFF IQ:DITH ON Activate input dithering. Using Advanced Input Settings [SENSe]:POWer:AUTO<instrument>:TIME.......................................................................166 [SENSe]:POWer:AUTO<instrument>:TIME <Time> This command defines the track time for the auto level process. Parameters: <Time> <numeric value> *RST: 100 ms Default unit: s Example: 9.7.5.4 POW:AUTO:TIME 200ms An auto level track time of 200 ms gets set. Configuring the Digital I/Q Input The digital I/Q input is available with option R&S FSQ-B17 or R&S FSV-B17. INPut<n>:DIQ:RANGe[:UPPer]........................................................................................166 INPut<n>:DIQ:SRATe.....................................................................................................167 INPut<n>:DIQ:RANGe[:UPPer] <ScaleLevel> This command defines the full scale level for a digital I/Q signal source. Parameters: <ScaleLevel> User Manual 1308.9135.42 ─ 15 *RST: 1V Default unit: V 166 R&S®FS‑K101/103/105PC Remote Commands Remote Commands to Configure the Demodulation Example: INP:DIQ:RANG 0.7 Sets the full scale level to 0.7 V. INPut<n>:DIQ:SRATe <SampleRate> This command defines the sampling rate for a digital I/Q signal source. Parameters: <SampleRate> Example: *RST: 10 MHz Default unit: Hz INP:DIQ:SRAT 10MHZ Defines a sampling rate of 10 MHz. 9.8 Remote Commands to Configure the Demodulation Configuring component carriers If you want to configure the second component carrier (CC2), make sure to include the [:CC2] part of the syntax. Example: CONF:UL:CC2:BW 10 ● ● ● Remote Commands for UL Demodulation Settings.............................................. 167 Remote Commands for UL Signal Characteristics................................................171 Remote Commands for UL Advanced Signal Characteristics...............................178 9.8.1 Remote Commands for UL Demodulation Settings This chapter contains remote commands necessary to define PDSCH demodulation. For more information see chapter 5.1, "Configuring Uplink Signal Demodulation", on page 71. ● ● 9.8.1.1 Configuring the Data Analysis...............................................................................167 Compensating Measurement Errors..................................................................... 170 Configuring the Data Analysis [SENSe][:LTE]:UL:DEMod:ATTSlots................................................................................ 168 [SENSe][:LTE]:UL:DEMod:MODE....................................................................................168 [SENSe][:LTE]:UL:DEMod:CESTimation.......................................................................... 168 [SENSe][:LTE]:UL:DEMod:EEPeriod................................................................................168 [SENSe][:LTE]:UL:DEMod:CDCoffset...............................................................................169 [SENSe][:LTE]:UL:DEMod:CBSCrambling........................................................................ 169 [SENSe][:LTE]:UL:DEMod:ACON.................................................................................... 169 User Manual 1308.9135.42 ─ 15 167 R&S®FS‑K101/103/105PC Remote Commands Remote Commands to Configure the Demodulation [SENSe][:LTE]:UL:FORMat:SCD..................................................................................... 169 [SENSe][:LTE]:UL:DEMod:SISYnc...................................................................................170 [SENSe][:LTE]:UL:DEMod:MCFilter................................................................................. 170 [SENSe][:LTE]:UL:DEMod:ATTSlots <State> This command includes or excludes the transient slots present after a switch from downlink to uplink in the analysis. Parameters: <State> Example: ON | OFF UL:DEM:ATTS ON Includes the transient slots in the analysis. [SENSe][:LTE]:UL:DEMod:MODE <Reference> This command selects the uplink analysis mode. Parameters: <Reference> PUSCh Analyzes the PUSCH and PUCCH. PRACh Analyzes the PRACH. *RST: Example: PUSCh UL:DEM:MODE PRAC Selects PRACH analysis mode. [SENSe][:LTE]:UL:DEMod:CESTimation <Type> This command selects the channel estimation type for uplink signals. Parameters: <Type> PIL | PILPAY PIL Pilot only PILP Pilot and payload *RST: Example: PILP UL:DEM:CEST PIL Uses only the pilot signal for channel estimation. [SENSe][:LTE]:UL:DEMod:EEPeriod <State> This command includes or excludes the exclusion period from EVM results. Parameters: <State> User Manual 1308.9135.42 ─ 15 ON | OFF 168 R&S®FS‑K101/103/105PC Remote Commands Remote Commands to Configure the Demodulation Example: UL:DEM:EEP ON Turns the exclusion periods for EVM calculation on. [SENSe][:LTE]:UL:DEMod:CDCoffset <State> This command turns DC offset compensation for uplink signals on and off. Parameters: <State> ON | OFF *RST: Example: ON UL:DEM:CDC OFF Deactivates DC offset compensation. [SENSe][:LTE]:UL:DEMod:CBSCrambling <State> This command turns scrambling of coded bits for uplink signals on and off. Parameters: <State> ON | OFF *RST: Example: ON UL:DEM:CBSC OFF Deactivates the scrambling. [SENSe][:LTE]:UL:DEMod:ACON <Type> This command selects the method of automatic demodulation for uplink signals. Parameters: <Type> ALL Automatically detects and demodulates the PUSCH and SRS. OFF Automatic demodulation is off. SCON Automatically detects and demodulates the values available in the subframe configuration table. Example: UL:DEM:ACON OFF Turns automatic demodulation off. [SENSe][:LTE]:UL:FORMat:SCD <State> This command turns detection of the subframe configuration on and off. The command is available if "Auto Demodulation" is turned off. Parameters: <State> ON | OFF *RST: User Manual 1308.9135.42 ─ 15 OFF 169 R&S®FS‑K101/103/105PC Remote Commands Remote Commands to Configure the Demodulation Example: UL:FORM:SCD ON Turns detection of the subframe configuration on. [SENSe][:LTE]:UL:DEMod:SISYnc <State> This command turns suppressed interference synchronization on and off. Parameters: <State> ON | OFF *RST: Example: OFF UL:DEM:SISY ON Turns suppressed interference synchronization on. [SENSe][:LTE]:UL:DEMod:MCFilter <State> This command turns suppression of interfering neighboring carriers on and off (e.g. LTE, WCDMA, GSM etc). Parameters: <State> ON | OFF *RST: Example: 9.8.1.2 OFF UL:DEM:MCF ON Turns suppression on of neighboring carriers on. Compensating Measurement Errors [SENSe][:LTE]:UL:TRACking:PHASe............................................................................... 170 [SENSe][:LTE]:UL:TRACking:TIME..................................................................................170 [SENSe][:LTE]:UL:TRACking:PHASe <Type> This command selects the phase tracking type for uplink signals. Parameters: <Type> OFF Deactivate phase tracking PIL Pilot only PILP Pilot and payload *RST: Example: OFF SENS:UL:TRAC:PHAS PILP Use pilots and payload for channel estimation. [SENSe][:LTE]:UL:TRACking:TIME <State> This command turns timing tracking for uplink signals on and off. User Manual 1308.9135.42 ─ 15 170 R&S®FS‑K101/103/105PC Remote Commands Remote Commands to Configure the Demodulation Parameters: <State> ON | OFF *RST: Example: OFF UL:TRAC:TIME ON Activates timing tracking. 9.8.2 Remote Commands for UL Signal Characteristics This chapter contains remote commands necessary to define uplink signal characteristics. For more information see chapter 5.2, "Defining Uplink Signal Characteristics", on page 75. ● ● ● 9.8.2.1 Defining the Physical Signal Characteristics.........................................................171 Configuring the Physical Layer Cell Identity..........................................................173 Configuring Subframes......................................................................................... 174 Defining the Physical Signal Characteristics CONFigure[:LTE]:UL[:CC<cci>]:BW................................................................................. 171 CONFigure[:LTE]:UL[:CC<cci>]:CYCPrefix....................................................................... 171 CONFigure[:LTE]:UL[:CC<cci>]:TDD:SPSC......................................................................172 CONFigure[:LTE]:UL[:CC<cci>]:TDD:UDConf................................................................... 172 FETCh[:CC<cci>]:CYCPrefix?......................................................................................... 172 FETCh[:CC<cci>]:OSUBcarriers?.................................................................................... 173 CONFigure[:LTE]:UL[:CC<cci>]:BW <Bandwidth> This command selects the channel bandwidth. Parameters: <Bandwidth> BW1_40 | BW3_00 | BW5_00 | BW10_00 | BW15_00 | BW20_00 Example: Single carrier measurement: CONF:UL:BW BW1_40 Defines a channel bandwidth of 1.4 MHz. Example: Aggregated carrier measurement: CONF:UL:CC1:BW BW5_00 Defines a channel bandwidth of 5 MHz for the first carrier. CONFigure[:LTE]:UL[:CC<cci>]:CYCPrefix <PrefixLength> This command selects the cyclic prefix. User Manual 1308.9135.42 ─ 15 171 R&S®FS‑K101/103/105PC Remote Commands Remote Commands to Configure the Demodulation Parameters: <PrefixLength> NORM Normal cyclic prefix length EXT Extended cyclic prefix length AUTO Automatic cyclic prefix length detection *RST: AUTO Example: Single carrier measurements: CONF:UL:CYCP EXT Selects an extended cyclic prefix. Example: Aggregated carrier measurements: CONF:UL:CC1:CYCP EXT Selects an extended cyclic prefix for the first carrier. CONFigure[:LTE]:UL[:CC<cci>]:TDD:SPSC <Configuration> This command selects the special TDD subframe configuration. Parameters: <Configuration> <numeric value> Example: Single carrier measurements: CONF:UL:TDD:SPSC 2 Selects special subframe configuration 2. Example: Carrier aggregation measurements: CONF:UL:CC1:TDD:SPSC 2 Selects special subframe configuration 2 for the first carrier. CONFigure[:LTE]:UL[:CC<cci>]:TDD:UDConf <Configuration> This command selects the subframe configuration for TDD signals. Parameters: <Configuration> Range: *RST: 0 to 6 0 Example: Single carrier measurements: CONF:UL:TDD:UDC 4 Selects allocation configuration number 4. Example: Carrier aggregation measurements: CONF:UL:CC1:TDD:UDC 4 Selects allocation configuration number 4 for the first carrier. FETCh[:CC<cci>]:CYCPrefix? This command queries the cyclic prefix type that has been detected. User Manual 1308.9135.42 ─ 15 172 R&S®FS‑K101/103/105PC Remote Commands Remote Commands to Configure the Demodulation Return values: <PrefixType> The command returns -1 if no valid result has been detected yet. NORM Normal cyclic prefix length detected EXT Extended cyclic prefix length detected Example: FETC:CYCP? Returns the current cyclic prefix length type. Usage: Query only FETCh[:CC<cci>]:OSUBcarriers? This command queries the number of occupied carriers as shown in the "Signal Characteristics" dialog box. Return values: <Subcarriers> 9.8.2.2 Number of occupied subcarriers. Example: FETC:OSUB? Queries the number of occupied carriers. Usage: Query only Configuring the Physical Layer Cell Identity CONFigure[:LTE]:UL[:CC<cci>]:PLC:CID......................................................................... 173 CONFigure[:LTE]:UL[:CC<cci>]:PLC:CIDGroup................................................................ 173 CONFigure[:LTE]:UL[:CC<cci>]:PLC:PLID........................................................................174 CONFigure[:LTE]:UL[:CC<cci>]:PLC:CID <CellId> This command defines the cell ID. Parameters: <CellId> AUTO Automatically defines the cell ID. <numeric value> Number of the cell ID. Range: Example: 0 to 503 CONF:UL:PLC:CID AUTO Automatically detects the cell ID. CONFigure[:LTE]:UL[:CC<cci>]:PLC:CIDGroup <GroupNumber> This command selects the cell identity group for uplink signals. User Manual 1308.9135.42 ─ 15 173 R&S®FS‑K101/103/105PC Remote Commands Remote Commands to Configure the Demodulation Parameters: <GroupNumber> Example: Range: *RST: 1 to 167 0 CONF:UL:PLCI:CIDG 12 Selects cell identity group 12. CONFigure[:LTE]:UL[:CC<cci>]:PLC:PLID <Identity> This command selects the physical layer identity for uplink signals. Parameters: <Identity> 0...2 Manual selection *RST: Example: 9.8.2.3 AUTO CONF:DL:PLC:PLID 2 Sets the physical layer identity to 2. Configuring Subframes CONFigure[:LTE]:UL:SFNO............................................................................................ 174 CONFigure[:LTE]:UL:CSUBframes.................................................................................. 175 CONFigure[:LTE]:UL[:CC<cci>]:SUBFrame<subframe>:ALLoc[:CLUSter<cluster>]: RBCount.............................................................................................................175 CONFigure[:LTE]:UL[:CC<cci>]:SUBFrame<subframe>:ALLoc[:CLUSter<cluster>]: RBOFfset............................................................................................................175 CONFigure[:LTE]:UL[:CC<cci>]:SUBFrame<subframe>:ALLoc:CONT.................................175 CONFigure[:LTE]:UL[:CC<cci>]:SUBFrame<subframe>:ALLoc:MODulation.........................176 CONFigure[:LTE]:UL[:CC<cci>]:SUBFrame<subframe>:ALLoc:PRECoding:CBINdex........... 176 CONFigure[:LTE]:UL[:CC<cci>]:SUBFrame<subframe>:ALLoc:PRECoding:CLMapping....... 176 CONFigure[:LTE]:UL[:CC<cci>]:SUBFrame<subframe>:ALLoc:PUCCh:FORMat..................176 CONFigure[:LTE]:UL[:CC<cci>]:SUBFrame<subframe>:ALLoc:PUCCh:NPAR..................... 177 CONFigure[:LTE]:UL[:CC<cci>]:SUBFrame<subframe>:ALLoc:PUSCh:CSField...................177 CONFigure[:LTE]:UL[:CC<cci>]:SUBFrame<subframe>:ALLoc:PUSCh:NDMRs...................177 CONFigure[:LTE]:UL[:CC<cci>]:SUBFrame<subframe>:ALLoc:RATO.................................178 CONFigure[:LTE]:UL:SFNO <Offset> This command defines the system frame number offset. The application uses the offset to demodulate the frame. Parameters: <Offset> <numeric value> *RST: Example: User Manual 1308.9135.42 ─ 15 0 CONF:UL:SFNO 2 Selects frame number offset 2. 174 R&S®FS‑K101/103/105PC Remote Commands Remote Commands to Configure the Demodulation CONFigure[:LTE]:UL:CSUBframes <NofSubframes> This command selects the number of configurable subframes in the uplink signal. Parameters: <NofSubframes> Example: Range: *RST: 1 to 10 1 CONF:UL:CSUB 5 Sets the number of configurable subframes to 5. CONFigure[:LTE]:UL[:CC<cci>]:SUBFrame<subframe>:ALLoc[: CLUSter<cluster>]:RBCount <ResourceBlocks> This command selects the number of resource blocks in an uplink subframe. Parameters: <NofRBs> <numeric value> *RST: Example: 11 CONF:UL:SUBF8:ALL:RBC 8 Subframe 8 consists of 8 resource blocks. CONFigure[:LTE]:UL[:CC<cci>]:SUBFrame<subframe>:ALLoc[: CLUSter<cluster>]:RBOFfset <Offset> This command defines the resource block offset in an uplink subframe. Parameters: <RBOffset> <numeric value> *RST: Example: 2 CONF:UL:SUBF8:ALL:RBOF 5 Subframe 8 has a resource block offset of 5. CONFigure[:LTE]:UL[:CC<cci>]:SUBFrame<subframe>:ALLoc:CONT <Content> This command allocates a PUCCH or PUSCH to an uplink allocation. Parameters: <Content> NONE Turns off the PUSCH and the PUCCH. PUCCh Turns on the PUCCH. PUSCh Turns on the PUSCH. PSCC Turns on the PUCCH as well as the PUSCH. *RST: User Manual 1308.9135.42 ─ 15 PUSC 175 R&S®FS‑K101/103/105PC Remote Commands Remote Commands to Configure the Demodulation Example: CONF:UL:SUBF8:ALL:CONT PUCC Subframe 8 contains a PUCCH. CONFigure[:LTE]:UL[:CC<cci>]:SUBFrame<subframe>:ALLoc:MODulation <Modulation> This command selects the modulation of an uplink allocation. Parameters: <Modulation> QPSK | QAM16 | QAM64 *RST: Example: QPSK CONF:UL:SUBF8:ALL:MOD QPSK The modulation of the allocation in subframe 8 is QPSK. CONFigure[:LTE]:UL[:CC<cci>]:SUBFrame<subframe>:ALLoc:PRECoding: CBINdex <CBIndex> This command selects the codebook index for a PUSCH allocation. Parameters: <CBIndex> Example: Range: *RST: 0 to 5 0 CONF:UL:SUBF:ALL:PREC:CBIN 1 Selects codebook index 1 for the PUSCH allocation. CONFigure[:LTE]:UL[:CC<cci>]:SUBFrame<subframe>:ALLoc:PRECoding: CLMapping <Mapping> This command selects the codeword to layer mapping for a PUSCH allocation. Parameters: <Mapping> Example: LC11 | LC21 | LC22 CONF:UL:SUBF2:ALL:PREC:CLM LC11 Assigns codeword-to-layer mapping 1/1 to subframe 2. CONFigure[:LTE]:UL[:CC<cci>]:SUBFrame<subframe>:ALLoc:PUCCh:FORMat <Format> This command selects the PUCCH format for a particular subframe. The command is available if you have selected PUCCH format selection on subframe basis with CONFigure[:LTE]:UL:PUCCh:FORMat. User Manual 1308.9135.42 ─ 15 176 R&S®FS‑K101/103/105PC Remote Commands Remote Commands to Configure the Demodulation Parameters: <Format> F1N (F1 normal) F1S (F1 shortened) F1AN (F1a normal) F1AS (F1a shortened) F1BN (F1b normal) F1BS (F1b shortened) F2 (F2) F2A (F2a) F2B (F2b) F3 (F3) Example: CONF:UL:SUBF4:ALL:PUCC:FORM F3 Selects format F3 for the PUCCH in subframe 4. CONFigure[:LTE]:UL[:CC<cci>]:SUBFrame<subframe>:ALLoc:PUCCh:NPAR <Parameter> This command defines N_PUCCH on a subframe basis. The command is available if CONFigure[:LTE]:UL:PUCCh:NPAR on page 186 is turned on. Parameters: <Parameter> Example: <numeric value> CONF:UL:SUBF:ALL:PUCC:NPAR 2 Sets N_PUCCH to 2. CONFigure[:LTE]:UL[:CC<cci>]:SUBFrame<subframe>:ALLoc:PUSCh:CSField <CyclicShiftField> This command defines the cyclic shift field of the demodulation reference signal. Available if CONFigure[:LTE]:UL[:CC<cci>]:DRS:AOCC on page 178 has been turned on. Parameters: <CyclicShiftField> Example: Range: *RST: 0 to 7 0 CONF:UL:SUBF:ALL:PUSC:CSF 4 Defines cyclic shift field 4. CONFigure[:LTE]:UL[:CC<cci>]:SUBFrame<subframe>:ALLoc:PUSCh:NDMRs <PuschNDMRS> This command defines the part of the DMRS index that is used for the uplink scheduling assignment. User Manual 1308.9135.42 ─ 15 177 R&S®FS‑K101/103/105PC Remote Commands Remote Commands to Configure the Demodulation Parameters: <PuschNDMRS> <numeric value> Range: *RST: Example: 0 to 11 0 CONF:UL:SUBF:ALL:PUSC:NDMR 2 Defines index 2. CONFigure[:LTE]:UL[:CC<cci>]:SUBFrame<subframe>:ALLoc:RATO <State> This command turns the resource allocation type 1 on and off. Parameters: <State> ON | OFF *RST: Example: OFF CONF:UL:SUBF:ALL:RATO ON Turns resource allocation type 1 on. 9.8.3 Remote Commands for UL Advanced Signal Characteristics This chapter contains remote commands necessary to define advanced uplink signal characteristics. For more information see chapter 5.3, "Defining Advanced Signal Characteristics", on page 83. ● ● ● ● ● ● 9.8.3.1 Configuring the Demodulation Reference Signal.................................................. 178 Configuring the Sounding Reference Signal.........................................................180 Defining the PUSCH Structure..............................................................................183 Defining the PUCCH Structure..............................................................................185 Defining the PRACH Structure..............................................................................187 Defining Global Signal Characteristics..................................................................189 Configuring the Demodulation Reference Signal CONFigure[:LTE]:UL[:CC<cci>]:DRS:AOCC..................................................................... 178 CONFigure[:LTE]:UL[:CC<cci>]:DRS:DSSHift................................................................... 179 CONFigure[:LTE]:UL[:CC<cci>]:DRS:GRPHopping........................................................... 179 CONFigure[:LTE]:UL[:CC<cci>]:DRS:NDMRs................................................................... 179 CONFigure[:LTE]:UL[:CC<cci>]:DRS:PUCCh:POWer........................................................ 179 CONFigure[:LTE]:UL[:CC<cci>]:DRS[:PUSCh]:POWer...................................................... 180 CONFigure[:LTE]:UL[:CC<cci>]:DRS:SEQuence...............................................................180 CONFigure[:LTE]:UL[:CC<cci>]:DRS:SEQHopping............................................................180 CONFigure[:LTE]:UL[:CC<cci>]:DRS:AOCC <State> This command turns the configuration of the demodulation reference signal on a subframe basis via the "Cyclic Field Shift" on and off. User Manual 1308.9135.42 ─ 15 178 R&S®FS‑K101/103/105PC Remote Commands Remote Commands to Configure the Demodulation Parameters: <State> Example: ON | OFF CONF:UL:DRS:AOCC ON Turns Activate-DMRS-with OCC on. CONFigure[:LTE]:UL[:CC<cci>]:DRS:DSSHift <Shift> This command selects the delta sequence shift of the uplink signal. Parameters: <Shift> <numeric value> *RST: Example: 0 CONF:UL:DRS:DSSH 3 Sets the delta sequence shift to 3. CONFigure[:LTE]:UL[:CC<cci>]:DRS:GRPHopping <State> This command turns group hopping for uplink signals on and off. Parameters: <State> ON | OFF *RST: Example: OFF CONF:UL:DRS:GRPHopping ON Activates group hopping. CONFigure[:LTE]:UL[:CC<cci>]:DRS:NDMRs <nDMRS> This command defines the nDMRS. Parameters: <nDMRS> Example: <numeric value> CONF:UL:DRS:NDMR 0 Selects nDMRS 0. CONFigure[:LTE]:UL[:CC<cci>]:DRS:PUCCh:POWer <Power> This command sets the relative power of the PUCCH. Parameters: <Power> Example: User Manual 1308.9135.42 ─ 15 *RST: 0 Default unit: DB CONF:UL:DRS:PUCC:POW 2 Sets the power of the PUCCH to 2 dB. 179 R&S®FS‑K101/103/105PC Remote Commands Remote Commands to Configure the Demodulation CONFigure[:LTE]:UL[:CC<cci>]:DRS[:PUSCh]:POWer <Power> This command sets the relative power of the PUSCH. Parameters: <Power> Example: *RST: 0 Default unit: DB CONF:UL:DRS:POW 2 Sets the relative power of the PUSCH to 2 dB. CONFigure[:LTE]:UL[:CC<cci>]:DRS:SEQuence <Sequence> This command selects the modulation for the reference signal. Parameters: <Sequence> IQF For use of a customized reference signal. The data has to come from a file. TGPP For use of a reference signal according to 3GPP. Example: CONF:UL:DRS:SEQ IQF Activates the IQF type of sequence. CONFigure[:LTE]:UL[:CC<cci>]:DRS:SEQHopping <State> This command turns sequence hopping for uplink signals on and off. Parameters: <State> ON | OFF *RST: Example: 9.8.3.2 OFF CONF:UL:DRS:SEQH ON Activates sequence hopping. Configuring the Sounding Reference Signal CONFigure[:LTE]:UL:SRS:ANST..................................................................................... 181 CONFigure[:LTE]:UL:SRS:BHOP.....................................................................................181 CONFigure[:LTE]:UL:SRS:BSRS.....................................................................................181 CONFigure[:LTE]:UL:SRS:CSRS.....................................................................................181 CONFigure[:LTE]:UL:SRS:CYCS.....................................................................................182 CONFigure[:LTE]:UL:SRS:ISRS...................................................................................... 182 CONFigure[:LTE]:UL:SRS:MUPT.....................................................................................182 CONFigure[:LTE]:UL:SRS:NRRC.................................................................................... 182 CONFigure[:LTE]:UL:SRS:POWer................................................................................... 182 CONFigure[:LTE]:UL:SRS:STAT..................................................................................... 183 CONFigure[:LTE]:UL:SRS:SUConfig................................................................................183 CONFigure[:LTE]:UL:SRS:TRComb.................................................................................183 User Manual 1308.9135.42 ─ 15 180 R&S®FS‑K101/103/105PC Remote Commands Remote Commands to Configure the Demodulation CONFigure[:LTE]:UL:SRS:ANST <State> This command turns simultaneous transmission of the Sounding Reference Signal (SRS) and ACK/NACK messages (via PUCCH) on and off. Simultaneous transmission works only if the PUCCH format ist either 1, 1a, 1b or 3. Parameters: <State> ON Allows simultaneous transmission of SRS and PUCCH. OFF SRS not transmitted in the subframe for which you have configured simultaneous transmission of PUCCH and SRS. Example: CONF:UL:SRS:ANST ON Turns simultaneous transmission of the SRS and PUCCH in one subframe on. CONFigure[:LTE]:UL:SRS:BHOP <Bandwidth> This command defines the frequency hopping bandwidth bhop. Parameters: <Bandwidth> <numeric value> *RST: Example: 0 CONF:UL:SRS:BHOP 1 Sets the frequency hopping bandwidth to 1. CONFigure[:LTE]:UL:SRS:BSRS <Bandwidth> This command defines the bandwidth of the SRS (BSRS). Parameters: <Bandwidth> <numeric value> *RST: Example: 0 CONF:UL:SRS:BSRS 1 Sets the SRS bandwidth to 1. CONFigure[:LTE]:UL:SRS:CSRS <Configuration> This command defines the SRS bandwidth configuration (CSRS). Parameters: <Configuration> <numeric value> *RST: Example: User Manual 1308.9135.42 ─ 15 0 CONF:UL:SRS:CSRS 2 Sets the SRS bandwidth configuration to 2. 181 R&S®FS‑K101/103/105PC Remote Commands Remote Commands to Configure the Demodulation CONFigure[:LTE]:UL:SRS:CYCS <CyclicShift> Sets the cyclic shift n_CS used for the generation of the sounding reference signal CAZAC sequence. Parameters: <CyclicShift> <numeric value> *RST: Example: 0 CONF:UL:SRS:CYCS 2 Sets the cyclic shift to 2. CONFigure[:LTE]:UL:SRS:ISRS <ConfIndex> This command defines the SRS configuration index (ISRS). Parameters: <ConfIndex> <numeric value> *RST: Example: 0 CONF:UL:SRS:ISRS 1 Sets the configuration index to 1. CONFigure[:LTE]:UL:SRS:MUPT <State> This command turns SRS MaxUpPts on and off. Parameters: <State> ON | OFF *RST: OFF CONFigure[:LTE]:UL:SRS:NRRC <FreqDomPos> Sets the UE specific parameter Freq. Domain Position nRRC. Parameters: <FreqDomPos> <numeric value> *RST: Example: 0 CONF:UL:SRS:NRRC 1 Sets nRRC to 1. CONFigure[:LTE]:UL:SRS:POWer <Power> Defines the relative power of the sounding reference signal. Parameters: <Power> <numeric value> *RST: 0 Default unit: DB User Manual 1308.9135.42 ─ 15 182 R&S®FS‑K101/103/105PC Remote Commands Remote Commands to Configure the Demodulation Example: CONF:UL:SRS:POW -1.2 Sets the power to -1.2 dB. CONFigure[:LTE]:UL:SRS:STAT <State> Activates or deactivates the sounding reference signal. Parameters: <State> ON | OFF *RST: Example: OFF CONF:UL:SRS:STAT ON Activates the sounding reference signal. CONFigure[:LTE]:UL:SRS:SUConfig <Configuration> This command defines the SRS subframe configuration. Parameters: <Configuration> <numeric value> *RST: Example: 0 CONF:UL:SRS:SUC 4 Sets SRS subframe configuration to 4. CONFigure[:LTE]:UL:SRS:TRComb <TransComb> This command defines the transmission comb (kTC). Parameters: <TransComb> <numeric value> *RST: Example: 9.8.3.3 0 CONF:UL:SRS:TRC 1 Sets transmission comb to 1. Defining the PUSCH Structure CONFigure[:LTE]:UL[:CC<cci>]:PUSCh:FHMode.............................................................. 183 CONFigure[:LTE]:UL[:CC<cci>]:PUSCh:FHOFfset............................................................ 184 CONFigure[:LTE]:UL[:CC<cci>]:PUSCh:FHOP:IIHB.......................................................... 184 CONFigure[:LTE]:UL[:CC<cci>]:PUSCh:NOSM.................................................................184 CONFigure[:LTE]:UL[:CC<cci>]:PUSCh:FHMode <HoppingMode> This command selects the frequency hopping mode in the PUSCH structure. User Manual 1308.9135.42 ─ 15 183 R&S®FS‑K101/103/105PC Remote Commands Remote Commands to Configure the Demodulation Parameters: <HoppingMode> NONE No hopping INTer Inter subframe hopping INTRa Intra subframe hopping *RST: Example: NONE CONF:UL:PUSC:FHM NONE Deactivates frequency hopping for the PUSCH. CONFigure[:LTE]:UL[:CC<cci>]:PUSCh:FHOFfset <Offset> This command defines the frequency hopping offset for the PUSCH. Parameters: <Offset> <numeric value> *RST: Example: 4 CONF:UL:PUSC:FHOF 5 Sets the hopping offset to 5. CONFigure[:LTE]:UL[:CC<cci>]:PUSCh:FHOP:IIHB <HBInfo> This command defines the information in hopping bits of the PUSCH. Parameters: <HBInfo> <numeric value> Range: *RST: Example: 0 to 3 0 CONF:UL:PUSC:FHOP:IIHB 1 Defines type 1 as the information in hopping bits. CONFigure[:LTE]:UL[:CC<cci>]:PUSCh:NOSM <NofSubbands> This command defines the number of subbands/M of the PUSCH. Parameters: <NofSubbands> <numeric value> *RST: Example: User Manual 1308.9135.42 ─ 15 4 CONF:UL:PUSC:NOSM 2 Sets the number of subbands to 2. 184 R&S®FS‑K101/103/105PC Remote Commands Remote Commands to Configure the Demodulation 9.8.3.4 Defining the PUCCH Structure CONFigure[:LTE]:UL:PUCCh:NORB................................................................................ 185 CONFigure[:LTE]:UL:PUCCh:DESHift..............................................................................185 CONFigure[:LTE]:UL:PUCCh:N1CS.................................................................................185 CONFigure[:LTE]:UL:PUCCh:N2RB.................................................................................185 CONFigure[:LTE]:UL:PUCCh:FORMat............................................................................. 186 CONFigure[:LTE]:UL:PUCCh:NPAR................................................................................ 186 CONFigure[:LTE]:UL:PUCCh:NORB <ResourceBlocks> This command selects the number of resource blocks for the PUCCH. Parameters: <ResourceBlocks> <numeric value> Selects the number of RBs. AUTO Detects the number of RBs automatically. *RST: Example: 0 CONF:UL:PUCC:NORB 6 Sets the number of resource blocks to 6. CONFigure[:LTE]:UL:PUCCh:DESHift <Shift> This command defines the delta shift of the PUCCH. Parameters: <Shift> <numeric value> Range: *RST: Example: 1 to 3 2 CONF:UL:PUCC:DESH 3 Sets the delta shift of the PUCCH to 3. CONFigure[:LTE]:UL:PUCCh:N1CS <N1cs> This command defines the N(1)_cs of the PUCCH. Parameters: <N1cs> <numeric value> *RST: Example: 6 CONF:UL:PUCC:N1CS 4 Sets N(1)_cs to 4. CONFigure[:LTE]:UL:PUCCh:N2RB <N2RB> This command defines the N(2)_RB of the PUCCH. User Manual 1308.9135.42 ─ 15 185 R&S®FS‑K101/103/105PC Remote Commands Remote Commands to Configure the Demodulation Parameters: <N2RB> <numeric value> *RST: Example: 1 CONF:UL:PUCC:N2RB 2 Sets N2_RB to 2. CONFigure[:LTE]:UL:PUCCh:FORMat <Format> This command selects the PUCCH format. Note that formats 2a and 2b are available for normal cyclic prefix length only. Parameters: <Format> F1 (F1) F1A (F1a) F1B (F1b) F2 (F2) F2A (F2a) F2B (F2b) F3 (F3) SUBF Allows you to define the PUCCH format for each subframe separately with . *RST: Example: F1 CONF:UL:PUCC:FORM F1B Sets the PUCCH format to F1B. CONFigure[:LTE]:UL:PUCCh:NPAR <Format> This command defines the N_PUCCH parameter in the PUCCH structure settings. Parameters: <Format> <numeric value> <numeric value> AUTO Determines the N_PUCCH based on the measurement. SUBF Selects the definition of N_PUCCH on subframe level. *RST: Example: User Manual 1308.9135.42 ─ 15 0 CONF:UL:PUCC:NPAR 2 Sets N_PUCCH to 2. 186 R&S®FS‑K101/103/105PC Remote Commands Remote Commands to Configure the Demodulation 9.8.3.5 Defining the PRACH Structure CONFigure[:LTE]:UL:PRACh:APM...................................................................................187 CONFigure[:LTE]:UL:PRACh:CONF................................................................................ 187 CONFigure[:LTE]:UL:PRACh:RSET................................................................................. 187 CONFigure[:LTE]:UL:PRACh:FOFFset.............................................................................187 CONFigure[:LTE]:UL:PRACh:NCSC................................................................................ 188 CONFigure[:LTE]:UL:PRACh:RSEQ................................................................................ 188 CONFigure[:LTE]:UL:PRACh:SINDex.............................................................................. 188 CONFigure[:LTE]:UL:PRACh:FRINdex.............................................................................188 CONFigure[:LTE]:UL:PRACh:HFINdicator........................................................................ 188 CONFigure[:LTE]:UL:PRACh:APM <State> This command turns automatic preamble mapping for the PRACH on and off. Parameters: <State> Example: ON | OFF CONF:UL:PRAC:APM ON Turns automatic preamble mapping on. CONFigure[:LTE]:UL:PRACh:CONF <Configuration> This command selects the PRACH preamble format. Parameters: <Configuration> Example: <numeric value> CONF:UL:PRAC:CONF 2 Selects PRACH configuration 2. CONFigure[:LTE]:UL:PRACh:RSET <State> This command turns the restricted preamble set for PRACH on and off. Parameters: <State> ON | OFF *RST: Example: OFF CONF:UL:PRAC:RSET ON Turns the restricted set on. CONFigure[:LTE]:UL:PRACh:FOFFset <Offset> This command defines the PRACH frequency offset. The command is available for preamble formats 0 to 3. Parameters: <Offset> User Manual 1308.9135.42 ─ 15 Resource block offset. 187 R&S®FS‑K101/103/105PC Remote Commands Remote Commands to Configure the Demodulation Example: CONF:UL:PRAC:FOFF 5 Defines a frequency offset of 5 resource blocks. CONFigure[:LTE]:UL:PRACh:NCSC <Configuration> This command defines the Ncs configuration for the PRACH. Parameters: <Configuration> Example: <numeric value> CONF:UL:PRAC:NCSC 1 Selects Ncs configuration 1. CONFigure[:LTE]:UL:PRACh:RSEQ <RootSeqIdx> This command defines the PRACH logical root sequence index. Parameters: <RootSeqIdx> Example: <numeric value> CONF:UL:PRAC:RSEQ 2 Selects logical root sequence index 2. CONFigure[:LTE]:UL:PRACh:SINDex <Index> This command selects the PRACH sequence index. Parameters: <Index> <IndexValue> Number that defines the index manually. AUTO Automatcailly determines the index. Example: CONF:UL:PRAC:SIND 2 Selects sequence index 2. CONFigure[:LTE]:UL:PRACh:FRINdex <FRINdex> This command selects the PRACH frequency index. Parameters: <FRINdex> Example: <numeric value> CONF:UL:PRAC:FRIN 10 Selects the frequency index 10. CONFigure[:LTE]:UL:PRACh:HFINdicator <HFINdicator> This command defines the PRACH half frame indicator. Parameters: <HFINdicator> User Manual 1308.9135.42 ─ 15 <numeric value> 188 R&S®FS‑K101/103/105PC Remote Commands Configuring the Software Example: 9.8.3.6 CONF:UL:PRAC:HFIN 5 Selects half frame indicator 5. Defining Global Signal Characteristics CONFigure[:LTE]:UL:UEID..............................................................................................189 CONFigure[:LTE]:UL:UEID <ID> Sets the radio network temporary identifier (RNTI) of the UE. Parameters: <ID> <numeric value> *RST: Example: 0 CONF:UL:UEID 2 Sets the UE ID to 2. 9.9 Configuring the Software CONFigure:PRESet....................................................................................................... 189 DISPlay[:WINDow<n>]:SELect........................................................................................ 189 CONFigure:PRESet Initiates a preset to the default state of the software, and, if connected to an analyzer, also presets the analyzer. Example: CONF:PRES Presets the software. Usage: Event DISPlay[:WINDow<n>]:SELect This command selects the measurement window. Example: DISP:WIND2:SEL Selects screen B. Usage: Event User Manual 1308.9135.42 ─ 15 189 R&S®FS‑K101/103/105PC Remote Commands Managing Files 9.10 Managing Files FORMat[:DATA].............................................................................................................190 MMEMory:LOAD:DEModsetting.......................................................................................190 MMEMory:LOAD:IQ:STATe............................................................................................ 190 MMEMory:STORe:DEModsetting.....................................................................................191 MMEMory:STORe:IQ:STATe.......................................................................................... 191 FORMat[:DATA] [<Format>] This command specifies the data format for the data transmission between the LTE measurement application and the remote client. Supported formats are ASCII or REAL32. Parameters: <Format> ASCii | REAL *RST: Example: ASCii FORM REAL The software will send binary data in Real32 data format. MMEMory:LOAD:DEModsetting <Path> This command restores previously saved demodulation settings. The file must be of type "*.allocation" and depends on the link direction that was currently selected when the file was saved. You can load only files with correct link directions. Setting parameters: <Path> String containing the path and name of the file. Example: MMEM:LOAD:DEM 'D:\USER\Settingsfile.allocation' Usage: Setting only MMEMory:LOAD:IQ:STATe <Path> This command restores I/Q data from a file. Setting parameters: <Path> String containing the path and name of the source file. Example: MMEM:LOAD:IQ:STAT 'C: \R_S\Instr\user\data.iq.tar' Loads I/Q data from the specified file. Usage: Setting only User Manual 1308.9135.42 ─ 15 190 R&S®FS‑K101/103/105PC Remote Commands Managing Files MMEMory:STORe:DEModsetting <Path> Stores the current demodulation settings to a file. The resulting file type is "*.allocation". Existing files will be overwritten. Setting parameters: <Path> String containing the path and name of the file. Example: MMEM:STOR:DEM 'D:\USER\Settingsfile.allocation' Usage: Setting only MMEMory:STORe:IQ:STATe <Path> This command saves I/Q data to a file. Setting parameters: <Path> String containing the path and name of the target file. Example: MMEM:STOR:IQ:STAT 'C: \R_S\Instr\user\data.iq.tar' Saves I/Q data to the specified file. Usage: Setting only User Manual 1308.9135.42 ─ 15 191 R&S®FS‑K101/103/105PC List of Commands List of Commands [SENSe]:FREQuency:CENTer[:CC<cci>]......................................................................................................151 [SENSe]:IQ:DITHer[:STATe]..........................................................................................................................166 [SENSe]:IQ:LPASs[:STATe].......................................................................................................................... 166 [SENSe]:POWer:ACHannel:AACHannel....................................................................................................... 163 [SENSe]:POWer:AUTO<instrument>:TIME...................................................................................................166 [SENSe]:POWer:AUTO<instrument>[:STATe].............................................................................................. 152 [SENSe]:POWer:NCORrection...................................................................................................................... 163 [SENSe]:POWer:SEM:UL:REQuirement....................................................................................................... 162 [SENSe]:SWAPiq...........................................................................................................................................164 [SENSe]:SWEep:EGATe:AUTO.................................................................................................................... 163 [SENSe]:SWEep:TIME.................................................................................................................................. 153 [SENSe]:SYNC[:STATe]?..............................................................................................................................123 [SENSe][:LTE]:ANTenna:SELect...................................................................................................................155 [SENSe][:LTE]:FRAMe:COUNt......................................................................................................................154 [SENSe][:LTE]:FRAMe:COUNt:AUTO...........................................................................................................154 [SENSe][:LTE]:FRAMe:COUNt:STATe..........................................................................................................153 [SENSe][:LTE]:PREamble:SELect.................................................................................................................156 [SENSe][:LTE]:SFLatness:ECONditions........................................................................................................164 [SENSe][:LTE]:SFLatness:OBANd................................................................................................................ 164 [SENSe][:LTE]:SLOT:SELect.........................................................................................................................156 [SENSe][:LTE]:SUBFrame:SELect................................................................................................................ 156 [SENSe][:LTE]:UL:DEMod:ACON..................................................................................................................169 [SENSe][:LTE]:UL:DEMod:ATTSlots............................................................................................................. 168 [SENSe][:LTE]:UL:DEMod:CBSCrambling.................................................................................................... 169 [SENSe][:LTE]:UL:DEMod:CDCoffset........................................................................................................... 169 [SENSe][:LTE]:UL:DEMod:CESTimation.......................................................................................................168 [SENSe][:LTE]:UL:DEMod:EEPeriod.............................................................................................................168 [SENSe][:LTE]:UL:DEMod:MCFilter.............................................................................................................. 170 [SENSe][:LTE]:UL:DEMod:MODE................................................................................................................. 168 [SENSe][:LTE]:UL:DEMod:SISYnc................................................................................................................ 170 [SENSe][:LTE]:UL:FORMat:SCD...................................................................................................................169 [SENSe][:LTE]:UL:TRACking:PHASe............................................................................................................170 [SENSe][:LTE]:UL:TRACking:TIME............................................................................................................... 170 CALCulate<n>:FEED.....................................................................................................................................121 CALCulate<n>:LIMit<k>:ACPower:ACHannel:RESult?.................................................................................140 CALCulate<n>:LIMit<k>:ACPower:ALTernate:RESult?................................................................................ 141 CALCulate<n>:LIMit<k>:FAIL?......................................................................................................................141 CALCulate<n>:LIMit<k>:SUMMary:EVM:PCHannel:MAXimum:RESult?......................................................143 CALCulate<n>:LIMit<k>:SUMMary:EVM:PCHannel[:AVERage]:RESult?.................................................... 143 CALCulate<n>:LIMit<k>:SUMMary:EVM:PSIGnal:MAXimum:RESult?.........................................................144 CALCulate<n>:LIMit<k>:SUMMary:EVM:PSIGnal[:AVERage]:RESult?....................................................... 144 CALCulate<n>:LIMit<k>:SUMMary:EVM:SDQP[:AVERage]:RESult?...........................................................144 CALCulate<n>:LIMit<k>:SUMMary:EVM:SDSF[:AVERage]:RESult?........................................................... 145 CALCulate<n>:LIMit<k>:SUMMary:EVM:SDST[:AVERage]:RESult?........................................................... 145 CALCulate<n>:LIMit<k>:SUMMary:EVM:UCCD[:AVERage]:RESult?.......................................................... 145 CALCulate<n>:LIMit<k>:SUMMary:EVM:UCCH[:AVERage]:RESult?.......................................................... 146 CALCulate<n>:LIMit<k>:SUMMary:EVM:UPRA[:AVERage]:RESult?...........................................................146 User Manual 1308.9135.42 ─ 15 192 R&S®FS‑K101/103/105PC List of Commands CALCulate<n>:LIMit<k>:SUMMary:EVM:USQP[:AVERage]:RESult?...........................................................146 CALCulate<n>:LIMit<k>:SUMMary:EVM:USSF[:AVERage]:RESult?........................................................... 147 CALCulate<n>:LIMit<k>:SUMMary:EVM:USST[:AVERage]:RESult?........................................................... 147 CALCulate<n>:LIMit<k>:SUMMary:EVM[:ALL]:MAXimum:RESult?..............................................................143 CALCulate<n>:LIMit<k>:SUMMary:EVM[:ALL][:AVERage]:RESult?............................................................ 143 CALCulate<n>:LIMit<k>:SUMMary:FERRor:MAXimum:RESult?..................................................................148 CALCulate<n>:LIMit<k>:SUMMary:FERRor[:AVERage]:RESult?.................................................................148 CALCulate<n>:LIMit<k>:SUMMary:GIMBalance:MAXimum:RESult?........................................................... 148 CALCulate<n>:LIMit<k>:SUMMary:GIMBalance[:AVERage]:RESult?..........................................................148 CALCulate<n>:LIMit<k>:SUMMary:IQOFfset:MAXimum:RESult?................................................................ 148 CALCulate<n>:LIMit<k>:SUMMary:IQOFfset[:AVERage]:RESult?............................................................... 148 CALCulate<n>:LIMit<k>:SUMMary:QUADerror:MAXimum:RESult?.............................................................149 CALCulate<n>:LIMit<k>:SUMMary:QUADerror[:AVERage]:RESult?............................................................149 CALCulate<n>:LIMit<k>:SUMMary:SERRor:MAXimum:RESult?..................................................................149 CALCulate<n>:LIMit<k>:SUMMary:SERRor[:AVERage]:RESult?................................................................ 149 CALCulate<n>:MARKer<m>:FUNCtion:POWer:RESult[:CURRent]?........................................................... 141 CONFigure:ACONfig<instrument>:ADDRess................................................................................................157 CONFigure:ACONfig<instrument>:ICSequence............................................................................................158 CONFigure:ACONfig<instrument>:NCHannels............................................................................................. 158 CONFigure:NOCC......................................................................................................................................... 157 CONFigure:POWer:EXPected:IQ<instrument>............................................................................................. 152 CONFigure:POWer:EXPected:RF<instrument>............................................................................................ 152 CONFigure:PRESet.......................................................................................................................................189 CONFigure[:LTE]:DUPLexing........................................................................................................................150 CONFigure[:LTE]:LDIRection........................................................................................................................ 151 CONFigure[:LTE]:UL:CABW..........................................................................................................................162 CONFigure[:LTE]:UL:CSUBframes................................................................................................................175 CONFigure[:LTE]:UL:MIMO:ASELection....................................................................................................... 158 CONFigure[:LTE]:UL:MIMO:PUCCh:CONFig................................................................................................159 CONFigure[:LTE]:UL:MIMO:PUSCh:CONFig................................................................................................159 CONFigure[:LTE]:UL:MIMO:SRS:CONFig.................................................................................................... 159 CONFigure[:LTE]:UL:PRACh:APM................................................................................................................187 CONFigure[:LTE]:UL:PRACh:CONF............................................................................................................. 187 CONFigure[:LTE]:UL:PRACh:FOFFset......................................................................................................... 187 CONFigure[:LTE]:UL:PRACh:FRINdex......................................................................................................... 188 CONFigure[:LTE]:UL:PRACh:HFINdicator.................................................................................................... 188 CONFigure[:LTE]:UL:PRACh:NCSC............................................................................................................. 188 CONFigure[:LTE]:UL:PRACh:RSEQ............................................................................................................. 188 CONFigure[:LTE]:UL:PRACh:RSET.............................................................................................................. 187 CONFigure[:LTE]:UL:PRACh:SINDex........................................................................................................... 188 CONFigure[:LTE]:UL:PUCCh:DESHift...........................................................................................................185 CONFigure[:LTE]:UL:PUCCh:FORMat..........................................................................................................186 CONFigure[:LTE]:UL:PUCCh:N1CS..............................................................................................................185 CONFigure[:LTE]:UL:PUCCh:N2RB..............................................................................................................185 CONFigure[:LTE]:UL:PUCCh:NORB............................................................................................................. 185 CONFigure[:LTE]:UL:PUCCh:NPAR............................................................................................................. 186 CONFigure[:LTE]:UL:SFNO...........................................................................................................................174 CONFigure[:LTE]:UL:SRS:ANST...................................................................................................................181 CONFigure[:LTE]:UL:SRS:BHOP.................................................................................................................. 181 CONFigure[:LTE]:UL:SRS:BSRS.................................................................................................................. 181 User Manual 1308.9135.42 ─ 15 193 R&S®FS‑K101/103/105PC List of Commands CONFigure[:LTE]:UL:SRS:CSRS.................................................................................................................. 181 CONFigure[:LTE]:UL:SRS:CYCS.................................................................................................................. 182 CONFigure[:LTE]:UL:SRS:ISRS....................................................................................................................182 CONFigure[:LTE]:UL:SRS:MUPT.................................................................................................................. 182 CONFigure[:LTE]:UL:SRS:NRRC..................................................................................................................182 CONFigure[:LTE]:UL:SRS:POWer................................................................................................................ 182 CONFigure[:LTE]:UL:SRS:STAT................................................................................................................... 183 CONFigure[:LTE]:UL:SRS:SUConfig.............................................................................................................183 CONFigure[:LTE]:UL:SRS:TRComb..............................................................................................................183 CONFigure[:LTE]:UL:UEID............................................................................................................................ 189 CONFigure[:LTE]:UL[:CC<cci>]:BW.............................................................................................................. 171 CONFigure[:LTE]:UL[:CC<cci>]:CYCPrefix................................................................................................... 171 CONFigure[:LTE]:UL[:CC<cci>]:DRS:AOCC.................................................................................................178 CONFigure[:LTE]:UL[:CC<cci>]:DRS:DSSHift.............................................................................................. 179 CONFigure[:LTE]:UL[:CC<cci>]:DRS:GRPHopping...................................................................................... 179 CONFigure[:LTE]:UL[:CC<cci>]:DRS:NDMRs...............................................................................................179 CONFigure[:LTE]:UL[:CC<cci>]:DRS:PUCCh:POWer.................................................................................. 179 CONFigure[:LTE]:UL[:CC<cci>]:DRS:SEQHopping...................................................................................... 180 CONFigure[:LTE]:UL[:CC<cci>]:DRS:SEQuence..........................................................................................180 CONFigure[:LTE]:UL[:CC<cci>]:DRS[:PUSCh]:POWer................................................................................ 180 CONFigure[:LTE]:UL[:CC<cci>]:PLC:CID......................................................................................................173 CONFigure[:LTE]:UL[:CC<cci>]:PLC:CIDGroup............................................................................................173 CONFigure[:LTE]:UL[:CC<cci>]:PLC:PLID....................................................................................................174 CONFigure[:LTE]:UL[:CC<cci>]:PUSCh:FHMode......................................................................................... 183 CONFigure[:LTE]:UL[:CC<cci>]:PUSCh:FHOFfset....................................................................................... 184 CONFigure[:LTE]:UL[:CC<cci>]:PUSCh:FHOP:IIHB.....................................................................................184 CONFigure[:LTE]:UL[:CC<cci>]:PUSCh:NOSM............................................................................................ 184 CONFigure[:LTE]:UL[:CC<cci>]:SUBFrame<subframe>:ALLoc:CONT........................................................ 175 CONFigure[:LTE]:UL[:CC<cci>]:SUBFrame<subframe>:ALLoc:MODulation................................................176 CONFigure[:LTE]:UL[:CC<cci>]:SUBFrame<subframe>:ALLoc:PRECoding:CBINdex................................ 176 CONFigure[:LTE]:UL[:CC<cci>]:SUBFrame<subframe>:ALLoc:PRECoding:CLMapping............................ 176 CONFigure[:LTE]:UL[:CC<cci>]:SUBFrame<subframe>:ALLoc:PUCCh:FORMat........................................176 CONFigure[:LTE]:UL[:CC<cci>]:SUBFrame<subframe>:ALLoc:PUCCh:NPAR........................................... 177 CONFigure[:LTE]:UL[:CC<cci>]:SUBFrame<subframe>:ALLoc:PUSCh:CSField.........................................177 CONFigure[:LTE]:UL[:CC<cci>]:SUBFrame<subframe>:ALLoc:PUSCh:NDMRs......................................... 177 CONFigure[:LTE]:UL[:CC<cci>]:SUBFrame<subframe>:ALLoc:RATO.........................................................178 CONFigure[:LTE]:UL[:CC<cci>]:SUBFrame<subframe>:ALLoc[:CLUSter<cluster>]:RBCount.................... 175 CONFigure[:LTE]:UL[:CC<cci>]:SUBFrame<subframe>:ALLoc[:CLUSter<cluster>]:RBOFfset................... 175 CONFigure[:LTE]:UL[:CC<cci>]:TDD:SPSC..................................................................................................172 CONFigure[:LTE]:UL[:CC<cci>]:TDD:UDConf...............................................................................................172 DISPlay[:WINDow<n>]:SELect......................................................................................................................189 DISPlay[:WINDow<n>]:TABLe.......................................................................................................................122 DISPlay[:WINDow<n>]:TRACe<t>:Y[:SCALe]:RLEVel:OFFSet.................................................................... 153 FETCh:SUMMary:CRESt:MAXimum?........................................................................................................... 124 FETCh:SUMMary:CRESt:MINimum?............................................................................................................ 124 FETCh:SUMMary:CRESt[:AVERage]?..........................................................................................................124 FETCh:SUMMary:EVM:PCHannel:MAXimum?.............................................................................................125 FETCh:SUMMary:EVM:PCHannel:MINimum?.............................................................................................. 125 FETCh:SUMMary:EVM:PCHannel[:AVERage]?............................................................................................125 FETCh:SUMMary:EVM:PSIGnal:MAXimum?................................................................................................125 User Manual 1308.9135.42 ─ 15 194 R&S®FS‑K101/103/105PC List of Commands FETCh:SUMMary:EVM:PSIGnal:MINimum?................................................................................................. 125 FETCh:SUMMary:EVM:PSIGnal[:AVERage]?...............................................................................................125 FETCh:SUMMary:EVM:SDQP[:AVERage]?..................................................................................................125 FETCh:SUMMary:EVM:SDSF[:AVERage]?.................................................................................................. 125 FETCh:SUMMary:EVM:SDST[:AVERage]?.................................................................................................. 126 FETCh:SUMMary:EVM:UCCD[:AVERage]?..................................................................................................126 FETCh:SUMMary:EVM:UCCH[:AVERage]?..................................................................................................126 FETCh:SUMMary:EVM:UPRA[:AVERage]?.................................................................................................. 127 FETCh:SUMMary:EVM:USQP[:AVERage]?..................................................................................................127 FETCh:SUMMary:EVM:USSF[:AVERage]?.................................................................................................. 127 FETCh:SUMMary:EVM:USST[:AVERage]?.................................................................................................. 127 FETCh:SUMMary:EVM[:ALL]:MAXimum?.....................................................................................................124 FETCh:SUMMary:EVM[:ALL]:MINimum?...................................................................................................... 124 FETCh:SUMMary:EVM[:ALL][:AVERage]?....................................................................................................124 FETCh:SUMMary:FERRor:MAXimum?......................................................................................................... 128 FETCh:SUMMary:FERRor:MINimum?.......................................................................................................... 128 FETCh:SUMMary:FERRor[:AVERage]?........................................................................................................128 FETCh:SUMMary:GIMBalance:MAXimum?.................................................................................................. 128 FETCh:SUMMary:GIMBalance:MINimum?................................................................................................... 128 FETCh:SUMMary:GIMBalance[:AVERage]?................................................................................................. 128 FETCh:SUMMary:IQOFfset:MAXimum?....................................................................................................... 128 FETCh:SUMMary:IQOFfset:MINimum?.........................................................................................................128 FETCh:SUMMary:IQOFfset[:AVERage]?...................................................................................................... 128 FETCh:SUMMary:POWer:MAXimum?.......................................................................................................... 129 FETCh:SUMMary:POWer:MINimum?........................................................................................................... 129 FETCh:SUMMary:POWer[:AVERage]?......................................................................................................... 129 FETCh:SUMMary:QUADerror:MAXimum?.................................................................................................... 129 FETCh:SUMMary:QUADerror:MINimum?..................................................................................................... 129 FETCh:SUMMary:QUADerror[:AVERage]?...................................................................................................129 FETCh:SUMMary:SERRor:MAXimum?.........................................................................................................129 FETCh:SUMMary:SERRor:MINimum?.......................................................................................................... 129 FETCh:SUMMary:SERRor[:AVERage]?........................................................................................................129 FETCh:SUMMary:TFRame?..........................................................................................................................130 FETCh:TAERror[:CC<cci>]:ANTenna<antenna>:MAXimum?.......................................................................130 FETCh:TAERror[:CC<cci>]:ANTenna<antenna>:MINimum?........................................................................ 130 FETCh:TAERror[:CC<cci>]:ANTenna<antenna>[:AVERage]?......................................................................130 FETCh[:CC<cci>]:CYCPrefix?....................................................................................................................... 172 FETCh[:CC<cci>]:OSUBcarriers?..................................................................................................................173 FORMat[:DATA].............................................................................................................................................190 INITiate:REFResh..........................................................................................................................................122 INITiate[:IMMediate].......................................................................................................................................122 INPut:IQ:BALanced[:STATe]......................................................................................................................... 165 INPut:IQ:FSOFfset.........................................................................................................................................165 INPut:IQ:IMPedance......................................................................................................................................165 INPut<n>:ATTenuation<instrument>............................................................................................................. 153 INPut<n>:DIQ:RANGe[:UPPer]..................................................................................................................... 166 INPut<n>:DIQ:SRATe....................................................................................................................................167 MMEMory:LOAD:DEModsetting.................................................................................................................... 190 MMEMory:LOAD:IQ:STATe...........................................................................................................................190 MMEMory:STORe:DEModsetting.................................................................................................................. 191 User Manual 1308.9135.42 ─ 15 195 R&S®FS‑K101/103/105PC List of Commands MMEMory:STORe:IQ:STATe.........................................................................................................................191 SENSe:INPut................................................................................................................................................. 151 TRACe[:DATA]?.............................................................................................................................................140 TRIGger[:SEQuence]:HOLDoff<instrument>.................................................................................................160 TRIGger[:SEQuence]:LEVel<instrument>:POWer........................................................................................ 161 TRIGger[:SEQuence]:LEVel<instrument>[:EXTernal]................................................................................... 160 TRIGger[:SEQuence]:MODE......................................................................................................................... 160 TRIGger[:SEQuence]:PORT<instrument>.....................................................................................................161 TRIGger[:SEQuence]:SLOPe........................................................................................................................ 161 UNIT:BSTR....................................................................................................................................................155 UNIT:CAXes.................................................................................................................................................. 155 UNIT:EVM......................................................................................................................................................155 User Manual 1308.9135.42 ─ 15 196 R&S®FS‑K101/103/105PC Index Index A ACLR ................................................................................. 40 Allocation summary ........................................................... 48 Auto Demodulation ............................................................ 73 Auto Detection (Cell Identity) ............................................ 78 B Balanced Input .................................................................. 68 Bit stream .......................................................................... 49 C Capture buffer ................................................................... 33 Capture Time .................................................................... 56 Carrier aggregation ........................................................... 64 CCDF ................................................................................ 48 Cell ID ............................................................................... 78 Cell Identity Group ............................................................ 78 Channel Bandwidth ........................................................... 75 Channel Estimation Range ............................................... 72 Channel flatness group delay ............................................ 45 Compensate DC Offset ..................................................... 72 Configurable Subframes ................................................... 78 Configuration Table ........................................................... 78 Constellation diagram ....................................................... 46 Constellation Selection ...................................................... 47 D Demodulation Reference Signal Delta Sequence Shift .................................................. 85 Group Hopping ........................................................... 84 n_DRMS ..................................................................... 85 Relative Power PUCCH .............................................. 85 Relative Power PUSCH .............................................. 84 Sequence .................................................................... 83 Sequence Hopping ..................................................... 84 DFT precoding constellation ............................................. 46 Digital Input Data Rate ...................................................... 69 Dither ................................................................................. 68 E EVM vs Carrier .................................................................. 35 EVM vs subframe .............................................................. 38 EVM vs symbol ................................................................. 36 EVM vs symbol x carrier ................................................... 37 External Attenuation .......................................................... 56 F Frame Number Offset ....................................................... 78 Frequency ......................................................................... 53 Full Scale Level ................................................................. 69 H Header Table .................................................................... 25 I Inband emission ................................................................ 42 Input Source ...................................................................... 54 Interface ............................................................................ 23 L Low Pass ...........................................................................68 M Measurement ACLR .......................................................................... 40 allocation summary ..................................................... 48 bit stream .................................................................... 49 capture buffer .............................................................. 33 CCDF .......................................................................... 48 channel flatness grdel ................................................. 45 constellation ................................................................ 46 DFT precod constell .................................................... 46 EVM (error vector magnitude) .................................... 35 EVM vs carrier ............................................................ 35 EVM vs subframe ....................................................... 38 EVM vs sym x carr ...................................................... 37 EVM vs symbol ........................................................... 36 inband emission .......................................................... 42 list ............................................................................... 30 misc ............................................................................ 48 numerical .................................................................... 30 power spectrum .......................................................... 42 power vs sym x carr .................................................... 34 PVT (power over time) ................................................ 33 result summary ........................................................... 30 spectrum ..................................................................... 38 spectrum flatness ........................................................ 43 spectrum flatness difference ....................................... 44 spectrum flatness SRS ............................................... 44 spectrum mask ........................................................... 39 statistics ...................................................................... 48 Multicarrier filter ................................................................. 74 N Number of RB ................................................................... 75 Numerical results .............................................................. 30 P Phase Error ....................................................................... 74 Power spectrum ................................................................ 42 Power vs symbol x carrier ................................................. 34 PUCCH Structure Delta Shift ................................................................... 90 Format ........................................................................ 91 N_PUCCH .................................................................. 91 N(1)_cs ....................................................................... 91 N(2)_RB ...................................................................... 91 Number of RBs for PUCCH ........................................ 90 PUSCH Structure Frequency Hopping Mode .......................................... 89 Info. in Hopping Bits .................................................... 89 Number of Subbands .................................................. 89 PUSCH Hopping Offset .............................................. 89 Identity (Physical Layer) .................................................... 78 User Manual 1308.9135.42 ─ 15 197 R&S®FS‑K101/103/105PC R Reference Level ................................................................ 55 Resource Blocks ............................................................... 75 Result Display Constellation Selection ............................................... 47 Result summary ................................................................ 30 S Scrambling of coded bits ................................................... 72 Screen Layout ................................................................... 23 SEM requirement .............................................................. 65 Settings Auto ............................................................................ 78 Auto Demodulation ..................................................... 73 Balanced ..................................................................... 68 Capture Time .............................................................. 56 Cell ID ......................................................................... 78 Cell Identity Group ...................................................... 78 Channel Bandwidth ..................................................... 75 Channel Estimation Range ......................................... 72 Compensate DC Offset ............................................... 72 Conf. Index I_SRS ...................................................... 86 Configurable Subframes ............................................. 78 Delta Sequence Shift .................................................. 85 Delta Shift ................................................................... 90 Digital Input Data Rate ................................................ 69 Dither .......................................................................... 68 Ext Att ......................................................................... 56 Format ........................................................................ 91 Frame Number Offset ................................................. 78 Freq. Domain Pos. n_RRC ......................................... 88 Frequency ................................................................... 53 Frequency Hopping Mode .......................................... 89 Full Scale Level .......................................................... 69 Group Hopping ........................................................... 84 Hopping BW b_hop ..................................................... 87 Identity ........................................................................ 78 Info. in Hopping Bits .................................................... 89 Low Pass .................................................................... 68 multicarrier filter .......................................................... 74 n_DRMS ..................................................................... 85 N_PUCCH .................................................................. 91 N(1)_cs ....................................................................... 91 N(2)_RB ...................................................................... 91 Number of RB ............................................................. 75 Number of RBs for PUCCH ........................................ 90 Number of Subbands .................................................. 89 Phase .......................................................................... 74 Present ....................................................................... 86 PUSCH Hopping Offset .............................................. 89 Ref Level ..................................................................... 55 Rel Power ................................................................... 87 Relative Power PUCCH .............................................. 85 Relative Power PUSCH .............................................. 84 Scrambling of coded bits ............................................ 72 Sequence .................................................................... 83 Sequence Hopping ..................................................... 84 Source ........................................................................ 54 SRS Bandwidth B_SRS .............................................. 87 SRS BW Conf. C_SRS ............................................... 86 SRS Cyclic Shift N_CS ............................................... 88 SRS Subframe Conf. .................................................. 86 Standard ..................................................................... 52 suppressed interference synchronization ................... 74 Swap I/Q ..................................................................... 67 User Manual 1308.9135.42 ─ 15 Index TDD UL/DL Allocations ............................................... 76 Timing ......................................................................... 75 Transm. Comb. K_TC ................................................. 87 Trigger level ................................................................ 63 Trigger mode .............................................................. 63 Trigger offset ............................................................... 63 Softkey Const Selection ........................................................... 47 Software license ................................................................ 14 Sounding Reference Signal Conf. Index I_SRS ...................................................... 86 Freq. Domain Pos. n_RRC ......................................... 88 Hopping BW b_hop ..................................................... 87 Present ....................................................................... 86 Rel Power ................................................................... 87 SRS Bandwidth B_SRS .............................................. 87 SRS BW Conf. C_SRS ............................................... 86 SRS Cyclic Shift N_CS ............................................... 88 SRS Subframe Conf. .................................................. 86 Transm. Comb. K_TC ................................................. 87 Source (Input) ................................................................... 54 Spectrum flatness ............................................................. 43 Spectrum flatness difference ............................................. 44 Spectrum flatness SRS ..................................................... 44 Spectrum mask ................................................................. 39 Standard Selection ............................................................ 52 Status Bar ......................................................................... 25 Subframe Configuration Table .......................................... 78 Suppressed interference synchronization ......................... 74 Swap I/Q ........................................................................... 67 T TDD UL/DL Allocations ..................................................... 76 Timing Error ...................................................................... 75 Title Bar ............................................................................. 25 Trigger level ...................................................................... 63 Trigger mode ..................................................................... 63 Trigger offset ..................................................................... 63 198