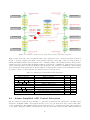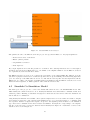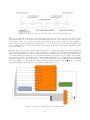
1
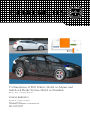
Co-Simulation of Full Vehicle Model in Adams and
Anti-Lock Brake System Model in Simulink
Master’s thesis in Applied Mechanics
TOBIAS ERIKSSON
Department of Applied Mechanics
Division of Dynamics
CHALMERS UNIVERSITY OF TECHNOLOGY
Göteborg, Sweden 2014
Master’s thesis 2014:27
MASTER’S THESIS IN APPLIED MECHANICS
Co-Simulation of Full Vehicle Model in Adams and Anti-Lock Brake System
Model in Simulink
TOBIAS ERIKSSON
Department of Applied Mechanics
Division of Dynamics
CHALMERS UNIVERSITY OF TECHNOLOGY
Göteborg, Sweden 2014
Co-Simulation of Full Vehicle Model in Adams and Anti-Lock Brake System Model in Simulink
TOBIAS ERIKSSON
c TOBIAS ERIKSSON, 2014
Master’s thesis 2014:27
ISSN 1652-8557
Department of Applied Mechanics
Division of Dynamics
Chalmers University of Technology
SE-412 96 Göteborg
Sweden
Telephone: +46 (0)31-772 1000
Cover:
Upper left: Measurements at the proving ground
Upper right: Co-simulation model in Simulink
Bottom: Full vehicle road load simulation in Adams/Car using co-simulation model in Simulink
Chalmers Reproservice
Göteborg, Sweden 2014
Co-Simulation of Full Vehicle Model in Adams and Anti-Lock Brake System Model in Simulink
Master’s thesis in Applied Mechanics
TOBIAS ERIKSSON
Department of Applied Mechanics
Division of Dynamics
Chalmers University of Technology
Abstract
This document is a master’s thesis written at Chalmers University of Technology in collaboration with the
Durability department at Volvo Car Corporation (VCC). Full vehicle road load simulations in Adams/Car
are used at VCC today to set the strength and endurance design loads for wheel suspension, steering system,
engine suspension and car body. In order to simulate the effects of control systems on vehicle, system, and
component level, CAE methods to integrate control systems in full vehicle simulations are needed.
The VCC endurance events include several events where the Anti-Lock Brake System (ABS) regulation is
activated. To be able to simulate the longitudinal forces for these events with a high level of confidence it is
critical to model the anti-lock brake system. A simplified ABS model is used today where a set of parameters
have to be adjusted/set for the different events based on physical measurements. The parameters remain
constant during simulated events which is not the case in the real vehicle. The main goal is to improve the
method for road load simulations of brake events by coupling a full vehicle model in Adams/Car to a model of
the ABS in Simulink, so called co-simulation.
The co-simulation method has been validated against simulations with the simplified ABS model and physical
measurements for key brake events. Measurements with an instrumented Volvo V40 vehicle have been performed
at Hällered proving ground. The first part of the project included modeling of the V40 measurement vehicle
and simulations with the simplified ABS model. The simplified ABS model represents the current modeling of
ABS regulation for road load simulations and is used according to the method instructions at VCC.
The main part of the project has been to set up a co-simulation model, i.e. to integrate the full vehicle
Adams model of the V40 with a Simulink model of the ABS developed by the brake system supplier. A new
ABS control subsystem has been created in the Adams/Car Mechatronics toolbox to enable co-simulations.
The toolbox has the capability to export an Adams model to a Simulink block, making it possible to couple
the ABS model with the full vehicle model. A closed loop has been created in the Simulink environment.
Thus Simulink leads the simulation, where the two different softwares exchange information at certain time steps.
When validating results from co-simulations versus measurements and the simplified ABS model, clear benefits
of using the co-simulation method have been seen. ABS regulation simulated using co-simulation resulted in
better correlation with measurements than the simplified ABS model used today. A drawback is computer
compatibility of the Simulink model developed by the supplier. As the Simulink model is only developed for
Windows 32-bit, it can not run on the Linux 64-bit cluster normally used for road load simulations at VCC.
Another drawback is that the Simulink model is delivered as a black box model and governing algorithms can
not be investigated.
Keywords: ABS, Anti Lock, Brake, co-simulation, Braking, Adams, Simulink
Preface
This document contains my last project as a graduate on the Applied Mechanics program at Chalmers University
of Technology. The work was done during the spring of 2014. The paper thoroughly describes how you can
connect models created in different softwares, in order to simulate endurance events for cars with higher
accuracy. When I look back it is all so clear the way that should have been taken which could have saved
much time and frustration. Instead the endurance events really put my endurance to the limit, since from the
beginning until almost the very end, things did not go as planned. But without disappointment you can’t
appreciate victory, thus this paper can truly be regarded as a victory. Always remember that happiness is a
choice.
Acknowledgements
First and foremost I would like to express my sincere gratitude to Anders Wirje who has been my supervisor at
Volvo Car Corporation, for all support, dedication, and for solving major and unexpected problems on very
short notice. I would also like to thank my thesis examiner and supervisor at Chalmers, Per-Åke Jansson, for
guidance, and for being available on equally short notice throughout the project. I would also like to thank
all personnel at the Durability department for making me feel welcomed and a part of the team. I also want
to thank the other departments at VCC involved in the project, in particular Danny Veznaver and Daniel
Gunnarsson, for their support and interest in my work. And finally my family and friends for supporting me,
especially in the end when all my time was devoted to finish this paper.
Contents
Abstract
Preface
Acknowledgements
Contents
1 Introduction
1.1 Project Background . .
1.2 Purpose and Objectives
1.3 Limitations . . . . . . .
1.4 Major Activities . . . .
.
.
.
.
1
1
1
1
1
2 Brake System Functionality
2.1 Brake System . . . . . . . . . . . . . . . . . . . . . . . . . . . . . . . . . . . . . . . . . . . . . . . .
2.2 Anti-lock Brake System . . . . . . . . . . . . . . . . . . . . . . . . . . . . . . . . . . . . . . . . . .
2.3 Vehicle Dynamics During Brake Events . . . . . . . . . . . . . . . . . . . . . . . . . . . . . . . . .
2
2
2
5
3 Physical Measurements
3.1 Measurement Vehicle Specifications . . . . . . . . . . . . . . . . . . . . . . . . . . . . . . . . . . . .
3.2 Measurement Vehicle Preparation . . . . . . . . . . . . . . . . . . . . . . . . . . . . . . . . . . . . .
3.3 Measurements of Brake Events . . . . . . . . . . . . . . . . . . . . . . . . . . . . . . . . . . . . . .
7
7
9
11
4 Modeling
4.1 Adams Full Vehicle Model . . . . . . . . . .
4.2 Adams Mechanical Brake Subsystem . . . .
4.3 Adams Simplified ABS Control Subsystem .
4.4 Simulink EBS Model . . . . . . . . . . . . .
4.5 Simulink Co-Simulation Model . . . . . . .
.
.
.
.
.
.
.
.
.
.
.
.
.
.
.
.
.
.
.
.
.
.
.
.
.
.
.
.
.
.
.
.
.
.
.
.
.
.
.
.
.
.
.
.
.
.
.
.
.
.
.
.
.
.
.
.
.
.
.
.
.
.
.
.
.
.
.
.
.
.
.
.
.
.
.
.
.
.
.
.
.
.
.
.
.
.
.
.
.
.
.
.
.
.
.
.
.
.
.
.
.
.
.
.
.
.
.
.
.
.
.
.
.
.
.
.
.
.
.
.
.
.
.
.
.
.
.
.
.
.
.
.
.
.
.
.
.
.
.
.
.
.
.
.
.
.
.
.
.
.
.
.
.
.
.
13
13
14
15
16
17
5 Simulation setup
5.1 Initial Results with Co-Simulation Model
5.1.1 Verification Adams Block . . . . . . . .
5.1.2 Verification Simulink EBS Model . . . .
5.2 Final Co-Simulation Setup . . . . . . . . .
5.3 Brake Pressure Ramp Up Time Setup . .
5.4 Simulation Procedure . . . . . . . . . . .
.
.
.
.
.
.
.
.
.
.
.
.
.
.
.
.
.
.
.
.
.
.
.
.
.
.
.
.
.
.
.
.
.
.
.
.
.
.
.
.
.
.
.
.
.
.
.
.
.
.
.
.
.
.
.
.
.
.
.
.
.
.
.
.
.
.
.
.
.
.
.
.
.
.
.
.
.
.
.
.
.
.
.
.
.
.
.
.
.
.
.
.
.
.
.
.
.
.
.
.
.
.
.
.
.
.
.
.
.
.
.
.
.
.
.
.
.
.
.
.
.
.
.
.
.
.
.
.
.
.
.
.
.
.
.
.
.
.
.
.
.
.
.
.
.
.
.
.
.
.
.
.
.
.
.
.
.
.
.
.
.
.
.
.
.
.
.
.
.
.
.
.
.
.
.
.
.
.
.
.
.
.
.
.
.
.
.
.
.
.
.
.
20
20
21
23
25
27
28
6 Validation
6.1 Straight Line Braking on Flat Road
6.2 Braking on Tar Patched Track . . .
6.3 Braking Against a Curb Event . . .
6.4 Braking in Corner on Flat Road . .
.
.
.
.
.
.
.
.
.
.
.
.
.
.
.
.
.
.
.
.
.
.
.
.
.
.
.
.
.
.
.
.
.
.
.
.
.
.
.
.
.
.
.
.
.
.
.
.
.
.
.
.
.
.
.
.
.
.
.
.
.
.
.
.
.
.
.
.
.
.
.
.
.
.
.
.
.
.
.
.
.
.
.
.
.
.
.
.
.
.
.
.
.
.
.
.
.
.
.
.
.
.
.
.
.
.
.
.
.
.
.
.
.
.
.
.
.
.
.
.
.
.
.
.
.
.
.
.
30
31
33
35
37
.
.
.
.
.
.
.
.
.
.
.
.
.
.
.
.
.
.
.
.
.
.
.
.
.
.
.
.
.
.
.
.
.
.
.
.
.
.
.
.
.
.
.
.
.
.
.
.
.
.
.
.
.
.
.
.
.
.
.
.
.
.
.
.
.
.
.
.
.
.
.
.
.
.
.
.
.
.
.
.
.
.
.
.
.
.
.
.
.
.
.
.
.
.
.
.
.
.
.
.
.
.
.
.
.
.
.
.
.
.
.
.
.
.
.
.
.
.
.
.
.
.
.
.
.
.
.
.
.
.
.
.
.
.
.
.
.
.
.
.
.
.
.
.
.
.
.
.
.
.
.
.
.
.
.
.
.
.
.
.
.
.
.
.
.
.
.
.
.
.
.
.
.
.
.
.
7 Concluding remarks & future work
39
References
40
List of Figures
2.1
2.2
2.3
2.4
2.5
2.6
3.1
3.2
3.3
3.4
3.5
3.6
3.7
4.1
4.2
4.3
4.4
4.5
4.6
4.7
4.8
5.1
5.2
5.3
5.4
5.5
5.6
5.7
5.8
5.9
5.10
5.11
5.12
5.13
5.14
6.1
6.2
6.3
6.4
6.5
6.6
Disc brake . . . . . . . . . . . . . . . . . . . . . . . . . . . . . . . . . . . . . . . . . . . . . . . .
Schematics over sensors located at each wheel to measure rotational veloctiy and ECU for
processing of generated signals . . . . . . . . . . . . . . . . . . . . . . . . . . . . . . . . . . . .
Kinematics for one wheel . . . . . . . . . . . . . . . . . . . . . . . . . . . . . . . . . . . . . . .
ABS reference speed versus the longitudinal velocity (calculated from nominal radius and
rotational velocity) for a wheel with ABS regulation and without ABS regulation . . . . . . . .
Free body diagram of a vehicle at standstill . . . . . . . . . . . . . . . . . . . . . . . . . . . . .
Free body diagram of a vehicle during a brake event . . . . . . . . . . . . . . . . . . . . . . . .
Measurement vehicle . . . . . . . . . . . . . . . . . . . . . . . . . . . . . . . . . . . . . . . . . .
Damper characteristics . . . . . . . . . . . . . . . . . . . . . . . . . . . . . . . . . . . . . . . . .
Loading using dummies with weights added inside them, and signal processing equipment between
the dummies . . . . . . . . . . . . . . . . . . . . . . . . . . . . . . . . . . . . . . . . . . . . . .
Installation of the measurement ECU . . . . . . . . . . . . . . . . . . . . . . . . . . . . . . . . .
External pressure gauge . . . . . . . . . . . . . . . . . . . . . . . . . . . . . . . . . . . . . . . .
Overview of Hällered proving ground . . . . . . . . . . . . . . . . . . . . . . . . . . . . . . . . .
Tracks used for measurements . . . . . . . . . . . . . . . . . . . . . . . . . . . . . . . . . . . . .
Database structure for MSC Adams/Car . . . . . . . . . . . . . . . . . . . . . . . . . . . . . . .
Adams full vehicle model with a subset of included subsystems listed . . . . . . . . . . . . . . .
Adams brake subsystem . . . . . . . . . . . . . . . . . . . . . . . . . . . . . . . . . . . . . . . .
Schematic representation of the Adams mechanical brake subsystem . . . . . . . . . . . . . . .
Simulink EBS model interface . . . . . . . . . . . . . . . . . . . . . . . . . . . . . . . . . . . . .
Data flow schematics for the modeling in Adams/Car Mechatronics . . . . . . . . . . . . . . . .
Graphics of the Simulink co-simulation model . . . . . . . . . . . . . . . . . . . . . . . . . . . .
Simulink solver settings . . . . . . . . . . . . . . . . . . . . . . . . . . . . . . . . . . . . . . . .
Straight line braking on flat road (dry tarmac). Simulated longitudinal wheel velocity FL and
RL together with longitudinal vehicle velocity. . . . . . . . . . . . . . . . . . . . . . . . . . . . .
Straight line braking on flat road (dry tarmac). Simulated brake line pressure FL and RL. . . .
Open loop Simulink model to verify the Adams block (full vehicle model) . . . . . . . . . . . .
Input brake line pressures for verification of the Adams block (full vehicle model) . . . . . . . .
Simulated rotational wheel velocity FL for open loop Simulink model of the Adams block and
reference (Brake department’s simulation of Simulink EBS model with Simulink full vehicle model)
Simulated brake line pressures from supplier. Pressure (bar) vs. time (s). . . . . . . . . . . . .
Simulink solver settings for co-simulation model when using the updated solver settings . . . .
Simulated brake line pressures from open loop Simulink model of the EBS block using input
data from the supplier. Pressure (bar) vs. time (s). . . . . . . . . . . . . . . . . . . . . . . . . .
Final set up of co-simulation model in Simulink . . . . . . . . . . . . . . . . . . . . . . . . . . .
Simulated front left rotational wheel velocity during an event . . . . . . . . . . . . . . . . . . .
Simulated front left wheel velocity using different durations of constant velocity phase . . . . .
Measured MCP for straight line braking on flat road event . . . . . . . . . . . . . . . . . . . . .
Verification of simulated ramp up time with respect to measurement . . . . . . . . . . . . . . .
Schematic representations of the simulation procedures . . . . . . . . . . . . . . . . . . . . . . .
Validation of straight line braking on flat road event, simulated pressures and velocities with
respect to measurement . . . . . . . . . . . . . . . . . . . . . . . . . . . . . . . . . . . . . . . .
Validation of straight line braking on flat road event, simulated pressures and velocities with
respect to measurement . . . . . . . . . . . . . . . . . . . . . . . . . . . . . . . . . . . . . . . .
Validation of braking on tar patched track event, simulated pressures and velocities with respect
to measurement . . . . . . . . . . . . . . . . . . . . . . . . . . . . . . . . . . . . . . . . . . . . .
Validation of braking on tar patched track event, simulated pressures and velocities with respect
to measurement . . . . . . . . . . . . . . . . . . . . . . . . . . . . . . . . . . . . . . . . . . . . .
Validation of braking against a curb event, simulated pressures and velocities with respect to
measurement . . . . . . . . . . . . . . . . . . . . . . . . . . . . . . . . . . . . . . . . . . . . . .
Validation of braking against a curb event, simulated pressures and velocities with respect to
measurement . . . . . . . . . . . . . . . . . . . . . . . . . . . . . . . . . . . . . . . . . . . . . .
i
2
3
4
4
5
5
7
8
9
9
10
11
12
13
13
14
15
17
18
18
19
20
20
21
21
22
23
23
24
25
26
26
27
28
29
31
32
33
34
35
36
6.7
6.8
Validation of braking in corner
to measurement . . . . . . . .
Validation of braking in corner
to measurement . . . . . . . .
on flat
. . . .
on flat
. . . .
road event, simulated
. . . . . . . . . . . .
road event, simulated
. . . . . . . . . . . .
ii
pressures and
. . . . . . . .
pressures and
. . . . . . . .
velocities with
. . . . . . . .
velocities with
. . . . . . . .
respect
. . . . .
respect
. . . . .
37
38
List of Tables
3.1
3.2
3.3
3.4
3.5
4.1
4.2
5.1
Spring specifications . . . . . . . . . . . . . . . . . . . . . . . . . . . . . . . . . .
Anti-roll bar specifications . . . . . . . . . . . . . . . . . . . . . . . . . . . . . . .
Brake specifications . . . . . . . . . . . . . . . . . . . . . . . . . . . . . . . . . . .
Measurement vehicle weights . . . . . . . . . . . . . . . . . . . . . . . . . . . . .
Logged input and output signals from measurement ECU for ABS regulation . .
Parameters for mechanical brake subsystem . . . . . . . . . . . . . . . . . . . . .
Parameters used in the simplified ABS control subsystem . . . . . . . . . . . . .
Brake ramp up times from measurements of the straight line braking on flat road
iii
. . . .
. . . .
. . . .
. . . .
. . . .
. . . .
. . . .
event
.
.
.
.
.
.
.
.
.
.
.
.
.
.
.
.
.
.
.
.
.
.
.
.
.
.
.
.
.
.
.
.
7
8
8
8
10
15
16
27
1
Introduction
The following document is a master’s thesis written as a part of the Master’s program Applied Mechanics at
Chalmers University of Technology. The thesis work has been carried out during spring 2014. The student
involved was studying the fifth year of the Mechanical Engineering program. The main goal of the project was
to implement coupled simulation of two softwares, Adams/Car and Simulink, in order to improve the method
for road load simulation of brake events. Work initiator was Volvo Car Corporation (VCC), and the work has
been carried out at the VCC Durability department located in Göteborg, Sweden.
1.1
Project Background
Analytical road load simulations at VCC are performed in the multibody dynamics simulation software MSC
Adams/Car. Full vehicle models are built up from subsystems such as car body, wheel suspensions, steering,
brakes etc. Several road load simulation events used at VCC to set endurance design loads include braking with
Anti-lock Brake System (ABS) regulation. The subsystem representing the ABS system used at VCC today is a
simplified model, where a set of ABS parameters have to be adjusted/set for the different events based on physical
measurements. The parameters remain constant during simulated events which is not the case in the real vehicle.
The supplier for the Electronic Brake System (EBS), where ABS is included, develops the computer model of
the EBS in Simulink. In order to accurately simulate the effects of ABS regulation on endurance loads, a CAE
method to integrate their EBS model in the full vehicle simulations is needed.
1.2
Purpose and Objectives
The ultimate objective is to improve simulation accuracy for road load simulations of brake events by implementing the Simulink model in the Adams/Car full vehicle model, called coupled simulation and abbreviated
as co-simulation. The co-simulation results are to be validated by measurements performed at VCC’s proving
ground Hällered and with respect to the simplified ABS model used today.
1.3
Limitations
The following limitations have been identified:
• There are other possibilities than co-simulation to implement the Simulink model in the Adams model.
These alternatives were investigated at VCC in 2012 [1], and will not be investigated in this project.
• Only a subset of VCC endurance brake events will be investigated due to a limited time frame.
• The Y555 vehicle, in-house name for the Volvo V40 vehicle on the market today, was selected to be used in
this project. The vehicle was chosen due to publishing reasons and availability for physical measurements.
1.4
Major Activities
Four major activities have been planned in the project in order to achieve set objectives:
1. Set up an appropriate full vehicle model of the Volvo V40 measurement vehicle in Adams/Car to be used
throughout the project. The model should be validated by running on a straight road at constant speed.
This event will ensure that the model works as a base model.
2. Implement the simplified ABS model in the full vehicle model to be used as a reference when evaluating
results from co-simulation.
3. Perform measurements with the instrumented Volvo V40 at the proving ground. The activity also includes
determining what brake events and measurements to evaluate.
4. Implement the Simulink EBS model in the full vehicle model. Perform simulations and validate against
measurements on the physical vehicle and the simplified ABS model.
1
2
Brake System Functionality
The main goal is to enhance accuracy of the full vehicle modeling concept using co-simulation of the full
vehicle model in Adams and the ABS model in Simulink, compared to the simplified ABS model used today.
Relevant theory for brake system functionality will be explained in this chapter. Additional theory relevant for
functionality of other systems will not be discussed since those systems will remain unchanged throughout both
modeling concepts.
2.1
Brake System
The brake system is an essential mechanical system in vehicles. Different types exist but the most common
type used for service brakes in a vehicle is the disc brake, seen in Figure 2.1.
(a) Disc brake setup with significant parts included
(b) Disc brake on a real vehicle
Figure 2.1: Disc brake
A brake force is induced when the driver presses the brake pedal. The brake pedal force f is amplified by the
pedal lever ratio Rp . As seen in Figure 2.1a it means that the force going in to the brake booster is higher than
what the driver applies, fin = f Rp . The brake booster increases the force, fin → Fb , and the Master Cylinder
Pressure (PM CP ) can be determined using Equation 2.1.
PM CP =
Fb
ηMC
AMC
(2.1)
AMC is the characteristic area of the master cylinder and ηMC is the master cylinder efficiency factor. The
expression to determine generated brake torque is stated in Equation 2.2,
Mb = PM CP PV AP 2µr
(2.2)
where PV is a pressure proportioning factor, AP is the brake piston area, µ is the friction coefficient between
brake pads and brake disc, r is the effective brake pad radius and the factor 2 is since there are two brake pads
per wheel. The brake force F is determined as F = Mb /R, where R is the tire radius.
2.2
Anti-lock Brake System
Anti-lock Brake System, abbreviated as ABS from the german expression Anti Blockier System, is a mechatronic
system in vehicles to prevent the wheels from locking, i.e. rotational velocity ω = 0. ABS is included in the
Electronic Brake System (EBS) where other mechatronic systems, such as Dynamic Stability Traction Control
(DSTC), are governed.
2
The main disadvantage with locked wheels is the inability to steer effectively. Depending on the surface it may
also increase the braking distance. Angular momentum equation for one wheel, assuming other forces than
friction force generating torque on the wheel are negligible, is set up in Equation 2.3,
I ω̇ = RFf − Mb
(2.3)
where I is the mass moment of inertia, ω̇ is the rotational acceleration, R is the tire radius, Ff is the friction
force between tire and road and Mb is the generated brake torque. If no other forces generating torque are
accounted for, the rotational acceleration of the wheel will be zero if RFf = Mb . In modern vehicles sensors
located at each wheel registers the rotational velocity, Figure 2.2, with an Electronic Control Unit (ECU) for
processing of sensor signals.
Figure 2.2: Schematics over sensors located at each wheel to measure rotational veloctiy and ECU for processing
of generated signals
3
Longitudinal forces producing acceleration is often described in terms of slip [2]. Slip, S, is associated with the
contact patch velocity vr relative to road surface. The kinematics for one wheel can be seen in Figure 2.3,
Figure 2.3: Kinematics for one wheel
where vx is the longitudinal velocity at the center of the wheel, Re is the effective tire radius, and ω is the
rotational velocity. The Society of Automotive Engineers (SAE) sets standards in automotive industry. SAE’s
definition of slip can be found in Equation 2.4.
S=−
vr
vx − ωRe
=−
vx
vx
(2.4)
A free rolling wheel corresponds to vx = ωRe thus S = 0. A locked wheel corresponds to ω = 0 thus S = −1.
Equation 2.4 can also be used to determine Re by measuring vehicle velocity with free rolling wheels and the
rotational velocity. Since vr = 0 for free rolling wheels ⇒ Re = vωx . Using Equation 2.4 with appropriate
software and hardware in the vehicle, an ABS can be constructed. Since modern cars do not come with
equipment to determine vx , it is usually calculated for a free rolling wheel using the rotational velocity and
the nominal radius. The rotational velocity is measured for each wheel and in the software recalculated to a
longitudinal velocity using the nominal radius. From the velocities for the four wheels an ABS reference velocity
is calculated. The principle is displayed in Figure 2.4, together with the case for a car without ABS regulation.
Figure 2.4: ABS reference speed versus the longitudinal velocity (calculated from nominal radius and rotational
velocity) for a wheel with ABS regulation and without ABS regulation
As seen for velocity of wheel with ABS regulation, if the wheel decreases from the reference speed it is registered
as a tendency to slip and actuators regulates the pressure such that the brake moment decreases and the
rotational velocity increases. For the case without ABS regulation the wheels are soon locked thus no ability to
steer.
4
2.3
Vehicle Dynamics During Brake Events
As the project focuses on braking maneuvers it is important to understand the governing vehicle dynamics.
The fundamental equation explaining relevant vehicle dynamics during a braking maneuver is Newton’s second
law seen in Equation 2.5,
F = ma
(2.5)
where m is the mass of the object, a is acceleration vector of the object and F is the vector sum of all forces
acting on the object. In this project the object regarded is a vehicle. The vehicle is regarded as a rigid body
for simplification. Assume the vehicle has a weight distribution of 60% at the front wheels and 40% at the rear
wheels and is symmetrical with respect to Left Hand Side (LHS) and Right Hand Side (RHS). In Figure 2.5
the weight distribution at standstill is shown. The yellow-green dot marks the Centre of Gravity (CG) of the
vehicle.
Figure 2.5: Free body diagram of a vehicle at standstill
The key to translate the torque generated by the by the brake system to retardation of the vehicle is friction
between tires and road. Resulting free body diagram for a vehicle during a brake event can be seen in Figure
2.6.
Figure 2.6: Free body diagram of a vehicle during a brake event
5
Setting up the equation of angular momentum around CG results in Equation 2.6, where I is the mass moment
of inertia of the vehicle and ω̇ is the rotational acceleration. The equation is set up assuming fully developed
brake event, i.e. ω̇ = 0.
x CG : −F3 L + h(BF + BB ) + F4 (L0 − L) = I ω̇ = 0
(2.6)
h(BF + BB ) + F4 (L0 − L)
L
Using Newton’s second law in vertical direction, assuming vertical acceleration to be negligible, gives Equation
2.7.
⇒ F3 =
mg = F3 + F4
The two final expressions for the normal forces are seen in Equation 2.8 and 2.9.
L
h
F3 = mg 1 −
+
(BF + BB )
L0
L0
F4 = mg
L
h
−
(BF + BB )
L0
L0
(2.7)
(2.8)
(2.9)
Thus for braking with a vehicle with CG located a distance h from the ground with weight distribution 60/40,
i.e L = 0.4L0 , there will be an increase of the normal force at the front and decrease at the rear, so called
dynamic weight distribution. A similar procedure can be used to explain that the normal forces will increase on
the outer wheel pair in cornering events.
6
3
Physical Measurements
Physical measurements have been carried out with an instrumented Volvo V40 vehicle to be able to validate
the simulation results.
3.1
Measurement Vehicle Specifications
The measurement vehicle is a Volvo V40 with diesel engine (VED4 MP), manual gearbox (M66) and front
wheel drive, see Figure 3.1.
Figure 3.1: Measurement vehicle
The chassis setting is of type dynamic which determines the specification for dampers, coil springs and anti-roll
bars. The spring stiffnesses and anti-roll bar diameters are given in Table 3.1 and Table 3.2 respectively. The
rear anti-roll bar is solid and thus has no inner radius. Damper characteristics for front and rear dampers can
be found in Figure 3.2.
Table 3.1: Spring specifications
Front suspension
Rear suspension
Stiffness (N/mm)
28.5
30
7
Table 3.2: Anti-roll bar specifications
Front
Rear
Outer diameter (mm)
25.2
21.5
Inner diameter (mm)
4.4
-
Figure 3.2: Damper characteristics
The vehicle is equipped with 205/50 R17 Continental SportContact II tires with 2.6 bar pressure. The brake
system has 16.5” front brakes front and 15” rear brakes with specifications according to Table 3.3.
Table 3.3: Brake specifications
Front brakes
Rear brakes
Effective radius (mm)
131
121
Piston diameter (mm)
57
38
Friction coefficient µ
0.42
0.38
The vehicle weight corresponds to the VCC test load for endurance events. Dummies and sand bags are used
for loading, see Table 3.4 and Figure 3.3. The curb weight is the weight of the car with all fluids filled.
Table 3.4: Measurement vehicle weights
Curb
Test load
Front axle (kg)
945
1068
8
Rear axle (kg)
599
868
Figure 3.3: Loading using dummies with weights added inside them, and signal processing equipment between
the dummies
3.2
Measurement Vehicle Preparation
As discussed in Chapter 2, the ABS regulation depends on signals generated by transducers on the vehicle.
The mechatronic device processing the signals is called Electronic Brake System (EBS) Electronic Control Unit
(ECU). A measurement EBS ECU, with output ports to read and store signals, was installed. The installation
of the the measurement ECU can be seen in Figure 3.4.
(b) Measurement ECU mounted in the car
(a) Measurement ECU
Figure 3.4: Installation of the measurement ECU
9
The brake pressure output signals do not have sufficient resolution according to the brake test engineer involved
in the measurements. External pressure gauges with higher resolution were therefore mounted on the brake
lines, see Figure 3.5.
(a) External pressure gauge
(b) External pressure gauge mounted to the brake line
Figure 3.5: External pressure gauge
As the EBS processes data used to control other systems than the ABS, there are about 200 signals in total
processed by the EBS ECU. The signals used for ABS regulation according to the supplier, thus the signals
logged during measurements, can be seen in Table 3.5.
Table 3.5: Logged input and output signals from measurement ECU for ABS regulation
10
As discussed in Chapter 2, equipment to measure the true longitudinal vehicle velocity vx did not exist in the
vehicle. A GPS was therefore mounted on the vehicle. Also discussed in Chapter 2, a signal for ABS reference
speed exists in the vehicle and was logged during measurements.
3.3
Measurements of Brake Events
VCC’s proving ground Hällered was used when the measurements were executed. An overview of the facility
can be seen in Figure 3.6.
Figure 3.6: Overview of Hällered proving ground
The measurements were planned to cover four types of braking events:
1. Straight line braking on flat road. Four drivers were used to capture variations.
2. Braking on tar patched track (irregular road generating oscillations). Two drivers were used.
3. Braking against a curb (transient type of excitation). Brake application was planned to be initiated a
distance before the curb in order to achieve maximum pitch angle when the front wheels hit the curb.
Two drivers were used.
4. Braking in a corner on flat road. Performed in clockwise and counter clockwise direction. Event was
performed in a 30m radius turn on the verge of lateral skidding. One driver was used.
All braking events were conducted on dry tarmac (standard asphalt) surfaces. The set of events with different
types of disturbances was chosen to ensure the ability to investigate accuracy from co-simulations for a wide
range of possible brake maneuvers. Pictures of the tracks used can be seen in Figure 3.7.
11
(a) Track for plane road braking on flat road
(b) Track for braking on tar patch
(c) Track for brake against a curb
(d) Track for brake in a corner
Figure 3.7: Tracks used for measurements
Variation in measurements due to variability in driver behavior was expected. Four different drivers were used
for the straight line braking on flat road event to capture variations. All drivers were ordered to apply brake as
hard and fast as possible to ensure repeatability and comparability.
After the ABS regulation was activated in brake maneuvers, the regulation was expected to be similar regardless
of driver as long as sufficient Master Cylinder Pressure (MCP) was maintained. An important part of a brake
maneuver was therefore considered to be the time up until the first ABS regulation occurs. To be able to make
valid comparisons with simulations a physical quantity called brake pressure ramp up time was determined.
The definition is seen in Equation 3.1,
tramp = t100bar − t0bar
(3.1)
where t100bar was defined as time when MCP = 100bar and was chosen as measurements implied that regulation
started when MCP ≈ 100bar. t0bar is the last time where MCP = 0.
12
4
4.1
Modeling
Adams Full Vehicle Model
The full vehicle model has been built in MSC Adams/Car. The database structure and modeling principles can
be seen in Figure 4.1.
Figure 4.1: Database structure for MSC Adams/Car
A full vehicle model is assembled by using an assembly file, subsystem files, template files and property files. The
template sets the parametrization of the system, i.e. which hardpoints, parts and connectors to use, whereas
the subsystem specifies the properties for the system. A certain component is described by the component
model together with the corresponding property file. A subset of the included subsystems in the Adams full
vehicle model are shown in Figure 4.2.
Figure 4.2: Adams full vehicle model with a subset of included subsystems listed
A full vehicle model of the V40 test vehicle, described in Chapter 3, has been built based on an existing V40
13
full vehicle base model at VCC. For modeling in Adams, see [3] and [4]. The following updates/modeling have
been done with respect to the base model:
• New graphics for car body
• Update of chassis setting according to the test vehicle, i.e. dampers, springs and anti-roll bars
• Update of the mechanical brake subsystem according to test vehicle
• An ABS control subsystem, highlighted in Figure 4.2, has been built to enable co-simulation between
Adams and Simulink
• The model has been statically trimmed according to the test vehicle, i.e. vertical wheel loads, ride height,
and clearance to bump/rebound have been matched
4.2
Adams Mechanical Brake Subsystem
The brake subsystem, seen in Figure 4.3, has been updated to match the brake system of the test vehicle.
Figure 4.3: Adams brake subsystem
A general description of the functionality of a brake system has been explained in Chapter 2. A schematic
representation of the functionality of the Adams brake subsystem can be seen in Figure 4.4.
14
Figure 4.4: Schematic representation of the Adams mechanical brake subsystem
Figure 4.4 also shows the connection with the ABS control subsystem, where conditions determine if and how
(torque or pressure regulation) the ABS control subsystem should be used. The connection is independent of
whether the simplified ABS control subsystem or the co-simulation ABS control subsystem is used. Here pressure
regulation is used both when using the simplified ABS model and in the co-simulations. Characteristic properties
for the brake system is set in the mechanical brake subsystem. Key parameters defining the characteristics
of the mechanical brake subsystem are shown in Table 4.1, with updated values for the measurement vehicle
according to Table 3.3. Other parameters remained as set for the base model.
Table 4.1: Parameters for mechanical brake subsystem
Parameter name:
brake pedal ratio
front brake mu
front effective piston radius
front piston area
master cylinder area
master cylinder efficiency
max brake value
rear brake mu
rear effective piston radius
rear piston area
4.3
Description
Brake pedal ratio
Front brakes friction coefficient
Front brake effective piston radius
Front brakes piston area
Master cylinder area
Master cylinder effiency factor
Force applied when brake demand is 100%
Rear brakes friction coefficient
Rear brake effective piston radius
Rear brakes piston area
Value:
3.9
0.42
131.0
2551.8
506.71
0.95
441.2
0.38
121.0
1134.1
Unit:
−
−
mm
mm2
mm2
−
N
−
mm
mm2
Adams Simplified ABS Control Subsystem
The previous section showed the possibility to connect the mechanical brake subsystem to an ABS control
subsystem. A simplified ABS control subsystem has been developed at VCC and is used today for full vehicle
road load simulations. The simplified ABS control subsystem uses a set of parameters as input. The parameters
do not change during the braking event (which is not the case in the real vehicle) and have different parameter
15
values for different braking events. Which parameter set to use for the various braking events have been
validated by full vehicle measurements for different vehicles at VCC. The parameter sets to use for the braking
events have not been investigated or changed in this project. Default parameters used in the simplified ABS
control subsystem are stated in Table 4.2. See [5] for full documentation of the simplified ABS model.
Table 4.2: Parameters used in the simplified ABS control subsystem
4.4
ABS Parameter
PeakSlipFL
Units
-
Default
0.06
PeakSlipFR
PeakSlipRL
PeakSlipRR
PeakDecel
g
0.06
0.06
0.06
5.0
PeakLRdiff
-
1
SlipDump
bar
0.8
DecelDump
bar/g
0.01
absBuildRateX1
bar/s
8 · 102
absBuildRateX2
bar/s2
0
absDumpRateX1
bar/s
−5 · 103
absDumpRateX2
bar/s2
0
Description
Max front left longitudinal slip
ratio.
Max front right longitudinal slip.
Max rear left longitudinal slip
Max rear right longitudinal slip
Max allowable wheel rotational
deceleration
Maximum allowable left/right
brake pressure difference
Rate at which to demand brake
pressure dump for a given slip
error
Rate at which to demand brake
pressure dump for a given wheel
rotational deceleration error
Brake pressure build rate, linear
term for ABS control
Brake pressure build rate,
quadratic term for ABS control
Brake pressure dump rate, linear
term for ABS control
Brake pressure dump rate,
quadratic term for ABS control
Simulink EBS Model
The Electronic Brake System (EBS) in the Volvo V40 is developed by the brake system supplier. ABS is one of
several included systems in the EBS. Together with the control system mounted on the car the supplier also
delivered a Simulink model of the EBS to be able to simulate the system during the development of the vehicle
and a user manual. The model was delivered as a black box model, i.e. the algorithms included can not be
investigated. Figure 4.5 shows the interface.
16
Figure 4.5: Simulink EBS model interface
The parameters sent to the EBS model in the project were specified in Table 3.5. Key input signals are:
– Rotational velocities of all wheels
– Master cylinder pressure
– Longitudinal acceleration
– Pitch angle rate
Key output signals are the brake line pressure for each wheel. Since starting maneuvers were not investigated
the Electronic Spin Control (ESP) was set to off. Similar to the simplified ABS model, the EBS model uses a
set of parameters, delivered with the software.
The EBS model has been developed to replicate the performance of the physical EBS. The different electronic
systems in a physical vehicle have a certain start up time and are up and running when all warning lights have
gone out. Start up of the EBS takes about two seconds and the start up time was also implemented in the
EBS model, according to the supplier. If braking maneuvers simulated with the EBS model started before the
initiation time had passed, no ABS regulation existed and the wheels locked.
4.5
Simulink Co-Simulation Model
The main goal of the project is to connect the Adams full vehicle model to the Simulink EBS model. The
MSC Adams/Car software includes a toolbox, Adams/Car Mechatronics, which makes co-simulation with other
softwares possible. Training documentation designed for VCC was used as reference when the Adams model
was modified for co-simulation.
Using Adams/Car Mechatronics an ABS control system template has been created where the number of inputs
and outputs needed in the control system, what simulation type to be used and software to co-simulate with
were specified. Number of inputs and outputs correspond to the signals specified in Table 3.5, the simulation
type chosen was co-simulation and chosen software was Matlab. A subsystem corresponding to the template
was also created in order to follow the database rules in Adams/Car, Figure 4.1. A schematic overview of the
data flow can be seen in Figure 4.6.
17
Figure 4.6: Data flow schematics for the modeling in Adams/Car Mechatronics
The role of the transducer signal is to pass signal values from the model to the control system via the control
system input. The role of the actuator is to pass signal values from the control system to the model via the
control system output. Two options existed when the transducer and actuator signals were created. Either to
create them in the template where the signals arises, or to create them in the control system template and
create communicators to send information between the templates. The latter was chosen to minimize changes
in existing templates.
When the ABS control system template with subsystem and corresponding transducer/actuator signals had
been created, the signals were connected. The key feature for creating connections was the Signal manager in
Adams/Car Mechatronics. The feature can be reached when an assembly is open. When the connections had
been made, Adams solver files were created, where information about the model, the driving event and the
road is included. As the co-simulation method using Matlab was chosen before, a Matlab file is created when
writing the Adams solver files. It was used to create the Adams s-function block (adams sub) in the Simulink
model seen in Figure 4.7. The input and output ports in the Adams s-function block correspond to those input
and output signals specified when the control system template was created.
Figure 4.7: Graphics of the Simulink co-simulation model
18
The communication interval, i.e. at which time steps the Adams and Simulink block should communicate
signals, was set in the Adams block to 0.001s, corresponding to the maximum time step used by the Adams
solver and the hard coded time step for the Simulink EBS model. In the Simulink co-simulation model Simulink
leads simulation and Adams follows (Simulink is master, Adams is slave). The Simulink simulation time sets
the overall co-simulation time so it should be the same or slightly longer than the event time specified for the
Adams solver files.
The Simulink solver used is set to ode45 which is a variable time step solver. The ode45 solver is chosen since
it has been recommended by MSC Software for co-simulations. Max time step in Simulink is set to 0.001s to
coincide with the Adams solver settings. Additional parameters in Simulink were kept as default, see Figure
4.8.
Figure 4.8: Simulink solver settings
19
5
Simulation setup
5.1
Initial Results with Co-Simulation Model
When the co-simulation model had been set up, the straight line braking on flat road event was used to check
the model. Resulting velocities from the first simulation using the co-simulation model for Front Left (FL) and
Rear Left (RL) wheel together with the longitudinal velocity of the vehicle can be seen in Figure 5.1. The
rotational velocities of the wheels were recalculated to longitudinal velocities using v = ωRe where Re has been
determined from the slip equation before brakes were applied.
Figure 5.1: Straight line braking on flat road (dry tarmac). Simulated longitudinal wheel velocity FL and RL
together with longitudinal vehicle velocity.
Corresponding brake line pressures can be seen in Figure 5.2
Figure 5.2: Straight line braking on flat road (dry tarmac). Simulated brake line pressure FL and RL.
As seen in Figure 5.1 the wheel velocities are oscillating a lot. The wheel velocities often exceed the vehicle
velocity (which corresponds to wheel spinning up instead of wheel locking, i.e. positive slip) and the cosimulation model is thus not considered to work properly. The oscillations of the wheel velocities are connected
to the brake line pressure regulations (oscillating as well), seen in Figure 5.2. As the pressure drops are high
and nearly vertical they are considered non-physical and the probable cause for the spin ups of the wheels, i.e.
where the velocities of the wheels exceed the velocity of the vehicle.
20
5.1.1
Verification Adams Block
Since the initial results with the co-simulation model were considered incorrect, structured troubleshooting
was necessary. It was done by isolating and studying the Adams block and the EBS block of the closed loop
co-simulation model as separate open loop models. The first block studied was the Adams block. The brake
department at VCC runs simulations using the same Simulink EBS model with a Simulink full vehicle model
(instead of the Adams full vehicle model) and supplied input and output signals to verify the Adams block, as
seen in Figure 5.3.
Figure 5.3: Open loop Simulink model to verify the Adams block (full vehicle model)
As a different vehicle model has been used for the input data, the results were not expected to coincide, but
could indicate if the full vehicle model in Adams/Car had issues. Input brake line pressures from the brake
department can be seen in Figure 5.4. The left side pressures were also used for the right side.
Figure 5.4: Input brake line pressures for verification of the Adams block (full vehicle model)
The resulting rotational velocity for the front left wheel can be seen in Figure 5.5.
21
Figure 5.5: Simulated rotational wheel velocity FL for open loop Simulink model of the Adams block and reference
(Brake department’s simulation of Simulink EBS model with Simulink full vehicle model)
As can be seen in Figure 5.5 no oscillations are present when running open loop simulation of the Adams block.
The Adams full vehicle model is therefore concluded to give realistic results. The measured brake line pressure
was higher for front wheels than rear, thus not correlating with simulated data at brake department. Thus the
validity of the EBS model is questioned. The diverging velocities seen from t ≈ 3.5s in Figure 5.5 were not
investigated due to shift of focus to the Simulink EBS model. The simulated brake line pressure for RL wheel
is higher than for FL wheel in Figure 5.4. This is not the case for the physical measurements and is another
reason to verify the functionality of the Simulink EBS model.
22
5.1.2
Verification Simulink EBS Model
The brake system supplier was contacted for verification of the Simulink EBS model. The Simulink EBS model
used during the first co-simulation was sent to the supplier where simulations (using a generic vehicle model in
Simulink) were run for validation. Resulting brake line pressures can be seen in Figure 5.6.
Figure 5.6: Simulated brake line pressures from supplier. Pressure (bar) vs. time (s).
The brake line pressures did not resemble the results from the first co-simulation, Figure 5.2.. The EBS model
was according to the supplier developed to use the ode1 (Euler) fixed time step solver in Simulink. This solver
restriction was however not stated in the technical documentation delivered with the software. Updated solver
settings can be seen in Figure 5.7.
Figure 5.7: Simulink solver settings for co-simulation model when using the updated solver settings
23
When using the updated solver settings the oscillations in brake line pressure decreased and the pressure drops
were not as significant in terms of gradient and magnitude. The supplier also sent input and output data from
their simulation. The input and output data were used to verify the set up of the Simulink EBS model at VCC
in the same way as the Adams block (full vehicle model), i.e. by open loop simulation of the isolated block.
Results can be seen in Figure 5.8.
Figure 5.8: Simulated brake line pressures from open loop Simulink model of the EBS block using input data
from the supplier. Pressure (bar) vs. time (s).
As the output pressures could not be re-created at VCC there are still issues to solve in the set up of the
Simulink EBS model. The final step to get correct initiation of the Simulink EBS model is outlined in the next
section.
24
5.2
Final Co-Simulation Setup
Figure 5.9: Final set up of co-simulation model in Simulink
Looking at the supplier’s documentation of the Simulink EBS model for an ongoing VCC project it could
be concluded that pressure initiation is a part of the initiation procedure. To get a correct initiation of the
Simulink EBS model, the initiation should include:
• A vehicle standing still for 2s
• Master cylinder pressure for 2s
• No braking during first 6s
In the final co-simulation setup switches are added to the system to enable pressure initiation, see Figure 5.9.
The left switch in Figure 5.9 delivers a constant master cylinder pressure of 200bar for 2s, whereas the right
switch sets the output brake line pressures to zero, so that no brake line pressures are delivered to the Adams
block before the actual braking starts (6s). The simulations crashed unless the unit delay was added when the
set up with switches was used.
In the co-simulations it is desirable to be able to perform the Adams simulation starting from constant velocity
(i.e. no acceleration phase) since many of the VCC endurance events are specified as such. The events also
became shorter thus less time consuming. To mimic a 2s standstill maneuver for the EBS block (while the
Adams block is still simulating constant velocity driving), the output signals from the Adams block have been
multiplied with an Adams step function. The first two seconds the Adams step function was set to zero, and
then ramped up in 0.5s to 1. In Figure 5.10 the initiation phase (2s), the ramp up phase (0.5s), the constant
velocity phase (up to 6s) and the braking phase (starting at 6s) can be seen for a typical input signal to the
EBS model.
25
Figure 5.10: Simulated front left rotational wheel velocity during an event
The constant velocity phase was not necessary according to the supplier but was discovered to affect the results,
see Figure 5.11. The simulation results for braking started after 6s are however consistent and a brake initiation
time of 6s is therefore used for all simulations.
Figure 5.11: Simulated front left wheel velocity using different durations of constant velocity phase
26
5.3
Brake Pressure Ramp Up Time Setup
The standard brake pressure ramp up time used for endurance events at VCC has been used during the
verification of the models. The ramp up time used in simulations was thereafter adjusted with respect to
measurements. Measured master cylinder pressure for straight line braking on flat road for four different drivers
can be seen in Figure 5.12.
Figure 5.12: Measured MCP for straight line braking on flat road event
Calculated brake pressure ramp up times for all drivers using Equation 3.1 can be seen in Table 5.1.
Table 5.1: Brake ramp up times from measurements of the straight line braking on flat road event
Driver
1
1
1
2
2
2
2
3
3
3
3
4
4
4
Measurement
1
2
3
4
5
6
7
8
9
10
11
12
13
14
Ramp up time [s]
0.55
0.20
0.54
0.15
0.11
0.17
0.12
0.12
0.16
0.15
0.21
0.08
0.08
0.08
From calculated ramp up times in Table 5.1 driver 4 had the shortest ramp up time and repeated the ramp up
time in all three measurements. When validating against measurements the ramp up time used in simulations
is therefore adjusted to match driver 4. Verification of the adjusted ramp up time for simulations against
measurement number 13 is seen in Figure 5.13.
27
Figure 5.13: Verification of simulated ramp up time with respect to measurement
5.4
Simulation Procedure
When the full vehicle model in Adams and the Simulink EBS model were set up and connected using the final
co-simulation model, simulations were carried out. The following events were simulated and validated against
measurements (see Chapter 6)
1. Straight line braking on flat road
2. Braking on tar patched track
3. Braking against a curb
4. Braking in a corner on flat road
The roads have already been modeled at VCC but as the road load simulations that are performed today do
not have an initiation phase, updates of the roads were needed. As all events have been performed with 6s
constant velocity phase in Adams, the roads have been extended with a flat road section corresponding to the
distance traveled in 6s.
The solution procedure to generate results is different depending on if the simplified ABS model or the
co-simulation model is used. Schematic representations of the two solution procedures can be seen in Figure
5.14.
28
(a) Simulation procedure with Adams simplified ABS model
(b) Simulation procedure with Simulink EBS model
Figure 5.14: Schematic representations of the simulation procedures
Adams 2010 has been used for simulations using the simplified ABS model. Adams 2010 and Matlab R2009b
have been used for simulations using the co-simulation model.
29
6
Validation
For straight line braking on flat road and braking against a curb events, only results for Left Hand Side (LHS)
will be presented since the results are similar on Right Hand Side (RHS). Some differences occur since the car
is not perfectly symmetrical and the ABS regulation is independent for each wheel. For braking on tar patched
track, results from RHS will be presented since LHS wheels went off the disturbances in the simulations due to
lateral skidding. Braking in corner on flat road will be validated for clockwise driving for the outer wheels, i.e.
LHS, due to dynamic weight distribution (Chapter 2).
As was discussed in Chapter 5, measurements from driver 4 have been used for setup of the model and will
therefore also be used for validation. As there are three measurements for each event, the measurement used
when validating simulated results has been chosen based on entrance speed. The measurement closest to the
aimed entrance speed measured with the GPS is thus used for the validations.
As the measurements were started manually and thus consist of data from before brake initiation, data presented
during validation have been modified in order to make validation between different data sets possible. The
modifications have been done so that the braking maneuvers are started at approximately equal time. The
Adams calculates the rotational wheel velocity while the measurement data output is the longitudinal wheel
velocity. Rotational wheel velocities have been recalculated to longitudinal wheel velocities according to Chapter
2. No other modifications of the data have been done.
30
6.1
Straight Line Braking on Flat Road
Resulting FL brake line pressure and FL longitudinal wheel velocity for the straight line braking on flat road
event from simulations compared to the measurement can be seen in Figure 6.1.
(a) FL brake line pressure
(b) FL longitudinal wheel velocity
Figure 6.1: Validation of straight line braking on flat road event, simulated pressures and velocities with respect
to measurement
As can be seen in Figure 6.1a, the stair case shaped brake line pressure regulation from the measurement is
captured with the co-simulation but not with the simplified ABS model. The simplified ABS model is considered
to be non-physical due to instantaneous pressure drops which are not seen in the measurement. Apart from
the different shape of the regulation for the simplified ABS model, both simulation methods deliver realistic
pressure regulation with respect to the measurement, thus resulting longitudinal wheel velocities correlate
well with respect to the measurement. The simulation using the simplified ABS model is seen to regulate
pressure such that the longitudinal wheel velocity is lower than what is seen in the measurement, whereas the
co-simulation delivers a longitudinal wheel velocity that nearly coincides with the measurement.
Although both the co-simulation and the simulation using the simplified model use the same ramp up time
for the MCP, corresponding brake line pressures do not coincide as seen in Figure 6.1a. For the simplified
ABS model the build up of brake line pressure has been seen to coincide with the build up of MCP, which
31
is considered non-physical, since there will always be delays in the physical brake system. When using the
Simulink EBS model the build up of brake line pressure has been seen to be delayed with respect to the build
up of MCP and the delay is therefore considered to have been modeled in the Simulink EBS model.
Resulting RL brake line pressure and RL longitudinal wheel velocity from simulations compared to the
measurement can be seen in Figure 6.2.
(a) RL brake line pressure
(b) RL longitudinal wheel velocity
Figure 6.2: Validation of straight line braking on flat road event, simulated pressures and velocities with respect
to measurement
The pressure for the rear wheel is expected to be lower than for the front wheel due to dynamic weight
distribution. It is also seen in the measurement. The first pressure regulation for the rear wheel using the
simplified ABS model occurs at a higher pressure than what is seen in the measurement and the co-simulation.
Apart from the first regulation and the shape of the brake line pressure regulation when using the simplified
ABS model, both simulation methods deliver realistic pressure regulation with respect to the measurement. As
for the longitudinal wheel velocities, the co-simulation is nearly coinciding, whereas the simplified ABS model
simulation is at a slightly lower level. There are also more tendencies to wheel locking using the simplified ABS
model compared to what is seen in the measurement.
For the straight line braking on flat road event, the co-simulation model is considered to correlate well with the
measurement, whereas the simulation using the simplified ABS model does not correlate as good.
32
6.2
Braking on Tar Patched Track
Due to the disturbances in the tar patched track, longitudinal and vertical oscillations are generated in the
suspensions. The force equilibrium set up in Chapter 2 is thus not valid. Resulting FR brake line pressure and
FR longitudinal wheel velocity from simulations compared to the measurement can be seen in Figure 6.3.
(a) FR brake line pressure
(b) FR longitudinal wheel velocity
Figure 6.3: Validation of braking on tar patched track event, simulated pressures and velocities with respect to
measurement
The oscillations are clearly seen in Figure 6.3b before the braking starts. During the braking, more tendencies
to wheel locking are seen in the measurement for the braking on tar patched track event compared to the
measurement for the straight line braking on flat road event. The tendencies to wheel locking is captured by
both simulation methods, but the co-simulation has better correlation with the measurement. The simulation
with the simplified ABS model gives shorter time until standstill than what is seen in the measurement, whereas
the resulting time until standstill from the co-simulation correlates well with the measurement. As for the
straight line braking on flat road, the shape of the pressure regulation is better captured with the co-simulation
than the simulation using the simplified ABS model.
33
Resulting RR brake line pressure and RR longitudinal wheel velocity from simulations compared to the
measurement can be seen in Figure 6.4.
(a) RR brake line pressure
(b) RR longitudinal wheel velocity
Figure 6.4: Validation of braking on tar patched track event, simulated pressures and velocities with respect to
measurement
The pressure regulation for the rear wheel, Figure 6.4a, is captured better with the co-simulation than with the
simplified ABS regulation, although there are more and more distinct ABS regulations in the measurement
than in the co-simulation. The simulation using the simplified ABS model builds a higher pressure before
regulation than what is seen in the measurement, and the pressure drops are of a larger than what is seen in
the measurement.
As the braking on tar patched track event generates longitudinal and vertical oscillations additional factors,
such as the component models in Adams, will impact the results more than for the straight line braking on flat
road event, i.e. the influence of the vehicle model itself is higher on the validation. The road disturbances are
also expected to increase the variability in driver behavior and thus increase the spread in the measurements.
34
Based on the correlation between the co-simulation and the measurement, the co-simulation is considered to be
valid for the braking on tar patched track event. The accuracy has improved with respect to the simulation
with the simplified ABS model, since the velocities and tendencies to wheel locking nearly coincide for the
co-simulation. Some differences are inevitable due to the vehicle model, the road disturbances, driver behavior
etc.
6.3
Braking Against a Curb Event
This event is performed as braking at a certain distance before the curb. There is no instrumentation channel
in the measurement vehicle from which it can be established when the front wheels hit the curb, and thus
it is not known at what distance before the curb the brake pedal force was applied in the measurements.
The comparability between simulations and the measurement is therefore not as good as for the straight
line braking on flat road. The curb introduces forces on the wheel that will push the wheel upwards and
backwards. Resulting FL brake line pressure and FL longitudinal wheel velocity from simulations compared to
the measurement can be seen in Figure 6.5.
(a) FL brake line pressure
(b) FL longitudinal wheel velocity
Figure 6.5: Validation of braking against a curb event, simulated pressures and velocities with respect to
measurement
35
The front wheel hits the curb at about 0.5s in the simulations, seen as a spin up of the wheel. There is also
a clear tendency to spin up at 0.5s in the measurement, therefore it is considered as the time when the the
front wheels hit the curb for the measurement as well. Brake line pressure from the co-simulation follows the
measured pressure, and thus also the corresponding longitudinal wheel velocity follows the measured velocity.
The simulation with the simplified ABS model does not capture the measured longitudinal wheel velocity as
good as the co-simulation.
Resulting RL brake line pressure and RL longitudinal wheel velocity from simulations compared to the
measurement can be seen in Figure 6.6.
(a) RL brake line pressure
(b) RL longitudinal wheel velocity
Figure 6.6: Validation of braking against a curb event, simulated pressures and velocities with respect to
measurement
A similar behavior as for the front wheel is seen for the rear wheel in the measurement, where a significant
regulation due to the curb is seen Figure 6.6 (small acceleration after 0.8s, followed by the deceleration and
the pressure drop until 0.9s). The rear wheel in the co-simulation hits the curb at about 0.8, seen as a small
acceleration followed by a lock up of the wheel and and a pressure drop. When using the simplified ABS model,
the wheel hits the curb just before 1s, seen as an acceleration followed by a near lock up.
The brake line pressures from both simulations are oscillating. From animations of the simulations, it was
deducted that when the front wheels hit the curb, significant longitudinal oscillations are introduced in the rear
36
suspension. The problem with oscillations in the rear suspension is a known issue during endurance events
with disturbances, and is the probable cause for the oscillations in brake line pressures and longitudinal wheel
velocities.
Since the event is performed in terms of braking at a certain distance before the curb, it is difficult to perform
the measurements exactly according to the specification. Additional work with the measurement setup to
ensure that the braking is initiated at the correct position is therefore recommended to improve comparability
with the simulations. Further work with the vehicle model is recommended to validate the co-simulation for
the rear wheels. For the front wheels, the co-simulation is considered to correlate well to the measurement,
whereas the simulation using the simplified ABS model does not correlate as good.
6.4
Braking in Corner on Flat Road
The braking in corner on flat road event was performed at the limit velocity, i.e. at the verge of lateral skidding,
in the measurements. The same velocity is used in the simulations. The radius of the corner is, as stated in
Chapter 3, 30m. Resulting FL brake line pressure and FL longitudinal wheel velocity for the braking in corner
on flat road event from simulations compared to the measurement can be seen in Figure 6.7.
(a) FL brake line pressure
(b) FL longitudinal wheel velocity
Figure 6.7: Validation of braking in corner on flat road event, simulated pressures and velocities with respect to
measurement
37
From the simulated velocities, it can be concluded that the co-simulation corresponds better to measurements
than simulations using the simplified ABS model. There are peculiar accelerations in the longitudinal wheel
velocity from the measurements, as some occurs without a decrease in pressure. This would mean that the
friction force available is increasing. A possible reason is increased vertical tire force due to dynamic weight
distribution when pitching and rolling.
Resulting brake line pressure and longitudinal wheel velocity from simulations compared to measurements for
RL wheel can be seen in Figure 6.8.
(a) RL brake line pressure
(b) RL longitudinal wheel velocity
Figure 6.8: Validation of braking in corner on flat road event, simulated pressures and velocities with respect to
measurement
Brake line pressure (Figure 6.8a) from the co-simulation clearly corresponds better to the measurement than
the simplified ABS model, as the simplified ABS model regulates at a higher pressure than what is seen in the
measurement. The brake line pressure from the co-simulation is higher than the measurement in the middle of
the event. The correlation is however considered reasonable and is probably influenced by for example tire
modeling (the tire condition is combined longitudinal and lateral slip). From comparing the velocities and
brake line pressures for LHS, the co-simulation is considered valid for the braking in a corner on flat road event
and has better accuracy than the simulation using the simplified ABS model.
38
7
Concluding remarks & future work
The ultimate objective is to improve the simulation accuracy for road load simulations of brake events by implementing the Simulink EBS model with the Adams/Car full vehicle model by creating a co-simulation model in
Simulink. As the co-simulation model is up and running and delivers accurate results, the ultimate objective has
been achieved. Based on the results presented from co-simulations compared to simulations with the simplified
ABS model used at VCC today and measurements, the accuracy has clearly been improved for the ABS behavior
in terms of wheel velocity and brake line pressure. As the simulated brake line pressure using the co-simulation
method delivers the stair case shaped pressure regulation also seen in measurements, whereas the regulation
using the simplified ABS model does not, the correlation has been significantly improved. As the brake line
pressure regulation from the simplified ABS model has instances with vertical drops in pressure, which can not
be achieved in real events and have not been seen in measurements, co-simulation produces more realistic results.
Based on the solution procedure used during this project, the usage of a similar model verification methodology
when working with co-simulations is highly recommended to decrease the time spent on troubleshooting. Start
from verified data and use it to isolate and verify each model included in the co-simulation model by open
loop simulations. It is also important to remember not to stop the troubleshooting when realistic results
are delivered using co-simulation, but when each model can reproduce verified data. As was seen during the
project, the results when the Simulink solver settings were changed could have been regarded as realistic if no
measurements would have been available. But depending on how the initiation sequence was performed, further
improvement of the results could be retained. This can be missed if all included models are not verified.
It is critical to perform the initiation sequence of the Simulink EBS model correct, the initiation sequence is
however not specified in the documentation. The initiation has been seen to impact the results, especially in
the first part of the brake event.
Primary users of the Simulink EBS model at VCC are Brake department and Vehicle dynamics. As support from
named departments have been of great value, collaboration and continued exchange of models and knowledge
should maintain.
Co-simulations with the Simulink EBS model used in the project can currently not be run on the VCC cluster
for Adams, since the Simulink model requires Windows 32-bit but the cluster is Linux 64-bit. Future work
should also consist of setting up an automatization environment for co-simulation batch jobs.
39
References
[1] A. Wirje. Co-simulation of ABS brake system using Adams/Car Mechatronics and Simulink. Report no.
Dura-CAE-2012-150-01. Volvo Car Corporation, 2012.
[2] S. L. Miller et al. Calculating Longitudinal Wheel Slip and Tire Parameters Using GPS Velocity. 0-78036495-3/01. Department of Mechanical Engineering, Stanford University, 2001.
[3] A. Wirje. Component modelling in Adams/Car for durability road load simulations. Report no. Dura-CAE2009-001-02. Volvo Car Corporation, 2009.
[4] A. Wirje and K. Carlsson. Modeling and Simulation of Peak Load Events Using Adams - Driving Over a
Curb and Skid Against a Curb. SAE Technical Paper 2011-01-0733. SAE World Congress, Detroit, USA,
2011.
[5] K. Carlsson. Fully analytical road load simulations of VCC chassis rig test. Report no. Dura-CAE-2007091-01. Volvo Car Corporation, 2007.
40