1
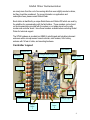
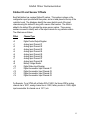
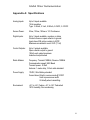
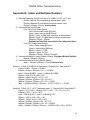
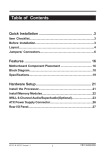
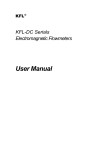
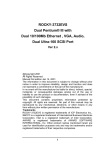
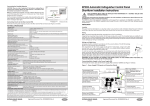
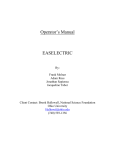
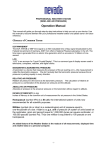
Global Water Instrumentation
SIT65 Users Manual
Internet Accessible Satellite Telemetry Solutions
Global Water
Instrumentation, Inc.
151 Graham Road
P.O. Box 9010
College Station, TX 77842-9010
Telephone : 800-876-1172
International : (979) 690-5560, Fax : (979) 690-0440
e-mail : [email protected]
Publication Number 39200712
01-850
1
Global Water Instrumentation
Introduction ...................................................................... 3
Controller Layout ............................................................. 4
Analog Inputs .................................................................... 5
Digital Inputs .................................................................... 6
Digital Control Outputs ................................................... 7
Time Stamps and Latency Time ...................................... 8
Real-Time Time Stamp .................................................... 9
Power Consumption ......................................................... 9
Battery Voltage Monitor ................................................ 10
Solar Power Systems ...................................................... 10
Station ID and Sensor Offsets ........................................ 12
Sensor Data Format........................................................ 13
Calibration Numbers ...................................................... 13
Alarms ............................................................................. 14
Installation ...................................................................... 14
Troubleshooting .............................................................. 16
Technical Support: ......................................................... 18
Appendix A: Specifications ........................................... 19
Appendix B: Adder and Multiplier Numbers ............. 20
2
Global Water Instrumentation
Introduction
Thank you for the purchase of a Global Water SIT65 Satellite Telemetry Station.
This instrument has been quality tested to provide you with accurate and reliable
operation for your remote monitoring needs. We are confident that you will find this
product to be a valuable asset to your applications. Should you require any
assistance, our technical staff will be happy to help.
The SIT65 Field Station is a cost effective and completely self-contained system for
relaying analog and digital sensor data from the most remote locations around the
world to any computer connected to the internet. Up to 8 analog inputs are available
in a number of configurations and up to 5 digital I/O channels that can be
programmed as input counters, status inputs or control outputs. A separate battery
voltage monitor is provided which can be very useful when monitoring system
performance, especially when using solar power. A VHF radio modem and antenna
is included for accessing the satellite network and two different databases are
provided for viewing your data. No complicated setup or antenna alignment is
required, just an unobstructed view of the sky.
The satellite network that the SIT65 communicates with is owned and operated by
Orbcomm. With over 30 low-earth orbiting satellites, they provide a constantly
rotating and complete coverage of the entire Earth. Ground stations spaced all
around the world receive the data from these satellites and relay it via the internet to
each of two separate databases. These databases have different appearances and
features so accounts are provided to our customers for both. They are also located
in separate geographical locations and have different IP addresses; which provides a
higher level of redundant internet access and data storage.
The system is programmed at the factory to transmit at regular intervals from every
few minutes to several hours apart depending on the application. The controller is
also able to send additional alarm transmissions when any of the digital inputs
change state. The databases allow the setting of threshold levels that will provide
email and text message notification when these thresholds are exceeded. Alarms
levels can be set for any of the analog or digital sensors.
The Orbcomm network charges fees based on the amount of data transmitted.
There are many input channel options available and when combined with different
transmission intervals, alarm transmissions and control commands; a wide range of
data charges can occur. There is always a balance between the number of sensor
channels enabled, the transmission interval, and the subscription fees. These fees
3
Global Water Instrumentation
are rarely more than the cost of recovering data from even slightly remote locations,
but they should be considered. For more information on applications and
subscription fees, please consult Global Water.
Each station is identified by a unique Radio Name and Station ID# which are used by
the satellites for communicating with the field station. These numbers can be found
on the documentation provided with the system, or on labels placed on the radio
modem and controller board. Have these numbers available when contacting Global
Water for technical support.
The SIT65 hardware is provided in a NEMA 4 rated hinged and lockable instrument
enclosure with a microprocessor based controller, radio modem, 5Ahr battery,
antenna with 16 feet of cable, and mounting hardware.
Controller Layout
Test Button
Station ID#
Configuration Jumpers
Analog 1
Radio Name
Analog 4
Data Port
Antenna
Analog 5
Battery
Analog 8
Control Outputs
Charger Input
Digital
Input
1
Digital
Input
4
4
Global Water Instrumentation
Analog Inputs
There are provisions for up to 8 analog inputs. The number of enabled inputs is
factory programmable but the inputs can be configured by the user as 0-20mA, 01mA, 0-500uA, 0-5VDC or 0-10VDC. To conserve power, the sensors connected to
these inputs are usually switched on only when readings are being taken, the sensor
warm-up time. This warm-up time is a factory programmed setting but the voltage
powering the sensors during this time is user configurable for 5V, 12V or 18V
switched; or 12 volts continuous. The sensor warm-up time setting applies to all
analog channels. Setting the configuration jumpers for 12 volt continuous operation
defeats the sensor power switch and warm-up time and powers the sensor
connected to that analog channel at 12 volts all the time.
The quick-connect input connectors are color coded for easy wiring. The ground
terminals are black, sensor power is red, and the sensor input is white. Insert the
wire into the connector and push the locking lever down. To release the wire, lift the
lever up until it locks it place.
Each channel can be configured separately using jumpers on the controller board.
Two jumpers are used for the input type and two are used to select the sensor
voltage. The jumper settings are the same for each channel. The diagram below
illustrates a 0-20mA (4-20mA) input with 12VDC switched sensor power. Disconnect
the battery when connecting sensors or changing the jumper settings.
5
Global Water Instrumentation
The jumper settings for the analog input configurations are as follows:
Input Type
0-20mA
0-1mA
0-500uA
0-10VDC
0-5VDC
Jumper 1
2a-2b
1a-2a
1a-2a
1a-2a
1a-2a
Jumper 2
3a-4a
3a-3b
4a-4b
4b-5b
3a-4a
Sensor Power
18V Switched
12V Switched
5V Switched
12V Continuous
Jumper 3
7a-8a
7a-7b
6a-7a
7a-8a
Jumper 4
9a-9b
9a-9b
9a-9b
8b-9b
Digital Inputs
Up to 3 digital inputs are available that can be configured in any combination of
accumulators (rain gauges, flow sensors) or status inputs (doors switches, power
failure). These inputs can also be programmed to initiate a transmission on any
change of state (event), a door opening or a pump turning on for example. All input
configurations are factory programmable only.
The quick-connect input connectors are color coded for easy wiring. Black terminals
are connected to ground, red terminals are connected to 12VDC continuously, and
the digital inputs are colored white. Insert the wire into the connector and push the
locking lever down. To release the wire, lift the lever up until it locks it place.
The digital inputs have 20Kohm pull-up resistors to the +5volt internal power supply
of the circuit board. This input is intended to be switched to ground only, either by a
switch contact closure or by a switching transistor. Driving these inputs with a
positive voltage other than 5volts can result in excess current drain and improper
circuit operation.
6
Global Water Instrumentation
Digital Control Outputs
There are up to two control outputs available that can be used to remotely control
pumps, valves, lights, etc. These are open-collector outputs that source current to
ground with a maximum of 100mA per channel. Driving larger loads requires a relay
or some other type of switching device. The outputs are protected from driving
inductive loads. Enabling the use of these output channels is a factory
programmable option only.
Access to the control outputs is through a 6-pin polarized connector on the controller
board. If the system is ordered with any control outputs enabled, a matching
connector is provided. This connector has three wires, red is connected to the
12VDC power supply continuously, purple is the output for channel one and white is
the output for channel two. If any high current 12 volt power supply connections are
required, they should be tied directly to the battery terminals or some other low
impedance power or ground source. High switching currents should not be sent
through the controller board.
The control outputs can be turned on and off via commands sent through one of the
databases and the current status of the outputs is shown in all transmitted data.
The radio modem must be turned on to receive the control commands from the
satellite. In cases of low battery voltage, the radio may be shut off by the power
management system to conserve power and will not receive any transmissions.
More about the power consumption is discussed in another section of this manual.
In solar powered systems, care must be taken to ensure that the system will have
sufficient power at the time access to control outputs is needed. With AC powered
systems, power failure must also be considered, although the battery may provide
backup power for several hours or more depending on configuration.
There is a variable time delay between the control command being sent and the time
that action is taken; this is called the latency time. Global Water has no over latency
time, the operation of the Orbcomm satellite network or any of the servers involved in
relaying data to or from our database. While the transmission of sensor data and
commands is reliable, it’s possible that gaps in transmissions could occur and cause
commands to be delayed or missed entirely. It is strongly recommended that the
control outputs not be used in cases where life or property could be
threatened by the failure of the outputs to operate. Global Water is not
responsible for damage caused by failures when using this feature.
7
Global Water Instrumentation
Time Stamps and Latency Time
Latency time is the total time between the SIT65 transmitting data and the data
appearing on the hosting web site. The data is held in the radio module until one of
the satellites is within range, and then sent. The information is further held at the
satellite until its data buffers are full before relaying it to one of several ground
stations where it is transferred to the Internet. These two factors contribute most of
the latency time but additional time delays can be added by the transfer of data
through servers. This latency time also applies to control and interrogation
commands being sent to the SIT65. Total delay time is not predictable but areas
with good satellite coverage and an unobstructed view of the sky can expect a total
delay of 2 to 5 minutes. Some international locations may not be as well covered
and could experience longer delays; as can installations in canyons, mountainous
areas and places surrounded by tall buildings where the view of the open sky is
partially obstructed.
The latency time will delay alarm event transmissions sent, and control commands
received, by the field station. This will result in unpredictable delays between alarm
event transmissions and the email and text message notifications sent by the
database. These delays also apply to the time between control commands being
sent and the digital outputs acting on them.
The time stamp for data readings is applied by the database at the time the data
arrives. This time stamp includes the latency time and does not indicate the actual
time the data was taken. Because the latency time varies from one transmission to
another, the interval between data readings also varies. This variation can be
several minutes. If the SIT65 is programmed to transmit once each hour, a typical
time stamp may vary from 55 minutes to 65 minutes between transmissions, which
does not create a significant error in most cases. However, the variation in time
stamps remains the same regardless of the transmission interval. For systems
transmitting at faster intervals, the variation in time stamps can produce a much
greater percentage of error. This puts a practical limit on how often the SIT65 can
transmit and still produce useful data. It is generally not recommended that the
system be programmed to transmit more than once every 15 minutes.
8
Global Water Instrumentation
Real-Time Time Stamp
In cases where the time stamp is more critical, a real-time time stamp feature can be
enabled. This is a factory programmable feature that allows the field station to
transmit the actual time the data readings were taken along with the sensor data.
Because the time stamp is transmitted through the satellite network, the amount of
data being sent increases, along with the subscription fees charged by Orbcomm.
Depending on the transmission interval and the number of enabled sensor channels,
this feature can noticeably increase these fees.
Power Consumption
The SIT65 draws different amounts of power depending on what mode it is in.
Typically, the controller draws 5mA all the time. When the radio is turned on, an
additional 75mA is used in standby and 2 amps are used for brief periods when
transmitting. The analog sensor current, including 4-20mA output currents, is drawn
during the sensor warm-up time when readings are being taken. Active digital
sensors generally are powered up all the time and draw some current. Additional
current is drawn when control outputs are powering external devices from the SIT65
power supply. Other sources my also apply. All these together form an average
current that must be handled by the power supply if the system is to operate reliably.
The controller uses a variable power management scheme that provides a balance
between current draw and available features. This process relies on the fact that the
controller has the ability to switch the modem off when not transmitting, reducing
standby power consumption from 80mA to 5mA. However, the SIT65 can also be
remotely interrogated by commands relayed through the satellite network. In order
for the request to be received, the modem must be turned on. The modem must
also be turned on if commands are sent to turn the control outputs on and off.
Two methods can be used for enabling remote interrogation of the SIT65 and
controlling the outputs. One method is to leave the modem powered on all the time.
This is a factory programmable setting only and is not recommended. The second
method is to communicate with the station at times when it is most likely to have
enough available power to keep the modem turned on. With AC power, it is likely
that the modem will be powered up all of the time. With solar powered systems,
sufficient voltage to keep the modem turned on may only be available during daylight
9
Global Water Instrumentation
hours. Systems that require access to interrogation and control should have power
systems designed according to the requirements of the system. The voltage
thresholds for the different power modes are as follows:
Battery Voltage >= 12.8 volts; Battery Charging. The battery has sufficient charge
and the radio remains on all of the time to receive commands.
12.0 volts < Battery Voltage < 12.8 volts; Low battery. Radio remains on only
when data is being transmitted.
11.3 volts < Battery Voltage < 12.0 volts; Very Low Battery. Radio remains on
only when data is being transmitted. The SV LED blinks every 5 seconds
Battery Voltage <= 11.3 volts; Dead battery. All operations stop and the radio
remains shut off until the battery recharges again.
Battery Voltage Monitor
The SIT65 offers a full time battery voltage monitor that reports system voltage
automatically with every transmission. This is a very important tool for checking the
installation, system components, solar panels and battery. It should be watched
carefully when the system is first installed and periodically from then on. Downward
trends that seem abnormal may be an indicator that something is wrong. Sudden
changes in operation may be caused by environmental changes, an electrical
problem that is drawing excessive current, or a problem with the charging system. A
slowly dropping voltage may indicate that the battery is losing its capacity and needs
to be replaced. Other signs of this are that the problem will likely occur when going
into fall or winter, and that the size of the voltage fluctuations from day to night will be
larger than normal.
Solar Power Systems
The SIT65 systems are especially suited for very remote locations where solar
power is the only option. Solar powered systems require a very good understanding
of the application and system requirements. Some systems need to be powered
reliably all of the time and some can be shut down during the entire winter.
Availability of interrogation and control, transmission intervals, alarm transmissions,
the number of sensors connected, and many other factors must be evaluated. Most
importantly; seasonal changes and geographical factors like cloud cover,
temperature, snow, dust and how high the sun is in the sky can change solar system
efficiency. No attempt is made here to discuss all of the factors in solar system
design.
10
Global Water Instrumentation
Typically, a system is designed to make sufficient power available during the worst
times of the year. In these cases, solar panels should be oriented to gather the most
light when the sun is lowest in the sky. In areas with snow, they may even be
pointed lower to allow the snow to slide off. This reduces the efficiency but overall,
will probably produce more total current. Clouds can reduce the output current of a
panel by 90% or more, even a small cloud will reduce the output to almost nothing as
it goes by. Shade is a very big factor and clouds create shade, even if it seems very
bright out.
Solar systems designed to provide enough power in the winter will produce far too
much in the summer. The result is the battery will become overcharged, reducing
the capacity to hold stored energy. When the following winter arrives, the battery
may not provide enough storage capacity to keep the system operating as it was
designed. For this reason, a charge controller should always be used. This device
senses the battery voltage and adjusts the charging current to match the demand.
The charger is selected based on the amount of solar capacity that is connected to it.
High ambient temperatures may make it necessary to over-rate the charger.
Many other factors affect the ability of a battery to maintain a charge. A solar system
that is under-rated will cause the battery to make large voltage fluctuations. Typical
batteries used in these applications are the sealed lead acid type, which slowly lose
capacity when charged and discharged by large amounts over long periods of time.
The larger the typical voltage fluctuations are, the more the effect. If the battery is
allowed to become severely overcharged or discharged, the capacity can be
significantly reduced. Low ambient temperatures also reduce available power
capacity but this capacity returns when the temperatures rise again.
The solar power output and battery capacity are the key design features. When
simplified; the capacity of the batteries is chosen based on the amount of time the
system needs to be running in the absence of sunlight, while the size of the solar
panels is chosen for their ability to recharge the batteries at the end of that time with
whatever sunlight may be available. What the worst case scenario is depends on
the application, but designing the system for that possibility is the ultimate goal.
There are too many applications to make estimates of what is typical. The total
power drain depends on transmission interval and system configuration; while
recharging limitations depend mostly on the environment. Two things to consider
are that an extra solar panel is usually cheaper than lost data, and the cost of a fresh
replacement battery is much less when someone is already in the field.
11
Global Water Instrumentation
Station ID and Sensor Offsets
Each field station has a unique Station ID number. This number is shown on the
configuration report provided with the system, and on a label placed at the top of the
controller board. The databases identify the sensor data for each of the input
channels using this station ID along with a sensor offset number. The offset is
added to the station ID to calculate the unique sensor number. These sensor
numbers are used to identify each of the input channels for any particular station.
The offsets are as follows:
Offset
Channel Type
+0
+1
+2
+3
+4
+5
+6
+7
+8
+9
+10
+11
+12
+13
+14
Digital Control Output Register
Analog Input Channel #1
Analog Input Channel #2
Analog Input Channel #3
Analog Input Channel #4
Analog Input Channel #5
Analog Input Channel #6
Analog Input Channel #7
Analog Input Channel #8
Battery Voltage Monitor
Digital Status Input Register
Digital Accumulator Input Channel #1
Digital Accumulator Input Channel #2
Digital Accumulator Input Channel #3
Digital Accumulator Input Channel #4
For Example: For a SIT65 with a Station ID# of 14200, the Sensor ID# for analog
channel one is 14201, analog channel two is 14202, battery monitor is 14209, digital
input accumulator for channel one is 14211, etc.
12
Global Water Instrumentation
Sensor Data Format
Analog sensor data is transmitted as a 10-bit number in the range of 0-1023. A
calibration equation is applied to the raw data number at the database to scale the
sensor reading in the appropriate range and engineering units. Digital input
accumulators count input events from things like tipping bucket rain gauges and flow
monitors. The accumulator is transmitted as a 11-bit number in the range of 0-2047
and calibration factors are also used to scale the data. Once reaching 2047, the
accumulator counter rolls back to zero with the next count. Digital status inputs
transmit all channel data in a single status register with 1-bit for each channel, one or
zero, true/false, on/off, open/closed, etc. Digital control outputs also have their
status transmitted in a single register with 1-bit for each output channel.
Because digital status inputs and control outputs only need one data bit to transmit
their state, these channels can be combined into one data value. The state of up to
4 status inputs are combined into one status register in binary format, channel one
shown by bit one, channel two with bit two, etc. In the same manner, the current
state of the control outputs is transmitted in a single status register. Register
contents returned as 0011 (binary) shows channels 1 and 2 High (ON), and channels
3 and 4 Low (OFF). Features in the databases allow the mapping of these bits to
text labels.
Calibration Numbers
Data values are transmitted to the hosting databases as raw data numbers. This
number is scaled to the desired engineering units (EU) by first multiplying it with a
scaling factor (Multiplier), then adding an offset (Adder). These numbers are the
coefficients in a straight line equation: EU = Adder + (Multiplier * RawData). These
calibration numbers are entered into the databases and the scaling takes place as
the data comes in. Thus, all the calibration is done at the database, independent of
the field station. There is an Excel spreadsheet calculator for finding these
calibration factors that can be downloaded from our website at globalw.com/support.
Some examples are also given in Appendix B.
Another important feature is available for calculating data. When the raw data has
been adjusted to the proper engineering units using the straight line equation
discussed above, the database calibrations allows for additional mathematical
operations. For example; these equations can be flume or weir equations for
13
Global Water Instrumentation
converting water level to flow, or can be used as best-fit polynomial approximations
for almost any non-linear sensor or function. These features are available in both
databases, but they work differently and the format won’t be detailed here.
Alarms
Alarm notifications can be sent via email or text messaging when incoming data
exceeds thresholds defined in the alarms section of the databases. Both high and
low threshold settings are available for all analog inputs to alert the user based on
water level, wind speed or any other analog parameter. Digital inputs can generate
alarm messages based on the state of these inputs, a door being opened or a power
failure for example.
Besides transmitting data at regular intervals, the SIT65 can be programmed to
transmit upon any change of state on any of the digital status or accumulator inputs.
These alarm transmissions occur with all changes of state. A door switch for
example will cause an event transmission every time the door opens and closes.
The alarm thresholds can be configured to send email and text message notification
on just a single state, like the door being opened, but the transmission will occur
every time the door is both opened and closed. In cases where the state changes
often, many extra transmissions will be sent. In some cases, this can be enough
data to affect the subscription fees.
Installation
The antenna is a 1 meter whip antenna with no alignment required; however, an
open view of the sky is. Anything blocking the view of the sky can limit or totally
prevent communication with the satellite network. Trees, buildings, overhangs, and
canyon walls are some examples of obstructions that will limit performance. If only a
partial view of the open sky is available, latency times may increase but
communication can still be possible. Satellites are constantly passing overhead and
eventually one will come into view in even a small open space. However, this can
dramatically increase the latency time and if the satellite goes by too quickly, there
may not always be enough time to transmit the data, resulting in gaps in data. The
widest possible view of the sky will always produce the best results.
The SIT65 is provided with the necessary hardware for mounting the enclosure and
antenna to a wall or on a 2” pipe. For best performance, the antenna should be
14
Global Water Instrumentation
installed so that there is nothing alongside of it all the way down to its base for at
least 4-6 feet in all directions, the further the better. This includes the mast it is
mounted on, solar panels, walls, towers, etc. Locations near sources of electrical
noise may also limit the performance, especially radio frequencies in the VHF band.
The antenna is provided with 16 feet of cable. If the antenna needs to be located
further away, additional cable can be added up to 50 feet or more. Another
important installation consideration is providing enough solar power to keep the
system operational which also requires an open and unobstructed view of the sky.
The output from the charging system can be connected directly to the battery
terminals, or to the Charger input terminals at the lower right corner of the controller
board. This charger input is protected from high current surges by a self-resetting
fuse. Slightly more power is delivered to the battery when the charger is connected
directly to the battery, but any protection is assumed to be provided by the charge
controller. If no charge controller is used, the charger input will limit high charging
currents, but may also reduce the current available for charging the battery.
Make all necessary connections, including the antenna, before connecting the
battery. The antenna connects to the N-Type connector on the bottom of the
instrumentation enclosure. Make the battery connection last by plugging the battery
cable into the controller board. Check that the red wire connects to the positive side
of the battery and the black wire is connected to the negative terminal. While the
connector is protected from reverse connection, check that it is aligned correctly
before plugging it into the controller.
A test button is provided at the top right corner of the controller for initiating a
transmission on demand. Once all connections are made, press the test button for
one second and the unit will become operational. This is indicated by the activity of
several LED’s on the controller and radio modem. The operation of these LED’s is
described in the section on Troubleshooting. If possible, being in contact with
someone who can check that valid data is being transmitted is recommended.
Transmit several times, paying attention to the sensor data and battery voltage.
15
Global Water Instrumentation
Troubleshooting
The biggest source of trouble is due to insufficient battery voltage. If the unit is
transmitting erratically or has stopped, look at the trend in battery voltage going back
a week or more. The battery voltage monitor can be a very good indicator of what
the problem may be. Sudden changes in system voltage may be caused by sudden
changes in the local environmental, an electrical problem that is drawing excessive
current, or a problem with the charging system. A slowly dropping voltage may
indicate that the battery is losing its capacity and needs to be replaced. Other signs
of this are that the problem will likely occur when going into fall or winter, and that the
size of the voltage fluctuations from day to night will be larger than normal.
Besides checking the battery voltage monitor at the database, there is another tool
for troubleshooting the system. LED’s on the controller and radio modem show the
system operation, battery level, whether data is waiting to be transmitted, and if a
satellite is being received with sufficient signal strength.
Signal
Buffer
SV: Sensor Voltage. This LED is red and has different functions depending on what
mode the system is in. During the time that the analog sensors are powered up, the
sensor warm-up time, it is lit continuously. When the system is in a standby mode
the LED blinks briefly every 15 seconds when the battery voltage is above 12.0 volts,
and every 5 seconds when the voltage is below 12.0 volts,
RV: Radio Voltage. The LED is yellow and is lit while the radio modem is turned on.
The radio is on continuously when the battery voltage is above 12.8 volts. Below this
voltage, the radio is kept on only when attempting to transmit.
TX: Transmit. This LED is green and is on when transmitting data to the radio
modem. It also blinks briefly every 15 seconds when in standby mode and the
battery is above 12.8 volts.
Signal: Signal Strength. This is a dual-color LED that is on only when power is
applied to the modem. The LED is green continuously when in standby mode and
receiving good signal strength. It blinks green every second when communicating
16
Global Water Instrumentation
and also has sufficient signal strength. It blinks orange once each second when the
received signal is too weak to communicate.
Buffer: Data Buffer. This yellow LED is lit when there is data in the data buffer
waiting to be transmitted, and off when the data buffer is empty.
Some typical problems indicated by the operation of these LED’s are:
• The SV LED blinks every 5 seconds and the modem LED’s are off. The
battery voltage is too low and the modem has been turned off. Unplug the
battery cable from the controller board and recharge or replace the battery.
• The Signal LED is green and the Buffer LED is yellow and never goes out.
There is good signal strength but data is not being transmitted, possibly due
to satellites not being in view long enough to transmit or because the
transmission is not being accepted due to incorrect Orbcomm account or
modem configurations. Contact Global Water to have the satellite activity
checked.
• The Signal LED is always red. This indicates a weak or absent signal. Check
the antenna position, coax cable and connectors. Another possibility is that
the modem has been damaged due to an electrical surge.
Data is being transmitted but one or more sensor readings are incorrect:
• Check the wiring between the sensors and the controller board.
• For analog sensors, check that the configuration jumpers are set correctly for
the sensor type and supply voltage.
• If all the sensor readings are wrong, press the test button and use a voltmeter
to measure the voltage applied to the sensors while the SV LED is lit. It
should be within 0.5 volts of the battery voltage.
• If a sensor does not appear in the database, check that it is defined correctly
in the sensor configuration window.
• The sensor appears to work but the values in the database are wrong, check
the Adder and Multiplier calibration numbers in the sensor configurations.
• Confirm with Global Water that the sensor channel was enabled when the
SIT65 was programmed at the factory. To reduce data charges, only sensor
channels that are enabled will transmit. Enabling new channels requires that
the unit be returned to the factory, this will also affect subscription fees.
17
Global Water Instrumentation
Technical Support:
Call Global Water for technical support or sales information:
Phone:
(800) 876-1172
(979) 690-5560
Fax:
(979) 690-0440
Email: [email protected].
When calling for technical support, have as much of the following information ready
as possible:
Station ID# from the documentation or the label on the controller board
Radio Name from the documentation or the label on the radio modem
Model Number of the product experiencing problems
Serial Number of that product and for the SIT65 field station
Purchase order number that the equipment was purchased on
The Global Water sales order number or invoice number
Repair instructions and/or specific problems relating to the product
Be prepared to describe the problem you are experiencing including specific details
of the application, installation, and any additional other pertinent information.
In the event that the equipment needs to be returned to the factory for any reason,
please call to obtain a RMA# (Return Material Authorization). Do not return items
without a RMA# displayed on the outside of the package. Include a written
statement describing the problems.
Send the package with shipping prepaid to our factory address. Insure your
shipment; Global Water’s warranty does not cover damage incurred during transit.
18
Global Water Instrumentation
Appendix A: Specifications
Analog Inputs:
Up to 8 inputs available
10-bit resolution
Type: 0-20mA, 0-1mA, 0-500uA, 0-5VDC, 0-10VDC
Sensor Power:
5Vsw, 12Vsw, 18Vsw or 12V Continuous
Digital Inputs:
Up to 3 inputs available, counters or status
Contact closure or open collector to ground
Inputs have 20K pull-up resistor to 5VDC
Maximum accumulator count: 2047 (11-bit)
Control Outputs:
Up to 2 outputs available
Open collector output to ground
100mA each output maximum
Inductive load protected
Radio Modem:
Frequency: Transmit-150MHz, Receive-138MHz
Communication speed: 9600 Baud
Transmit power: 5 Watt
Antenna: 1 meter whip, 16 foot cable standard
Power Supply:
12VDC, 5Ahr Battery standard
Current draw: 80mA in receive mode @12VDC
5mA in power save mode
2A briefly when transmitting
Environment:
-40° to +60° Celsius, -40° to 140° Fahrenheit
100% Humidity, Non-condensing
19
Global Water Instrumentation
Appendix B: Adder and Multiplier Numbers
1) Define the Engineering Units (EU) and span (0 to 100 MPH, -50°C to +50°C, etc).
EU(min) = Minimum EU corresponding to minimum sensor output
EU(max) = Maximum EU corresponding to maximum sensor output
EU(span) = EU(max) – EU(min), observe polarity
2) Calculate the Raw Data (RD) span.
For 4-20mA Current Output Sensors:
I(min) = Sensor output current @ EU(min)
I(max) = sensor output current @ EU(max)
RD(min) = I(min) / 4 x Raw(4mA), round down to nearest integer
RD(max) = I(max) / 19 x Raw(19mA), round up to nearest integer
RD(span) = RD(max) – RD(min)
Raw(4mA) and Raw(19mA) are provided on the Configuration Report
For 0-5VDC Voltage Output Sensors:
V(min) = Output voltage @ EU(min)
V(max) = Output voltage @ EU(max)
RD(min) = V(min) / 5 x 10²³
RD(max) = V(max) / 5 x10²³
RD(span) = RD(max) – RD(min), Round Off
3) Calculate the Multiplier for Sensor Calibration Settings. EU=Adder+(Multiplier*RawData)
Multiplier = EU(span) / RD(span)
4) Calculate the Adder for Sensor Calibration Settings.
Adder = - (Multiplier x RD(min)) + EU(min), observe polarity
Example 1: 4-20mA, 0-100 MPH Wind Speed sensor. Raw(4mA)=205, Raw(19mA)=972
EU(min) = 0 MPH EU(max) = 100 MPH
EU(span) = EU(min) – EU(max) = 100 – 0 = 100 MPH
I(min) = 4.004mA @ 0MPH I(max) = 19.884mA @ 100MPH
RD(min) = 4.004 / 4 x 205 = 205.2 ≅ 205
RD(max) = 19.884 / 19 x 972 = 1017.2 ≅ 1017
RD(span) = RD(max) - RD(min) = 1023 – 204 = 812
Multiplier = EU(span) / RD(span) = 100 / 812 = 0.123153
Adder = - (Multiplier x RD(min)) + EU(min) = - (0.123153 x 205) + 0 = - 25.2463
Example 2: 4-19mA, -50°C - +50°C Temperature sensor, °F. Raw(4mA)=204, Raw(19mA)=971
EU(min) = -50°C = -58°F, EU(max) = +50°C = 122°F, [°F = (°C x 9 / 5) + 32]
EU(span) = 122°F – (-58°F) = 180°F
I(min) = 3.846mA @ -58°F, I(max) = 18.988mA @ 122°F
RD(min) = 3.846 / 4 x 204 = 196.1 ≅ 196
RD(max) = 18.988 / 19 x 971 = 970.4 ≅ 970
RD(span) = EU(max) – EU(min) = 972 – 196 = 774
Multiplier = EU(span) / RD(span) = 180 / 774 = 0.232558
Adder = - (Multiplier x RD(min)) + EU(min) = - (0.232558 x 196) + (-58) = -103.5814
20