1
IPCheck Server Monitor
User Manual
Contents
IPCheck Server Monitor
i
User Manual
i
Using IPCheck Server Monitor
2
Welcome to IPCheck Server Monitor........................................................................................ 2
Why should you monitor your websites and servers?................................................................ 2
Overview of Features................................................................................................................. 3
Your choice of interface – Web browser based, Windows based or PocketPC based. 3
Reporting and Trend Analysis..................................................................................... 4
Sensor Alert Notification and Messaging.................................................................... 5
Built-in Webserver and SQL Database........................................................................ 5
Multi User Management.............................................................................................. 5
Offering Monitoring Services with the ISP Edition .................................................... 5
Skinning of Web Interface and Emails........................................................................ 6
Features in Detail......................................................................................................... 6
Available Sensor Types ............................................................................................... 7
Available Licensing
9
Freeware Edition........................................................................................................................ 9
Trial Edition............................................................................................................................... 9
Commercial Editions ................................................................................................................. 9
Installation
10
Installing the software on your server...................................................................................... 10
System Requirements ................................................................................................ 10
Installing IPCheck Server Monitor............................................................................ 11
Uninstalling IPCheck Server Monitor ....................................................................... 20
Choosing between Web Interface and Windows GUI
21
Using the Windows GUI
23
Installing the Windows GUI .................................................................................................... 23
Starting the Windows GUI ...................................................................................................... 23
How the Windows GUI is organized ....................................................................................... 24
Working with Groups ................................................................................................ 25
Working with Servers................................................................................................ 25
Working with Sensors ............................................................................................... 26
Recent Messages ....................................................................................................... 26
Tags ........................................................................................................................... 26
User Manual IPCheck Server Monitor 5
Contents • iii
Editing the Groups, Servers, and Sensors ................................................................................ 27
Windows GUI Options ............................................................................................................ 28
Popup Window Notification...................................................................................... 28
Taskbar Tooltip Notification ..................................................................................... 29
Play Sound Notification ............................................................................................ 29
Say Message Notification.......................................................................................... 29
Notification Options .................................................................................................. 30
Application Startup&Look&Feel .............................................................................. 30
Using the Web Interface
31
Logging into your account using the Web GUI....................................................................... 31
How the web interface is organized......................................................................................... 31
Groups ....................................................................................................................... 32
Servers ....................................................................................................................... 32
Sensors ...................................................................................................................... 32
Summary, Tags, and Recent Messages...................................................................... 32
Main Toolbar ........................................................................................................................... 33
Pop-Up Menus ......................................................................................................................... 34
User Menu ................................................................................................................. 34
Group Menu .............................................................................................................. 35
Server Menu .............................................................................................................. 36
Sensor Menu.............................................................................................................. 36
Page Refresh ............................................................................................................................ 37
Managing Groups, Servers, and Sensors
38
Managing Groups .................................................................................................................... 38
Adding and Editing Groups....................................................................................... 38
Deleting Groups ........................................................................................................ 40
Folding/Unfolding ..................................................................................................... 41
Sorting Groups .......................................................................................................... 41
Pausing/Resuming Monitoring for a Group .............................................................. 42
Exporting/Importing Groups ..................................................................................... 42
Managing Servers .................................................................................................................... 43
Adding and Editing Servers....................................................................................... 43
Deleting Servers ........................................................................................................ 45
Duplicating a Server .................................................................................................. 46
Folding/Unfolding ..................................................................................................... 46
Checking a Server’s Trace Route .............................................................................. 46
Sorting Servers .......................................................................................................... 47
Pausing/Resuming Monitoring for a Server .............................................................. 48
Managing Sensors.................................................................................................................... 48
Adding Sensors.......................................................................................................... 48
Editing Sensors.......................................................................................................... 51
Reviewing a Sensor’s Status...................................................................................... 53
Deleting Sensors........................................................................................................ 54
Sorting Sensors.......................................................................................................... 55
Pausing/Resuming Monitoring for a Sensor.............................................................. 56
Working with Tags .................................................................................................................. 56
Managing "My Account"
58
Accessing Your Account ......................................................................................................... 58
Editing Account Information..................................................................................... 59
Changing your login password .................................................................................. 60
Deleting your Account .............................................................................................. 60
iv • Contents
User Manual IPCheck Server Monitor 5
Quick View................................................................................................................ 61
Managing Notifications, Latencies and Dependencies ............................................................ 61
Definitions: Notifications, Latencies and Dependencies ........................................... 61
Situations that can trigger Notifications .................................................................... 61
How Notifications and Latencies work together ....................................................... 62
Selecting Notifications and Latencies for Groups, Servers and Sensors ................... 63
Adding and Editing Notifications.............................................................................. 63
Deleting Notifications ............................................................................................... 67
Pausing/Resuming Notifications ............................................................................... 68
Testing Notifications ................................................................................................. 68
Cross Reference of Notifications and Latencies........................................................ 68
Notification Message Tags ........................................................................................ 68
Managing Dependencies.......................................................................................................... 69
Dependency Concept................................................................................................. 69
Dependency Example................................................................................................ 70
Using Tracert to Find Out Hop IP Addresses ............................................................ 70
Group, Server and Sensor Dependencies................................................................... 70
Notification Dependencies ........................................................................................ 70
Admin Dependencies................................................................................................. 71
Managing Schedules................................................................................................................ 71
Editing Schedules ...................................................................................................... 71
Pausing/Resuming Schedules .................................................................................... 72
Deleting Schedules .................................................................................................... 72
Sensor Types in Detail
73
Information that applies to all sensors ..................................................................................... 73
Basic Sensors ........................................................................................................................... 74
PING Sensor.............................................................................................................. 74
PORT Sensor............................................................................................................. 74
HTTP Sensor ............................................................................................................. 76
Advanced Sensors.................................................................................................................... 77
HTTP Advanced Sensor ............................................................................................ 77
HTTP Transaction Sensor ......................................................................................... 79
Protocol Sensors ...................................................................................................................... 79
DNS Sensor ............................................................................................................... 79
SMTP Sensor............................................................................................................. 80
POP3 Sensor.............................................................................................................. 81
FTP Sensor ................................................................................................................ 82
Custom Sensors ....................................................................................................................... 82
HTTP Content Sensor................................................................................................ 82
Script Sensor.............................................................................................................. 83
TCP Script Sensor ..................................................................................................... 83
Custom Sensor........................................................................................................... 83
SQL Server Sensors................................................................................................................. 84
WMI Sensors ........................................................................................................................... 86
WMI Sensor Types.................................................................................................... 86
Creating a New WMI Sensor..................................................................................... 86
Basic Authentication Settings for all WMI Sensors .................................................. 87
WMI CPU Load Sensors ........................................................................................... 87
WMI Disk Space Sensors.......................................................................................... 88
WMI Memory Sensor................................................................................................ 88
WMI Service Sensor.................................................................................................. 88
WMI Query Sensors .................................................................................................. 88
Further Information on WMI Counters ..................................................................... 88
System Sensors (Local or Remote).......................................................................................... 88
User Manual IPCheck Server Monitor 5
Contents • v
Service Sensor (Local or Remote)............................................................................. 89
File Sensor (Local or Remote)................................................................................... 90
Disk Space Sensor (Local or Remote)....................................................................... 91
Event Log Sensor (Local or Remote) ........................................................................ 93
SNMP Sensors ......................................................................................................................... 94
SNMP Version 1, 2c and 3 ........................................................................................ 94
What is an “SNMP Community String”? .................................................................. 94
SNMP Sensor Types.................................................................................................. 95
Creating a New SNMP Sensor .................................................................................. 95
Common Settings for all SNMP Sensor Types ......................................................... 96
SNMP Traffic Sensor ................................................................................................ 97
SNMP Advanced Sensor ........................................................................................... 97
SNMP Helper Sensor ................................................................................................ 97
OID/MIB Library Sensors......................................................................................... 98
Technical Details for EXE and DLL Custom Sensors............................................................. 99
EXE Sensors.............................................................................................................. 99
DLL sensors .............................................................................................................. 99
Technical Details for Script and TCP Script Custom Sensors ............................................... 100
Script Basics ............................................................................................................ 100
Supported Script Grammar...................................................................................... 101
Script String Functions ............................................................................................ 102
Script Date/Time Functions..................................................................................... 104
Script Arithmetic Functions .................................................................................... 106
Other Script Functions............................................................................................. 106
Using the Control Panel
107
Control Panel System Tab ..................................................................................................... 108
Control Panel Email Tab........................................................................................................ 109
Control Panel Templates Tab ................................................................................................ 110
Control Panel Messaging Tab................................................................................................ 113
Control Panel Sensors Tab..................................................................................................... 114
Control Panel Probes Tab ...................................................................................................... 115
Control Panel Tools Tab ........................................................................................................ 116
Control Panel Administrator Tab........................................................................................... 117
Control Panel Skinning Tab................................................................................................... 118
Control Panel License Tab..................................................................................................... 119
Control Panel ISP Settings Tab ............................................................................................. 120
Server and User Account Administration
121
Web Based Administration vs. the Admin Control Panel...................................................... 121
Web Based Administration.................................................................................................... 121
Reviewing IPCheck’s System Status ..................................................................................... 122
Monitoring one IPCheck instance with another instance of IPCheck ..................... 123
Working with Multiple Users ................................................................................................ 124
Multi User Features ................................................................................................. 124
Additional Features of the ISP Edition.................................................................... 124
Editing User Accounts ........................................................................................................... 125
Adding New Users................................................................................................................. 125
Editing User Settings (ISP Edition only) ............................................................................... 126
Editing ISP Settings (ISP Edition only)................................................................................. 127
Reporting and Graphing
128
Creating Reports and Graphs................................................................................................. 128
Reviewing Messages/Errors .................................................................................................. 130
vi • Contents
User Manual IPCheck Server Monitor 5
Reviewing the Complete Activity Data ................................................................................. 131
Working with Email Reports ................................................................................................. 132
Tips&Tricks
134
Visit the Paessler Knowledgebase ......................................................................................... 134
Automatic Network Discovery .............................................................................................. 134
Working with Network Maps ................................................................................................ 135
Creating a Network Map ......................................................................................... 135
Viewing Network Maps .......................................................................................... 135
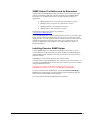
Paessler SNMP Helper........................................................................................................... 136
SNMP Helper License Options ............................................................................... 136
Fully Integrated Into Paessler's Monitoring Products.............................................. 136
SNMP Helper Freeware Edition.............................................................................. 136
SNMP Helper Pro Edition and its Extensions ......................................................... 137
Installing Paessler SNMP Helper ............................................................................ 137
Importing MIBs using Paessler MIB Importer and Converter............................................... 139
How to import an MIB File ..................................................................................... 139
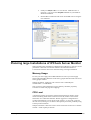
Planning large Installations of IPCheck Server Monitor ....................................................... 140
Memory Usage ........................................................................................................ 140
CPU Load ................................................................................................................ 140
Network Load.......................................................................................................... 141
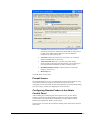
Multi Location Monitoring Using Remote Probes................................................................. 141
Setting up a Remote Probe ...................................................................................... 141
Firewall Issues......................................................................................................... 142
Configuring Remote Probes in the Admin Control Panel ....................................... 142
Publishing Current Monitoring Status ................................................................................... 143
Simple Solution: Publishing a Group of Servers ..................................................... 143
Advanced Options: Including Monitoring Information In Your Intranet or Website143
Changing the Look&Feel of IPCheck Server Monitor .......................................................... 143
Editing Web Skins................................................................................................... 144
Editing Web Templates ........................................................................................... 144
Setting Up SMS and Pager Notifications............................................................................... 145
Installing a custom SSL key .................................................................................................. 146
Appendix
148
Support................................................................................................................................... 148
Copyright ............................................................................................................................... 148
Consulting and Custom Software .......................................................................................... 148
General License Terms and Conditions ................................................................................. 148
Acknowledgements................................................................................................................ 153
User Manual IPCheck Server Monitor 5
Contents • vii
User Manual IPCheck Server Monitor 5
Using IPCheck Server Monitor • 1
Using IPCheck Server Monitor
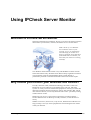
Welcome to IPCheck Server Monitor
Welcome to IPCheck Server Monitor, the easy to use and cost effective software
that monitors your networks, websites, and Internet servers for downtimes.
With a bird's eye view IPCheck
Server Monitor observes your
network, servers, or applications
and will notify you as soon as it
detects a problem. If you don't hear
from IPCheck Server Monitor you
know that your business is running
smoothly.
This Windows-based software makes it easy and affordable to detect network
and website failures early. IPCheck Server Monitor helps organizations monitor
critical network resources and immediately detect system failures or
performance problems to minimize downtimes and avoid economic impact.
Why should you monitor your websites and servers?
In today’s business world, information technology has taken a central role.
Businesses rely more and more on the Internet, their web sites, and email
systems. A variety of servers and network equipment is necessary to ensure that
data flows seamlessly between employees, offices, and customers. But, like all
other technical devices, servers may fail from time to time – potentially causing
trouble and loss of sales.
Monitoring your servers is the proactive approach to preventing disaster —
because when the flow of data stops in today’s business, so does the flow of
money.
Whether web servers, mail servers, or ftp servers, IPCheck Server Monitor can
help you keep a close eye on the equipment that is facilitating the flow of data
within your business.
2 • Using IPCheck Server Monitor
User Manual IPCheck Server Monitor 5
Overview of Features
Here are the main features of IPCheck Server Monitor:
•
Powered by Paessler's reliable IPCheck™ technology used by
many Fortune 500 companies worldwide and constantly enhanced
since 1997
•
Easy installation and usage - You can get started in less than 5
minutes!
•
Remote Management via web browser based interface or Windows
client software
•
Notifies users about outages by email, ICQ, or pager/SMS, and
more
•
Monitors many network services with its comprehensive sensor
type selection
•
Multiple location monitoring using secure Remote Probes
Your choice of interface – Web browser based,
Windows based or PocketPC based
There are three intuitive and simple user interfaces:
•
an interface that you can access using a web browser (IE6/Firefox)
•
a client software that runs on Windows and
•
a client software that runs on PocketPCs.
You can use the first two options to easily create groups of network resources
(i.e., remote office #1, web farm, etc.), individual resources within the group
(i.e., a server), and multiple sensors per resource (i.e., HTTP, Ping, and DNS).
User Manual IPCheck Server Monitor 5
Using IPCheck Server Monitor • 3
The second option to access and edit the configuration is the Windows GUI, here
shown with a list of servers and sensors.
The PocketPC interface (“Mobile GUI”) enables you to view the monitoring
status on the go (but it is “read only”, so you can’t change sensor settings).
Reporting and Trend Analysis
IPCheck Server Monitor tracks a server's response times and records the results
of all monitoring requests into its built-in database. The historic monitoring data
can later be analyzed for uptime/downtime reports and trend analysis.
4 • Using IPCheck Server Monitor
User Manual IPCheck Server Monitor 5
Sensor Alert Notification and Messaging
At the heart of this uptime monitor tool is the ability to notify the user(s) of
sensor alerts. For example, if you are monitoring a server for HTTP and IPCheck
Server Monitor is unable to connect with that server on HTTP, a notification will
be emailed to the administrator, who can then take immediate action.
Additionally, IPCheck Server Monitor Server can be configured to send
messages via SMS/Pager, network broadcast, or ICQ, play a sound file, request a
HTTP URL, or execute an external program or batch file. When using the
Windows GUI you additionally have the option to be notified using popup
windows, sounds, and even text-to-speech.
Built-in Webserver and SQL Database
The software installs with its own integrated webserver and SQL database
(Firebird SQL Server). The close integration of webserver, database, and
monitoring application provides seamless installation and management to the
user. There are no software requirements to install IPCheck on a computer, it can
be installed on all Windows NT/2000/XP/2003 operating systems, regardless of
workstation or server edition.
Multi User Management
IPCheck Server Monitor is a credential-based system and can be run for just one
single user or in multi user mode. Starting with the Multi User Edition the
administrator can create multiple user accounts. Each user can create his own
groups of servers and sensors. For example a single, centralized copy of IPCheck
Server Monitor can be used by multiple departments, each having their own
view of their sensors and reports.
Offering Monitoring Services with the ISP
Edition
The ISP Edition adds advanced user management options for ISPs who want to
offer customized monitoring services to their customers. The admin can choose
the sensor and notification types that are available for new users by default and
User Manual IPCheck Server Monitor 5
Using IPCheck Server Monitor • 5
can also edit these settings for each user individually. Also the minimum
monitoring interval, maximum number of sensors and an expiry date can be set
for each user.
Skinning of Web Interface and Emails
IPCheck Server Monitor provides the ability to edit the templates for the Web
interface (e.g. to show your company logo or to fit the Web GUI into the
Look&Feel of your Intranet) as well as email templates that are used to create
the emails sent to the users for various activities, such as notifying the
administrator of a new sensor, mailing a new password to a user, etc.
Features in Detail
IPCheck Server Monitor offers you a number of outstanding features:
Monitoring
•
Reliable server uptime/downtime monitoring using Paessler's
proven and constantly refined IPCheck™ technology which has
been used by many companies - from SOHOs to Fortune 500
companies worldwide - since 1997
•
Sensor types include PING, PORT, HTTP, HTTPS, HTTP
Advanced, HTTP Transaction, DNS, SMTP, POP3, FTP, SNMP
(Version 1, 2c and 3), WMI sensors, as well as various native
Windows system sensors and native SQL sensors for MS SQL,
MySQL and Oracle.
•
User can create his own sensor types using scripting and
programming languages
•
Can monitor devices and servers located in the Internet, in Intranets
and in VPN networks
•
With the installation of optional "Remote Probes" multiple location
monitoring can be achieved
•
Automatic Network Discovery searches for servers/devices in your
network and automatically creates sensors for the most common
protocols
•
Monitoring can be scheduled based on the time of day and the day
of week
Notifications
•
Notifications can be triggered by uptimes, downtimes, changed
webpages, or slow responses
•
Messages can be sent by email, network broadcast (net send), ICQ,
via SMS and to pagers and the Windows event log
•
An external program, batch file or HTTP URL can be triggered or a
sound file can be played
•
Notifications can be scheduled based on the time of day and the
day of week
User Interface
•
6 • Using IPCheck Server Monitor
The IPCheck server can be locally and remotely managed through
•
a web browser based interface (without installing additional
software on the client) and
•
a Windows client software (for all Windows versions)
User Manual IPCheck Server Monitor 5
•
Both interfaces can be used simultaneously
•
Current monitoring status can be published (optionally, e.g. to
show current network status in Intranets)
•
Sensors can be grouped and filtered via a flexible tagging system,
thereby simplifying the administration of long and complex sensor
lists.
Reporting and Analysis
•
Detailed up/downtime monitoring reports and graphs can be
viewed online
•
Calculates uptime/downtime percentages as well as downtimes
•
Various reporting options enable the user to perform in-depth trend
analysis
•
Reports emails can be sent to user's mailbox (automatically daily,
weekly, monthly, or on-demand)
System/Installation
•
Fast and easy installation - Get started within 5 minutes after
downloading
•
Includes a stand alone web server for local and remote access to the
monitoring data
•
Web user interface can be skinned to fit into corporate network's
look&feel
•
Runs as an "NT service" on Windows NT/2000/XP/2003 for best
reliability
•
Includes free SQL server for fast, reliable data storage
•
Offers optional export of monitoring data into CSVs or the Firebird
SQL server for custom analysis
•
"Administrator Control Panel" offers complete application
configuration.
•
Edit templates for email messages
•
Modify sensor monitoring intervals
•
Set up local and remote probes
•
Administer the webserver and database
Available Sensor Types
Since each network device (or "server") typically has several parameters and
services that should be monitored, you can set up various sensors to monitor
each and every aspect of a server (e.g. CPU load, webserver responsiveness,
SMTP responsiveness, PING time, etc.).
The sensors of this uptime monitor software not only check whether the server
actually responds at all but also offer means of validating the replies from the
server for validity.
Available sensor types include:
PING
Sends standard PING to the server/device
PORT
Checks whether the server accepts connection at the
specified port number
User Manual IPCheck Server Monitor 5
Using IPCheck Server Monitor • 7
HTTP
Simple HTTP/HTTPS request
HTTP Advanced
Advanced HTTP Sensor (features content check, proxy,
and authentication settings).
HTTP Transaction
Checks several pages in sequence (e.g. shopping cart)
DNS
Checks DNS server
SMTP
Checks SMTP server with various protocol options
POP3
Checks POP3 server with various protocol options
FTP
Checks FTP server with various protocol options
SNMP
Reads SNMP (Version 1, 2c and 3) values of the device
(supports custom OIDs, Paessler extensive OID library as
well as SNMP Helper)
SNMP Traffic
Monitors bandwidth usage of servers, routers, switches etc.
via SNMP (supports 64bit counters for SNMP V2c and 3)
FILE
Monitors a file on a local disk drive or a network share. It
checks if the file exists, the file size is in a given range or
if the file has been changed
NT Service Sensor
Any NT service on the local machine or a computer in the
network can be monitored for downtimes. Can optionally
restart the service upon failure
DISKSPACE
Monitors the free disk space of a local disk drive or a
remote network share
Event Log
Monitors entries in the Windows event log
SQL
Native monitoring for MS SQL, Oracle SQL and MySQL
servers
CUSTOM
Makes it easy to create your own custom sensors
WMI CPU Load
Monitors CPU loads of Windows systems using WMI
WMI Disk Space
Uses WMI to monitor the available disk space
WMI Service
Monitors a Windows service using WMI
WMI Memory
Enables monitoring of available memory through WMI
WMI Query
Runs custom WMI scripts to monitor any value that is
accessible by WMI
Using the CUSTOM sensors of IPCheck Server Monitor a wealth of monitoring
tasks can be performed that go far beyond the standard sensor set built into the
software.
8 • Using IPCheck Server Monitor
User Manual IPCheck Server Monitor 5
Available Licensing
There are a Freeware Edition, a Trial Edition, as well as several Commercial
Editions available.
Freeware Edition
The Freeware Edition is a good solution to get started or for private use:
•
May be used for free for personal and commercial use
•
includes one user and up to 5 sensors
•
Supports all available sensor types
•
Shortest available monitoring interval is 15 minutes
This edition runs as default after installation when no license key is entered.
Trial Edition
The Trial Edition is a great way to evaluate the product for customers who are
interested in purchasing commercial licenses. Free Trial License Keys are
available on our website at http://www.paessler.com/ipcheck/trial:
•
Offers all features of the Multi User License
•
Supports all available sensor types, any monitoring interval and up
to two users
•
Temporary License key must be requested from Paessler's website
•
Time limited for 30 days, reverts to Freeware after that
Commercial Editions
There are several different licenses of IPCheck Server Monitor available to suit
the demands of smaller as well as larger customers and organizations. To learn
more about pricing and feature matrix or to order licenses please visit:
http://www.paessler.com/order
User Manual IPCheck Server Monitor 5
Available Licensing • 9
Installation
Installing the software on your server
System Requirements
In short words: IPCheck runs under all Windows versions “NT and later”.
In a more detailed approach the system requirements for the installation and
setup of IPCheck Server Monitor include:
•
•
•
For the main server software:
•
Operating System Windows NT, 2000, XP, 2003 and Vista
•
On Windows NT 4 the latest Service Pack 6 is required
•
Note: Windows 95/98/ME are not supported for the server
For web browser access:
•
Windows 98, ME, NT4, XP, 2000, 2003 or Vista with Internet
Explorer (V6.0 or later) or Firefox 1.0
•
Or any other operating system that can run the web browser
Firefox 1.0 or later
For the Windows GUI:
•
Windows 98, ME, NT4, XP, 2000, 2003 or Vista
•
with Internet Explorer (V6.0 or later)
•
System Memory of 192 MB RAM (256 MB or more
recommended)
•
Pentium 333 MHz (800 MHz or more recommended)
•
About 50 MB of hard disk space for software installation
•
Depending on monitoring traffic, up to several hundred MB of data
storage (e.g. a sensor with 1 minute interval needs about 10 MB
storage space per month)
•
TCP/IP network
•
Local Administrator privileges to perform the installation of the
software
Other requirements
•
10 • Installation
SMTP mail server to send out email notifications (so called "relay
server")
User Manual IPCheck Server Monitor 5
•
An account at one of the supported SMS/pager services to send
SMS/pager messages
•
An ICQ account to send out ICQ notifications
Installing IPCheck Server Monitor
Installing the IPCheck Server Monitor software is similar to other Windowsbased applications. To install the application:
User Manual IPCheck Server Monitor 5
•
Insert your IPCheck Server Monitor CD into your computer or
open the installation setup routine from the ZIP file that you have
downloaded.
•
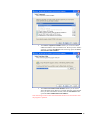
This opens the Installation Wizard Welcome Screen.
•
The IPCheck Server Monitor Information Window provides
additional information about this version of the IPCheck Server
Monitor software. Select the Next Button when ready. This opens
the License Agreement Window.
Installation • 11
12 • Installation
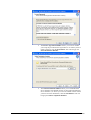
•
The License Agreement Window allows you to select whether
you accept the provided license agreement or not. When you have
made a selection, click the Next Button. This will bring up the
Select Destination Window.
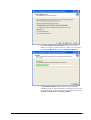
•
The Select Destination Window allows you to install IPCheck
Server Monitor at the default location (C:\Program Files\IPCheck
Server Monitor 5) or allows you to choose another location. When
you have selected a destination, click the Next Button. This will
bring up the Select Components Window.
User Manual IPCheck Server Monitor 5
•
The Select Components Window allows you to select whether
additional modules will be installed or not. When you have made a
selection, click the Next Button. This will bring up the the Select
Start Menu Folder Window.
•
The Select Start Menu Folder Window allows you to choose
where IPCheck Server Monitor’s program shortcuts will be placed.
Once you have selected the location, click the Next Button. This
opens the Select Additional Tasks Window.
Note: Selecting a location other than the default location will not interfere with
the program’s operation.
User Manual IPCheck Server Monitor 5
Installation • 13
14 • Installation
•
The Select Additional Tasks Window allows you to create a
Desktop icon and/or a Quick Launch icon. When you are finished
click the Next Button. This opens the Installation Window.
•
The Installation Window displays IPCheck Server Monitor’s
installation progress. When installation is completed, you will need
to complete a basic setup wizard. This setup wizard begins with the
Welcome to IPCheck Server Monitor Window.
User Manual IPCheck Server Monitor 5
User Manual IPCheck Server Monitor 5
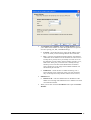
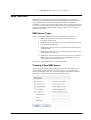
•
The IPCheck Server Monitor Window helps to guide you
through the final steps of the installation process. When you are
ready click on the Next Button. This opens the SQL Server Setup
Window.
•
The SQL Server Setup Window allows you to setup the Interbase
user account.
•
Name—the username for the account. The default installation
only has the user “sysdba”, so you must enter this account
•
Password—the password for the account. The default is
“masterkey”.
•
New Password—if you want to change the password, enter
the new password here.
•
Repeat new password—if you have typed in a new password,
you must re-type it here.
Installation • 15
•
When you are finished click the Next Button.
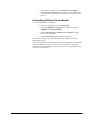
•
This opens the Creating/Updating Database Window.
•
The Creating/Updating Database Window illustrates the
progress of the Interbase setup. When it is finished click the Next
Button. This opens the Webserver Admin Account Window.
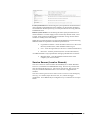
•
The Webserver Admin Account Window allows you to create the
administrative account for operation of IPCheck Server Monitor on
your server.
•
16 • Installation
•
Email—enter the email address of the administrator. This is
the “username” that you will use to log in as the administrator
•
Password—enter the password for the administrator
When you are finished click the Next Button. This opens the
IPCheck Server Monitor Server Settings Window.
User Manual IPCheck Server Monitor 5
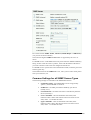
•
•
The IPCheck Server Monitor Server Settings Window allows
you to define the IP address on which the application will operate
as well as specify port, SSL, and SMTP settings
•
Local IP—use the drop-down to select the IP Address of the
server on which you are installing IPCheck Server Monitor.
•
Port—enter the port number through which the web interface
of IPCheck Server Monitor will be available for web browsers.
Usually this is port 80, but if you already run a web server on
this machine you may need to choose another port like e.g. 81,
8080. Note: If the port you choose here is already used by
another process at the time when IPCheck Server Monitor
starts, another port in the range between 8080 and 8099 will
automatically be selected!
•
Enable SSL—check this box to enable monitoring over a
Secure Sockets Layer connection (Note: port 443 for this IP
may not already be used by another software on the server!)
SMTP Server
•
•
User Manual IPCheck Server Monitor 5
Domain or IP—enter the domain name or IP address of the
SMTP server through which IPCheck Server Monitor will send
out notification emails.
When you are done click the Next Button. This opens the License
Window.
Installation • 17
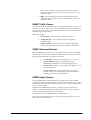
•
18 • Installation
The License Window is where you must enter the license name
and key provided to you when you purchased the software.
•
Name—the name exactly as it was given to you
•
Key—the unique key provided to you upon purchase.
•
When you are finished click the Next Button.
•
This opens the Starting Services Window.
•
Notes:
•
If you want to use the Freeware Edition of IPCheck Server
Monitor, leave the Name and Key fields blank.
•
If you want to test drive all features of IPCheck Server
Monitor please request a trial license key from
www.paessler.com/ipcheck/trial
User Manual IPCheck Server Monitor 5
User Manual IPCheck Server Monitor 5
•
The Starting Services Window starts the two IPCheck Server
Monitor services on your server. If there are no errors, click the
Next Button when it has finished. This opens the Introducing the
Admin Control Panel Window.
•
The Introducing the Admin Control Panel Window gives you
the opportunity of exploring IPCheck's settings in-depth (click
"Open Control Panel Now). Click the Next Button when you are
ready. This opens the Congratulations Window.
•
The Congratulations Window provides a summary of the Setup
Wizard you have just completed. When you are ready to finish the
installation process, click the Finish Button.
•
If there were no errors during installation, IPCheck Server Monitor
is now installed and ready to run on your server.
Installation • 19
•
If you selected a desktop icon, the IPCheck Server Monitor
Server Monitor shortcut icon will now be on your desktop. When
you are ready to use IPCheck Server Monitor simply double click
this icon
Uninstalling IPCheck Server Monitor
To uninstall IPCheck Server Monitor 5
•
From your computer go to your Control Panel.
•
Select the Add/Remove Programs option. This will open the
Add/Remove Programs Window.
•
Select the IPCheck Server Monitor Server Monitor program
from the list of programs.
•
Click the Remove button to uninstall the program.
Or select the Uninstall icon from the IPCheck Server Monitor group in the
Start|Programs menu.
After the deinstallation has finished please also deinstall the SQL server software
using the Add/Remove Software applet from the Control Panel. Also please
check IPCheck's installation directory and delete all files (e.g. the database) that
you do not want to preserve.
20 • Installation
User Manual IPCheck Server Monitor 5
Choosing between Web
Interface and Windows GUI
When accessing IPCheck Server Monitor you have the choice between the web
interface (see “Using the Web Interface”) and the Windows GUI interface (see
“Using the Windows GUI”).
The two most important differences are:
•
The web interface has fewer interactive notification options but
runs on any operating system which is able to run either Internet
Explorer 6.0 or Firefox/Mozilla - without installing any client
software
•
The Windows GUI can be used on Windows systems and offers
additional notification options. But it can not be used to change the
settings in "My Account" (e.g. schedules and notifications)
Please note that both interfaces can be used simultaneously.
There are good reasons to use both of them, please have a look at the following
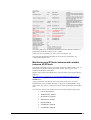
table showing the differences:
Web GUI Interface
Requirements
Required software
Required network connection
Review Features
Access the list of groups, servers, and sensors
with current status and recent activity
Sort/filter sensors using tags
Automatic screen updates every
Show monitoring status info as system tray
icon
Can be minimized to the system tray
Can be started automatically when you log
into Windows
Editing Features
Create, edit, sort, and delete groups, servers,
and sensors; scan sensors now, etc.
Pause/Unpause Sensors
Edit "My account"
User Manual IPCheck Server Monitor 5
Windows GUI Interface
Web browser (IE6,
Firefox), any operating
system
IPCheck Server Monitor's
Windows GUI software (free
download), Internet Explorer
6, Windows
98/ME/NT/XP/2000/2003
For both interfaces the client machine needs HTTP or
HTTPS access to the IPCheck Server Monitor server
Yes
Yes
Yes
60s
No
Yes
Custom: 15s or more
Yes
No
No
Yes
Yes
Yes
Yes
Yes
Yes
Yes
No
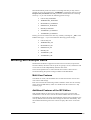
Choosing between Web Interface and Windows GUI • 21
Create, edit, and delete schedules and
notifications
Notification Features
Supports all server based notifications (email,
ICQ, etc.)
Shows an optional POP UP window upon
network status changes
Plays a sound if a sensor is DOWN
Shows an optional system tray "bubble"
windows upon network status changes
Plays a configurable sound on any status
change
Reads error messages aloud using the
TextToSpeech engine (Win XP/2003 only)
Display Messages and Errors via an RSS feed
Yes
No
Yes
Yes
No
Yes
No
No
Yes
Yes
No
Yes
No
Yes
Yes
No
22 • Choosing between Web Interface and Windows GUI
User Manual IPCheck Server Monitor 5
Using the Windows GUI
When accessing IPCheck Server Monitor you have the choice between the web
interface (see “Using the Web Interface”) and the Windows GUI interface. The
following sections explain the Windows GUI interface.
Installing the Windows GUI
If you want to use the Windows GUI to access your IPCheck Server Monitor
server you must first install the client software on your client machine.
To install the software download the IPCheck Server Monitor Windows GUI
installer from the IPCheck Server Monitor website and run the installer. A
standard Windows installation routine will help you install the software on your
machine.
Starting the Windows GUI
Using the START menu select All Programs | IPCheck Server Monitor |
IPCheck Server Monitor Windows GUI to start the program.
A dialog shows up where you have to enter your login data:
Please enter the IP address or the DNS name of the server where the server
software of IPCheck Server Monitor is running on.
User Manual IPCheck Server Monitor 5
Using the Windows GUI • 23
•
Usually this is the IP Address or DNS name of the server on which
IPCheck Server Monitor is installed, e.g. 192.168.2.2.
•
If you do not use the standard web port number 80, please add the
portnumber, e.g. 192.168.2.2:8080
•
If you have enabled the use of SSL on the server (in the Control
Panel) you can optionally select to use HTTPS encryption to
connect to the server (recommended)
Then please enter your account name (your email address) and your password.
Check the Remember Password box if you want the Windows GUI to store
your password in the registry for faster login the next time.
Check the Auto Login box if you want the Windows GUI to automatically log
into the server the next time you start the program.
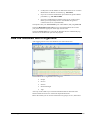
How the Windows GUI is organized
After logging into the server the Windows GUI will look like this:
The Windows GUI is organized in five categories:
•
Groups
•
Servers
•
Sensors
•
Recent Messages
•
Tags
At the top of the window you can find a standard windows menu bar and a
button toolbar for fast access of the most important functions.
Below the toolbar you can see the structured list of groups, servers, and sensors.
24 • Using the Windows GUI
User Manual IPCheck Server Monitor 5
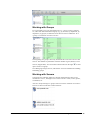
Working with Groups
It is a good idea to sort your network devices (i.e., servers, routers, switches,
etc.) into some kind of hierarchical group (e.g. by location, by department, by
importance, by project) to make the list of devices easier to administer. So a
"group" is a collection of several "servers".
The beginning of a group is shown by horizontal bars in the list of servers and
sensors. The numbers in parenthesis show the number of good, failed, or slow
sensors (if applicable). You can click the minus button on the right
up the servers of a group.
to fold
See “Managing Groups, Servers, and Sensors” for more information on adding
and editing groups.
Working with Servers
To keep the user interface simple we call each network device that is to be
monitored a "server", although it can of course also be a router, switch, printer,
workstation, etc.
"Servers" always belong to a "group" and a server has a collection of "sensors".
Servers are shown in the first column of the list:
User Manual IPCheck Server Monitor 5
Using the Windows GUI • 25
See “Managing Servers” for more information on adding and editing servers.
Working with Sensors
Since each network device (or "server") usually has several parameters or
services that should be monitored you can set up various sensors to monitor each
and every aspect of a server (e.g. CPU load, webserver responsiveness, SMTP
responsiveness, PING time, etc.) So a "server" has several "sensors" by which
you will monitor all aspects of the server.
Each sensor is shown with a color depicting its current state, e.g. DOWN, UP,
PAUSED, or OK.
See “Managing Sensors” for more information on adding and editing sensors.
Recent Messages
In the recent messages box you will always see a list of events discovered by
IPCheck Server Monitor, e.g. UP or DOWN messages.
Tags
The Tag Filter Section at the right side of the window is used to filter sensors
for certain criteria. IPCheck features a method for assigning categories (tags) to
sensors.
Usage is simple: Just check the boxes left to those tags that you want to be
displayed, in any desired combination. IPCheck then filters the sensors for those
tags, hiding those sensors that have neither of the chosen tags assigned. Tags
26 • Using the Windows GUI
User Manual IPCheck Server Monitor 5
within one group are linked by OR, tags between the groups are linked by AND.
(See "Working with Tags" for more information)
Clear Tags clears the selection of tags, thereby showing all sensors in the sensor
list again.
Editing the Groups, Servers, and Sensors
To select a group, a server, or sensor simply click on it with your left mouse
button. To edit an item, double click it.
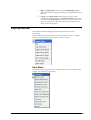
For more options right click the group's bar to access its context menu:
You can Edit, Pause, and Delete an item through this context menu.
Whenever you select Add, Edit, or Delete a dialog will pop up that shows the
exact same editing functionality as you would find in the Web interface:
Please make the desired changes and click OK to return to the Windows GUI.
Note: If the Cancel or OK buttons do not work on your computer, please install
the latest updates and fixes for Internet Explorer and turn on Javascript in the
browser.
User Manual IPCheck Server Monitor 5
Using the Windows GUI • 27
Windows GUI Options
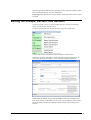
Select File|Options from the menu to set the options for the Windows GUI:
For the Refresh Interval choose a value that fits to the sensor intervals that you
use. We recommend to use the same interval here as you do for most sensors
(e.g. 60 seconds if most of your sensors work with a 60 second interval). Try to
choose a longer period to minimize the bandwidth usage. Whenever a change in
the network status is discovered by the server you have the choice between four
means of notification by the Windows GUI (also the notifications by the server
(e.g. via email or ICQ) still apply):
Popup Window Notification
The option Show PopUp will show a pop up window on your desktop that will
put itself in front of all other Windows until you either acknowledge the message
28 • Using the Windows GUI
User Manual IPCheck Server Monitor 5
or decide to go directly to the server list.
Taskbar Tooltip Notification
The option Show Taskbar Tooltip will show a popup window on the bottom
right of your screen for several seconds. It is a little less intrusive than the Popup
Window option.
Click on the box to go to the list of sensors or click the "X" to hide the box.
Play Sound Notification
If you select Play Sound the WAV sound file that you have selected in the box
on the right will be played whenever a change in the network status is
discovered.
Say Message Notification
If you enable the Say Message option on Windows XP or Windows 2003 you
can listen to the up/down notifications through your speaker. The TextToSpeech
engine, which is built into XP/20003, is used to read the message aloud. The
"Speech API English Text To Speech Engine" component is a device driver
responsible for the conversion of text into speech. It is part of the default
installation of Windows XP Pro and Windows Server 2003 (though for OEM
versions of Windows XP other languages may also be installed on your
computer). There is not much to configure about this engine, you can only select
a language from a list of available languages, no additional configuration can be
performed on languages.
To test the Text To Speech engine on your computer open the Speech icon from
Control Panel, Select the Text To Speech tab, enter a Text, and click on
Preview.
User Manual IPCheck Server Monitor 5
Using the Windows GUI • 29
Notification Options
You can choose to be notified for DOWN events only or for all status changes.
Application Startup&Look&Feel
Choose Autostart to automatically start the IPCheck Server Monitor Windows
GUI as soon as you log into your Windows Session – which is recommended.
The second option allows you to toggle the server icons in the sensor list.
30 • Using the Windows GUI
User Manual IPCheck Server Monitor 5
Using the Web Interface
When accessing IPCheck Server Monitor you have the choice between the web
interface and the Windows GUI interface (see “Using the Windows GUI”). The
following sections explain the web interface.
Logging into your account using the Web GUI
Note: the web interface of IPCheck Server Monitor is optimized for the two most
common web browsers, Internet Explorer (6.0 or later) and Firefox (1.0 or later)
and may not work fully with other browsers or older versions.
To log into the web interface please complete the following steps:
•
Please point your browser to the IP Address or DNS name of the
server on which IPCheck Server Monitor is installed, e.g.
http://192.168.2.2.
•
If you do not use the standard web port number 80, please add the
port number, e.g. http://192.168.2.2:8080
•
Note: If you use the machine IPCheck is installed on you can also
select the “IPCheck Server Monitor Web GUI” shortcut from the
“IPCheck Server Monitor” group in your start menu
•
If you have enabled the use of SSL on the server you can also use
HTTPS encryption to connect to the server (recommended). To do
this please enter “https” instead of “http”, e.g.
https://192.168.2.2:8080
•
Enter your email address (username) and password in the user
login box
•
Click Login
You will now be taken to your personal homepage with the list of groups,
servers, and sensors.
How the web interface is organized
The web interface is organized into four key categories:
User Manual IPCheck Server Monitor 5
•
Groups
•
Servers
•
Sensors
•
Notifications&Reports
Using the Web Interface • 31
Each one of these areas is created to help you navigate through IPCheck Server
Monitor and will allow you to setup, configure, and monitor devices on your
network.
Groups
It is a good idea to sort your network devices (i.e., servers, routers, switches,
etc.) into some kind of hierarchical group (e.g. by location, by department, by
importance, by project) to make the list of devices easier to administer. So a
"group" is a collection of several "servers".
For more information about editing groups and adding servers to a group, see the
“Managing Groups, Servers, and Sensors” section of the manual.
Servers
To keep the user interface simple we call each network device that is to be
monitored a "server", although it can of course also be a router, switch, printer,
workstation, etc. "Servers" always belong to a "group" and a server has a
collection of "sensors".
For more information about editing servers and adding sensors to a server see the
“Managing Sensors” section of the manual.
Sensors
Since each network device (or "server") usually has several parameters or
services that should be monitored you can set up various sensors to monitor each
and every aspect of a server (e.g. CPU load, webserver responsiveness, SMTP
responsiveness, PING time, etc.) So a "server" has several "sensors" by which
you will monitor all aspects of the server.
For more information about sensor types see “Sensor Types in Detail”. For more
information about editing sensors see the “Managing Sensors” section of the
manual.
Summary, Tags, and Recent Messages
The Sensor Summary sectiongives you a brief summary of what is happening
with the sensors you currently have configured and running.
The Tag Filter section is used to filter sensors for certain criteria. IPCheck
features a method for assigning categories (tags) to sensors.
32 • Using the Web Interface
User Manual IPCheck Server Monitor 5
Usage is simple: Just check the boxes left to those tags that you want to be
displayed, in any desired combination. IPCheck then filters the sensors for those
tags, hiding those sensors that have neither of the chosen tags assigned. Tags
within one group are linked by OR, tags between the groups are linked by AND.
(See "Working with Tags" for more information)
Clear Tags clears the selection of tags, thereby showing all sensors in the sensor
list again.The Messages/Errors and Activities sections are described in detail
under "Reviewing Messages/Error" and " Reviewing the Complete Activity
Data" later in this manual.
A notification is the way IPCheck Server Monitor alerts the administrator or an
user when a sensor discovers a problem or if a problem is solved. A notification
can be an email, a message on your mobile phone, or an ICQ message and it will
be shown on your personal homepage after logging in. Notifications can be sent
out immediately or only if the error is not solved within a specified time.
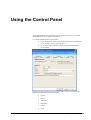
For more information on notifications see the “Managing Notifications,
Latencies and Dependencies” section of the manual.
Additionally you can create monitoring reports that show the results of the
monitoring requests historically down to each single monitoring requests,
Reports list all of the findings through the monitoring of a group/server/sensor
(i.e. as a data table or as a graphical view).
See the “Reporting and Graphing” section of the manual for additional
information.
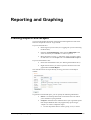
Main Toolbar
The menu toolbar can be found in the header of each webpage.
Here you can find the following links:
User Manual IPCheck Server Monitor 5
•
Home—The Home Link will always take you back to your
Account Homepage with the list of groups, servers, and sensors
•
My Account—the My Account Link will take you to the My
Account Window where you can
•
Edit your Account information
•
Change your account password
•
Set up and test notifications via email, SMS, and ICQ
•
(see “Managing "My Account"”).
•
Administration—Only visible for the admin account this link
takes you to the system administration page (See “Server and User
Account Administration”)
•
Add Group—the Add Group Link will take you to the Group
Data Window which will allow you to add a new monitoring
group (see “Managing Groups, Servers, and Sensors”).
•
Add Server—the Add Server Link will take you to the Server
Data Window which will allow you to add a new server to a group
(See “Adding and Editing Servers”).
•
Add Sensor—the Add Sensor Link will take you to the Sensor
Selection Window which will allow you to add a new sensor for a
server (See “Adding Sensors”).
Using the Web Interface • 33
•
Help—the Help Link will take you to the Help Window which
offers comprehensive support information on using IPCheck Server
Monitor.
•
Logout—the Logout Link will log you out of your account
information and take you back to the Welcome Screen. Note: Once
you select the Logout Button you will have to sign in again to see
your monitoring results. Monitoring will of course continue even
when you are not logged in.
Pop-Up Menus
The interface is built around pop-up menus that provide access to the
functionality.
These menus pop up when you place your mouse pointer over the “>” symbol
next to your account name or your groups, servers, or sensors.
User Menu
The upper-most pop-up menu is the User Menu where you access functions that
apply to your account or to all sensors.
34 • Using the Web Interface
User Manual IPCheck Server Monitor 5
Here, one has the following options:
•
Edit My Account – Automatically enters the account editing
functionality (see “Managing "My Account"”).
•
Scan All Sensors Now – Scans all configured sensors right now
without waiting for their next interval to expire.
•
Email Reports – Generates reports for the last 24 hours, last 7
days, or last 30 days and sends them to your account email address
when finished (see “Reporting”).
•
Quick View – Opens a new browser with the Quick View webpage
for your account (see”Quick View”).
•
Quick View (with Icons) – Opens a new browser with the Quick
View webpage for your account (see”Quick View”). Additionally
to the "Quick View" the Group/Server/Sensor hierarchy is depicted
with Icons.
•
Sensor Cross Reference – Shows a reference list with all
latencies, notification settings and schedules/dependencies for your
account
•
Network Auto Discovery – Scan your network for devices to
monitor (see ” Automatic Network Discovery”).
•
Add Group – Enters the Add Group menu to create new
groups(see “Managing Groups, Servers, and Sensors”).
•
Import Group – Imports a saved group (*.ini) file (see
“Exporting/Importing Groups”).
•
Sort Groups – Enters the Sort Groups function (see “Sorting
Groups ”).
•
Log Out – Logs out of IPCheck Server Monitor.
Group Menu
Placing the mouse over the “>” link of a group shows the Group Menu.
This menu allows for the following:
User Manual IPCheck Server Monitor 5
•
Edit – Enters the group editing window (See “Adding and Editing
Groups”).
•
Add Server – Enters the Add Server menu (See “Adding and
Editing Servers”).
•
View Network Map – Shows a network map of this group if one is
defined in the Windows GUI. Please see there.
Using the Web Interface • 35
•
Pause/Resume – Pauses/Resumes group monitoring (See
“Pausing/Resuming Monitoring for a Group ”).
•
Fold/Unfold – Folds/unfolds the group view (See
“Folding/Unfolding”).
•
Sort Servers – Enters the Sort Servers function (See “Sorting
Servers”).
•
Export (*.ini) – Exports the Group information as an *.ini file
(which can be imported using the Import Groups function) (see
“Exporting/Importing Groups ”).
•
Delete Group – Enters the Delete Group window (See “Deleting
Groups”).
Server Menu
Placing the mouse over the “>” link of a server brings up the Server Menu.
This menu allows for the following:
•
Edit – Enters the server editing window (See “Adding and Editing
Servers”).
•
Add Sensor – Enters the Add Sensor menu (See “Adding
Sensors”).
•
Traceroute – Performs a traceroute of the server (See “Checking a
Server’s Trace Route”).
•
Pause/Resume – Pauses/Resumes monitoring for the sensors of
this server (See “Pausing/Resuming Monitoring for a Sensor”).
•
Fold/Unfold – Folds/unfolds the server view for the sensors of this
server (See “Folding/Unfolding”).
•
Sort Sensors – Enters the Sort Sensors function to change the
order of the sensors of this server (See “Sorting Sensors”).
•
Duplicate Server – Generates a copy of the server with all its
sensors but using another server name and address (See
“Duplicating a Server”).
•
Delete Server – Enters the Delete Server window (See “Deleting
Servers”).
Sensor Menu
Placing the mouse over the “>” link of a sensor pops up the Sensor Menu.
36 • Using the Web Interface
User Manual IPCheck Server Monitor 5
This menu allows for the following:
•
Edit – Enters the sensor editing window (see “Editing Sensors”).
•
Scan Sensor Now – Automatically scans the selected sensor
without waiting for the sensor’s monitoring interval to expire.
•
Graph (Last 48 Hours) – Generates a graph report of the last 48
hours’ activity (see “Reporting”).
•
Graph (Last 10 Days) – Generates a graph report of the last 10
days’ activity (see “Reporting”).
•
Graph (Last 30 Days) – Generates a graph report of the last 30
days’ activity (see “Reporting”).
•
Info & Custom Graph – Enters the Detailed Sensor Info window
(see “Reporting”)
•
Pause/Resume – Pauses/Resumes monitoring the specific sensor
(see “Pausing/Resuming Monitoring for a Sensor”).
•
Delete Sensor – Enters the Delete Sensor window (see “Deleting
Sensors”).
Page Refresh
By default – after login - the main page with the list of servers and sensors will
refresh automatically every 60 seconds.
The Refresh link allows you to manually refresh the screen on demand. You
will find the Refresh Button at the top of the IPCheck Server Monitor web
interface screen.
User Manual IPCheck Server Monitor 5
Using the Web Interface • 37
Managing Groups, Servers, and
Sensors
Managing Groups
It is a good idea to sort your network devices (i.e., servers, routers, switches,
etc.) into some kind of hierarchical group (e.g. by location, by department, by
importance, by project) to make the list of devices easier to administer. So a
"group" is a collection of several "servers".
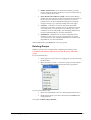
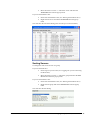
Adding and Editing Groups
Adding and editing a group can be accomplished by completing the following
steps: If you use the Web GUI:
•
Please log into your account (see “Logging into your account using
the Web GUI”)
•
To add a new group select the Add Group option from the menu
toolbar at the top of the page or click the Add New Group link
from your account popup menu.
•
To Edit a group click the
Group icon on the left or click
Edit on the right of the group that you would like to edit.
If you use the Windows GUI:
•
Please start the Windows GUI (see “Starting the Windows GUI”)
•
To add a new group choose the Add|Group item from the main
menu
•
To edit a group double click the group’s name
This opens the Group Data Window.
38 • Managing Groups, Servers, and Sensors
User Manual IPCheck Server Monitor 5
User Manual IPCheck Server Monitor 5
•
Name—enter the name of the group
•
Comments—enter a description of the group
•
Status—use the drop-down menu to set the group to
•
Active
•
Paused (this pauses the monitoring for all servers and sensors
of this group)
•
Dependency—You can pause all sensors of this group if a sensor
of another group is not UP. Choose the dependency sensor from the
dropdown list. Do not choose a sensor from the current group and
avoid circular dependencies. Use with caution. See “Managing
Dependencies”.
•
Schedule – allows you to select a schedule defined under My
Account (See “Managing Schedules”). From the drop-down menu
you can select from the defined schedules.
•
Publish Group – Check this if you want to make the group visible
to other people without having to enter a password. This will
activate the public URL. After checking/unchecking this checkbox,
please press OK. This feature can be useful to provide uptime
information about your network to the employees via a link from
the Intranet.
•
Public URL – This is the URL activated by the Publish Group
option. This URL can be accessed by anyone and provides concise,
read-only information regarding the group’s status. This option is
only accessible if the Publish Group checkbox is marked and the
group is active. This URL changes every time that the Publish
Group checkbox is activated / deactivated for security reasons.
When no changes take place, the URL remains the same.
Managing Groups, Servers, and Sensors • 39
•
Enable Alarm Sound – If you enable this checkbox your web
browser will play an alarm sound once every 60 seconds whenever
a sensor of this group is down.
•
Show Recent Sensor History Graphs – Recent Sensor History
Graphs show the results for the last 300 requests for each sensor in
the list of servers and sensors. This is a great way to discover
problems! You can show and hide these graphs for each group
using this setting (e.g. to speed up loading of the main page)
•
Latencies - "Latencies" are used to defer notifications after
warnings or errors have occurred. You can set latencies on group,
server and sensor level. The latencies for warnings, errors and
escalations can be set individually. See “Managing Notifications,
Latencies and Dependencies” for more information.
•
Notifications - "Notifications" are used to send alarms when
warnings or errors occur. You can set notifications for groups,
servers and sensors. See “Managing Notifications, Latencies and
Dependencies” for more information.
When finished, select the OK Button to save your group.
Deleting Groups
Deleting a group can be accomplished by completing the following steps:
CAUTION: This will also delete all servers and all sensors within this
group!
If you use the Web GUI:
•
Please log into your account (see “Logging into your account using
the Web GUI”)
•
Move the mouse over the “>” link of the group you want to delete
and select the Delete Group function from the pop-up menu
If you use the Windows GUI:
•
Please start the Windows GUI (see “Starting the Windows GUI”)
•
Right click the group you want to delete and choose Delete from
the popup menu
This opens the Delete Object Window.
40 • Managing Groups, Servers, and Sensors
User Manual IPCheck Server Monitor 5
Select the OK Button to delete the group or select the Cancel Button to return
to your account homepage.
Folding/Unfolding
The Fold and Unfold button from the pop-up menu allows you to change the
way IPCheck Server Monitor displays the servers and sensors underneath the
group. This can be useful to minimize the length of the list when a large number
of servers and sensors are being monitored
Folded
Unfolded
Sorting Groups
To change the order of the groups:
If you use the Web GUI:
•
Please log into your account (see “Logging into your account using
the Web GUI”)
•
Move the mouse over the “>” link of your account (at the top of the
server list) and select the Sort Groups item from the pop-up menu.
If you use the Windows GUI:
•
Please start the Windows GUI (see “Starting the Windows GUI”)
•
Choose My Account|Sort Groups from the main menu
This will show the Sort dialog:
User Manual IPCheck Server Monitor 5
Managing Groups, Servers, and Sensors • 41
To change the order, select an item and use the Move Up and Move Down
buttons to move it.
Pausing/Resuming Monitoring for a Group
To start or stop the monitoring of all servers and sensors of a group (e.g. when
some network maintenance is scheduled):
If you use the Web GUI:
•
Please log into your account (see “Logging into your account using
the Web GUI”)
•
To pause/resume monitoring move the mouse over the “>” link of
the group and select the
menu.
button from the pop-up
If you use the Windows GUI:
•
Please start the Windows GUI (see “Starting the Windows GUI”)
•
Right click the group and choose Pause/Resume from the popup
menu
Exporting/Importing Groups
You can export and import the server/sensor settings of a group. This can be
helpful to move these settings from one IPCheck Server Monitor account to
another or to make bulk changes to all your sensors.
The file format is a plain INI file which can be edited using any standard text
editor.
To export a group, choose the “Export Group” link from the group’s popup
menu. Your browser will then download the INI file with the settings.
To import the group choose “Import Group” from the account popup menu and
point the browser to the file on your local disk.
Note: This feature should only be used by experienced users!
42 • Managing Groups, Servers, and Sensors
User Manual IPCheck Server Monitor 5
Managing Servers
To keep the user interface simple we call each network device that is to be
monitored a "server", although it can of course also be a router, switch, printer,
workstation, etc. "Servers" always belong to a "group" and a server has a
collection of "sensors".
Adding and Editing Servers
To add or edit a server
If you use the Web GUI:
•
Please log into your account (see “Logging into your account using
the Web GUI”)
•
To add a new server: From the Account Homepage
•
link at the top of the page or
•
Select the
•
Move the mouse over the “>” link of the group you want to
add the server to and select the Add Server function from the
pop-up menu
To edit a server From the Account Homepage
•
Select Edit for the server you want to edit
•
Or click the
Server icon of the server you want to edit
If you use the Windows GUI:
•
Please start the Windows GUI (see “Starting the Windows GUI”)
•
To add a new server
•
•
Choose Add|New Server from the main menu or
•
Right click the group for the new server and choose Add
Server from the popup menu
To edit a server double click the server’s name
This opens the Server Data Window.
User Manual IPCheck Server Monitor 5
Managing Groups, Servers, and Sensors • 43
•
Associated Group—use the drop-down menu to select a group to
which to add this server
•
Name—the name of the server
•
Comments—a description of the server
•
Status—use the drop-down menu to select the status of the server
•
Active
•
Paused (sensors will not be monitored)
•
Dependency—You can pause all sensors of this server if a sensor
of another server is not UP. Choose the dependency sensor from
the dropdown list. Do not choose a sensor of the current server and
avoid circular dependencies. Use with caution. See “Managing
Dependencies”.
•
Schedule – allows you to select a schedule defined under My
Account (See “Managing Schedules”). From the drop-down menu
you can select from the defined schedules.
44 • Managing Groups, Servers, and Sensors
User Manual IPCheck Server Monitor 5
•
Server Data
•
DNS Name (or IP Address)—enter the DNS name or IP
Address of the server to be monitored (it is recommended to
enter a DNS name, this way with each check the correct DNS
resolution of this name will also be checked automatically)
•
Location—enter a descriptive name of the server location
•
Icon—select an icon to represent the server
•
Latencies - "Latencies" are used to defer notifications after
warnings or errors have occurred. You can set latencies on group,
server and sensor level. The latencies for warnings, errors and
escalations can be set individually. Choose “Use Group Settings” if
you want this server to use the latency settings of the associated
group or choose the latencies for this server individually. See
“Managing Notifications, Latencies and Dependencies” for more
information.
•
Notifications - "Notifications" are used to send alarms when
warnings or errors occur. You can set notifications for groups,
servers and sensors. Choose “Use Group Settings” if you want this
server to use the notifications of the associated group or choose the
notifications for this server individually. See “Managing
Notifications, Latencies and Dependencies” for more information.
When you have filled out all of the appropriate information click the OK Button
to save your server.
Deleting Servers
To delete a server
CAUTION: This will also delete all sensors configured for this server!
If you use the Web GUI:
•
Please log into your account (see “Logging into your account using
the Web GUI”)
•
Move the mouse over the “>” link of the server you want to delete
and select the Delete Server function from the pop-up menu
next to the group that you would like to delete.
If you use the Windows GUI:
User Manual IPCheck Server Monitor 5
•
Please start the Windows GUI (see “Starting the Windows GUI”)
•
Right click the server you want to delete and choose Delete from
the popup menu
Managing Groups, Servers, and Sensors • 45
This opens the Delete Object Window.
Click the OK Button to confirm the server deletion
Click the Cancel Button if you decide not to delete the server and return to the
account homepage
Duplicating a Server
To build a list of several servers that have very similar monitoring settings you
can use the duplicate server feature.
First you set up one server with all sensors, then you duplicate it for each similar
server. During duplication the original server’s name is replaced with the other
servers’ names.
If you use the Web GUI:
•
Please log into your account (see “Logging into your account using
the Web GUI”)
•
Move the mouse over the “>” link of the server and select the
Duplicate Server item from the pop-up menu.
If you use the Windows GUI:
•
Please start the Windows GUI (see “Starting the Windows GUI”)
•
Right click the server and choose Duplicate Server from the
popup menu
This will show the duplicate server dialog:
Please enter the name and IP Address of the new server, then click OK!
Folding/Unfolding
The Folding/Unfolding action for servers works exactly the same as for Groups.
For more information about how to Fold/Unfold groups, see
“Folding/Unfolding”.
Checking a Server’s Trace Route
To check the trace route between the IPCheck Server Monitor server and a
server that you are monitoring:
If you use the Web GUI:
•
46 • Managing Groups, Servers, and Sensors
Please log into your account (see “Logging into your account using
the Web GUI”)
User Manual IPCheck Server Monitor 5
•
Move the mouse over the “>” link of the server and select the
Traceroute item from the pop-up menu.
If you use the Windows GUI:
•
Please start the Windows GUI (see “Starting the Windows GUI”)
•
Right click the server and choose Traceroute from the popup
menu
This will show the Traceroute dialog (this can take up to several minutes!):
Sorting Servers
To change the order of the servers of a group:
If you use the Web GUI:
•
Please log into your account (see “Logging into your account using
the Web GUI”)
•
Move the mouse over the “>” link of the group and select the Sort
Servers item from the pop-up menu.
If you use the Windows GUI:
•
Please start the Windows GUI (see “Starting the Windows GUI”)
•
Right click the group and choose Sort Servers from the popup
menu
This will show the Sort dialog:
User Manual IPCheck Server Monitor 5
Managing Groups, Servers, and Sensors • 47
To change the order, select an item and use the Move Up and Move Down
buttons to move it.
Pausing/Resuming Monitoring for a Server
To start or stop the monitoring of a server:
If you use the Web GUI:
•
Please log into your account (see “Logging into your account using
the Web GUI”)
•
To pause/resume monitoring move the mouse over the “>” link of
the server and select the
menu.
button from the pop-up
If you use the Windows GUI:
•
Please start the Windows GUI (see “Starting the Windows
GUI”)
•
Right click the server and choose Pause/Resume from the
popup menu
Managing Sensors
Since each network device (or "server") usually has several parameters or
services that should be monitored you can set up various sensors to monitor each
and every aspect of a server (e.g. web server responsiveness, SMTP
responsiveness, PING time, etc.). So a "server" has several "sensors" by which
you will monitor all aspects of the server.
See the “Sensor Types in Detail” section for more information on the various
sensor types.
Adding Sensors
To add a sensor:
If you use the Web GUI:
•
Please log into your account (see “Logging into your account using
the Web GUI”)
•
From the Account Homepage
•
Select the
link at the top of the page.
•
Move the mouse over the “>” link of the server you want to
add the sensor to and select the Add Sensor function from the
pop-up menu
If you use the Windows GUI:
•
Please start the Windows GUI (see “Starting the Windows GUI”)
•
To add a new sensor
•
Choose Add|New Sensor from the main menu or
•
Right click the server for the new sensor and choose Add
Sensor from the popup menu
This opens the Sensor Selection Window.
48 • Managing Groups, Servers, and Sensors
User Manual IPCheck Server Monitor 5
•
The first step in adding a sensor is to select the type of sensor you
would like to use by clicking the appropriate radio button.
•
If there are more than one probe configured on the IPCheck server
you can also select which probe should be used to create the sensor.
•
See the “Sensor Types in Detail” section for more information on
the individual sensor types.
•
Once you have made your selection click on the OK Button to
continue adding the sensor. This opens the Sensor Details
Window.
Note: The options of the sensor details differ depending on the sensor type. See
the “Sensor Types in Detail” section for more information on the individual
sensor options.
User Manual IPCheck Server Monitor 5
Managing Groups, Servers, and Sensors • 49
The following properties are shown for all sensor types:
•
Associated Server—use the drop-down menu to select a server to
which to attach this sensor
•
Name—enter a descriptive name for the sensor
•
Comments—enter a description for the sensor (i.e., what it does or
when it will check)
•
Status—use the drop-down to set the status of the sensor. Options
include
•
50 • Managing Groups, Servers, and Sensors
•
Active
•
Paused (disables monitoring for this sensor)
Dependency—You can pause this sensor if a sensor of another
server is not UP. Choose the dependency sensor from the
dropdown list. Do not choose the current sensor itself and avoid
circular dependencies. Use with caution. See “Managing
Dependencies”.
User Manual IPCheck Server Monitor 5
•
Schedule – allows you to select a schedule defined under My
Account (See “Managing Schedules”). From the drop-down menu
you can select from the defined schedules.
•
Interval—use the drop-down to select an available interval.
•
Warning level—specify a time (in seconds) when the response
time of the sensor should generate a warning notification. If you
have the On Warning Notification set to active, this will
determine when the notification is sent.
•
Timeout—specify a time (in seconds) when the sensor should stop
trying to accomplish its objective and send a failure notification
•
Latencies - "Latencies" are used to defer notifications after
warnings or errors have occurred. You can set latencies on group,
server and sensor level. The latencies for warnings, errors and
escalations can be set individually. Choose “Use Group Settings” if
you want this server to use the latency settings of the associated
group or choose the latencies for this server individually. See
“Managing Notifications, Latencies and Dependencies” for more
information.
•
Notifications - "Notifications" are used to send alarms when
warnings or errors occur. You can set notifications for groups,
servers and sensors. Choose “Use Group Settings” if you want this
server to use the notifications of the associated group or choose the
notifications for this server individually. See “Managing
Notifications, Latencies and Dependencies” for more information.
Click the OK Button when finished adding the sensor.
Editing Sensors
Editing a sensor can be accomplished by completing the following steps:
To start or stop the monitoring of a group or server:
If you use the Web GUI:
•
Please log into your account (see “Logging into your account using
the Web GUI”)
•
From the Account Homepage select Edit for the server you want
to edit
If you use the Windows GUI:
•
Please start the Windows GUI (see “Starting the Windows GUI”)
•
Double click the sensors’s name
This opens the Sensor Data Window
Note: The options of the sensor details differ depending on the sensor type. See
the “Sensor Types in Detail” section for more information on the individual
sensor options.
User Manual IPCheck Server Monitor 5
Managing Groups, Servers, and Sensors • 51
The following properties are shown for all sensor types:
•
Associated Server—use the drop-down menu to select a server to
which to attach this sensor
•
Name—enter a descriptive name for the sensor
•
Comments—enter a description for the sensor (i.e., what it does or
when it will check)
•
Status—use the drop-down to set the status of the sensor. Options
include
52 • Managing Groups, Servers, and Sensors
•
Active
•
Paused (disables monitoring for this sensor)
User Manual IPCheck Server Monitor 5
•
Dependency—You can pause this sensor if a sensor of another
server is not UP. Choose the dependency sensor from the
dropdown list. Do not choose the current sensor itself and avoid
circular dependencies. Use with caution. See “Managing
Dependencies”.
•
Schedule – allows you to select a schedule defined under My
Account (See “Managing Schedules”). From the drop-down menu
you can select from the defined schedules.
•
Probe – If the admin has set up more than one remote probe you
can select one or more probes from the list to monitor a server or
service from various locations (see “Multi Location Monitoring
Using Remote Probes”).
•
Interval—use the drop-down to select an available interval.
•
Warning level—specify a time (in seconds) when the response
time of the sensor should generate a warning notification. If you
have the On Warning Notification set to active, this will
determine when the notification is sent.
•
Timeout—specify a time (in seconds) when the sensor should stop
trying to accomplish its objective and send a failure notification
•
Latencies - "Latencies" are used to defer notifications after
warnings or errors have occurred. You can set latencies on group,
server and sensor level. The latencies for warnings, errors and
escalations can be set individually. Choose “Use Group Settings” if
you want this server to use the latency settings of the associated
group or choose the latencies for this server individually. See
“Managing Notifications, Latencies and Dependencies” for more
information.
•
Notifications - "Notifications" are used to send alarms when
warnings or errors occur. You can set notifications for groups,
servers and sensors. Choose “Use Group Settings” if you want this
server to use the notifications of the associated group or choose the
notifications for this server individually. See “Managing
Notifications, Latencies and Dependencies” for more information.
Click the OK Button when finished adding the sensor.
Reviewing a Sensor’s Status
To review the status and recent history for a sensor:
If you use the Web GUI:
•
Please log into your account (see “Logging into your account using
the Web GUI”)
•
From the Account Homepage select click the Minigraph of the
sensor for which you would like to create a report or
•
Move the mouse over the “>” link of the sensor and select the
Info&Custom Graph link.
If you use the Windows GUI:
•
Please start the Windows GUI (see “Starting the Windows GUI”)
•
Right click the sensor Custom Report
This will open the Detailed Sensor Info Window:
User Manual IPCheck Server Monitor 5
Managing Groups, Servers, and Sensors • 53
•
Server name, Server group, Server Location, Server
Comments: As entered during configuration
•
Sensor name, Sensor type: As entered during configuration
•
Last Check: The date and time of the last request sent to this
sensor
•
Last Good: The date and time of the last successful request
sent to this sensor
•
Last Request Result: The result of the last request sent to this
sensor
•
Last Request time: The request time of the last request sent to
this sensor
•
Report Date: The date and time this report was created on
•
Sensor History: This Graph shows the results of the last 300
requests to this sensor
At the bottom of this page you can create a custom report for this sensor (see
“Creating Reports and Graphs”)
Deleting Sensors
Deleting a sensor can be accomplished by completing the following steps:
If you use the Web GUI:
•
Please log into your account (see “Logging into your account using
the Web GUI”)
•
Move the mouse over the “>” link of the server you want to delete
and select the Delete Sensor function from the pop-up menu
54 • Managing Groups, Servers, and Sensors
User Manual IPCheck Server Monitor 5
next to the group that you would like to delete.
If you use the Windows GUI:
•
Please start the Windows GUI (see “Starting the Windows GUI”)
•
Right click the sensor you want to delete and choose Delete from
the popup menu
This opens the Delete Object Window.
Click the OK Button to delete the sensor
Click the Cancel Button if you do not want to delete the sensor. This will then
take you back to the Account Homepage.
Sorting Sensors
To change the order of the sensors of a server:
If you use the Web GUI:
•
Please log into your account (see “Logging into your account using
the Web GUI”)
•
Move the mouse over the “>” link of the server and select the Sort
Sensors item from the pop-up menu.
If you use the Windows GUI:
•
Please start the Windows GUI (see “Starting the Windows GUI”)
•
Right click the server and choose Sort Sensors from the popup
menu
This will show the Sort dialog:
User Manual IPCheck Server Monitor 5
Managing Groups, Servers, and Sensors • 55
To change the order, select an item and use the Move Up and Move Down
buttons to move it.
Pausing/Resuming Monitoring for a Sensor
To start or stop monitoring of a sensor:
If you use the Web GUI:
•
Please log into your account (see “Logging into your account using
the Web GUI”)
•
To pause/resume monitoring move the mouse over the “>” link of
the sensor and select the
menu.
button from the pop-up
If you use the Windows GUI:
•
Please start the Windows GUI (see “Starting the Windows
GUI”)
•
Right click the sensor and choose Pause/Resume from the
popup menu
Working with Tags
In order to filter sensors for certain criteria, IPCheck features a method for
assigning categories to sensors.
A tag is a keyword or descriptive term associated with a sensor as means of
classification. Tags will especially help you if you have a large number of
sensors.
After sorting sensors into groups the method of tagging is a second way to
categorize your sensors. For example you can group the sensors in your
sensorlist by device (“Switch 1”, “Switch 2” and “Switch 3”).
Tags are created by the user (you can enter any number of tags for one or more
sensors) and automatically created by IPCheck (e.g. the tag “OK” for a sensor
that works fine or “Error” for a sensor that shows an error),
E.g. you can associate the tag “mywebsites” to all sensors that monitor your
websites. Now you can click on “mywebsites” in the taglist and IPCheck will
only show the sensors which are associated with this tag.
Tagging allows for multiple "browseable paths" through the items which can
quickly and easily be altered with minimal effort and planning.
Tags come in three different flavors:
•
56 • Managing Groups, Servers, and Sensors
State tags: These built-in tags are assigned automatically by
IPCheck depending on the state of the sensor. There are the
User Manual IPCheck Server Monitor 5
following state tags: UP, DOWN, WARNING, PAUSED. You are
not able to edit this list of tags.
•
Type tags: These built-in tags are assigned automatically by
IPCheck depending on the sensor types that you actually use. Type
tags correspond to the actual used set of sensors types. You are not
able to edit this list of tags.
•
Custom tags: For each sensor you may define one or more tags (a
comma separated list of tag words) which will automatically show
up in the interface.
Usage is simple: Just check the boxes left to those tags that you want to be
displayed, in any desired combination. IPCheck then filters the sensors for those
tags, hiding those sensors that have neither of the chosen tags assigned. Tag
selections within one group are linked by OR, selections between groups are
linked by AND.
Example: if you check "UP" in the State group and "PING" and "HTTP" in the
Type group, IPCheck shows all sensors that are UP and are either PING or
HTTP sensors. Sensors that are down or are neither Ping nor Http sensors are
hidden from the list of sensors.
Note: changing custom tags in the Edit Sensor windows might not immediately
be reflected properly in the taglist, a manual refresh may be necessary after
editing.
User Manual IPCheck Server Monitor 5
Managing Groups, Servers, and Sensors • 57
Managing "My Account"
Accessing Your Account
If you use the Web GUI:
•
Please log into your account (see “Logging into your account using
the Web GUI”)
•
Click the My Account Link from the menu toolbar at the top of the
page
If you use the Windows GUI:
•
Please start the Windows GUI (see “Starting the Windows GUI”)
•
Choose the Edit|My Account item from the main menu
This will open the My Account Window.
Here you can
58 • Managing "My Account"
•
Edit your account settings (email, address, latencies etc.) (See
“Editing Account Information”)
•
Change your password (See “Changing your login password”)
User Manual IPCheck Server Monitor 5
•
Access the Administration page (See “Server and User Account
Administration”)
•
Delete your account (See “Deleting your Account”)
•
Manage your Notifications (see “Managing Notifications,
Latencies and Dependencies”) and Schedules (See “Managing
Schedules”).
Editing Account Information
To edit your account data please choose Edit Account from your “My Account”
page (See “Accessing Your Account”).
This will show the User Data window:
User Manual IPCheck Server Monitor 5
•
The settings are:Email/Login name—this is your login name for
IPCheck Server Monitor. This can only be changed by the admin.
•
Password—the password associated with the email/login name.
•
Contact Address: For all user accounts except the main admin
account you can enter/edit the following contact data:
•
First Name—the account holder’s first name
•
Last Name—the account holder’s last name
•
Company—the account holder’s company
•
Street—the account holder’s street address
•
Zip—the account holder’s zip code
•
City—the account holder’s city
Managing "My Account" • 59
•
Country—the account holder’s country
•
State—the account holder’s state
•
Phone—the account holder’s phone
•
Fax—the account holder’s fax
•
Timezone—the account holder’s time zone
•
Report Schedule—use the drop-down menu to select a frequency
of report generation which will be sent to your email account
periodically
•
Share my Monitoring Results - This feature makes it possible to
share your monitoring results with other users that have an account
on this IPCheck installation. If you enable this checkbox your
account will be visible on the "My Account" pages of all other
users. Other users can then access your monitoring results, but they
only have read-only access (i.e. they can not change your
groups/servers/sensors etc.)
If the current account is the Admin account you will also see the Admin
Dependencies section (see “Managing Dependencies”).
Click the OK Button when finished
Changing your login password
To change your login password please choose Change Password from your
“My Account” page (See “Accessing Your Account”).
This will open the Password Change Window.
•
Old password—enter old password
•
New password—enter the new password
•
Retype new password—re-enter the new password for verification
purposes
When finished click the OK Button. Afterwards you must re-login with your
new password!
Deleting your Account
If you do not want to continue using IPCheck Server Monitor, you can close
your account by choosing “Delete My Account” from your “My Account” page
(See “Accessing Your Account”).
60 • Managing "My Account"
User Manual IPCheck Server Monitor 5
Quick View
As an alternative to the default graphical sensor list there is a “mini HTML”
version which is e.g. suitable for mobile devices.
To find out your URL choose “Quick View” from your “My Account” page (See
“Accessing Your Account”).
Note: If you want to offer public read-only access to your monitoring data check
out the Publish Group option on the group settings page.
Managing Notifications, Latencies and Dependencies
Definitions: Notifications, Latencies and
Dependencies
Whenever IPCheck Server Monitor discoveres a slow or failing sensor
“notifications” are used to send out alarms. Each user can define an unlimited
number of notifications on the “My Account” page.
IPCheck Server Monitor supports the following types of communication
channels: Email, Pager, SMS messaging, ICQ notification, Execute Program
(EXE file/batch file), Network Broadcast (NET SEND), Play a soundfile, HTTP
Request, Local logging, Windows event log entries. And there are additional
options if you use the Windows GUI (see “Windows GUI Options”)
“Latencies” are used to defer a notifications for a specified time, e.g. to give a
server or service the chance to recover from failure.
Using “dependencies” you can pause the monitoring of sensors or the sending
of notifications based on the status of another sensor to avoid false alarms and
incorrect recording of downtimes.
Situations that can trigger Notifications
IPCheck Server Monitor distinguishes between 3 status types for a sensor:
•
OK (Green) means up and running
•
WARNING (Yellow) means one request has failed or the request
time was above the warning threshold
•
DOWN (Red) means at least 2 requests have failed or were above
the timeout threshold
There are five situations that can trigger a notification:
User Manual IPCheck Server Monitor 5
•
On Error: This notification is triggered if a server goes down and is
not available anymore (e.g. the sensor cannot connect to a service
and runs into timeouts). The associated color is red.
•
On Warning: Slow requests or user defined thresholds can trigger a
warning notification. In this case a sensor is shown in yellow color
•
On OK: If a sensor’s status changes from Error/DOWN or Warning
to the UP status this notification is triggered (e.g. to let you know
that a server is UP again)
•
On Escalation: If a sensor has a DOWN state for a longer time you
can trigger this additional notification. Most users let IPCheck
Server Monitor send out the first ERROR notification to a smaller
team and then – if the problem is not solved e.g. in 5 minutes – a
larger distribution list is notified using the escalation notification.
Managing "My Account" • 61
•
On Change: Some sensors are able to monitor a service or file for
changes in the content (e.g. the HTTP Advanced sensor can
discover changes in a webpage). If such a change is discovered
IPCheck will trigger a change notification
To avoid receiving too many notifications for only very short failures or delays
you can set so-called latencies. When latencies are set (a value in seconds) a
notification is only sent if the failure state takes longer than the latency.
For example one configuration could look like this:
•
Configure the latency for DOWN to 60 seconds
•
Configure the latency for Escalations to 300 seconds
•
Configure one notification just to send emails and ICQ message
•
Select this notification for UP and DOWN
•
Configure a second notification to additionally send an SMS/pager
notification
•
Select this notification for ESCALATION
Now if a sensor goes down you will be notified via email and ICQ about 1
minute after a sensor goes down. If after 5 minutes the sensor is still down you
will additionally receive a SMS/Pager notification, e.g. in case you are away
from your email client
How Notifications and Latencies work together
Here is what happens if a sensor fails:
•
Initial Event: For the first time a request of a sensor is slow or fails
•
Now the sensor will be shown with the slow state (yellow
color)
•
If the “latency for warnings” is zero a warning notification
will be triggered immediately
•
If the “latency for warnings” is not zero and if consecutive
requests are also slow a warning notification will be
triggered as soon as the “latency for warnings” has
expired.
•
A second sensor request is sent out immediately by IPCheck Server
Monitor automatically
•
If the second request is fine, nothing happens
•
If the second request is “down”
•
•
the sensor will be shown with the DOWN state (red color)
•
If the “latency for errors” is zero an error notification will
be triggered immediately
•
If the “latency for errors” is not zero and if consecutive
requests also fail an error notification will be triggered as
soon as the “latency for errors” has expired.
•
If consecutive requests still fail an error notification will
be triggered as soon as the “latency for Escalations” has
expired.
If sometime later a request runs through without problems
•
62 • Managing "My Account"
the sensor will be shown with the UP state (green color)
User Manual IPCheck Server Monitor 5
•
An OK notification will be triggered immediately
And there are more aspects that influence this behaviour:
•
If you have selected a dependency for a sensor then the sensor is
not scanned as long a the dependency sensor is not in an UP state
•
If you have selected a dependency for a notification then the
notification is not triggered and sent out as long a the dependency
sensor is not in an UP state
•
If you have selected a schedule for a sensor then the sensor is only
scanned in the time intervals defined by the schedule.
•
If you have selected a schedule for a notification then the
notification is only triggered during the time intervals defined by
the schedule.
Selecting Notifications and Latencies for
Groups, Servers and Sensors
Notifications as well as latencies can be selected for groups, servers and sensors.
For servers and sensors you can choose to use the parent object’s settings.
This way you can change the notification and latency settings for several servers
and/or sensors by simply changing the group’s settings. To use this inheritance
simply check the “User Group Settings” or “User Server Settings” checkbox of a
server or sensor.
Deselect this checkbox to select individual notifications for a server (or sensor).
Adding and Editing Notifications
To edit your notifications please access your “My Account” page (See
“Accessing Your Account”).
Under the Notifications heading you will see a list of your notifications.
•
User Manual IPCheck Server Monitor 5
To add a new notification, click the Add another notification
option.
Managing "My Account" • 63
•
To edit a notification select the Edit Link next to the notification
that you would like to change.
This will open the Notification Data Window.
The settings are:
•
•
64 • Managing "My Account"
Basic Data
•
Name—enter a name for the notification
•
Comments—enter a description for the notification
•
Status—use the drop-down menu to select the state of the
notification. Options include Active and Paused
•
Schedule – allows you to select a schedule defined under My
Account (See “Managing Schedules”). From the drop-down
menu you can select from the defined schedules.
•
Dependency—use the drop-down menu to select a sensor to
depend on. If this sensor is down no notifications will be sent
(e.g. it does not make sense to send a notification if a server
somewhere in the Internet cannot be reached simply because
your DSL line is down). (See “Managing Dependencies”).
E-Mail
•
Note: E-Mail notifications are only available if an SMTP
server is set in the Admin Control Panel by the system
administrator (see”Using the Control Panel”).
•
Notification Status—use the drop-down menu to select the
state of the email notification (Active or Paused)
•
To Address—Enter the email address where the notification
will be sent. To send the email to multiple addresses simply
enter all addresses separated by a comma ","
•
Message Subject and Message Body—Enter the subject and
the message body of the notification. This message can include
basic text as well as IPCheck Server Monitor Custom Message
User Manual IPCheck Server Monitor 5
Tags. These tags allow you to include detailed environmental
information. For more information, see “Notification Message
Tags”.
•
•
•
User Manual IPCheck Server Monitor 5
Priority—Use the drop-down to select the priority of this
message. Options include: Highest, High, Normal, Low,
Lowest.
SMS/Pager
•
Note: SMS/Pager notifications are only available if an SMS
server is set in the Admin Control Panel by the system
administrator (see””).
•
Notification Status—use the drop-down menu to select the
state of the email notification. Options include Active and
Paused
•
Country Code—enter the country Code of the mobile
phone/pager number (e.g. "1" for USA, "33" for UK, "49" for
Germany etc.)
•
Number—enter the mobile phone/pager number (without a
leading "0")
•
Message—Enter the message text of the notification. This
message can include basic text as well as IPCheck Server
Monitor Custom Message Tags. These tags allow you to
include detailed environmental information. For more
information, see “Notification Message Tags”.
ICQ
•
Note: ICQ notifications are only available if an ICQ account is
set in the Admin Control Panel by the system administrator
(see”Using the Control Panel”).
•
Notification Status—use the drop-down to specify the status
of the ICQ notification. Options include: Active (ICQ
notification is on) and Paused (ICQ notification is turned
off).
•
ICQ#—Enter the ICQ number to send the message to
•
Message—Enter the message text of the notification. This
message can include basic text as well as IPCheck Server
Monitor Custom Message Tags. These tags allow you to
Managing "My Account" • 65
include detailed environmental information. For more
information, see “Notification Message Tags”.
•
•
Network Broadcast (NET SEND)
•
Use this notification to send a message across your LAN using
the Windows Messenger Service
•
User—Enter the login name of the user to send the message to
or enter the Active Directory domain name to send to all users
of the domain, or enter * to send to all users.
•
Message—Enter the message text of the notification. This
message can include basic text as well as IPCheck Server
Monitor Custom Message Tags. These tags allow you to
include detailed environmental information. For more
information, see the Notification Message Tags Section.
Play Sound
•
•
66 • Managing "My Account"
Sound File—Select a sound that is to be played when this
notification is executed. Items shown are all '.wav' files from
the 'wav' subdirectory in your IPCheck installation directory. If
you place new WAV files into this directory you must restart
the IPCheck web server service to show them here.
Execute Program
•
Program File—Enter the full path to the executable file (EXE,
CMD, BAT, etc.) on the machine running the IPCheck service,
for example c:\adirectory\afile.exe
•
Parameters—Enter the text you want to hand over to the
executable as command line parameters. This message can
include basic text as well as IPCheck Server Monitor Custom
Message Tags. These tags allow you to include detailed
environmental information. For more information, see the
Notification Message Tags Section.
User Manual IPCheck Server Monitor 5
•
•
HTTP Request
•
URL—Please enter the URL which should be requested (e.g.
http://myloggingserver?event=%server_%name_%status)
•
POSTDATA—Only enter data here if you want to perform a
POST request (placeholders enabled)
Event Log
•
Event Source: Please enter the name that will be generated as
"Source" in the Event Log entry.
•
Event Type: Select the type of the Event Log entry: Error,
Warning, Information.
•
Event Log Message: Enter the message that will be shown in
the Event Log entry. You may use IPCheck's message tags
(see "Notification Message Tags").
•
Note: Event Log Entry Notification is disabled by default.
Once you have entered all of the appropriate information click the OK Button to
save the notification.
Deleting Notifications
To manage your notifications please access your “My Account” page (See
“Accessing Your Account”).
Under the Notifications heading you will see a list of your notifications.
•
User Manual IPCheck Server Monitor 5
Click the Delete link of the notification you want to delete
Managing "My Account" • 67
This will open the Delete Object Window.
•
Click the OK Button to delete the notification
•
Click the Cancel Button if you decide not to delete the
notification. This will return you to the My Account Window.
Note: You cannot undelete a notification.
Pausing/Resuming Notifications
To edit your notifications please access your “My Account” page (See
“Accessing Your Account”). Under the Notifications heading you will see a list
of your notifications.
Click the Pause/Resume link of a notification in the list to enable or disable an
existing notification.
Testing Notifications
To test a notification please access your “My Account” page (See “Accessing
Your Account”). Under the Notifications heading you will see a list of your
notifications.
Click the Test link of a notification and you should receive the notification’s
message in a few seconds.
Cross Reference of Notifications and Latencies
Right below the list of notifications on your My Account page there is a link
Show Notification Cross Reference. Click this link to see a table with all
sensors from top to bottom and their configured probes, intervals, latencies,
notifications, schedule and dependencies from left to right. This is very useful
when setting up alarm handling for many sensors.
Notification Message Tags
IPCheck Server Monitor supports a number of placeholders that you can use to
add environmental property data to your notification messages. These tags
include:
68 • Managing "My Account"
•
%home: The URL of the web interface of IPCheck Server Monitor
•
%date, %time: Date and time
•
%usrname: Current username
•
%group: Current group of servers
•
%server: Current server
•
%name: Current sensor
•
%status: Current status of the sensor
User Manual IPCheck Server Monitor 5
•
%down: For UP messages this contains the downtime (e.g.
"downtime=3h2m")
•
%msg: Current result message of the sensor
•
%location: Location of the current server
•
%lastgood: Date and time of last good request
•
%lastfail: Date and time of last failed request
•
%lasttest: Date and time of last request
•
%settings: Settings of this sensor
•
%trace: Adds a traceroute to the server's IP address (Note: Since
the creation of the trace route data can take up to several minutes
the email will be delayed with this setting)
These tags are placed in the Message Sections of the Notification Details
Window when setting up or editing a notification.
Managing Dependencies
Using “dependencies” you can pause the monitoring of sensors or the sending of
notifications based on the status of another sensor to avoid false alarms and
incorrect recording of downtimes.
If you – for example – monitor servers over a leased line then it makes no sense
to send monitoring requests to the servers if the leased line is down since
IPCheck can’t even reach the servers. The idea is to monitor the availability of
the leased line and then pause monitoring of the servers if the leased line is not
available at all.
In our example you would set up a short-intervalled PING sensor to monitor the
first hop behind the leased line. Then select this sensor as dependency for the
sensors that monitor servers behind the leased line.
This way you will not be notified of server downtimes if actually the leased line
goes down, also no downtime will be recorded for the servers’ sensors.
Dependency Concept
Dependencies can be selected for groups, servers and sensors (to pause
monitoring) as well as for notifications (to mute notification messages).
Choosing dependencies should be done with great caution as it can
completely knock out your monitoring if not used correctly!
Here are some tips:
User Manual IPCheck Server Monitor 5
•
Sensors used a dependency should be very simple sensors (e.g.
PINGs) with short intervalls (much shorter than the dependent
sensors) and with short timeouts.
•
To monitor the availability of leased lines monitoring the first hop
behind the line is a good idea. Use the “tracert” command to find
out the IP of this first hop.
•
Make sure you set reliable notifications for the sensors that you
will use as dependency so you will be notified about the fact that
IPCheck can’t monitor your other sensors!
•
You must make sure that you do not configure loops into your
dependencies by making two groups/servers/sensors dependent on
each other, then both sensors will never be “unpaused”.
Managing "My Account" • 69
•
Dependencies can be cascaded
Dependency Example
For example: IPCheck Server Monitor is running on a server that is connected to
the Internet via a DSL line. It monitors three sensors on a webserver in a
commercial hosting center across this DSL line.
It is recommended to set up a PING sensor for a hop en route to the server (e.g.
the first after the DSL line) with an interval of 15 seconds and a timeout of 5
seconds. This will be your dependency sensor.
Now you can set up e.g. the three sensors for the remote server (e.g. SMTP,
POP3 and HTTP) with 60 seconds interval and the PING sensor created above as
the dependency.
As soon as the PING sensor goes into WARNING or DOWN state, the
monitoring for the webserver will be paused and will later be resumed when the
PING sensor returns to UP status.
This is only a sample, for your configuration other concepts can be useful. You
can use any type of sensor as the dependency sensor!
Using Tracert to Find Out Hop IP Addresses
To find out the IP adresses of hops between the machine running IPCheck and a
server you want to monitor run the “tracert (yourservername)” command on the
machine running IPCheck:
C:\ >tracert www.paessler.com
Trace route to www.paessler.com
1
<1 ms
<1 ms
<1 ms
2
2 ms
1 ms
1 ms
3
7 ms
8 ms
8 ms
4
9 ms
8 ms
8 ms
5
9 ms
8 ms
8 ms
6
12 ms
11 ms
12 ms
7
13 ms
12 ms
20 ms
8
12 ms
11 ms
11 ms
9
26 ms
26 ms
26 ms
(…)
[72.3.142.92] with max. 30 hops:
10.0.0.1
hp7.paessler.com [81.17.107.145]
82.149.64.153
212.123.97.101
[134.222.107.21]
[134.222.228.69]
[134.222.227.134]
[80.81.192.125]
151.164.41.96
Choose one of the hops to monitor. Often it is a good idea to talk to your
provider which IP address is a good choice.
Group, Server and Sensor Dependencies
For groups, servers and sensors you can choose a dependency by selecting an
item from the “dependency” dropdown. For groups all associated servers and for
servers all associated sensors will inherit this dependency.
If a dependency is selected the sensor (or all sensors of the group or the server)
will enter a PAUSED status (blue) as soon as the dependency sensor is not UP
(green) and will not be monitored until the dependency sensor returns to the UP
status.
This means that monitoring will be paused if the dependency sensor is in
DOWN, WARNING or PAUSED state! This also the case if the dependency
sensor is paused due to a schedule.
Notification Dependencies
For each notification you can select a sensor for the notification to depend on. If
this sensor is down, no messages for this notification will be sent.
70 • Managing "My Account"
User Manual IPCheck Server Monitor 5
Admin Dependencies
In the Admin's settings in the webinterface (click My Account and My Settings)
you can select two sensors. If either one of the two sensors is not UP (PAUSED,
WARNING or DOWN) all monitoring if the IPCheck installation will be paused
completely.
Managing Schedules
Using so-called schedules you can enable and disable monitoring (for groups,
servers, sensors) or the delivery of notifications based on the time of day and/or
the day of the week.
This can be used, for e.g. to pause monitoring during the night or to avoid
receiving notifications, for example, on the weekend.
Editing Schedules
To edit your schedules please access your “My Account” page (See “Accessing
Your Account”). Under the Schedules heading you will see a list of your
schedules. Clicking on the Add another schedule link opens the schedule dialog
to create a new schedule, or click the Edit link to edit an existing schedule.
Here, the specific days and times to be monitored (or notified) can be selected. A
schedule can be appointed to a group, a server, sensors, and notifications.
To edit the schedule you can select the individual checkboxes or click directly on
the buttons to revert the selection.
If a schedule is activated for a notification, this will show up by marking the
notification as “paused” during off times. Although notifications will not be sent
at these times, the logged information is available as soon as the scheduled status
changes to active again.
User Manual IPCheck Server Monitor 5
Managing "My Account" • 71
Pausing/Resuming Schedules
To edit your schedules please access your “My Account” page (See “Accessing
Your Account”). Under the Schedules heading you will see a list of your
schedules.
Click the Pause/Resume link of a schedule in the list to enable or disable an
existing schedule.
Deleting Schedules
To delete a schedule please access your “My Account” page (See “Accessing
Your Account”). Under the Schedules heading you will see a list of your
schedules.
Click the Delete link of a schedule in the list to delete it.
72 • Managing "My Account"
User Manual IPCheck Server Monitor 5
Sensor Types in Detail
Information that applies to all sensors
IPCheck Server Monitor offers a wide range of sensor types to monitor many
different aspects of a network device. When creating and editing sensors there
are special parameters for each sensor type and there are also some parameters
that are available for all sensors.
The following parameters are common to all sensors:
User Manual IPCheck Server Monitor 5
•
Associated Server—use the drop-down menu to select a server to
which to attach this sensor
•
Name—enter a descriptive name for the sensor
•
Comments—enter a description for the sensor (i.e., what it does or
when it will check)
•
Status—use the drop-down menu to set the status of the sensor
(Active or Paused)
•
Dependency—You can pause this sensor if a sensor of another
server is not UP. Choose the dependency sensor from the
dropdown list. Do not choose the current sensor itself and avoid
circular dependencies. Use with caution. See “Managing
Dependencies”.
•
Schedule – allows you to select a schedule defined under My
Account (See “Managing Schedules”). From the drop-down menu
you can select from the defined schedules.
•
Probe – If the admin has set up more than one remote probe you
can select one or more probes from the list to monitor a server or
service from various locations (see “Multi Location Monitoring
Using Remote Probes”).
•
Interval—use the drop-down menu to select an available interval.
•
Latencies - "Latencies" are used to defer notifications after
warnings or errors have occurred. You can set latencies on group,
server and sensor level. The latencies for warnings, errors and
escalations can be set individually. Choose “Use Group Settings” if
you want this server to use the latency settings of the associated
group or choose the latencies for this server individually. See
“Managing Notifications, Latencies and Dependencies” for more
information.
•
Notifications - "Notifications" are used to send alarms when
warnings or errors occur. You can set notifications for groups,
Sensor Types in Detail • 73
servers and sensors. Choose “Use Group Settings” if you want this
server to use the notifications of the associated group or choose the
notifications for this server individually. See “Managing
Notifications, Latencies and Dependencies” for more information.
Most sensors also have one or more of the following common parameters:
•
Timeout—specify a time (in seconds) when the sensor should stop
trying to accomplish its objective and send a failure notification
•
Warning level—specify a time (in seconds) when the response
time of the sensor should generate a warning notification. If you
have the On Warning Notification set to active, this will
determine when the notification is sent.
Please check the following sections for details on the technology of the various
sensor types and for details on the individual parameters.
Basic Sensors
The basic sensors are the fundamental monitoring tools. They are sufficient to
get a good overview of a network.
PING Sensor
Sending a PING to a server is the most basic and oldest network diagnostic tool.
The name comes from the sound that an underwater sonar makes.
To test the availability of a PING sensor IPCheck Server Monitor sends an
ICMP packet to the ECHO REPLY port of a server and waits for a result. Only if
the returned packet still has the same data content the sensor's result is ok.
What it means when the PING sensor is up
When this sensor shows an UP state for a server then you know that the
connection to a server is available, the server is running and is able to accept and
send network packets. But this does not mean that services running on this server
are running ok. PINGs are just a very basic diagnostic tool to check network
availability.
What it means when the PING sensor is down
There are numerous reasons for a PING sensor to fail, the most common one is
that the sent packet either did not reach the server or the returning packet was not
delivered back to the machine running IPCheck Server Monitor. This can be
caused by connection problems (line or router failures), routing problems, or
simply because a firewall between the server and the monitoring machine has
rejected the packet because PINGs are not allowed by the firewall's rules.
Note: When monitoring a remote server a small amount of lost PINGs (1-2%)
should usually not be considered harmful.
PORT Sensor
The PORT sensor simply tries to connect to a server on a specific port number.
If the server accepts the request to open the port IPCheck Server Monitor closes
the port and regards this sensor as UP. Parameters include:
•
PORT—the port number of the service you want to monitor (see
below)
Using PORT sensors it is possible to check the basic availability of any TCP
service by trying to connect to its port.
74 • Sensor Types in Detail
User Manual IPCheck Server Monitor 5
Since the PORT sensor does not check whether the server reacts according to
any protocols defined for a service it is recommended to use protocol based
sensors whenever possible (e.g. by using the various other sensors included with
IPCheck Server Monitor or by creating your own using the CUSTOM sensors).
There are several services that still accept requests even though they do not send
back correct information when they fail.
Some ports have numbers that are preassigned to them by the IANA for specific
services (e.g. port 80 is usually used for HTTP traffic in the World Wide Web),
and these are known as well-known ports (specified in RFC 1700).
Here is a list of well-known ports:
User Manual IPCheck Server Monitor 5
•
7 ECHO (used for PING)
•
20 FTP -- Data
•
21 FTP -- Control
•
22 SSH Remote Login Protocol
•
23 Telnet
•
25 Simple Mail Transfer Protocol (SMTP)
•
37 Time
•
42 Host Name Server (Nameserv)
•
43 WhoIs
•
53 Domain Name System (DNS)
•
69 Trivial File Transfer Protocol (TFTP)
•
70 Gopher Services
•
79 Finger
•
80 HTTP
•
103 X.400 Standard
•
108 SNA Gateway Access Server
•
109 POP2
•
110 POP3
•
115 Simple File Transfer Protocol (SFTP)
•
118 SQL Services
•
119 Newsgroup (NNTP)
•
137 NetBIOS Name Service
•
139 NetBIOS Datagram Service
•
143 Interim Mail Access Protocol (IMAP)
•
150 NetBIOS Session Service
•
156 SQL Server
•
161 SNMP
•
179 Border Gateway Protocol (BGP)
•
194 Internet Relay Chat (IRC)
•
197 Directory Location Service (DLS)
•
389 Lightweight Directory Access Protocol (LDAP)
Sensor Types in Detail • 75
•
396 Novell Netware over IP
•
443 HTTPS
•
444 Simple Network Paging Protocol (SNPP)
•
445 Microsoft-DS
•
458 Apple QuickTime
•
546 DHCP Client
•
547 DHCP Server
•
1080 Socks
For more information on port numbers please check RFC 1700:
http://www.ietf.org/rfc/rfc1700.txt?number=1700
What it means when the PORT sensor is up
When monitoring a service using the PORT sensor an UP status only says that
the service is reachable and that it accepts connection attempts. In most cases
this also means that the service is running correctly. But it is also possible that
the service does not send back any correct information. So try to use protocol
based sensors whenever possible.
What it means when the PORT sensor is down
When monitoring a service using the PORT sensor a DOWN status means that
the service is not working at all or can not be reached because of network
connectivity problems.
HTTP Sensor
The HTTP protocol (Hypertext Transfer Protocol) is most commonly used for
the World Wide Web. Web browsers request webpages, graphics, etc. from
webservers using this protocol. Parameters include:
•
URL—the URL address of the webpage to monitor (including the
leading http://)
•
Mode—the HTTP request mode to use (GET, POST, HEAD)
•
POSTDATA—the data part when using the POST method
For simple web pages simply enter the URL (with http:// at the beginning) and
keep the default mode selection of GET.
If you want to monitor a URL for a POST form you must select the POST
method and enter the POSTDATA.
The HEAD method only requests the HTTP header from the server without the
actual webpage. Although this saves bandwidth because less data is transferred it
is not recommended because the measured request time is not the one
experienced by your users and you might not be notified for slow results or
timeouts.
Note 1: If your network requires a proxy to be used for HTTP requests or the
URL requires authentication you must use the HTTP Advanced Sensor.
Note 2: You can set the useragent string by setting the following registry key
(you may need to create a new string value “useragent”):
Localmachine\Software\Paessler\IPCheck\useragent
76 • Sensor Types in Detail
User Manual IPCheck Server Monitor 5
Bandwidth Issues
Important: Keep in mind that the HTTP sensor can create substantial bandwidth
load because it is one of the sensors that transfers many bytes per requests
(sometimes 1000 times more that a simple ping). So choosing a URL that only
gives a small HTML page in return is recommended if you have to pay for the
bandwidth (either for your connection or for your webserver). This is of course
not a major problem in most LANs and Intranets, but bandwidth usage should
always be monitored.
Remember: Requesting a 25kb web page with an interval of one minute creates a
traffic of 36 MB per day or more than one Gigabyte per month!
Website Traffic/Logfile Analysis Issues
Also keep in mind that the monitoring requests will show up in your webserver
log analysis (one month of monitoring with one minute interval will create
43.200 requests). You should filter out the requests from IPCheck Server
Monitor when analyzing log files. Filtering can be done based on the IP address
of the server running IPCheck Server Monitor, on the browser agent:
Mozilla/5.0 (compatible; IPCheck Server Monitor 5
(www.paessler.com); Windows)
or the one you set yourself in the registry or by using a special URL on the
server for monitoring and filtering out the requests for this URL.
What it means when the HTTP sensor is up
The UP status of an HTTP sensor means that the webserver delivers an HTTP
result that is correct according to the HTTP protocol and that the URL is
available. This means that the webserver software is up and running, but you do
not know whether the results are correct, e.g. the webpage can contain error
messages. So you don't know whether the CGI scripts, etc. work correctly or
whether, e.g. the database of the webserver is ok. It is recommended to also
check the content of a webpage by using the HTTP Advanced Sensor instead of
the simple HTTP sensor for added reliability.
What it means when the HTTP sensor is down
There are numerous reasons for an HTTP sensor to fail. Besides normal
connectivity problems the most common problems are internal server errors
(error code 50x) and problems caused by an incorrect URL (error code 404, page
not found).
Advanced Sensors
Using the advanced sensors a webserver/website can be monitored very closely.
HTTP Advanced Sensor
This sensor is an extended version of the HTTP sensor (see above) and should be
the preferred sensor for website monitoring.
It adds content checking, authentication, and proxy settings or can even notify
the user when a webpage is changed. Using this sensor a website/webpage can
be monitored for many more aspects than by only using the basic HTTP sensor.
For example it is a good idea to monitor the content of a webpage for error
messages that could show up on a webpage in case the database or script engine
has problems (e.g. enter "error" in the Response may not include field).
User Manual IPCheck Server Monitor 5
Sensor Types in Detail • 77
Another good idea for scripted webpages is to monitor that the "</html>" tag is
always a part of the result. Many script languages stop processing a scripted
webpage upon errors and thus this HTML code is not delivered to the client. Or
put a special code in your footers (e.g. "<!—PAGEEND-->") and monitor for
this string to make sure the webpages are delivered completely. There are many
more options of course…
All additional parameters of this sensor are optional (see the HTTP sensor for the
other parameters):
•
Response must include—If the resulting HTML does not contain
this string, this is considered an error and can trigger a notification.
•
Response may not include—If this string is found in the resulting
HTML, this is considered an error and can trigger a notification.
•
Monitor content change—Check this option if you want to
monitor any content changes (checksum based). This can be
combined with an 'On Change' notification to notify the user when
the resulting webpage changes.
•
Limit download (kb)—Enter a maximum amount of data
transferred per request. Attention: The content check option is
maybe inaccurate when you use a download limit
•
User—Enter a login name here if the monitored URL is protected
with basic authentication
•
Password—Enter a password here if the monitored URL is
protected with basic authentication
•
Proxy—If your network requires a proxy to be used for HTTP
requests (Note: it is recommended NOT to use proxies for
monitoring because when a request fails IPCheck Server Monitor
does not know whether the proxy failed or the monitored server)
•
•
Name—IP-address or DNS name of the proxy server
•
Port—the port of the proxy server
•
User—optional username needed to access the proxy
•
Password—optional password needed to access the proxy
On Change—Select a notification that should be triggered when
the HTTP result of the URL changes (enable monitor content
change above!)
Note 2: You can set the useragent string by setting the following registry key
(you may need to create a new string value “useragent”):
Localmachine\Software\Paessler\IPCheck\useragent
What it means when the HTTP Advanced Sensor is up
With a good configuration the HTTP advanced sensor is a very reliable uptime
sensor. If your website has a shopping cart or other multi URL processes only
the HTTP transaction sensor will give more reliability.
What it means when the HTTP Advanced Sensor is down
When this sensor shows a DOWN status depending on the configuration there
are many possible reasons. The best way to find out the specific problem is to
look at the result string shown by IPCheck Server Monitor.
78 • Sensor Types in Detail
User Manual IPCheck Server Monitor 5
HTTP Transaction Sensor
This sensor is a complement to the basic HTTP sensor and the HTTP advanced
sensor. It can monitor a sequence of up to 10 URLs for availability and turn
around time.
The most common use for a transaction sensor is to monitor the shopping
process on a webpage, i.e. visiting the homepage, selecting a product, putting it
into the shopping cart, and checking out. For this process you should define a
maximum time for each request and for the whole sequence to complete.
Please see the two other HTTP sensors for the common parameters and other
information. Parameters include:
•
Timeout—If the complete transaction (i.e. completing all URLs
you enter below) takes longer than this value the request is aborted
and you get an error message. If two consecutive requests will fail
(for whatever reason) the sensor enters a 'Down' state.
•
Warning-Level—If the complete transaction (i.e. completing all
URLs you enter below) takes longer than this value the sensor
enters a 'Warning' state.
•
Single URL Timeout—If the reply of a single transaction step (i.e.
one URL) takes longer than this value the request is aborted and
you get an error message.
•
Use Cookies—Enable this option if cookies received from the
server should be resent for subsequent requests.
•
Transaction URL #1 to #10—Enter the URLs of the sequence you
want to monitor
Note 2: You can set the useragent string by setting the following registry key
(you may need to create a new string value “useragent”):
Localmachine\Software\Paessler\IPCheck\useragent
What it means when the HTTP Transaction Sensor is up
Rest easy, your e-commerce website is in good shape.
What it means when the HTTP Transaction Sensor is
down
Reasons for this sensor to fail are connectivity issues, failed single requests, or
timeouts for a single request or the complete sequence.
Protocol Sensors
These sensors, that each monitors a specific Internet protocol, are used to ensure
the availability of DNS servers, mail servers, and FTP servers.
DNS Sensor
The DNS (Domain Name System or Service) is an Internet service that translates
domain names (which are easier for humans to remember) into IP addresses
(which computer use to address each other). Every time you use a domain name,
therefore, a DNS service must translate the name into the corresponding IP
address. For example, the domain name www.paessler.com might translate to
62.146.51.168.
The DNS sensor sends a request to resolve a specific domain name to an IP
address to the server it is associated with. This is useful e.g. to ensure that a
User Manual IPCheck Server Monitor 5
Sensor Types in Detail • 79
company's web server address can be resolved by the outside world or to check a
DNS server in a LAN for availability.
Note: The Server associated with this sensor has to be a DNS server and not the
domain name of the server you want to monitor.
If you only enter the domain name IPCheck Server Monitor will only check
whether the name is resolved to an IP address at all (which simply means that the
DNS server works correctly and the domain name is valid). If you also enter an
IP address the resolved IP address will be compared to this and the sensor will
show an error when the two addresses are different. Parameters include:
•
Domain—enter the domain name to look up (e.g.
www.yourcompany.com)
•
IP—optionally enter an IP address to compare the result with
What it means when the DNS Sensor is up
When the DNS sensor shows an UP state then the DNS server is working and it
is giving back an IP address to a domain name.
What it means when the DNS Sensor is down
There are four possible reasons for this sensor to fail: The DNS server cannot be
reached, it did not react according to the protocol, the domain name was invalid
and could not be resolved, or the optional IP address is different from the IP
resolved by the server.
SMTP Sensor
SMTP (Short for Simple Mail Transfer Protocol) is the basic protocol for
sending e-mail messages between mail servers over the Internet. Whenever you
send or receive an e-mail it is transferred using this protocol.
The SMTP sensor of IPCheck Server Monitor supports monitoring on three
levels:
•
HELO: The SMTP server is contacted and a few bytes of
communication are transferred according to the protocol definition
and then cancels the connection. This ensures that the server is
accepting requests and answers according to the protocol.
•
RCPT: Additionally IPCheck Server Monitor tries to begin
delivering an email to a given email address and then cancels the
connection. This checks whether the email server actually accepts
mails to this address at all.
•
DATA: Additionally IPCheck Server Monitor sends a complete
email to a given email address and finishes the communication.
This most thoroughly checks if the mail server accepts and
processes the email but on the other hand the recipient will get an
email with each check (!), so this should only be used for
debugging purposes.
Parameters include:
80 • Sensor Types in Detail
•
PORT—the port number of the mail service you want to monitor
(usually port 25)
•
Monitoring Level—The level of monitoring (see above)
•
Helo Ident—For some mail servers the HELO ident must be the
valid principal host domain name for the client host (i.e. the
machine running IPCheck Server Monitor)
User Manual IPCheck Server Monitor 5
•
From—Sender ('From:' part) of the mail
•
To—Recipient(s) ('To:' part) of the mail
•
Topic—'Subject:' part of the mail
•
Content—Body of the mail
What it means when the SMTP Sensor is up
Depending on the monitoring level you chose an UP state means that the mail
server is accepting connections and is accepting mails for a specific address (see
above)
What it means when the SMTP Sensor sensor is down
Apart from connectivity problems a DOWN state of this sensor means that it
does not comply to the SMTP protocol, does not accept an email for the given
address, or refuses to accept the email. See the monitoring result string for
details.
POP3 Sensor
The POP3 protocol (Post Office Protocol version 3) is used to retrieve e-mail
from a mail server. Most e-mail applications use the POP protocol.
The POP3 sensor supports monitoring on four levels:
•
Connect: Just connect and send QUIT (checks whether server is
running and accepting connections attempts)
•
USER: Send USER with the provided login (checks whether server
reacts according to protocol)
•
PASS: Send PASS with the password for the user (checks whether
the given user can actually log in)
•
STAT: Send a STAT command (checks whether user can retrieve
number of waiting emails)
Parameters include:
•
PORT—the port number of the POP3 service you want to monitor
(usually port 110)
•
Monitoring Level—The level of monitoring (see above)
•
User—the username of the account to monitor
•
Password—the password for this user
What it means when the POP3 Sensor is up
Depending on the monitoring level an UP state can have different meanings (see
above).
What it means when the POP3 Sensor is down
Apart from connectivity problems a DOWN state of this sensor means that it
does not comply to the POP3 protocol, does not accept the login of the given
user, or the user is not able to request the number of available mails. See the
monitoring result string for details.
User Manual IPCheck Server Monitor 5
Sensor Types in Detail • 81
FTP Sensor
FTP (Short for File Transfer Protocol) is used on the Internet for exchanging
files (e.g. to upload content to a webpage or to download files from a server).
Like most other protocol sensors, the FTP sensor offers several monitoring
levels:
•
Connect: Just connect and send QUIT (checks whether the server is
running and accepting requests at all)
•
USER: Send USER with the provided login (checks whether server
reacts according to protocol)
•
PASS: Send PASS with the password for the user (checks whether
a user can actually log in)
Parameters include:
•
PORT—the port number of the mail service you want to monitor
(usually port 21)
•
Monitoring Level—The level of monitoring (see above)
•
User—the username to log in with
•
Password—the password for this user
What it means when the FTP Sensor is up
Depending on the monitoring level an UP state can have different meanings (see
above).
What it means when the FTP Sensor is down
Apart from connectivity problems a DOWN state of this sensor means that it
does not comply with the FTP protocol or does not accept the login of the given
user. See the monitoring result string for details.
Custom Sensors
Using the custom sensors of IPCheck Server Monitor a lot of monitoring tasks
can be performed that go far beyond the standard sensor set.
With these highly customizable sensor types the user is able to create a very
specific monitoring – he can even create his very own sensors using VB Script
or any programming language.
Sample projects for Custom Sensors can be found in the IPCheck Server
Monitor installation directory and are available in the Knowledge Base on the
Paessler Website at www.paessler.com/support.
HTTP Content Sensor
This sensor requests a HTTP URL and parses the result for a value enclosed in
brackets "[value]".
The most common use is to monitor some value inside a webserver for validity.
For example if you have a script or CGI running on the web server that simply
publishes the free disk space of the server's hard disk or the current processor
usage you can actually monitor this value. Of course many other usage concepts
are possible.
Parameters include:
•
82 • Sensor Types in Detail
Script URL—the URL of the webpage to request
User Manual IPCheck Server Monitor 5
•
Minimum—the minimum valid value. If the value is below this
minimum the sensor will enter an error state.
•
Low—the low warning value. If the value is below this value the
sensor will enter a warning state.
•
High—the high warning value. If the value is above this value the
sensor will enter a warning state.
•
Maximum—the maximum valid value. If the value is above this
maximum the sensor will enter an error state.
Script Sensor
Using the script sensor it is possible to develop custom sensors using VBScript.
The script files must be stored on the server that runs IPCheck Server Monitor.
Please see the chapter "Technical Details for Script and TCP Script Custom
Sensors" on how to create your own sensors.
Parameters include:
•
Scriptfile—select one of the scripts stored on the server
•
Data1, Data2, Data3—The values you enter here can be accessed
inside the script
•
Indicator String—Enter an "Indicator" string here (e.g.
"Bandwidth", "Temperature" etc.) - for display purposes only
•
Unit String—Enter a "Unit" string here (e.g. "ms", "Kbyte" etc.) for display purposes only
TCP Script Sensor
Just like the normal script sensor, with the TCP script sensor you can develop
custom sensors using VBScript. The additional feature of the TCP script sensor
is that this sensor can execute a script with data communication with a server via
a TCP connection.
The script files must be stored on the server that runs IPCheck Server Monitor.
Please see the chapter "Technical Details for Script and TCP Script Custom
Sensors" on how to create your own sensors.
Parameters include:
•
Port—the port of the TCP connection
•
Scriptfile—select one of the scripts stored on the server
•
Data1, Data2, Data3—The values you enter here can be accessed
inside the script
•
Indicator String—Enter an "Indicator" string here (e.g.
"Bandwidth", "Temperature" etc.) - for display purposes only
•
Unit String—Enter a "Unit" string here (e.g. "ms", "Kbyte" etc.) for display purposes only
Custom Sensor
The custom sensor actually executes a DLL or command line EXE to obtain a
monitoring value. This EXE/DLL can be developed with all programming
languages.
User Manual IPCheck Server Monitor 5
Sensor Types in Detail • 83
SQL Server Sensors
Using the SQL Server sensors you can natively monitor the most used SQL
servers: MySQL, Microsoft SQL, and Oracle SQL. Basically, the sensors
monitor whether the database server process accepts and processes requests.
Additionally you can run a custom SQL command and check the return values.
The following fields are particular to these sensors:
84 • Sensor Types in Detail
User Manual IPCheck Server Monitor 5
•
Database Name – in this field, the name of the database or the
path of the database can be entered in order to access the database
information.
•
User and Password – provide the username and password to login
to the database.
•
SQL Expression – provide an expression with which to fetch data.
When a cursor is returned, only the first row will be fetched.
•
Result Set – check this checkbox if your SQL expression returns a
result set. Then the value of the first column of the first row of the
result set is used as value of the monitoring request (e.g. will be
compared to the limits). Otherwise the “number of affected rows”
is regarded to be the value of a monitoring request.
The sensors support the following server versions:
•
•
User Manual IPCheck Server Monitor 5
MS-SQL: SQL Server 2005, SQL Server 2000, SQL Server 7 and
MSDE (requires OLE DB installed on the machine running the
IPCheck Server and/or Remote Probe that accesses the server).
Enter MS-SQL specific data in the respective section.
•
Instance Name – This holds the name of the instance if you
want to connect to a ‘named instance’, otherwise it remains
empty.
Note: Sometimes you see connection strings like
SQLSERVER\SQLINSTANCE in database clients. The first
part is the server name that was configured in the general
server settings. The second part is the instance name
mentioned here. Do NEVER enter the string in this form in the
instance field of the sensor setup page, only the second part
(and without the backslash)
•
Port – If your SQL Server runs the instance at a different static
port than 1433 you can enter the port number in this field. If
your SQL Server uses the default value of 1433 or is
configured for dynamic port setting then leave this field empty.
Oracle: Oracle 10g, 9i, 8i and Oracle 7 (requires default TCP Port
Setting 1521). Enter Qracle Specific Data in the respective section.
•
Interface– Oracle offers 2 possibilities for connection to the
server, either via direct TCP/IP communication (SQL-NET) or
via the Oracle Client Interface (OCI). Select the one you want
to use for this sensor.
•
Port – With SQL-NET you have to supply the TCP/IP Port for
the connection in this Field. Usually the default value of 1521
is correct. With an OCI connection the setting of the port
property is ignored.
Sensor Types in Detail • 85
•
MySQL: MySQL server 5.0, 4.1, 4.0 and 3.23.
WMI Sensors
WMI stands for “Windows Management Instrumentation” and is the latest
technology from Microsoft for monitoring and management of Windows based
systems. WMI allows to read out data for many Windows’ configuration
parameters as well as current system status values. Access can take place locally
or remotely via a network connection. WMI is based on COM and DCOM and is
integrated in Windows 2000, XP, 2003, and Vista. Add-ons are available for
Windows 9x and NT4.
WMI Sensor Types
There are five different WMI sensor types in IPCheck Server Monitor:
•
WMI CPU Load: This sensor type is used to monitor the
percentage of CPU loads.
•
WMI Disk Space: This sensor type is used to monitor the free disk
space on hard disk partitions.
•
WMI Memory: This sensor type is used to monitor the amount of
available RAM.
•
WMI Service: This sensor type is used to monitor the status of any
particular Windows service.
•
WMI Query: This sensor type is used to monitor any user defined
WMI query. The user can define his own WMI scripts and run
them in order to get monitoring results.
All types are explained in detail in the following sections.
Creating a New WMI Sensor
Select the type of WMI sensor by marking the respective radio button. If you
want to monitor WMI sensors on a remote system (i.e. not on the machine
running the IPCheck probe service) you must supply the authentication data in
the respective fields at the bottom of the WMI sensor section.
86 • Sensor Types in Detail
User Manual IPCheck Server Monitor 5
Basic Authentication Settings for all WMI
Sensors
In order to be able to monitor remote machines the WMI sensor needs an Active
Directory account or a system account on the monitored PC to get access to the
WMI interface.
The Login Data fields are used to provide authentication information in order to
connect properly to the machine to be monitored. Generally, when monitoring
local sensors (i.e. on the machine running the selected IPCheck probe) this
information is not required.
Hint: If you do not enter authentication data IPCheck will use the account that
the “ipcheckprobe” service runs under. By default this is the “local system”
account which enables IPCheck’s probe to access the WMI interface of the
machine it runs on. It may be a good idea to configure the account for the probe
service to an administrator account of your domain, then IPCheck would be able
to monitor all Windows systems of your domain using WMI without the need to
enter authentication data in the web interface.
Note: If you want to access a remote machine, the sensor’s parent server
configuration must reflect the target machine’s name in the DNS / IP address
entry!
If the machine in case is part of a different domain, please also provide the
domain name in the respective field when adding the sensor.
WMI CPU Load Sensors
When creating a new WMI CPU Load sensor the program will automatically
scan for available processors either on the local machine or on a defined remote
machine. Select the cpu total or a specific processor id and it will return the CPU
load as a percentage.
User Manual IPCheck Server Monitor 5
Sensor Types in Detail • 87
WMI Disk Space Sensors
When creating a new WMI Disk Space sensor the program will automatically
scan for available hard disk partitions either on the local machine or on a defined
remote machine. Select the desired partition and it will return the free disk space
of the respective partition in megabytes.
WMI Memory Sensor
The sensor will connect to the Random Access Memory WMI counter of the
specified machine and will return the amount of free memory in megabytes.
Beyond the authentication data fields, this sensor does not need any further
configuration.
WMI Service Sensor
When creating a new WMI Service sensor the program will automatically scan
for available services and display them in a drop-down list after a successful
scan. Select the desired service and it will return the status of the service.
Furthermore, if the “Restart Service” option is checked, the program will try to
restart the service if the same should stop for whatever reason.
WMI Query Sensors
Beyond the standard sensor settings, the WMI Query sensor includes the
following options:
WMI Query – This required field is to be used to define the valid expression for
the desired WMI query. Bear in mind that only a single return value can be
monitored; as such, selecting multiple fields in the provided expression will only
yield results for the first expression used (i.e. If the result contains more than one
row of data, only the first one is used).
Custom Indicator String – This field is for display purposes only and can
contain any alphanumeric entry allowing the user to discern what sort of query is
being monitored. Some examples could be “Bandwidth”, “Temperature”, etc.
Custom Unit String – This field is for display purposes only and is provided to
define a unit entry for the query in case. Some examples could be “ms”,
“Kbyte”, etc.
Further Information on WMI Counters
The following link provides further information as regards WMI in general:
http://msdn2.microsoft.com/en-us/library/ms811533.aspx
System Sensors (Local or Remote)
The System Sensors allow monitoring of several Windows specific system
parameters:
88 • Sensor Types in Detail
•
Service Sensor: Monitors if an “NT service” is running on a
Windows system (Windows NT/2000/XP/2003)
•
File Sensor: Monitors a file for existence, file size, or changes
•
Disk Space Sensor: Checks available disk space of a disk drive
User Manual IPCheck Server Monitor 5
Local System Sensors are monitoring the system parameters mentioned above
on the machine running IPCheck Server Monitor (or the machine running the
selected Remote Probe respectively). Local System Sensors are using the local
SYSTEM account.
Remote System Sensors are monitoring the same system parameters but on
remote machines. You must supply an Active Directory Domain name, a user
account, and a password so IPCheck Server Monitor can log into the remote
machine to actually access the readings.
While the Local System Sensors use the local SYSTEM account, the following
additional fields are required for all Remote System Sensors:
•
Logon/Server Domain – Enter the name of the server or the Active
Directory domain name, which should be used to log on
•
User – enter the login name (for the server / domain entered above)
•
Password – enter the password (for the account entered above)
An additional field is only required when setting up a Remote Service Sensor:
•
Machine Name – enter the Windows machine name of the
computer you want to monitor
Service Sensor (Local or Remote)
The service sensor is used to monitor the availability of so called “Windows
Services” (on Windows NT/2000/XP/2003 only). Services are processes that
must be running all the time, e.g. web servers, mail servers, SQL servers, etc.
They are executed “behind the scenes” even if no user is logged into the
machine.
The service sensor goes into error state as soon as a service is not running any
more (e.g. it is aborted, stops due to an error, etc.) which can trigger
notifications. It can additionally be configured to try to restart the service upon
failure.
User Manual IPCheck Server Monitor 5
Sensor Types in Detail • 89
The following fields are particular to this sensor:
•
Service Name – This drop-down list shows all services currently
installed on the monitored Windows machine. Select the service
you would like to monitor. Note: A service must already be
installed to be listed here.
•
Try to Restart – If IPCheck discovers that the service is not running
it tries to restart the service using the Windows API. Note: For
remote sensors the account you have entered for this sensor must
have the rights to start services (see system policy settings).
File Sensor (Local or Remote)
The file sensor checks if a file exists or not, plus it can scan the file for changes
made to the specified file.
The following fields are particular to this sensor:
90 • Sensor Types in Detail
User Manual IPCheck Server Monitor 5
•
File – enter the path to the file (UNC paths are allowed), e.g.
c:\test.txt or \\server\share\test.txt
•
Monitor Content Change – check this box if you want to monitor
any content changes of the file (checksum based). This can be
combined with an ‘On Change’ notification to trigger an email
whenever the file is changed.
•
Monitor Timestamp Change – check if you want to monitor any
timestamp changes of the file. This can be combined with an ‘On
Change’ notification to trigger an email whenever the file is
changed.
IPCheck Server Monitor will go into an error state if the file does not exist or is
removed or deleted while being monitored. The Change fields can be used to
monitor ‘On Change’ notification information in the manner that they record if
the content of a file or its timestamp are changed.
Furthermore, the following additional checks can be applied:
•
Lower File Size Error Limit (KB) – Sensor goes into an error state
if the current file size is below this value. Enter ‘-1’ to disable the
check
•
Upper File Size Error Limit (KB) – Sensor goes into an error state
if the current file size is above this value. Enter ‘-1’ to disable the
check
•
Lower File Size Warning Limit (KB) – Sensor goes into a warning
state if the current file size is below this value. Enter ‘-1’ to disable
the check
•
Upper File Size Warning Limit (KB) – Sensor goes into a warning
state if the current file size is above this value. Enter ‘-1’ to disable
the check
Note: These values are in Kilobytes (KB).
Disk Space Sensor (Local or Remote)
The Disk Space sensor can monitor the disk space on either a local drive or
network shares.
User Manual IPCheck Server Monitor 5
Sensor Types in Detail • 91
The following field is particular to this sensor:
•
Disk / Share – enter the drive name of a local disk (C, D, etc.) or a
shared name in UNC notation (\\machine\share)
IPCheck Server Monitor will go into an error state if the drive does not exist or
is removed while being monitored.
Furthermore, the following checks can be applied:
•
Lower Disk Space Error Limit (MB) – Sensor will go into an error
state if the current disk space is below this value. Enter ‘-1’ to
disable the check
•
Upper Disk Space Error Limit (MB) – Sensor will go into an error
state if the current disk space is above this value. Enter ‘-1’ to
disable the check
•
Lower Disk Space Warning Limit (MB) – Sensor goes into a
warning state if the current disk space is below this value. Enter ‘1’ to disable the check
•
Upper Disk Space Warning Limit (MB) – Sensor goes into a
warning state if the current disk space is above this value. Enter ‘1’ to disable the check
Note: These values are in Megabytes (MB).
92 • Sensor Types in Detail
User Manual IPCheck Server Monitor 5
Event Log Sensor (Local or Remote)
The system sensor "Event Log" monitors the Windows event log on any
accessible computer in the network.
The following fields are particular to this type of sensor and decide when the
sensor can trigger a notification. To trigger the notification all fields must match
with an entry (that was added since the last sensor request) from the selected
event log. An empty field means 'match every entry'. These fields reflect the
corresponding values in the event log.
•
Log File: Choose one of the following: Application, System,
Security.
•
Machine Name: Enter the name of the computer where the Event
Log to be monitored is located (leave empty for local machine).
•
Event Type: Select which event type can trigger an On Change /
Trigger notification.Choose one of the following: Any, Error,
Warning, Information, Audit Success, Audit Failure.
•
Event Source: Select which program can trigger an On Change /
Trigger notification (leave empty for any).
•
Event Category: Select which event category can trigger an On
Change / Trigger notification (leave empty for any). Attention:
May not work with a remote event log sensor!
•
Event User: Select the user whose events can trigger an On Change
/ Trigger notification (leave empty for any). Attention: May not
work with a remote event log sensor!
•
Event Computer: Select the computer whose events can trigger a
DOWN sensor state (leave empty for any).
•
Event Message: Enter a string (case insensitive) which the event
message has to contain to trigger an On Change / Trigger
notification (leave empty for any). Attention: Remote event log
messages and messages from the security event log may have a
different content as found in the Windows Event Viewer.
Please note:
User Manual IPCheck Server Monitor 5
•
Only those events are monitored that are added since the start of
the sensor request. Older event log entries do not trigger
notifications.
•
Only "On change" notifications are triggered.
•
Only one notification is triggered for events between two scans of
the sensor, even if there was more than one event. This notification
is triggered for the first event after the scan prior to the actual scan.
Sensor Types in Detail • 93
There is currently no way of triggering one notification for each
event.
SNMP Sensors
The SNMP protocol (short for Simple Network Management Protocol) is used
by many network devices to manipulate or request information. The most
common use of SNMP is monitoring of bandwidth usages.
SNMP Version 1, 2c and 3
IPCheck Server Monitor supports three versions of the SNMP protocol:
•
•
•
SNMP Version 1: The oldest and most basic version of SNMP
•
Pros: Supported by most devices that are SNMP compatible;
simple to set up
•
Cons: Limited security as it only uses a simple password
(“community string”) and data is sent in clear text
(unencrypted); should only be used inside LANs behind
firewalls, not in WANs; only supports 32bit counters which is
not enough for bandwidth monitoring with high loads of some
gigabits/second
SNMP Version 2c: Adds 64 bit counters
•
Pros: Supports 64 bit counters to monitor bandwidth usage in
networks with gigabits/second loads
•
Cons: Limited security (same situation as with SNMP V1)
SNMP Version 3: Adds authentication and encryption
•
Pros: Offers user accounts and authentication for multiple
users and optional encryption of the data packets, which makes
it much more secure; plus all advantages of Version 2c
•
Cons: none
It is important to know that if you select an SNMP version which is not
supported by the server or device that you want to monitor you will receive an
error message. Unfortunately most of the time these error messages are not
explicitly telling you about the incorrect SNMP version (they say only
something like “cannot connect” or similar). The same situation exists if
community string, usernames and passwords are incorrect.
What is an “SNMP Community String”?
The “SNMP Community string” is like a user id or password that allows access
to a router's or other device's statistics. IPCheck Server Monitor sends the
community string along with all SNMP requests. If the community string is
correct, the device responds with the requested information. If the community
string is incorrect, the device simply discards the request and does not respond.
Note: SNMP Community strings are used only by devices which support
SNMPv1 and SNMPv2c protocol. SNMPv3 uses username/password
authentication, along with an encryption key.
By convention, most SNMPv1-v2c equipment ships from the factory with a
read-only community string set to "public". It is standard practice for network
94 • Sensor Types in Detail
User Manual IPCheck Server Monitor 5
managers to change all the community strings to customized values in the device
setup.
SNMP Sensor Types
There are four different SNMP sensor types in IPCheck Server Monitor:
•
SNMP Traffic sensors: Used to monitor the bandwidth/total traffic
going in and out of a device through one port (e.g. network card,
switch port, etc.) .This is the most common usage of SNMP (works
via the “MIB-2 standard”).
•
SNMP Advanced sensors: Used to monitor specific OID values
(you must supply the OID value manually)
•
SNMP Helper sensors: Paessler SNMP Helper is a system-level
software program that runs on a Windows 2000, XP, or 2003
computer system that allows a system running IPCheck Server
Monitor to collect performance information remotely for several
thousand Windows Performance Counters, using the SNMP
protocol. See the section “Paessler SNMP Helper” for more details.
•
OID/MIB Library sensors: PRTG comes with several
preconfigured libraries (so called “OIDLIBs”) for various device
types that helps you to monitor CPU loads, disk usage, or
temperatures. Additionally you can convert most MIB files from
device vendors into OIDLIBs using Paessler’s MIB Import Tool to
create many more sensors. See the section “Importing MIBs using
Paessler MIB Importer and Converter” for more details.
All types are explained in detail in the following sections.
Creating a New SNMP Sensor
When creating SNMP sensors you must already enter some additional data on
the Create New Sensor page:
User Manual IPCheck Server Monitor 5
Sensor Types in Detail • 95
First select between SNMP Traffic, Advanced, SNMP Helper or OIB Library
(see previous section for details).
Then select the highest SNMP Version which is supported by the server or
device.
For SNMP Version 1 and SNMP Version 2c please enter the SNMP Community
String. In most cases this value is "public", check with the admin of the device
you want to monitor if this value was changed for that device.
For SNMP Version 3 please also enter Authenication mode, username, password
and encryption key.
The standard value for the SNMP Port is 161, but if you use other values please
enter your value here, too.
Common Settings for all SNMP Sensor Types
The following settings are available for all SNMP based sensors:
96 • Sensor Types in Detail
•
Community String—the SNMP public access string (usually
"public"), used for SNMP V1 and V2c
•
SNMP Port—the UDP port used for SNMP by your device
(usually "161")
•
Connection Info—the status info which is read directly from the
device (read only!).
•
Lower valid limit—enter the minimum valid value (if the
measured value is below this limit the sensor will enter an error
state). Enter –1 to disable the check.
•
Upper valid limit—enter the maximum valid value (if the
measured value is above this limit the sensor will enter an error
state). Enter –1 to disable the check.
User Manual IPCheck Server Monitor 5
•
Low—enter the lower warning value (if the measured value is
below this limit the sensor will enter a warning state). Enter –1 to
disable the check.
•
High—enter the high warning value (if the measured value is
above this limit the sensor will enter a warning state). Enter –1 to
disable the check.
SNMP Traffic Sensor
Using the so called "Internet MIB" this sensor monitors the traffic on one port of
the server (or router). When you create a new SNMP traffic sensor actually two
new sensors will be created, one for the data flowing into the device and one for
the data going out of the device.
Parameters include:
•
Interface/Port—select the port or interface to monitor
•
Traffic direction—select whether to monitor outgoing or
incoming traffic
•
Monitored Value—select what value to monitor: Bandwidth
(kbit/s), Unicast Packets/s, Non-Unicast-Packets/s, Errors/min
SNMP Advanced Sensor
With the SNMP advanced sensor you can monitor any OID value of an SNMP
enabled device. OIDs are the indices of the values that are available on a device.
The following parameters are specific to this sensor:
•
Custom OID—enter the desired OID (e.g. "1.2.3.4.6.3.4")
•
Custom Indicator—Enter an 'Indicator' string here
(Bandwidth, Temperature etc.) for displaying purposes
•
Custom Units—Enter a 'Unit' string here (ms, Kbyte, etc.) for
displaying purposes
•
Custom Value Type—Select 'Gauge' if you want to see
absolute Values (i.e. Temperature) or 'Delta' for difference
divided by time period (i.e. Bandwidth)
SNMP Helper Sensor
Paessler SNMP Helper enables IPCheck Server Monitor to collect in-depth
performance information from Windows servers and workstations. Up to several
thousands parameters and performance counters of a PC can be monitored with
just a few mouse clicks.
Important: The SNMP Helper software –Freeware as well as commercial
editions – must be installed on the Windows system that you want to monitor –
not the machine that runs IPCheck Server Monitor.
See the section “Paessler SNMP Helper” for more details.
The sensors are divided into several sections, when creating a new sensor you
must choose one: from the list:
User Manual IPCheck Server Monitor 5
Sensor Types in Detail • 97
As soon as you click OK IPCheck Server Monitor will begin to scan the server
for available sensors, which can take up to a few minutes:
After the scan you can choose the value that you want to monitor from the
extensive list of available values which is shown in a hierarchical list:
Choose a value, set the other settings as desired and click ok to create this new
sensor.
OID/MIB Library Sensors
Vendors of SNMP enabled hardware and software will usually deliver so-called
MIB files which contain a list of the available values that can be accessed via
SNMP. These files are usually very complex and often incompatible because the
standard for their format has changed very often.
Instead of MIB files IPCheck Server Monitor uses OIDLIB files which are based
on MIB files but have been pre-processed by Paessler’s MIB Converter software
(if you want to import your own MIB files please see “Importing MIBs using
Paessler MIB Importer and Converter”).
For your convenience IPCheck Server Monitor already includes a constantly
growing selection of OIDLIB files for various devices.
98 • Sensor Types in Detail
User Manual IPCheck Server Monitor 5
To create a sensor based on an OIDLIB you must choose the desired OIDLIB
from the dropdown on the Create Sensor page.
IPCheck Server Monitor will then scan the device and will show a list of sensors
that are available on the device for you too choose from.
Technical Details for EXE and DLL Custom Sensors
The EXE file or DLL file must be placed in the "custom" subfolder of the
installation folder of IPCheck Server Monitor (usually c:\program files\ipcheck
server monitor 5\custom).
Note: If you place a new EXE/DLL file into the custom directory you must
restart the IPCheck Server Monitor web server service.
Sample projects for Custom Sensors can be found in the IPCheck Server
Monitor installation directory and are available in the Knowledge Base on the
Paessler Website at www.paessler.com/support.
EXE Sensors
Every time the sensor is run, the selected EXE file is executed. The string
entered in the parameter field of the sensor's settings is placed in the command
line. The EXE file must send the results to the Standard OUT. The data must be
in the following format:
value:message
Value has to be a 32bit integer and will be used as the resulting value for this
sensor (e.g. bytes, milliseconds, etc.), message can be any string and will be
stored in the database.
The exit code of the EXE has to be one of the following values:
•
0 ok
•
1 warning
•
2 system error (e.g. a network/socket error)
•
3 protocol error (e.g. web server returns a 404)
•
4 content error (e.g. a webpage does not contains a required word)
If the EXE does not return control to the IPCheck Server Monitor process it is
killed as soon as the timeout value set for this sensor is reached.
You can test the EXE file you want to use for the sensor very easily on the
command line (cmd.exe). Simply start the EXE file and pipe the results into a
file, e.g.:
sensorexe parameter > result.txt
The results are then written into the file result.txt and you can check the results
with notepad or any other text editor.
DLL sensors
Every time the sensor is to be checked the selected DLL file is called. The DLL
must export one function:
function perform(para,msg:pchar):integer; stdcall;
User Manual IPCheck Server Monitor 5
Sensor Types in Detail • 99
para and msg are zero terminated strings. The allocated buffer for msg is 255
bytes, the DLL must make sure that fewer bytes are returned. Msg must be in the
following format:
value:message
Value has to be an 32 bit integer and will be used as the resulting value for this
sensor (e.g. bytes, milliseconds, etc.), message can be any string and will be
stored in the database.
The integer return value of the perform function has to be one of the following
values:
•
0 ok
•
1 warning
•
2 system error (e.g. a socket error)
•
3 protocol error (e.g. html returns a 404)
•
4 content error (e.g. a webpage contains not a required word)
Warning: If the function call in the DLL does not return control it can block the
system. Make sure to handle your own timeouts and build in a reliable error
management. For this reason EXE sensors are recommended.
Technical Details for Script and TCP Script Custom
Sensors
The script must have the extension ".ITC" and must be placed in the "scripts"
subfolder of the installation folder of IPCheck Server Monitor (usually
c:\program files\ipcheck server monitor 5\custom).
Note: If you place a new ITC file into the custom directory you must restart the
IPCheck Server Monitor web server service.
Sample projects for Custom Sensors can be found in the IPCheck Server
Monitor installation directory and are available in the Knowledge Base on the
Paessler Website at www.paessler.com/support.
Script Basics
Both custom script sensors use VBScript syntax.
The result of the sensor must be written into the object sensor which is already
defined.
The object sensor has several properties:
100 • Sensor Types in Detail
•
sensor.status: Current status of the sensor (values: srOK,
srWarning, srError)
•
sensor.result_value: Value of the sensor. If you don’t set this
value ipcheck uses the execution time of the script (Note: was
sensor.resultvalue before V5.3)
•
sensor.errorstring: Message of the sensor
•
sensor.errortype: Detailed error info (values: etNone (no error),
etException (unexpected error occurred), etProtocol (error on
protocol level), etContent (error in the content, e.g. a required
word missing). This value is only necessary If status is srError
User Manual IPCheck Server Monitor 5
There are three custom parameters that can be specified for this sensor by the
user in the web interface. They can be accessed in the script by using the
constants data1, data2 and data3.
For the TCPScript sensor two functions are defined: readln and writeln. The
script sensor establishes a TCP connection on the selected port to the server. The
script can then read data from the port using the readln function and write data
using writeln to send data to the server.
Supported Script Grammar
<program>:[( <globaldecl>)][( {<subroutine>|<function>})] <main>
<main>:[( <statement>[ :])]
<subroutine>:sub <label> <inputargs>{ <forward>|( <statement>[ :]) end sub}
<function>:function <label> <inputargs>{ <forward>|( <statement>[ :]) end
function}
<inputargs>:["(" {<byref>|<byval>}[( , {<byref>|<byval>})] ")"]
<forward>:forward
<byref>:byref <id>
<byval>:[byval] <id>
<vardecl>:dim <id>[( , <id>)]
<globaldecl>:{public|private|dim} <id>[( , <id>)]
<statement>:{<vardecl>|<globaldecl>|<if>|<for>|<do_loop>|<whileend>|<assig
n>|<try>|<call>|<case>|<exit>|<with>}
<call>:<id><arg_list><indexing><call_code>[.<call>]
<call_code>:
<data_val>:<id><arg_list><indexing><data_val_code>[.<data_val>]
<data_val_code>:
<data_ref>:<id><arg_list><indexing><data_ref_code>[.<data_ref>]
<data_ref_code>:
<arg_list>:[ "(" [<expression> [(, <expression> )]]")"]
<indexing>:[( "[" <expression> [(, <expression> )]"]")]
<assign>R:["set "] <data_ref> = <expression>
<push_output>:
<for>:<for_control>[ step <step>][( <statement>[ :])] next
<for_control>:for <id> = <expression> to <expression>
<step>:[{-|+}](#)[.(#)][e[{-|+}](#)]
<do_loop>:do {<test_loop>|<loop_test>}
<test_loop>:<test_loop_expr>[( <statement>[ :])] loop
<test_loop_expr>:{<while>|<until>} <expression>
<loop_test>:[( <statement>[ :])] loop <loop_test_expr>
<loop_test_expr>:{<while>|<until>} <expression>
<while>:while
<until>:until
<whileend>:while <whileend_expr>[( <statement>[ :])] end while
<whileend_expr>:<expression>
<if>:if <expression> <then> [<else>] end if
<then>:then( <statement>[ :])
<else>:else( <statement>[ :])
<expression>:{[<unary>]{<data_val>|"(" <expression>
")"}|<hex>|<real>|<string>|<vector>}[( <operator> {[<Unary>]{<data_val>|"("
<expression> ")"}|<hex>|<real>|<string>|<vector>})]
<operator>:{^|*|/|and~|+||or~|"<>"|">="|"<="|"="|">"|"<"|"&"|div~|mod~|xor~|shl~|shr~|is~}
<unary>:{not~ |-|+}
<label>:<id>
<id>:{@|_}[({@|#|_})]
<real>:[{-|+}](#)[<frac>][<exp>]
<hex>:"0x"({#|a|b|c|d|e|f})
<frac>:.(#)
<exp>:e[{-|+}](#)
User Manual IPCheck Server Monitor 5
Sensor Types in Detail • 101
<string>:$
<vector>:"[" [<expression> [(, <expression> )]]"]"
<try>:try <try_statements> {<finally>|<except>} <try_upshot> end[ :]
<finally>:finally
<except>:except
<try_statements>:[( <statement>[ :])]
<try_upshot>:[( <statement>[ :])]
<case>:select case <case_expr> <case_branch> end select
<case_expr>:<expression>
<case_branch>:[{case else( <statement>[ :])|case <case_test>[( , <case_test>)]
<case_match>[ <case_branch>]}]
<case_test>:<expression>
<case_match>:[( <statement>[ :])]
<exit>:exit {<exit_sub>|<exit_function>|<exit_do>|<exit_for>}
<exit_sub>:sub
<exit_function>:function
<exit_do>:do
<exit_for>:for
<with>:with <with_obj>[( <statement>[ :])] end with
<with_obj>:<data_val>
Script String Functions
Copy(S; Index, Count: Integer): string
Copy returns a substring containing Count characters or elements starting at
S[Index].
s=Copy("testtext",1,4)
Delete(var S: string; Index, Count:Integer)
Delete removes a substring of Count characters from string S starting with
S[Index].
a="testtexttext"
Delete(a,4,4)
Insert(Source: string; var S: string; Index: Integer)
Insert merges Source into S at the position S[index].
a="testtexttext"
Insert("text",a,5)
Pos(Substr: string; S: string): Integer
Pos searches for a substring, Substr, in a string, S. Substr and S are string-type
expressions. Pos searches for Substr within S and returns an integer value that is
the index of the first character of Substr within S. Pos is case-sensitive. If Substr
is not found, Pos returns zero.
a=pos("sub","textsubtest")
Length(a:string):integer
Length returns the number of characters actually used in the string or the number
of elements in the array.
a=length("teststring")
UpperCase(s:string) :string
UpperCase returns a copy of the string S, with the same text but with all 7-bit
ASCII characters between 'a' and 'z' converted to uppercase. To convert 8-bit
international characters, use AnsiUpperCase instead.
102 • Sensor Types in Detail
User Manual IPCheck Server Monitor 5
a=UpperCase("Test")
LowerCase(s:string):string
LowerCase returns a string with the same text as the string passed in S, but with
all letters converted to lowercase. The conversion affects only 7-bit ASCII
characters between 'A' and 'Z'. To convert 8-bit international characters, use
AnsiLowerCase.
a=LowerCase("Test")
CompareStr(s1,s2:string):integer
CompareStr compares S1 to S2, with case-sensitivity. The return value is less
than 0 if S1 is less than S2, 0 if S1 equals S2, or greater than 0 if S1 is greater
than S2. The compare operation is based on the 8-bit ordinal value of each
character and is not affected by the current locale.
b=CompareStr("Test","test")
CompareText(s1,s2:string):integer
CompareText compares S1 and S2 and returns 0 if they are equal. If S1 is greater
than S2, CompareText returns an integer greater than 0. If S1 is less than S2,
CompareText returns an integer less than 0. CompareText is not case sensitive
and is not affected by the current locale.
b=CompareText("Test","test")
AnsiUpperCase(s:string):string
AnsiUpperCase returns a string that is a copy of S, converted to upper case. The
conversion uses the current locale. This function supports multi-byte character
sets (MBCS).
a=AnsiUpperCase("Test")
AnsiLowerCase(s:string):string
AnsiLowerCase returns a string that is a copy of the given string converted to
lower case. The conversion uses the current locale. This function supports multibyte character sets (MBCS).
a=AnsiLowerCase("Test")
AnsiCompareStr(s1,s2:string):integer
AnsiCompareStr compares S1 to S2, with case sensitivity. The compare
operation is controlled by the current locale. The return value is less than 0 if S1
is less than S2, 0 if S1 equals S2, or greater than 0 if S1 is greater than S2.
Note: Most locales consider lowercase characters to be less than the
corresponding uppercase characters. This is in contrast to ASCII order, in which
lowercase characters are greater than uppercase characters. Thus, setting S1 to
'a' and S2 to 'A' causees AnsiCompareStr to return a value less than zero, while
CompareStr, with the same arguments, returns a value greater than zero.
b=AnsiCompareStr("Test","test")
AnsiCompareText(s1,s2:string):integer
AnsiCompareText compares S1 to S2, without case sensitivity. The compare
operation is controlled by the current locale. AnsiCompareText returns a value
less than 0 if S1 < S2, a value greater than 0 if S1 > S2, and returns 0 if S1 = S2.
b=AnsiCompareText("Test","test")
Trim(s:string):string
Trim removes leading and trailing spaces and control characters from the given
string S.
User Manual IPCheck Server Monitor 5
Sensor Types in Detail • 103
a=Trim("
Test
")
TrimLeft(s:string):string
TrimLeft returns a copy of the string S with leading spaces and control
characters removed.
a=TrimLeft("
Test
")
TrimRight(s:string):string
TrimRight returns a copy of the string S with trailing spaces and control
characters removed.
a=TrimLeft("
Test
")
IntToStr(a:integer):string
IntToStr converts an integer into a string containing the decimal representation
of that number.
b=IntToStr(12)
IntToHex(value:integer;digits:integer):string
IntToHex converts a number into a string containing the number's hexadecimal
(base 16) representation. Value is the number to convert. Digits indicates the
minimum number of hexadecimal digits to return.
a=IntToHex(12,4)
StrToInt(s:string):integer
StrToInt converts the string S, which represents an integer-type number in either
decimal or hexadecimal notation, into a number.
a=StrToInt("12")
StrToIntDef(s:string;default:integer):integer
StrToIntDef converts the string S, which represents an integer-type number in
either decimal or hexadecimal notation, into a number. If S does not represent a
valid number, StrToIntDef returns Default.
a=StrToIntDef("12",1)
FloatToStr(a:float):string
FloatToStr converts the floating-point value given by Value to its string
representation. The conversion uses general number format with 15 significant
digits.
s=floattostr(1.234)
Script Date/Time Functions
The script language uses the following definition for date and time values: The
integral part of a value is the number of days that have passed since 12/30/1899.
The fractional part of a value is fraction of a 24 hour day that has elapsed.
Following are some examples of TDateTime values and their corresponding
dates and times:
0
12/30/1899 12:00 am
2.75
1/1/1900 6:00 pm
-1.25
12/29/1899 6:00 am
35065
1/1/1996 12:00 am
To find the fractional number of days between two dates, simply subtract the two
values, unless one of the TDateTime values is negative. Similarly, to increment a
date and time value by a certain fractional number of days, add the fractional
number to the date and time value.
104 • Sensor Types in Detail
User Manual IPCheck Server Monitor 5
EncodeDate(Year, Month, Day: Word): DateTime
Returns a TDateTime value from the values specified as the Year, Month, and
Day parameters. The year must be between 1 and 9999. Valid Month values are
1 through 12. Valid Day values are 1 through 28, 29, 30, or 31, depending on the
Month value. For example, the possible Day values for month 2 (February) are 1
through 28 or 1 through 29, depending on whether or not the Year value
specifies a leap year.
d=EncodeDate(2005,6,5)
EncodeTime(Hour, Min, Sec, MSec: Word): DateTime
Encodes the given hour, minute, second, and millisecond into a DateTime value.
Valid Hour values are 0 through 23. Valid Min and Sec values are 0 through 59.
Valid MSec values are 0 through 999. The resulting value is a number between 0
and 1 (inclusive) that indicates the fractional part of a day given by the specified
time or (if 1.0) midnight on the following day. The value 0 corresponds to
midnight, 0.5 corresponds to noon, 0.75 corresponds to 6:00 pm, and so on.
d=EncodeTime(19,5,4,200)
DecodeDate(Date: DateTime; var Year, Month, Day:
integer)
Breaks the value specified as the Date parameter into Year, Month, and Day
values.
y=0
m=0
d=0
DecodeDate(35065,y,m,d)
DecodeTime(Time: DateTime; var Hour, Min, Sec, MSec:
Word)
DecodeTime breaks the object specified as the Time parameter into hours,
minutes, seconds, and milliseconds.
h=0
m=0
s=0
ms=0
DecodeTime(1.978,h,m,s,ms)
DayOfWeek(Date: TDateTime): Integer
Returns the day of the week of the specified date as an integer between 1 and 7,
where Sunday is the first day of the week and Saturday is the seventh.
a=DayOfWeek(35065)
Date:DateTime
Use Date to obtain the current local date as a TDateTime value. The time portion
of the value is 0 (midnight).
d=date
Now:DateTime
Returns the current date and time, corresponding to the sum of the value returned
by the global Date and Time functions. Now is accurate only to the nearest
second.
t=now
DateToStr(Date: TDateTime): string
Use DateToStr to obtain a string representation of a date value that can be used
for display purposes.
User Manual IPCheck Server Monitor 5
Sensor Types in Detail • 105
DateToStr(35065.3455)
TimeToStr(Date: TDateTime): string
Use TimeToStr to obtain a string representation of a time value that can be used
for display purposes.
TimeToStr(2445.3455)
DateTimeToStr(Date: TDateTime): string
Use DateTimeToStr to obtain a string representation of a date and time value
that can be used for display purposes.
DateTimeToStr(35065.3455)
Script Arithmetic Functions
Round(a:float):integer
Round function rounds a real-type value to an integer-type value.
a=Round(12.5)
Trunc(a:float):integer
the Trunc function truncates a real-type value to an integer-type value.
a=Trunc(12.5)
Dec(a:integer or float)
Dec subtracts one from a variable.
Dec(a)
Inc(a:integer or float)
Inc adds one to the variable.
Inc(a)
Random
Random returns a random number within the range 0 <= X < 1.
A=random(10)
Other Script Functions
snmpget
Sends an SNMP request to the IP of the associated server and returns a string
result=snmpget("public","1.3.6.1.2.1.1.3.0")
'check for errors (always begins with the word "ERROR")
if pos("ERROR",result)=1 then
sensor.errorstring=result
sensor.errortype=etprotocol
else
mynumber=strtoint(result)
Beep
Beep generates a message beep
Beep
106 • Sensor Types in Detail
User Manual IPCheck Server Monitor 5
Using the Control Panel
The Administration Control Panel provides complete control over your locallyinstalled IPCheck Server Monitor application.
To open the Administration Control Panel
•
Select the IPCheck Admin control panel option from your IPCheck
Server Monitor Group in the Start Menu.
•
Or choose the IPCheck Server Monitor Icon from the Windows
Control Panel
The IPCheck Server Monitor control panel provides access to a number of key
application configuration features including:
User Manual IPCheck Server Monitor 5
•
System
•
Email
•
Templates
•
Messaging
•
Sensors
•
Tools
Using the Control Panel • 107
•
Administrator
•
License.
Control Panel System Tab
The System Window defines a number of application-level parameters
including
•
•
108 • Using the Control Panel
Monitoring Database
•
Keep monitoring data for—enter the number of days the
historic monitoring data should be kept in the database before
it is discarded. This will be the length of time for which you
can run reports
•
Export Data to CSV at midnight – check this field if you
would like to export the monitoring data from IPCheck’s
internal database format to standard CSV files (e.g. to analyze
the monitoring data with other analysis tools). This process
will be executed shortly after midnight, every day and exports
all available monitoring data to CSV files into the database
folders (subfolders of the IPCheck Server Monitor installation
folder).
•
Export Data to IPCLOG table at midnight- if you enable
this checkbox IPCheck will export the monitoring results into
the ipclog table in the firebird SQL database at midnight
•
Note: For both exports you will find further documentation of
the data formats in the Paessler Knowledgebase at
www.paessler.com/support
Webserver
User Manual IPCheck Server Monitor 5
•
Port—enter the port number through which the web interface
of IPCheck Server Monitor will be available for web browsers.
Usually this is port 80, but if you already run a web server on
this machine you may need to choose another port like e.g. 81,
8080. Note: If the port you choose here is already used by
another process at the time when IPCheck Server Monitor
starts, another port in the range between 8080 and 8099 will
automatically be selected!
•
Note: If you also run IIS5 or IIS6 on a machine with multiple
IPs you may need to apply special configuration to the IIS so
you can user IPCheck on port 80, see the Paessler
Knowledgebase at www.paessler.com/support
•
Domain—enter the domain name or the IP address through
which this server is reachable. This address will be used in
emails and notifications to provide clickable links into the web
interface.
•
Local IP—use the drop-down to select the IP Address of the
server on which you are installing IPCheck Server Monitor.
•
Enable SSL—check this box to enable monitoring over a
Secure Sockets Layer connection (Note: port 443 may not
already be used on the server for the selected IP!)
•
Status URL Password— Enter a string of you choice that
secures the system status webpage (see “Reviewing IPCheck’s
System Status”)
Control Panel Email Tab
The Email Window defines how IPCheck Server Monitor sends and receives
emails
•
SMTP Server
•
User Manual IPCheck Server Monitor 5
Server—the domain name or IP Address of the SMTP server
through which IPCheck Server Monitor sends email. This mail
Using the Control Panel • 109
server must be configured as an SMTP relay that accepts mails
from IPCheck Server Monitor and forwards the mails to the
recipients.
•
•
HELO Ident—the string IPCheck Server Monitor sends to the
mailserver for identification. Changes are only necessary for
special mailservers, using the default should be fine.
•
Username—if the mailserver needs user authentication to
accept emails enter the username of a valid account on the
SMTP server
•
Password—if the mailserver needs user authentication to
accept emails enter the password of the account above
•
Optional SMTP Backup Server—enter this information if
you want to provide a second SMTP in case the first SMTP
server becomes unavailable
E-Mail “From” Fields—Enter the email addresses and clear text
names IPCheck Server Monitor should use as "FROM" addresses
when sending emails
•
User Account—for emails sent to users regarding their
accounts
•
User Notification—for notification emails sent to users
•
Admin Account—for emails sent to the admin
•
Admin Notification—for notification emails sent to the admin
Control Panel Templates Tab
110 • Using the Control Panel
•
The Templates Window allows you to change the content and the
footers of all emails sent out by IPCheck Server Monitor.
•
Use the dropdown field to choose a template and edit the content in
the lower edit field. In most cases using the defaults should be fine.
User Manual IPCheck Server Monitor 5
You can use the following placeholders in the templates (note: not all
placeholders are available in all templates):
•
%USRNAME—The user name of the current user account
•
%DATE—The current date and time
•
%ACCOUNT—The email address (=account name) of the current
user account
•
%PASS—The password of the current user account (use with
caution!)
•
%ADMMAIL—The email address of the administrator responsible
for this installation of IPCheck Server Monitor
•
%KIND—The type of the newly created sensor(ping, http, etc.)
•
%HOME—The URL of the homepage of the web interface
•
%VERSION—Version number of the IPCheck Server software
currently installed
You can also access the address information of the current user with the
following placeholders:
•
%ADDRCOMPANY
•
%ADDRSTREET
•
%ADDRZIP
•
%ADDRCITY
•
%ADDRCOUNTRY
•
%ADDRSTATE
•
%ADDRPHONE
•
%ADDRFAX
•
%ADDRVATID
Note: There is a special format for the daily/weekly/monthly report mail
(templates "Mail to users – Report for all sensors text" and "Mail to users –
User Manual IPCheck Server Monitor 5
Using the Control Panel • 111
Report for all sensors HTML"). You can change the text of the mail template as
you wish but you have to make sure that the number and sequence of the
brackets [] is not changed!
Here is a sample template:
Report from %RSTART to %REND
[
***********************************************************
Group: %GROUP
***********************************************************
][
-------------------------------------------------------Server: %SERVER
-------------------------------------------------------][
Sensor: %SENSOR, %KIND
Good Requests:
%GOOD (=%GPCT)
Uptime:
%UTIME
Failed Requests:
%FAIL (=%FPCT)
Downtime:
%DTIME
Average:
%AVG
]
The placeholders are:
112 • Using the Control Panel
•
%RSTART: The date&time of the beginning of this report
•
%REND: The date&time of the ending of this report
•
%GROUP: The name of the current group of servers
•
%SERVER: The name of the current server
•
%SENSOR: The name of the current sensor
•
%KIND: The sensor type of the current sensor
•
%GOOD, %GPCT: The number and the percentage of good
requests
•
%FAIL,%FPCT: The number and the percentage of failed requests
•
%UTIME: Uptime
•
%DTIME: Downtime
•
%AVG: The average value of this sensor (usually the average
request time)
User Manual IPCheck Server Monitor 5
Control Panel Messaging Tab
The Messaging Window allows you to change the methods SMS and ICQ
messages are sent with. Important: You need to set up an account with both
service providers in order to use these two options!
•
•
User Manual IPCheck Server Monitor 5
Service for sending SMS and pager messages
•
Service—use the drop-down menu to select the SMS service
(in the current version only the service of
www.smsexchange.com, www.bulksms.co.uk, and
www.smsdriver.com are supported, more service options will
be implemented later). Choose “custom” to enter your own
URL that will be called to send a SMS (use the placeholders
shown in the URL). If the URL returns “200 OK” then
IPCheck will regard the message as sent.
•
User—enter the username for your account with this service
•
Password—enter the corresponding password
Account for sending ICQ messages
•
ICQ#—enter the ICQ number IPCheck Server Monitor should
use (Note: This is NOT your personal ICQ number! You
must create a separate ICQ account for IPCheck Server
Monitor in order to send ICQ messages to your personal
account!)
•
Password—enter the corresponding password for the ICQ
account
Using the Control Panel • 113
Control Panel Sensors Tab
The Sensors Window allows you to set various options regarding the sensors.
•
•
114 • Using the Control Panel
Available options for interval selection of sensors—this allows
you to add, edit, or delete the IPCheck Server Monitor the time
intervals that are available for users in the web interface when
creating and editing sensors. Usually this option will only be edited
in a multi user environment of IPCheck Server Monitor.
•
Add/Edit—click this button to add a new interval. This will
open the Interval Window.
•
Description—a description of the interval
•
Seconds—use the up/down arrows to set how long the interval
should be or enter a number directly
Limit open sensor requests—Using this setting you can limit the
number of sensor requests that have been sent out and not answered
yet. Sometimes (e.g. if you are running your monitoring over a
slow internet connection) limiting this number can enhance
monitoring reliability. Fewer requests are sent out simultaneously
to reduce network load. But at the same time the sensors will be
monitored at longer intervals because fewer requests are sent out at
once.
User Manual IPCheck Server Monitor 5
Control Panel Probes Tab
Using Local and Remote probes you can set up a multi location monitoring using
IPCheck Server Monitor. See the "Multi Location Monitoring Using Remote
Probes" section later in the manual for details.
Note: This feature is not available in the Freeware Edition!
•
Local/Remote Probe Configuration—Using the Add/Edit/Delete
buttons you can edit the list of available probes that the user can
select in the web interface.
•
Probe Password—Make sure to protect your remote probe by
using a password which must be entered here and on the remote
probe machine
•
Probe Settings For Local Machine—Using these settings you can
change the settings for the Local Probe and the communication
between the webserver service and probe service.
•
User Manual IPCheck Server Monitor 5
•
Local IP—This is the IP address that the local
probe uses to send out the monitoring requests
•
Port—This is the TCP/IP port number that will
be used by the webserver service to contact the
probe service.
Note 1: Make sure that these ports are enabled if you run a personal
firewall on this machine.
Using the Control Panel • 115
Control Panel Tools Tab
IPCheck Server Monitor utilizes a built-in webserver and scanner service that is
installed in the Windows System upon application setup (aka "NT service"). The
Tools Tab provides you the ability to start, stop, install, and deinstall these
services.
To Stop a service
•
Click the Stop Button. This will halt the service.
To Start a service
•
Click the Start Button. This will start the service
To Install/Deinstall a service (for experienced admins only)
•
Note: This does not deinstall the IPCheck Server Monitor
software from this machine. Use Control Panel's "Software"
applet do deinstall IPCheck Server Monitor
•
Click the Deinstall Button. This will deinstall the service
•
Click the Install Button. This will install the service
•
Note: if you deinstall a service IPCheck Server Monitor will
not work anymore and will not be started automatically when
the system is rebooted.
To keep the system clock up to date you can enter a NTP time server in the time
server field. IPCheck Server Monitor will synchronize the time of the local
machine to this server roughly every 60 minutes.
116 • Using the Control Panel
User Manual IPCheck Server Monitor 5
Control Panel Administrator Tab
The Administrator Window controls the administrative credentials and how
that administrator will be notified in the case of recorded errors.
•
•
•
Admin Account
•
Email—enter the email address of the administrator. This is
the username of the first user account. Use this account name
to log into the web interface for the first time. Note: Only this
account can access IPCheck Server Monitor’s administrative
features in the web interface.
•
Password—enter the password for the administrator.
Admin Notifications
•
Send To—enter the email address to which notifications will
be sent
•
BCC Notifications—you can check which notifications will
be sent to the email address
•
On Error—Sends an email to the admin for each error
notification sent to users
•
On Warning—Sends an email to the admin for each warning
notification sent to users
•
On OK—Sends an email to the admin for each OK
notification sent to users
•
On Escalation—Sends an email to the admin for each
escalation notification sent to users
•
On Change—Sends an email to the admin for each change a
user makes to his account
Notify About—specify when notifications will be sent
•
User Manual IPCheck Server Monitor 5
New User—Sends an email to the admin for each new user
that is created
Using the Control Panel • 117
•
New Sensor—Sends an email to the admin for each new
sensor that is created
•
Probe Up/Down—Sends an email to the admin whenever the
connection to a probe is lost or is recovered.
•
Update available—Sends an email to the admin when a newer
version of IPCheck Server Monitor is available
Control Panel Skinning Tab
In the skinning section you can select a skin to use for IPCheck Server Monitor.
If you have created your own skin it will also appear in the provided list.
IPCheck Server Monitor comes with one default skin:
IPCheck 2007:
118 • Using the Control Panel
User Manual IPCheck Server Monitor 5
Control Panel License Tab
The Licenses Window allows you to control the licenses of IPCheck Server
Monitor that are installed on the local machine. These licenses determine the
number of users you can utilize and the number of sensors you can monitor.
•
User Manual IPCheck Server Monitor 5
Application
•
Name—enter the name as provided to you upon purchase
•
Key—enter the key provided to you upon purchase
•
Check—click the Check Button to validate the name and key
•
User and Sensor Licenses—this provides information on installed
keys, users, and sensors
•
Add License—click this button to add a license for additional
users and sensors. This will bring up a window to enter the key.
Please enter the information you received upon purchase to add
more sensors and/or more users to the local installation.
•
Remove License—to remove a license, select it from the list and
click the Remove Button.
•
Buy License Online—click this button to purchase additional
licenses from the Paessler website.
Using the Control Panel • 119
Control Panel ISP Settings Tab
The ISP Settings Tab allows you change ISP related settings (ISP Edition only).
Here you can choose the sensor and notification types that are available to new
users by default. Later the admin can change these settings in the web interface
for each user.
In the Other ISP Settings section you can set the following settings:
•
Subscription: If you enable this checkbox unauthenticated visitors
to the IPCheck web interface can create new user accounts by
clicking on add account. Use this setting with caution!
•
Limit Sensors: The default number of sensors available to new
users.
•
Minimum Interval: The default minimum interval that is available
for new users
Later the admin can change the last two settings in the web interface for each
user.
120 • Using the Control Panel
User Manual IPCheck Server Monitor 5
Server and User Account
Administration
Web Based Administration vs. the Admin Control
Panel
There are two points of administration for IPCheck Server Monitor:
•
Admin Control Panel: This is a Windows program used to set
various, often technical aspects of your IPCheck Server Monitor
installation. E.g. the web server’s IP and port address, the SMTP
server and many other aspects are edited here. See the “Using the
Control Panel” section for details.
•
Web Based Administration: Using the web based administration
you mainly can manage the user accounts (not available in the
Freeware Edition).
It is important to understand these two entry points for administration!
Web Based Administration
Through the web-based administration you can:
•
Start and stop monitoring
•
Add new users
•
View and edit existing users
•
Delete users
•
Monitor the system status
Note: The multi user features are not available in the Freeware Edition.
To access the administrative features of the web-based interface
User Manual IPCheck Server Monitor 5
•
Please log into your account (see “Logging into your account using
the Web GUI”) using the admin account
•
After verifying your credentials, click the Administration link
from the menu toolbar.
Server and User Account Administration • 121
•
To start and stop the monitoring of all sensors click the Start/Stop
Button.
•
To refresh the dynamic user data (e.g. number of sensors of each
user in the table below) click on Refresh.
•
To add a new user to the system, click the Add User Link. This
opens the User Data Window. Enter all of the necessary
information in this window and select the OK Button when
finished.
•
To review the system status click the System Status link
Below these buttons you will see a list of user account active on your system.
If you are logged in with the admin account you will see an Administration link
in the top toolbar which brings you to the user account administration page.
Reviewing IPCheck’s System Status
To review the system’s status log in with an admin account, click on the top
menu’s Administration link, then click System Status:
122 • Server and User Account Administration
User Manual IPCheck Server Monitor 5
This status page gives you detailed information about the internal conditions of
IPCheck Server Monitor and the server’s system.
If there are serious problems you will see error messages in red.
Note: The password used in the URL can be set in the Control Panel, see
“Control Panel System Tab”.
Monitoring one IPCheck instance with another
instance of IPCheck
The system status URL can be used to easily monitor an instance from a copy of
IPCheck Server Monitor running on another system. This way you can be
notified if an IPCheck system fails.
Simply create an Advanced HTTP sensor, enter the URL of your System Status
page (e.g.
http://ipcheckserver/status?pass=815686003E9D4BDB8D8520B34545627C)
and put the word “_ERROR” (without the quotes) into the Response may not
include field.
As long as IPCheck runs fine the sensor will show an UP status, as soon as
IPCheck discovered a problem internally, it outputs an "XXX_ERROR" string
on the status page. This is caught by the sensor which will change to the DOWN
state.
You can even create several of these sensors monitoring the following strings:
User Manual IPCheck Server Monitor 5
•
CPULOAD_ERROR
•
WEBSERVER_ERROR
•
HEARTBEAT_ERROR
•
DISKSPACE_ERROR
•
PROBE_ERROR
•
ADMINDEP1_ERROR
•
ADMINDEP2_ERROR
Server and User Account Administration • 123
Most measurement points also can have a warning state that you may want to
monitor for. You can put the word “_WARNING” (without the quotes) into the
Response may not include field and you will be notified whenever a warning
shows up – or you can monitor the following specific strings:
•
CPULOAD_WARNING
•
WEBSERVER_WARNING
•
HEARTBEAT_WARNING
•
DISKSPACE_WARNING
•
PROBE_WARNING
•
ADMINDEP1_WARNING
•
ADMINDEP2_WARNING
Finally you can also monitor the other way round by scanning for “_OK” in the
HTML of the page – or you can monitor the following specific strings:
•
CPULOAD_OK
•
WEBSERVER_OK
•
HEARTBEAT_OK
•
DISKSPACE_OK
•
PROBE_OK
•
ADMINDEP1_OK
•
ADMINDEP2_OK
Working with Multiple Users
IPCheck Server Monitor supports more than one user account (except for the
freeware edition). Each user can set up his own groups, servers, and sensors and
can review his results independently from the other users.
This section explains how to create and edit user accounts. There also is a
section describing the specific settings available in the ISP Edition.
Multi User Features
The admin can create, edit and delete user accounts and can also review each
users sensors and settings.
Each user can make his monitoring results available to other users as read only
pages (not in the ISP edition). There is a checkbox for this on the user’s “My
Account” page.
Additional Features of the ISP Edition
With the ISP edition you have more control over the types of sensors and
notifications a user can use as well as the number and the intervals of sensors.
The admin can choose the sensor and notification types that are available to new
users by default and can also edit these settings for each user individually. Also
the minimum monitoring interval as well as an expiry date can be set for each
user.
124 • Server and User Account Administration
User Manual IPCheck Server Monitor 5
Editing User Accounts
To edit user accounts:
•
Please log into your account (see “Logging into your account using
the Web GUI”)
•
After verifying your credentials, click the Administration link
from the menu toolbar.
You will see a list of the user accounts. If many user accounts are available
please click one of the alphabetic links (or click Select all users) to see user
accounts.
For each user account you will see the number of sensors, requests per hours and
the last access date and time. You can click on the links on the right to
•
Review and edit a user’s groups, servers, and sensors by clicking
the user’s Home link.
•
Review and edit a user’s account settings (e.g. notifications and
schedules) by clicking the My Account link.
•
Review and edit a user’s details (username, available sensors, etc.)
by clicking the Edit Link.
•
Enable/disable the account login as well as the monitoring for a
user by clicking the Pause/Resume Link. Note: If a user is paused
by the admin his login is disabled as well.
•
Delete a user by clicking the Delete Link.
Note: All of the users will be displayed under the Users Heading including the
Administrator.
Adding New Users
To add new users
•
Please log into your account (see “Logging into your account using
the Web GUI”)
•
After verifying your credentials, click the Administration link
from the menu toolbar.
•
Click the Add User Link.
This opens the User Data Window. Now you can enter the new user’s data:
User Manual IPCheck Server Monitor 5
•
Email/Login name—this is the user’s login name for IPCheck
Server Monitor. IPCheck will send the user’s password to this
address.
•
Password- The user’s password can be set here
•
First Name—the account holder’s first name
•
Last Name—the account holder’s last name
Server and User Account Administration • 125
•
Company—the account holder’s company
•
Street—the account holder’s street address
•
Zip—the account holder’s zip code
•
City—the account holder’s city
•
Country—the account holder’s country
•
State—the account holder’s state
•
Phone—the account holder’s phone
•
Fax—the account holder’s fax
•
Timezone—the account holder’s timezone
•
Report Schedule—use the drop-down menu to select a frequency
of report generation
•
Latency for warnings—specify a time (in seconds) after a sensor
has reached its warning threshold when the warning notification
will be sent
•
Latency for errors—specify a time (in seconds) after a sensor has
reached its error status when the warning notification will be sent
•
Latency for escalations—specify a time (in seconds) after a sensor
has reached its escalation threshold when the warning notification
will be sent
•
Maximum number of sensors—You can limit the maximum
number of sensors a user may use by entering the number here. “1” means no limit.
•
Click the OK Button when finished
The new user will receive an email with his password and can log into the site
right away.
Editing User Settings (ISP Edition only)
In the ISP edition you can set a number of settings on a “per-user” basis.
To edit a user’s settings:
•
Please log into your account (see “Logging into your account using
the Web GUI”)
•
After verifying your credentials, click the Administration link
from the menu toolbar.
•
Select the first character of the user account’s email address
•
Review and edit a user’s details (username, available sensors, etc.)
by clicking the Edit Link from the list of users.
You will then be able to set the following settings for this user:
•
You can enable and disable the sensor types that are available for
this user
•
You can enable and disable the notification types that are available
for this user
126 • Server and User Account Administration
User Manual IPCheck Server Monitor 5
•
You can set the minimum interval that this user is allowed to use
•
You can set an expiry date for this user (the account will be
automatically disabled after this date)
•
You can select the maximum number of active sensors for this user
You will also see the time and date when the user has logged in for the last time
and when the last HTTP request was made using this account.
Editing ISP Settings (ISP Edition only)
Please see “Control Panel ISP Settings Tab” in the Control Panel section for
details.
User Manual IPCheck Server Monitor 5
Server and User Account Administration • 127
Reporting and Graphing
Creating Reports and Graphs
You can create graphs and reports of historical monitoring data for each sensor
and even compare two sensors. To get started:
If you use the Web GUI:
•
Please log into your account (see “Logging into your account using
the Web GUI”)
•
From the Account Homepage select click the Minigraph of the
sensor for which you would like to create a report or
•
Move the mouse over the “>” link of the sensor you want a report
for and select one of the Graph Links or the Info&Custom Graph link.
If you use the Windows GUI:
•
Please start the Windows GUI (see “Starting the Windows GUI”)
•
Right click the sensor you want a report for and select one of the
graph links or Custom Report.
This will either show the report directly or bring you to the Custom Report
window.
To generate a customized report, you can specify the following information:
•
Sensor—use the drop-down menu to select the sensor for which
you would like a report generated.
•
Compare—IPCheck Server Monitor allows you to generate reports
that compare different data. Only supported by reports of type
‘Graph’! To create a comparison report
•
128 • Reporting and Graphing
Use the drop-down menu to select a group, server, or sensor
User Manual IPCheck Server Monitor 5
•
If you don’t want to generate comparison data, select the None
Option.
•
Type—select the type of report you would like generated: Graph
or Value list
•
Graph Type: Select the type of graph you want to have created (If
you select ‘Value list’ above you always get ‘Single Values’)
•
Single Values: Draws a graph for all individual results
(recommended for time spans up to 2 days)
•
Hourly Averages: Draws a graph with the hourly averages of
the monitoring results (recommended for time spans of up to
14 days)
•
Daily Averages: Draws a graph with the daily averages of the
monitoring results (recommended for time spans of more than
14 days)
•
Average Daily Load: Draws a graph with the average daily
load curve (the 24 average values for each hour of the day)
calculated for the given time.
•
Response Time Distribution: Shows the daily distribution of
the request latency.
•
Time Span—Choose a predefined timespan or choose custom and
enter the desired dates below.
•
Start—select the start date for the report (for custom time span).
•
End—select the end date for the report.
When finished click the Generate Report Button. This will open the Report for
Sensor Window.
If you selected the Graph option from the type section you will see a graph with
the Request times along with the selected dates. To resize the graph click one of
the corresponding links below the graph.
If you selected the Value list option from the type section you will see a list
starting with the Log Time, Result Value, and the Message that was given.
User Manual IPCheck Server Monitor 5
Reporting and Graphing • 129
Reviewing Messages/Errors
You can access the error data through the web interface, On your personal
homepage you can always see a list of the latest errors, UP and DOWN
messages:
The Messages/Errors Section displays messages from all of the sensors. The
RSS Button adds an RSS feed to an RSS Reader (if one is installed). Click the
More Button to generate a more comprehensive message list. This will open the
Generate Message List Window.
The Generate Message List Window allows you to create a list of all messages
that have been logged for a specific reporting period.
•
Sensor/Server/Group—use the drop-down to select a specific
element you have configured or select the All option to return
messages for all elements
•
Message Type—use the drop-down menu to select what types of
messages to generate in the list. Options include
•
130 • Reporting and Graphing
•
Messages/Errors (system errors/messages like ‘Notification
triggered’)
•
Failed Requests (only bad requests that return with an error)
•
All (including good requests. Can produce lengthy lists!)
Start—use the year, month, and day drop-down menus to specify
the start date of the message list you are going to generate. No
messages prior to this date will be included.
User Manual IPCheck Server Monitor 5
•
End—use the year, month, and day drop-down menus to specify
the end date of the message list you are going to generate. No
messages after this date will be included.
•
Click the OK Button when finished.
You will now get a list of the filtered messages, use Prev and Next to navigate
in the list.
When you are finished reviewing the messages in this window select the OK
Button. This will then take you back to the Account Homepage.
Reviewing the Complete Activity Data
You can access the complete activity data which include all successful and all
failing requests. On your personal homepage you can always see a list of the
latest activity:
The Activity Section displays all of the current messages for the servers being
monitored in IPCheck Server Monitor.
Click the More Button to generate a more comprehensive message list. This
will open the Generate Message List Window.
The Generate Message List Window allows you to create a list of all messages
that have been logged for a specific reporting period.
User Manual IPCheck Server Monitor 5
Reporting and Graphing • 131
•
Sensor/Server/Group—use the drop-down to select a specific
element you have configured or select the All option to return
messages for all elements
•
Message Type—use the drop-down menu to select what types of
messages to generate in the list. Options include
•
Messages/Errors (system errors/messages like ‘Notification
triggered’)
•
Failed Requests (only bad requests that return with an error)
•
All (including good requests. Can produce lengthy lists!)
•
Start—use the year, month, and day drop-down menus to specify
the start date of the message list you are going to generate. No
messages prior to this date will be included.
•
End—use the year, month, and day drop-down menus to specify
the end date of the message list you are going to generate. No
messages after this date will be included.
•
Click the OK Button when finished.
You will now get a list of the filtered messages, use Prev and Next to navigate
in the list.
The Generate Message List Window accessed from ‘Activities’ or
‘Messages/Errors’ is the same with one minor difference: The default value for
‘Message Type’ is different
When you are finished reviewing the messages in this window select the OK
Button. This will then take you back to the Account Homepage.
Working with Email Reports
Depending on your report schedule setting (see “Managing "My Account"”) you
will receive a report by email every day, week or month.
Additionally you can request a report at anytime using the Account pop-up
menu.
Email reports contain a list of all servers and sensors with their monitoring
statistics:
132 • Reporting and Graphing
User Manual IPCheck Server Monitor 5
User Manual IPCheck Server Monitor 5
•
Good Requests: The number of successful requests this sensor was
able to complete during the report's time span. The percent value
shows the percentage of good requests compared to the total
number of requests.
•
Failed Requests: The number of unsuccessful requests for this
sensor during the report's time span. The percent value shows the
percentage of failed requests compared to the total number of
requests.
•
Uptime: The time span that the monitoring system was able to
complete successful requests to the sensor. Only times between two
successful requests are counted as UP. (Please note: Downtime
plus uptime can be shorter than the report time span).
•
Downtime: In this time span the sensor was not able to complete
successful requests. Times between two failed requests and times
between one good and one failed requests are counted as DOWN.
•
Average: The average value of all successful requests for this
sensor during the report's time span (in milliseconds for most
sensors).
Reporting and Graphing • 133
Tips&Tricks
Visit the Paessler Knowledgebase
Please visit the Paessler Knowledgebase regularly at www.paessler.com/support
for up-to-date information and technical articles about IPCheck Server Monitor.
Automatic Network Discovery
By selecting the Automatic Network Discovery option from the user menu (or
by clicking the corresponding link on the main page) you can scan your network
for servers and devices that IPCheck Server Monitor will be able to monitor for
you.
Using this feature a basic monitoring for your network can be set up in a matter
of minutes, regardless of the number of servers running.
Note: The Network Discovery only searches for a selection of simple sensor
types and uses only the basic settings for these sensors to make the discovery
easy to set up. After the discovery process has finished you should revise and
eventually update the settings for all sensors!
Note: Be aware that the automatic network discovery is actually a scan of your
network. Make sure you are legally authorized and technically allowed to run a
network scan on the selected addresses.
Clicking the Automatic Network Discovery link will show the following form:
In the IP Address Range, enter the IP address of the first and last node that
should be scanned. Note: Do not set .0 or .255 as starting or ending range, as
these address values are reserved and will produce an error.
Then, select the types of sensors you would like to start scanning for. Click OK
when finished.
This starts the scanning process. It takes about 5-15 seconds per IP address.
134 • Tips&Tricks
User Manual IPCheck Server Monitor 5
During the scanning process IPCheck will first generate all the selected sensors
for the given address range. Then all sensors are executed once. If a sensor fails
upon this first test it is removed from the list.
As soon as the scan is finished you will get the list of devices and services found
during the IP Address Range scan.
Working with Network Maps
For each group of servers you can set up a graphical network map. Basically this
is a custom bitmap which you upload onto the IPCheck webserver and to which
the webserver adds small status icons. These icons show the states of the sensors
using the colors green, yellow, blue or red as well as the server name, sensor
name and the last status message.
For example if you upload a graphical map of your network (e.g. created using
Visio) as your image you can place the icons for the sensors next to the servers’
icons on the map to show an easy-to-understand overview of your network’s
status.
Creating a Network Map
Note: To create or edit a new network map for a group you must use the
Windows GUI.
After launching the Windows GUI click the desired group with the right mouse
button and choose “Edit Network Map” from a group’s context menu.
Click on Load Picture to load the background image you want to use.
Then drag-and-drop the desired sensor(s) from the list on the left into the image
and position them as desired using the mouse.
To delete a status icon click it once with the mouse (it will show a red border),
then hit the DEL key on your keyboard.
When you are satisfied with your settings click on Save to upload the settings to
the server.
Viewing Network Maps
After setting up a network map using the Windows GUI there are several ways
to view the network map with updated sensor status:
User Manual IPCheck Server Monitor 5
Tips&Tricks • 135
•
WebGUI – After logging into your account simply click on the
Map link next to a group’s name
•
WindowsGUI – Right click a group entry and choose View
Network Map from the popup menu.
•
Published Groups – If you have enabled the Publish Group
setting of a group you can find links to the group’s HTML status,
the network map webpage as well as the network map image in the
group’s settings page. These URLs do not require a login so you
can use these URLs e.g. to include monitoring information into
Intranets, Extranets, etc.
Paessler SNMP Helper
Paessler SNMP Helper enables IPCheck Server Monitor (or its sister product
PRTG Traffic Grapher) to collect in-depth performance information from
Windows servers and workstations. Up to several thousands parameters and
performance counters of a PC can be monitored with just a few mouse clicks.
SNMP Helper License Options
There are three different flavors available:
•
Freeware Edition: Supports monitoring of memory, disks, network,
and processors and comes free with the downloads of PRTG
Traffic Grapher and IPCheck Server Monitor
•
Pro Edition: Adds more than 2000 performance counters for
servers and workstations running Windows 2000, XP or 2003
•
Pro Extensions: Are available for in-depth monitoring of MS
Exchange Server, MS ISA Server, MS SQL Server and MS Biztalk
Server
Fully Integrated Into Paessler's Monitoring
Products
Simply install SNMP Helper on Windows 2000, XP or 2003 systems and you
can monitor numerous performance counters using PRTG Traffic Grapher and
IPCheck Server Monitor - simply by adding new sensors. Both our monitoring
products have built-in support for the additional counters. Within a few minutes
you will be able to monitor values like "disk writes/s", "DHCP Server
Requests/s", "Exchange Server: Messages/s", "SQL Server: Requests/s", and
many more.
In our knowledge base at www.paessler.com/support we have compiled a list of
recommended performance counters that you can monitor using SNMP Helper.
SNMP Helper Freeware Edition
The Freeware Edition supports about 80 performance counters and is part of
PRTG Traffic Grapher and IPCheck Server Monitor. You must install SNMP
Helper on the machine(s) you want to monitor. After installation of PRTG or
IPCheck you will find the SNMP Helper Freeware setup files in a subfolder. Run
this setup on all the systems you want to monitor. Afterwards you can monitor
the additional system parameters by simply adding new sensors.
136 • Tips&Tricks
User Manual IPCheck Server Monitor 5
SNMP Helper Pro Edition and its Extensions
The Pro Edition of SNMP Helper offers the ability to monitor more than 2000
counters for Windows 2000, XP, and 2003. With the optional SNMP Helper
Extensions you can additionally monitor the following Microsoft Server
applications:
•
MS Exchange Server: more than 1726 performance counters
•
MS SQL Server: more than 511 performance counters
•
MS Biztalk Server: 32 performance counters
•
MS ISA Server: 149 performance counters
Detailed lists of supported counters are available at
www.paessler.com/snmphelper.
To use SNMP Helper Pro you must either purchase a license or you must request
a Free 30 Day Trial License. Either way you will receive a license key and the
installation files via email. Please install the software on the server that you want
to monitor and enter the license key that comes with it. Afterwards you can
monitor the additional system parameters by simply adding new sensors to
IPCheck and PRTG.
Installing Paessler SNMP Helper
Paessler SNMP Helper is a small library that makes it much easier to access
system parameters of Windows machines using SNMP. If the SNMP Helper is
installed PRTG Traffic Grapher will be able to read various system parameters
from this machine.
SNMP Helper can be used on Windows XP, 2000 and 2003.
You only need to install SNMP Helper on a computer if you want to monitor it!
You must install SNMP Helper on each Windows computer you want to monitor
using the additional sensors.
First make sure to install the Windows SNMP component using the
Add/Remove Software control from your Windows Control Panel.
In order to install Paessler SNMP Helper, launch the Paessler SNMP Helper
Setup.exe file located within your PRTG Traffic Grapher installation directory
after you have installed PRTG Traffic Grapher.
This will launch the Paessler SNMP Helper Setup Wizard.
User Manual IPCheck Server Monitor 5
Tips&Tricks • 137
Once you have read the information found in the welcome screen click Next to
continue installation.
From the Select Destination Location window use the Browse button to select a
directory in which to install the Paessler SNMP Helper. You can also enter the
destination location directly in the provided box. Once you have chosen your
destination location, click on Next to continue.
138 • Tips&Tricks
User Manual IPCheck Server Monitor 5
Once Paessler SNMP Helper is installed, the program will prompt you that it
needs to restart the machine in order to complete the installation process. If you
are ready to restart your machine, select this option from the provided menu.
Otherwise, select to restart your computer later.
Note: Keep in mind – in order for the Paessler SNMP Helper to work properly,
your system has to be restarted. If you opt to restart the machine later you will
need to do so before the Paessler SNMP Helper can be fully put into operation.
Importing MIBs using Paessler MIB Importer and
Converter
In order to import MIB files from third parties (usually the vendor of a device)
into PRTG you must convert the files into OIDLIB files.
The MIB Importer and Converter Tool is available free of charge on the Paessler
website at www.paessler.com.
How to import an MIB File
Instructions:
User Manual IPCheck Server Monitor 5
•
Download and install Paessler MIB Importer
•
Copy your vendor specific MIB file(s) into the /mib subfolder of
your installation folder
•
Start the program from the Start menu Start|Programs|Paessler
MIB Importer
•
Use the Import menu item to load and convert the MIB file
•
Please understand that your import may fail and some edits may be
necessary for the MIB import to go through.
•
After a successful import please review the values
•
It is very likely that you have to edit the list and/or the strings.
Tips&Tricks • 139
•
Finally use File|Save For... to save the new .oidlib file and - if
necessary - copy it into the /snmplibs subfolder of your PRTG or
IPCheck installation.
•
Restart PRTG or IPCheck and create new SNMP sensors using the
new oidlib file
Planning large Installations of IPCheck Server Monitor
When planning large installations of IPCheck Server Monitor 5, there are several
parameters to take into account that influence the maximum number of
Users/Servers/Sensors that can be monitored using one single installation.
Memory Usage
Per user you must supply about 5 KB of RAM. Per sensor you must supply
about 5 KB of RAM without the recent history graphs and about 10k with recent
history graphs enabled.
Sample calculation: 1000 users with 5 sensors each: 1000x5kb plus
5x1000x10kb => 55 MB RAM
Note: To keep system performance up, this memory should be physically
accessible to avoid slow page file swapping!
CPU Load
A monitoring load of 30 requests/s (about 2.000 requests per minute, which
means monitoring 2000 sensors with 60 sec interval) creates a CPU load of
about 20% on a 2 GHz Intel machine. With an aggressive configuration we
would recommend not to cross 40-50% CPU load (e.g. to save CPU cycles for
the web server) which gives us about 5.000 requests per minute, preferably using
a multi processor machine.
Sample Calculation: 1000 users with 5 sensors each with an interval of 1 minute:
5x1000 = 5.000 requests per minute
140 • Tips&Tricks
User Manual IPCheck Server Monitor 5
BTW: By simply allowing the users a minimum interval of e.g. 5 minutes this
load can be lowered to 1.000 requests per minute, etc.
Network Load
Per monitoring request about 200 bytes of internal communication plus the
traffic for the sensor (from a few bytes for a PING up to several kb for an HTTP
request) is transferred. Using an average of e.g. 1 kb per sensor request a
monitoring of 5.000 requests per minute creates a bandwidth load of about 100150 kb/s.
Plus, the traffic of the web server, which is tiny compared to this.
Multi Location Monitoring Using Remote Probes
By default all monitoring requests are sent out from the machine you have
initially installed the IPCheck software on (called "Local Probe").
To achieve multi location monitoring you can install additional "Remote Probes"
on other machines that can reside in your local LAN, in your DMZ, or anywhere
in the world, as long as they are reachable via the net. This way you can monitor
your network devices from different perspectives.
To create a "Remote Probe" you must install the "IPCheck Probe Service" on the
desired machine. Then you must set up a few parameters on the remote machine
and the machine your main IPCheck installation runs on. If you use custom
sensors make sure to also copy the necessary script files to the remote probe
machine!
Note: This feature is not available in the Freeware Edition!
Setting up a Remote Probe
Please download the file "IPCheck Server Monitor – Remote Probe Setup.exe"
from the Paessler website (www.paessler.com) or find the file in the Remote
Probe Setup subfolder of your IPCheck Server Monitor installation folder.
Make sure that the version numbers of both the probe service and your main
IPCheck installation are the same.
Run the setup routine and in the end you will get the Probe Service configuration
dialog.
Configuring a Remote Probe
Please start the remote probe configurator from the Start menu.
User Manual IPCheck Server Monitor 5
Tips&Tricks • 141
•
Local IP-If the machine has more than one IP address please
choose one from the list. This will be the IP address that you have
to enter in the Admin Control Panel of your main IPCheck
installation for this remote probe.
•
Local Port -Please choose the ports you want to use. Using the
defaults should be fine in most cases.
•
Probe Password-Make sure to protect your probe using a
password. This must be the same password as you are entering in
your main IPCheck installation as well as all other probes!
•
Install/Deinstall/Start/Stop-Use these buttons to control the
behavior of the service.
•
Restrict Ips: xx
Click OK when you are ready.
Firewall Issues
The main IPCheck server service communicates with the remote probe(s) using
one TCP/IP connections using the port number that you enter in the
configuration. You must make sure that these IP packets are being transported by
your network (e.g. enable NAT mapping for NAT networks).
Configuring Remote Probes in the Admin
Control Panel
After installing and configuring the remote probe service on your remote
machines you must enter the IP addresses of the new probes in the Admin
Control Panel of your main IPCheck installation. See the "Multi Location
Monitoring Using Remote Probes" section above.
Now the users can choose the local and the remote probes from a drop down for
each sensor.
142 • Tips&Tricks
User Manual IPCheck Server Monitor 5
Publishing Current Monitoring Status
If you are monitoring your network using IPCheck Server Monitor it is a good
idea to make the current network status available to the other employees, etc. in
your company.
Using the "Publish Group" feature of IPCheck Server Monitor you can publish
the current monitoring status of your network in your Intranet or any other
website.
But there are also even more sophisticated options, please read on.
Simple Solution: Publishing a Group of Servers
To make a group's status publicly available
•
Open the IPCheck Server Monitor web interface
•
Log into your account
•
For the group you want to publish click on the Edit Group icon
•
Enable Publish Group
•
Note the Public URL (this is the URL where the group's data can
be accessed publicly - we need the URL later)
•
Click OK
Paste the public URL into a browser and test it.
Advanced Options: Including Monitoring
Information In Your Intranet or Website
There are five options:
•
Using network map images in your own website: Simply copy the
URL of a networkmap and use the image in your HTML.
•
Using Recent Monitoring Data images (“minigraphs”) in your own
website: Simply copy the URL of a MiniGraph and use the image
in your HTML. Using the URL’s parameters you can change the
background color and size of the image
•
Linking to the public URL from your Intranet or Website: This way
the visitor can access the information, but only one group at a time
and without your website's look and feel
•
Showing the public URLs in IFRAMEs on a page of your website
or Intranet: This gives you the possibility to have the monitoring
data on a webpage in your look and feel and you can even show the
status of several groups on one web page
•
Using a PHP script to access the monitoring results and publishing
them in your own website
Please visit the Paessler Knowledgebase at www.paessler.com/support for more
articles and technical details about these approaches.
Changing the Look&Feel of IPCheck Server Monitor
If you want to change the colors, images, and logos of the web interface of
IPCheck Server Monitor there are several items you can edit
User Manual IPCheck Server Monitor 5
Tips&Tricks • 143
•
Web GUI Skin: A “skin” contains the colors, images, etc. of the
Web GUI. Here you can edit the CSS files, the images, and the
templates for the HTML <table> tags used to create the final
webpages
•
Web Templates: These “templates” are used to build the HTML
framework of the web GUI’s pages, e.g. the content of the headers
and footers is specified here
Note: If you install new versions of the IPCheck software make sure to make
backup copies of your edited files, they may be overwritten by the installer!
Editing Web Skins
IPCheck Server supports switching between several skins. Two skins are already
included after the initial installation. You can choose between the installed skins
in the Ipcheck Control Panel.
If you want to editing you own skins:
•
Choose an existing skin to begin with
•
Copy the skin’s folder in the “webskins” subfolder of your
IPCheck installation folder
•
Edit the files in this new folder
•
Open the Control Panel and select your new skin
•
Restart IPCheck’s webserver service to apply your changes
When editing the skin it is recommended to restrict your edits to the following
files, to reduce the risk of breaking functionality:
•
/css/ipcheck.css
•
/container*.htm
•
all image files
Note: To edit the HTML files please do not use an HTML editor that actively
changes the HTML code (e.g. FrontPage), because very often the code for the
placeholders are changed and IPCheck Server Monitor will not work with these
files. We recommend to use Windows Notepad or any other plain text editor.
Also, always make a backup copy of the original files before changing them!
To use your own Logo or server/sensor icons you have to replace the files in the
images and images/icons subfolders of your web skin folder. Make sure that all
images have the same size (pixel width/height) as the original files to avoid a
broken layout.
Editing Web Templates
Webtemplates are used to create pages or parts of pages. Please be very cautions
with changes to these templates, especially when editing the placeholders
(looking like <#placeholder>), otherwise you may break IPCheck’s
functionality.
Here is a list of the most important template files:
144 • Tips&Tricks
•
ipchome.htm: Website homepage
•
outbase.htm: Main page with groups/servers/sensors
•
header.htm: the starting HTML page
•
logo.htm: the top navigation and logos
User Manual IPCheck Server Monitor 5
•
footer.htm: the final HTML code of all pages
Setting Up SMS and Pager Notifications
If you want to get notified about server and network outages on your cell phone
or pager you must set up an account at a SMS gateway service or provide a
custom URL that send one message.
The SMS gateway services allow you to send SMS and pager messages from
IPCheck Server Monitor which already include the APIs of various SMS
services.
This service is not free and you must set up an account, supply your credit card
details, and purchase a pre paid amount of messages you can send (credits).
Pricing depends on the country you send the messages to - check out their price
list and world wide coverage information.
Note: You do not need the dedicated server some services offer! Setting up a
simple account and purchasing a reasonable number of credits is fine!
Here is what you need to do:
•
Create an account at one of the services: www.bulksms.co.uk
or www.smsdriver.com (Note: we do not recommend
www.smsxchange.com anymore)
•
Note: Please see the IPCheck Control Panel if your version of
IPCheck already supports other services, too
•
Some of these services will send your password to your cell
phone
After you have confirmed your account with one of the services:
•
open the IPCheck Server Monitor Admin Control Panel
(Start|Programs|IPCheck Server Monitor|IPCheck Admin Control
Panel)
•
Select the Messaging tab
•
Choose the desired service, enter your user ID and password
•
Click Apply to restart the IPCheck services
To test the delivery of the messages
•
Log into the web interface of your IPCheck Server Monitor
installation
•
Click on My Account
•
Below Notifications select an existing notification or create a new
one
•
Scroll to SMS and Pagers and enter the country code and number
of your cell phone or pager
•
Click OK to accept these settings
•
Click the Test this notification link of the notification you just
edited
You should now receive the message in a matter of a few seconds.
User Manual IPCheck Server Monitor 5
Tips&Tricks • 145
Installing a custom SSL key
IPCheck Server Monitor comes with a default SSL certificate so you can
securely use the web interface through HTTPS. But when a browser connects to
this server it will always show a message that the certificate is not correct
(although the transmission is already secure).
If you want this dialog to disappear you must create, order, and install a full
certificate as follows.
Install Open SSL
•
(if you don’t have access to a machine with one, most Linux
distributions should have it)
•
You can get a windows installer here:
http://www.shininglightpro.com/products/Win32OpenSSL.html
•
Or check the list at the official website:
http://www.openssl.org/related/binaries.html
•
If you have to use a different operating systems check
http://www.opensll.org for details
Create your CSR (Certificate Signing Request)
•
1. Open a command line window
•
Start->Run->"cmd"
•
2. Change to the folder the openssl.exe is located
•
e.g. cd c:\ssl\src\apps (depending on your ssl installation)
•
3. Execute the following line:
openssl req -new -nodes -keyout ipcheck.key -out
server.csr -config openssl.cnf
•
Answer the questions! What to enter depends on the registration
company you want to use.
•
For e.g. InstantSSL check this url for more details:
http://www.instantssl.com/ssl-certificatesupport/csr_generation/ssl-certificate-openssl.html
•
This will create two files: The file ipcheck.key contains a private
key. Do not disclose this file to anyone! The server.csr is your
certificate request file.
Request your certificate
•
Go to your certificate company and order the certificate.
•
Provide the server.csr file you have created above when asked for
it.
You should receive 2-3 files from the certification company
•
Rename the server certificate file to ipcheck.crt
•
Put all other files (root certificates from the issuer) into one text file
and name it root.pem
Copy the files into the cert folder
•
Copy the following files into the /cert subfolder of your IPCheck
installation replacing the existing demo certificates:
•
146 • Tips&Tricks
ipcheck.crt (the certificate of your server)
User Manual IPCheck Server Monitor 5
•
root.pem (the root certificates of the issuer)
•
ipcheck.key (pivate key of your server)
Now restart the IPCheck Server Monitor service.
User Manual IPCheck Server Monitor 5
Tips&Tricks • 147
Appendix
Support
Please visit http://www.paessler.com/support for support options.
Copyright
IPCheck Server Monitor is protected by international laws.
Paessler™ and IPCheck™ are registered trademarks in USA and in other
countries.
Copyright © 1998-2007 Paessler AG
For the latest version always check http://www.paessler.com/ipcheck
Postal address:
Paessler AG
Burgschmietstrasse 10
D-90419 Nuremberg
Germany
E-Mail: [email protected]
Company Homepage: http://www.paessler.com
Consulting and Custom Software
Paessler offers consulting and the development of custom software. Please
inquire via email to [email protected].
General License Terms and Conditions
ATTENTION: You will find these General Terms and Conditions within the
Paessler Software that you download and these General Terms and Conditions
govern the use of the Paessler Software. To complete the installation of and to
use the Paessler Software, you will be required to agree to the terms defined
below.
PLEASE READ THESE GENERAL TERMS AND CONDITIONS
CAREFULLY.
§ 1 TERRITORY
148 • Appendix
User Manual IPCheck Server Monitor 5
These General Terms and Conditions govern the use and maintenance of the
Paessler Software for customers who use the software outside the Federal
Republic of Germany. The use of the Paessler Software in the territory of the
Federal Republic of Germany is governd by the "Allgemeinen
Lizenzbedingungen der Paessler AG".
§ 2 DEFINITIONS
Site: Defined and/or restricted area (e.g. campus, premises) of which the
diameter does not exceed 6,21 miles (10 kilometers), and which is used
exclusively by the customer;
Customer: Contract partner who licensed the Paessler Software;
User: Person working with the software.
§ 3 PRE-CONDITION
PAESSLER AG IS WILLING TO LICENSE THE PAESSLER SOFTWARE
TO THE CUSTOMER ONLY ON THE CONDITION THAT THE
CUSTOMER ACCEPTS ALL OF THE TERMS CONTAINED IN THIS
AGREEMENT.
§ 4 ASSIGNMENT
BY DOWNLOADING OR INSTALLING THIS SOFTWARE, THE
CUSTOMER ACCEPTS THE TERMS OF THESE GENERAL TERMS AND
CONDITIONS AND INDICATES THE ACCEPTANCE THEROF BY
SELECTING THE "ACCEPT" BUTTON AT THE BOTTOM OF THESE
GENERAL TERMS AND CONDITIONS. IF THE CUSTOMER IS NOT
WILLING TO BE BOUND BY ALL THE TERMS, THE CUSTOMER
SELECTS THE "DECLINE" BUTTON AT THE BOTTOM OF THE
AGREEMENT AND THE DOWNLOAD OR INSTALL PROCESS WILL BE
INTERRUPTED.
§ 5 LICENCES
Paessler grants to the customer a non-exclusive license to use the Paessler
Software in object code form as described in these General Terms and
Conditions.
1. “Commercial-Edition”
The “Commercial-Edition-Software” is designed for the exclusive use by the
customer. For the grant of license a fee has to be paid.
The „Commercial-Edition“-License is non-transferable. Any attempt to share or
transfer a licence without the consent of Paessler shall be a violation of this
license agreement and international copyright laws, and will result in the forfeit
of all benefits and rights as a user.
A. Single- and Multi-user license
The customer purchases a certain number of licences according to the
confirmation of order. The customer is only allowed to install and use the
maximum number of purchased licences simultaneously. This means the
customer may only use the modules contained within the software for which the
customer has paid a license fee and for which the customer has received a
product authorization key from Paessler.
If the number of licenses allowed to be use simultaneously is exceeded, Paessler
has to be informed and the exceeded number of installations have to be
prevented through suitable means.
If the exceeded number of installations can not be prevented by organizational
oder technical means, the customer is obliged to purchase the relevant number of
licences.
B. Site- License
User Manual IPCheck Server Monitor 5
Appendix • 149
Paessler grants the customer the right and license to install and use the software
on multiple computers for one or more users.
This license, however, is restricted to the use within one location (site). In the
case of the software being used in other locations than those agreed upon, the
customer is obliged to pay the license fee due for the location-license as a
compensation.
C.Verification
The customer grants Paessler or its independent accountants the right to examine
the customer´s books, records, and accounts during the customer's normal
business hours to verify compliance with the above provisions.
2. “Trial-Edition”
"Trial Edition" means a free-of-charge-version of the software to be used only to
review, demonstrate, and evaluate the software. The Trial-Edition may have
limited features, and /or will cease operating after a pre-determined amount of
time, due to an internal mechanism within the Trial-Edition.
No maintenance is available for the Trial-Edition.
The software may be installed on multiple computers for private and commercial
use.
The software may be transferred to third parties (e.g. on homepages or ftpservers) as long as the program remains unchanged and is offered free of charge.
A chargeable transfer of the “Trial-Edition” (chargeable download, CD in
Magazins) requires previous written permission by Paessler.
§ 6 RESTRICTIONS
Software under these General Terms and Conditions is confidential and
copyrighted. The title to the software and all associated intellectual property
rights are retained by Paessler.
The customer may not modify, decompile, or reverse engineer said software.
The customer may make archival copies of the software.
§ 7 MAINTENANCE
Object of the Maintenance Agreement is the maintenance of the “CommercialEdition-Software” according to the confirmation of order.
1. Scope of Maintenance
The customer is granted the opportunity of downloading the current version of
the purchased Commercial-Edition-Software and requesting a license-key anew
for the duration of the Maintenance Agreement.
The customer will receive support for the duration of the Maintenance
Agreement.
2. Duration
The Maintenance Agreement has a duration of 12 months and may be prolonged.
3. Beginning
The Maintenance Agreement starts with the sending of the affirmation of
contract. The affirmation includes the download-link and the licence-key of the
software.
4. Prolongation
Prolongation may only take place until the end of the duration of the
Maintenance Agreement.
§ 8 PRICE
All levies, dues, taxes, duties, and other charges shall be borne by the customer.
150 • Appendix
User Manual IPCheck Server Monitor 5
§ 9 PAYMENT
The payment to be made by the customer is in any event due at the time delivery
of the software is effected. The due time for payment arises without any further
precondition.
The payment to be made by the customer is to be transferred as stated on the
invoice to the banking account of Paessler without deduction and free of
expenses and costs for Paessler.
In the event of delay in payment the customer will pay to Paessler - without
prejudice to compensation for further losses — the costs of judicial and extra
judicial means and proceedings as well as interest at the rate of 5 % over the base
interest rate of the European Central Bank.
§ 10 LIMITATIONS FOR CUSTOMERS IN THE UNITED STATES AND
UNITED STATES TERRITORY
1. LIMITED WARRANTY
Paessler warrants that for a period of ninety (90) days from the date of download
the software files will be free of defects as regards the product under normal use.
Except for the foregoing, software is provided "AS IS". The customer´s
exclusive remedy and Paessler's entire liability under this limited warranty will
be at Paessler's option to replace software media or refund the fee paid for the
software. Any implied warranties on the software are limited to 90 days.
2. DISCLAIMER OF WARRANTY
UNLESS SPECIFIED IN THESE GENERAL TERMS AND CONDITIONS,
ALL EXPRESS OR IMPLIED CONDITIONS, REPRESENTATIONS AND
WARRANTIES, INCLUDING ANY IMPLIED WARRANTY OF
MERCHANTABILITY, FITNESS FOR A PARTICULAR PURPOSE OR
NON-INFRINGEMENT ARE DISCLAIMED, EXCEPT TO THE EXTENT
ALLOWED BY APPLICABLE LAW.
3. LIMITATION OF LIABILITY
IN NO EVENT WILL Paessler BE LIABLE FOR ANY LOST OF REVENUE,
PROFIT OR DATA, OR FOR SPECIAL, INDIRECT, CONSEQUENTIAL,
INCIDENTAL OR PUNITIVE DAMAGES, HOWEVER CAUSED
REGARDLESS OF THE THEORY OF LIABILITY, ARISING OUT OF OR
RELATED TO THE USE OF OR INABILITY TO USE SOFTWARE, EVEN
IF Paessler HAS BEEN ADVISED OF THE POSSIBILITY OF SUCH
DAMAGES, EXCEPT TO THE EXTENT ALLOWED BY APPLICABLE
LAW.
In no event shall Paessler's liability to the customer, whether in contract, tort
(including negligence), or otherwise, exceed the price paid by the customer. The
foregoing limitations shall apply even if the above-stated warranty fails its
essential purpose.
If the Terms above are not applicable to the customer the following Limitations
apply.
§ 11 INTERNATIONAL LIMITATIONS
1. Conformity of the Software
The software does not conform with these General Terms and Conditions if at
the time the risk passes it is clearly different to the specifications, or in the
absence of specifications, the software is not fit for the usual purpose.
Paessler is particularly not liable for the software being fit for a particular
purpose to which the customer intends to put it or for the software´s compliance
with the legal requirements existing outside the Federal Republic of Germany.
2. Examination and Notice of Lack of Conformity
User Manual IPCheck Server Monitor 5
Appendix • 151
The customer must examine the software as required by law.
The customer shall give notice of any lack of conformity to Paessler as required
by law, in any event directly and in writing and by the quickest possible means
by which delivery is guaranteed (e.g. by telefax).
3. Consequence of Delivering non-conforming Software
Following due notice of lack of conformity, the customer can rely on the
remedies provided for by the UN Sales Convention in regard to the terms laid
down in these General Terms and Conditions. In the event of notice not having
been properly given, the customer may only rely on the remedies if Paessler has
fraudulently concealed the lack of conformity.
The customer is entitled to demand delivery of substitute software or repair or
reduction of the purchase price as set forth in and in accordance with the terms
of the UN Sales Convention.
Irrespective of the customer's remedies, Paessler is entitled to repair nonconforming software or to supply substitute software.
4. Third Party Claims and Product Liability
A. Third Party Claims
Without prejudice of further legal requirements, third parties' rights or claims
founded on industrial or other intellectual property only found a defect in title to
the extent that the industrial and intellectual property is registered and made
public in the Federal Republic of Germany.
The customer's claims for defects in title including those founded on industrial or
intellectual property will be time-barred according to the same rules as the
claims for delivery of non-conforming software.
Third parties not involved in the conclusion of contract based on these General
Terms and Conditions in particular those purchasing from the customer, are not
entitled to rely on any remedy provided for in this General Terms and Conditions
or to raise claims against Paessler, founded on delivery of non-conforming
software or defect in title.
B. Product Liability
Without prejudice to Paessler's continuing legal rights and waving any defense
of limitation the customer will indemnify Paessler without limit against any and
all claims of third parties which are brought against Paessler on the ground of
product liability, to the extent that the claim is based on circumstances which are
caused after risk passed by the customer.
5. Damages
A. Obligation to Pay Damages
Paessler is only obliged to pay damages pursuant to these General Terms and
Conditions if it deliberately or in circumstances amounting to gross negligence
breaches obligations owed to the customer. This limitation does not apply if
Paessler commits a fundamental breach of its obligations.
Without prejudice to its continuing legal rights, Paessler is not liable for a failure
to perform any of its obligations if the failure is due to impediments which
occur, e.g. as a consequence of natural or political events, acts of state, industrial
disputes, sabotage, accidents, or similar circumstances and which can not be
controlled by Paessler through reasonable means.
The customer is required in the first instance to rely on other remedies and can
only claim damages in the event of a continuing deficiency.
B. Amount of Damages
152 • Appendix
User Manual IPCheck Server Monitor 5
In the event of contractual or extra contractual liability Paessler will compensate
the loss of the customer to the extent that it was foreseeable to Paessler at the
time of the formation of the General Terms and Conditions.
§ 12 MISCELLANEOUS
1.Set off, Suspending Performance
Legal Rights of the customer to set-off against claims of Paessler for payment
are excluded, except where the corresponding claim of the customer has either
been finally judicially determined or recognized by Paessler in writing.
2. Place of Performance
The place of performance and payment for all obligations arising from the legal
relationship between Paessler and the customer is Fürth (Germany).
3. Applicable Law
The legal relationship with the customer is governed by the United Nations
Convention of 11 April 1980 on General Terms and Conditions for the
International Sale of Goods (UN Sales Convention) in the English version.
Outside the application of the UN Sales Convention, the contractual and noncontractual legal relationship between the parties is governed by the non-uniform
German law, namely by the BGB/HGB (German civil and commercial code).
4. Jurisdiction
The parties submit for all contractual and extra-contractual disputes arising from
these General Terms and Conditions to the local and international exclusive
jurisdiction of the courts having jurisdiction for Fürth (Germany).
5. Communication
All communications, declarations, notices, etc. are to be drawn up exclusively in
the German or English language. Communications by means of e-mail or fax
need to fulfill the requirement of being in writing.
6. Severability
If provisions of these General Terms and Conditions should be or become partly
or wholy void, the remaining conditions continue to apply.
Acknowledgements
Created using Indy Internet Direct - http://www.indyproject.org/.
This product includes cryptographic software written by Eric Young
([email protected]).
Uses the net-SNMP library, see “netsnmp-license.txt”
User Manual IPCheck Server Monitor 5
Appendix • 153