1
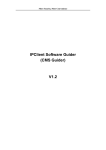
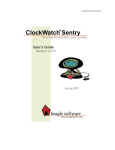
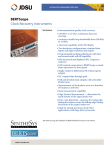
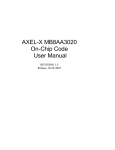
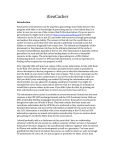
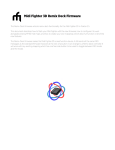
C-GEP 100 Monitoring
application user manual
1 Introduction:
C-GEP is a very versatile platform for network monitoring applications. The ever growing need for
network bandwith like HD video streaming and downloads results in higher and higher backbone
link speeds. Therefore 100 Gb/s links may become widespread in the near future. Deep traffic
analysis requires high processing powers even on 10 Gb/s, so a hardware aided solution for
handling 100 Gb/s solution may gets unavoidable.
2 Monitoring architecture:
Handling 100 Gb/s requires a distributed, scalable monitoring system consisting of many processing
stages to divide traffic into smaller units of coherent data. Typically Layer 3/4 flow classification
(fe. packets with the same IP governor parameters get forwarded to the same output interface), or
other protocol dependant classification rules are used (like GTP).
The monitoring architecture contains the following components as shown below:
- C-GEP 100 monitoring device programmed with the monitoring firmware and application
- SGA-ClockCard: timing synchronization for monitoring devices
- C-GEP 20/SGA10GD cards: receiving preprocessed traffic from C-GEP 100 devices, and
forwarding it to monitoring PC-s
3 Monitoring firmware services:
The firmware running on the Virtex 6 FPGA processor of the C-GEP 100 determines the
functionalities of the monitoring applications.
Depending on the needs, special functions can be integrated besides the basic services of the
firmware.
The default C-GEP 100 firmware modules offer a high speed on-the-fly, and lossless packet
processing. Monitored data buffering assures that short bursts of packet trains exceeding output
interface capacities are not dropped.
3.1 Main functions:
– physical interface controllers:
– 1Gb/s PCS/PMA and MAC layer implementation
– 10Gb/s PCS/PMA and MAC layer implementation
– 100Gb/s PCS/PMA and MAC layer implementation
– XAUI to XFI converter chip controller (over MDIO)
– SFP, XFP, CFP module controllers (over MDIO and I₂C)
– 1G/10G/100G interface status ucontrollers (over RS232)
– PCI-express v2.0 base controller
– basic DDR3 module controller
– chip-scale atomic clock
– system monitor: monitor FPGA specific variables (fe. core temperature)
– status leds
– application level interface controllers:
– DDR3 host controller for 100G to 10G applications (FIFO function)
– DDR3 host controller for 100G to 1G applications (FIFO function)
– PCI express application layer for register I/O and busmaster DMA
– 1G TCP/IP implementation for sending monitor data
– NTP time synchronization module for precise timestamping
– PTP time synchronization module for more precise timestamping
– SGA-ClockCard interface for centrally synchronized timstamp source of all SGA devices
– application level data processing modules:
– 100G packet processor module:
– Protocol decoder (ethernet, layer 3, application specific, and custom protocols)
– Configurable packet filter, with header chunker and output interface selector
– Packet head injector (add timestamp and other information)
– 100G traffic generator modules:
– generate ethernet traffic with static or dynamic parameters
– generate traffic with configurable data pattern, and packet sequence
– statistics modules:
– counters for received, filtered, bad frames, etc.
– speed measurements fe. Incloming interface data throughput (in KB/s, or pck/sec)
– event modules: interface events, error reporting; internal processing events (fe.
packet loss, no traffic, time sync error, etc.)
The picture above shows the basic architecture and functionalities of the 100 Gb/s monitoring core.
3.2 Monitor header insertion:
The current firmware configuration injects a monitoring header into the ethernet frame by
overwriting the ethernet headers, and the CRC checksum at the end of the frame. This method has
the advantage, that no additional overhead is created, data throughput remains the same. Also
except from the ethernet header, the protocol stack remains unchanged, packet processors can
decode the packet, software change is only needed at the end of the chain to interprete the injected
information (like the original 100G reception timestamp).
We can add an external header before or after the packet too, if the application requires the original
frame content unchanged.
Dst MAC address
MAC address
Src
Eth. type
DATA (IP)
… DATA ...
← CRC →
Ethernet-2 frame
Caplen
Frlen
Timestamp_high
Timestamp_low
Eth. type
DATA (IP)
… DATA ...
MAGIC code
C-GEP 100 Monitor-packet
4 The Web-based User interface for 100 Gbit/s
monitoring application:
C-GEP 100 has a web-UI management surface accessible from any web browser for controlling
functionalities, make setting changes, or check the state of the device.
4.1 Statistics menu:
The „Current” statistics submenu shows the current counter values and state indicators of the
device. Besides interface link states, generic receive counters, and other important monitoring
counters are shown.
Link indicator leds:
red: interface module not present (CFP, XFP, SFP)
orange: interface module present, no link
green: receive signal present, link ok
The „Live graph” submenu shows the current traffic load on the 100 Gb/s CFP input, and the output
load after processing on the 10 Gb/s XFP interfaces.
The traffic counters are saved and reseted in every 15 minutes. The „archived” menu shows the
saved values selectable by date and time.
4.2 Alarms and events:
The „Alarms and events” menu shows the important occurences (like link loss, or packet loss), and
informations regarding the operation of the C-GEP board. Also events are sent to a central event
manager server by a program called „C-GEP_poller”.
4.3 Settings:
This menu controls the main functionalities of the C-GEP device.
4.3.1 Filter settings:
The „Filters” submenu is used to set up the 64 filtersets of the C-GEP monitor core.
The default page shows an overview of the filter values. By opening a specific filter you can
configure:
– the output interface to forward packets the rule fits (it can be a range too for specifying packet
distribution)
– The „Link ID” written into the packets header (optional)
– All packets pass the filter if the „Catch all packets” is checked
– Filter mode: you can select to accept, or drop the packet when the rule fits
– Filter rule: in „IP src and Dst swapping” mode source and destination IP addresses (A → B), and
the opposite direction of addresses (B → A) are examined too.
– IP Addresses: You can specify a single address, or an arbitrary IP Address range
– IP protocol: not specified, or TCP/UDP (if needed, other protocols can be selected too)
– Port numbers
– Truncate: A maximum of this many bytes are captured from every packet matching the given rule
After configuring the filter setting you have to press the „Reload configuration” button to upload
the new ruleset to the device.
4.3.2 Packet Steering:
Packets with the same governing parameter are forwarded to the same output interface. This process
is called packet steering. Governing parameters can mean an IP flow (Source/Destination IP
addresses, protocol, and port values), or other protocol specific values.
By default we offer an „IP Fragment steering” setting to ease fragmented IP packet assembly, and
GTP-U (GPRS Tunneling protocol User-plane) steering used in mobile networks.
4.3.3 Simple Packet Generator:
The „Packet Generator” submenu contains settings for a simple 100 Gb/s ethernet frame/IP packet
generator for equipment stress testing, and other purposes.
Besides the basic frame level settings like frame length, and interframe-space you can specify frame
data, and sequence of frames to transmit too. As soon as you push the „Start” button the generator
starts to transmit frames according the configuration specified, and repeats the sequence until you
press the „Stop” button. A wide range of transmit functions and applications can be built on this
platform including traffic reproduction from DDR3 memory, or PCI-express DMA based replaying.
4.3.4 Time synchronization settings:
The time synchronization used in C-GEP 100 is the PTP version 1, which is a high precision timing
synchronization protocol designed for low latency ethernet networks. NTP, and SGA-ClockCard
synchronization is available too.
4.3.5 Poller settings:
C-GEP events are sent to a central event collector server. This settings are responsible for the
connection.
The „No traffic alarm” means, that an event is generated if no traffic is received in x minutes.
The „Poller interval” means the event polling frequency.
The „Critical core temperature” means that if the FPGA core temperature reaches this value then an
event is generated, and the device is shut down to prevent damage.
4.3.6 Export, Import settings:
All device setting can be exported into a structured xml file
Also you can import the settings from a previously saved or edited xml.
4.4 System menu:
This menu contains the main controls of the device and its interfaces.
4.4.1 Interface control:
You can individually enable or disable the input (100 Gb/s) and output (10 Gb/s) interfaces here.
4.4.2 C-GEP 100 ID and IP:
The Devices name and management IP Address can be specified here.
4.4.3 Reset / Reload config:
Reset the whole FPGA core (necessary only after firmware change), or the interface settings only
(filter settings).
4.4.4 Shutdown / Reboot:
Shut down, or reboot the device by issuing a halt or reboot command to the Linux-OS.
4.4.5 Temperatures:
The FPGA core temperature, or the management PC-s temperature can be observed here
4.4.6 Firmware:
Firmware upload is handled by the built in JTAG programmer. You have to specify the new
firmware file, and push the „Start” button to begin the upload process.
Also you can view the current firmware release date and last upload date here.
During firmware upload the device is not operational, and does not take any new commands!
When firmare upload is finished you have to make a full reset by menu, or restart the system.
4.5 Administration:
Change password for the currently logged in user.