1
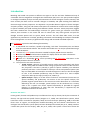
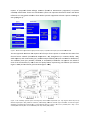
CLIM MADAPT is a w web‐based d decision sup port system m for guidancce on forest sspecies suita ability und der current and future cliimate changge scenarios.. The CLIMADAPT projecct was funde ed by COFORD, Department oof Agriculturre, Food and d the Marinee Developed by Forest Ressearch UK in collaboration with FERS Ltd and Met Èireann 1 Introduction Matching well suited tree species to different site types is the first and most fundamental step of sustainable forest management. Ecological Site Classification (ESC) has in the past provided support on ecological suitability analysis and site yield estimation for forest managers in other countries, and more recently has been used to consider changes in suitability and yield resulting from different climate change scenario projections. The objective is to provide decision support to forest managers and policy makers, using soil and climatic information for Ireland that can be used to assess changes in species suitability and yield resulting from different climate scenarios. Future projections suggest that both medium‐low and medium‐high scenarios for green house gas emissions will induce warmer, drier summers in the south and east of Ireland. This may affect growth and yield for drought sensitive species such as spruce, beech and ash. This will allow wide access, use and application to practitioners in Ireland; providing information and knowledge to underpin sustainable forest management in a century of global climate change and increased woodland expansion. The CLIMADAPT system has the following functionality: 1. A web based user interface, capable of providing ‘rich client’ functionality over and above that of a conventional website. The interface will enable users to analyse spatial data using a set of GIS utilities. 2. Provision of a ‘grid’ spatial information suitable for display within the user interface. 3. Provision of point based information suitable for display and for use within calculations. 4. Enabling users to create and store map features. 5. Provision of a knowledge‐based service providing textual descriptive information to be displayed within the user interface. 6. The system has two main functions: o Stand analysis: selection of suitable species under current (baseline) and future climates using 2050 and 2080 climate change projections based on Met Eireanns’ c41 projections. The DSS is primarily a guide to species suitability, but indicative potential yield class is also included for 20 major current and potential species (see Ray et al 2009; Black et la 2010) for scientific background. Users are also encouraged to refer to the TEAGASC productivity map for Sitka spruce for a more in‐depth analysis for Sitka spruce crops (Farrelly et al., 2009 a, b). o Spatial analysis: display of all ESC factors and other environmental constraints on species suitability and productivity. IN contract to the site specific analysis, this provides regional spatial data for the entire area under observation at a resolution defined by the user. For example, spatial analysis can be conducted on a country scale of for a specific area forest. Spatial functionality id provided for regional planning or development of other DSS. The functionality is supported by GIS databases located on the host server How does ESC work ? Forest growth, function and productivity are influenced not only by climate, but by the interaction of climate, soil type and site specific factors (Horgan et al., 2004). Site classification systems, which have been used in Scandinavia (Cajander, 1926) and central Europe (Ellenberg, 1988) to describe forest cover of regions, use biophysical variables describing site and climatic characteristics. An ecological site classification system (ESC) has been developed for Ireland (Ray et al., 2009), based on a similar GIS system for the UK (Ray, 2001; Ray et al., 2003). This system is also used to assess the 2 c scennarios (base ed on Met Eireann E projjections) on n species impacts of projecteed climate change suitabilitty. Multi‐facctor forest site classificattion system use inputs tto characteriise biotic and abiotic influencces on tree ggrowth which h are then ussed to provide support o on selection species acco ording to site typee(Figure 1). Figure 1: A A schematic rep presentation off required user iinputs, EC facto ors and outputs from the CLIMA MADAPT DSS The ESC C approach describes d the e response oof all major forest species in Irelandd and the UK K to four climatic factors: warrmth (accum mulated tempperature ‐ A AT), droughtiness (i.e. mooisture deficcit ‐ MD), posure, and continentality (CT), baseed on Delphi models (see e Pyatt et al 22001 for deffinitions). wind exp The suittability class (Very Suitable, Suitablee, or Unsuitaable) of diffe erent tree sppecies was linked to each of the climaticc factors, and d to two soi l quality facttors representing soil weetness (soil moisture NR). regime –– SMR) and ssoil fertility (soil nutrientt regime – SN Figure 1: The suitability of Sitka spruce according too a) Accumulateed Temperaturre (AT ‐ day deegrees above 5ºC) 5 and b) Moisture Deficit (MD ‐ m mm), DAMS or windiness, conntinentality, SM MR‐soil moisture e regime and SSNR‐ soil nutrie ent regime. n a scale from 0 0 to 1, where liimiting factor (( f ) values >= 0 0.75 is very suittable (GYC > 20 0), >= 0.5 is Suitabilityy is classified on suitable (G GYC 10 to 20) a and < 0.5 is Unsu uitable (GYC < 110, see Ray et a al., 2009). 3 Sectio on 1: Reggistration n Site locaation and reggistration Navigatee to http://8 82.165.27.141/climadapt__client/index.jsp or CLIM MADAPT porttal on the CO OFORD website (insert link) using your w web browserr. For best re esults use Mo ozilla Fire foxx, but latest versions of chrom me or explorer will work as well). 1) Registerr your detailss Register you ur details or llogon if alreaady registere ed (remembe er your usernname and pa assword) Figure 3: The R Registration pag ge <Submit> 2) If you haave previoussly registeredd, just enter user name and passwordd Figure 4: TThe logon pagee Note: Enssure that pop ups are not bloccked on your brrowser or that the antivirus d does not block tthe execution o of the web applicatio on. This can be done by chang ging your browsser options (go o to help for the e specific brow wser you are usiing). Also, dependingg on the speed d of your DNS line response tim mes may be slo ow, so be patie ent. 4 Section 2: Stand d analysis The stan nd analysis w window open ns once you hhave logged on. The wind dow has 4 m menus on the e top right of tthe screen a)Site, b) Stan nd, c) Deletee and d)Repo ort. The Spatiial analysis caan be selected on the botttom left of th he screen (se ee section 2) Figure 5: TThe webpage affter logon is completed 2.1 Addiing a site Click <site> and <add site> A googlee map will ap ppear. Enlargge to requireed scale (clickk on the + orr – icon or m move map using direction n icon, see reed circle, Figure 6). The eenlarged map below show a site seleected in Cloosh forest Seleect site with m mouse or ennter grid refe erence Clickk <OK> Wheen the site has been seleected a red arrow will ind dicate the sitte and a grid refeerence Figure 6: SSelection of you ur site 5 e plus icon next to stand analysis) to show Now, exxpand the Staand analysis directory (i.ee. click in the sites seleected (Figuree 7). Also exxpand the directory d for your seleected site (e.g. Cloosh)), 2 boxes will appearr a) site characteeristic definittions showin ng that defauult soil charaacteristic are selected (i.ee. SMR and SSNR) and b) a results box with a drop down list for cclimate change scenario (in this exam mple the baseline or current climate is seelected). Figure 7: D Display of your site characterisstics and resultss options 2.2 Defining site chaaracteristics There arre numerouss options for defining thee site charactteristics. The ese vary in coomplexity de epending on the aamount of infformation th he user wishees to include e in the analyysis. 2.2.1 Op ption A: Defaault selection ns This option utilises u underlying sp patial data w which specifie es the soil moisture regim me (SMR) and soil R). These are e based on thhe indicative e soil map an nd functions using soil type as an nutrientt regime (SNR indicato or (Ray et al., 2009, Figure e 1 appendixx A). Note: Thee definitions of SSNR do not con nsider applicatioon of fertiliserss. If fertilisers ha ave been applieed do not use tthis default option. Allso the underlyying soil mappe ed used is base d on a model aand is only indicative, so in soome cased the underlying soil type and associated d soils characte eristics may noot be correct. For these reasons we recom mmend using Option O B or higher. To display the resultts for specie es suitability click on the e results box as shown inn Figure 6a. A results and panel. window will appear in the left ha There arre 2 option w windows witthin this pannel a) suitability (which is highlighteed dark blue in figure 8b) and b) indicativee yield which h can be seleccted with the mouse (Fig gure 8b). The suittability undeer future clim mate change can be sele ected from the drop dow wn box in the results box under the site under analysis. 6 Figure 8a:: Results panel sselection and panel for speciess suitability for the baseline cliimate Figure 8b:: Results panel sselection and panel for indicattive yield class ffor the baseline e climate Figure 8c: Species suitabiility for the Cloo osh site under ffuture climate cchange by 2050 0 assuming the AA1 scenario. 7 Interpretation of results Species suitability: Species suitability under the selected climate scenario recorded as very suitable, suitable or not suitable in the text in the SUITABLILTY column in the results panel. The LIMITING factor is also shown in the adjacent column. In this example (Figure 8a) Alder is not suitable and the limiting factor is DAMS (wind and exposure). The suitability of species with regards to the ecological site classification (ESC) factors (i.e. AT, DAMS, MD, SMR, SNR and CT) are also shown as very suitable (dark green), suitable (light green) or not suitable (white). The example shown in figure 8a relates to the current climate. Future suitability can be displayed by changing the climate scenario in the results box in the right hand panel of the stand analysis window (Figure 8c). You will now notice that some species will not be suitable under future climate, although they are suitable under the current climate. Periods up to 2050 or 2080 can be selected for these analyses. There are a range of scenarios (SRES) for climate change projections depending on global economic, population changes, regional factors, future reliance on fossil fuels and stabilisation assumptions. Only scenarios A2 and B1 are selected for this DSS since they reflect the medium to high (A2) and a high (B1) ranges of future climate change. Indicative yield class: The indication of indicative yield is expressed as a general yield class in the Predicted Yield column (Figure 8b). This also provides the most limiting ESC factor and a suitability indication. The predicted yield does not consider increased or decreased in yield associated with the use of different provenances or silvicultural/management practice which can alter potential yield (e.g. cultivation or fertilisation). Suitability indicators assume a greenfield site. For different provenances of Sitka spruce, there is a potential increase of 2 YC when Washington is planted instead of QCi, this can further increase if genetically improved material is planted. It should also be noted that provenances of Lodgepole pine or Douglas fir are not considered. Please refer to Horgan et al 2004 for guidance on provenance selection. Dangers of using the default method Experienced forester may notice that the suitability and yield for Sitka in the given example do not reflect the real situation. This is because the underlying soil spatial data is not correct for this site. Also, soils drainage of, or application of fertilisers to, the site are not considered when the default option is used. It is recommended that the default option is used as a last resource and results should be interpreted cautiously. It is always better to conduct a site visit and collect information outlines in options B below for a more accurate assessment of species suitability and potential yield. 2.2.2 Option B: Define soils type Soil type is one of the most important indicators of suitability, particularly in relation to SMR. These can be beater defined for the site in question if the soil type is known together with information of rooting depth and stoniness. This method provides the best indicator for SMR. Although SNR is more 8 n B, analysis of vegetatio on on site is tthe best to ccharacterise SNR (see accurateely depicted using option option D D). The iden ntification off soils require es a bit of traaining and experience. A Appendix 2 pprovides a ba asic guide to soils types usingg description ns used in thhe National Forest Inventory. Soil sscientists will always mend digging a soil pit to view the soiil profile befo ore identifica ation is attem mpted. To sa ave time, recomm look for exposed pro ofiles near d drains, road ccuttings or u uprooted trees. This can be useful to o identify spatial vvariations in soils on the site if a laayer from th he profile is cleaned offf with a spade along various points. If no o soil profile es are visibl e on site, a soil auger may be use d. If you are feeling extremeely energetic dig a 1 m so oil pit. Please reefer to the fo ollowing guid des for identtification of ssoils in Irelan nd: A Guide to FForest Tree SSpecies Selecction and Silvviculture in Irreland. Horggan et al 2004 4 Field guide: The identification of soiils for forestt management. Kennedyy, 2002 me example pprovided for Cloosh: To utilisee option B using the sam a) Select the <SStand> menu in the Stannd analysis m menu and select <Define soil> from th he drop down menu (Figure 9, sttep a) b) An extra bo ox called ‘So oil type’ will appear in the t right han nd panel beelow the deffault box (figure 9 steep b) . Click o on this box tto show the soil definition in the lefft panel of the Stand analysis win ndow. This includes a ddrop down box for soill type speciification and d control buttons to m modify SNR o or SMR manuually. c) To access th hese controlss you must fi rst deselect the buttons for SNR and SMR (figure e 9 step c). d) Then select the toggle buttons in thee Soil type bo ox as shown in Figure 9 sstep d. e) You can now w enter the d description foor soils in the left panel a c b b d Figure 9a:: Definition of soil type to charracterise SNR annd SMR f) First select tthe soil type from the droop down list. For this site e we know thhat these are e flushed blanket peatts as shown in Figure 10.. 9 Figure 10:: Selection of so oil type g) You will now w notice thatt the SNR hass changed to o poor (P) and SMP has c hanged to w wet (W) on the slide control scale e h i Figure 11:: Changing rootting depth, ston niness and mannual adjustmentt of SNR or SMR R h) The rootingg depth defa ault value (330 cm) for this t soil typ pe can be chhanges to the value obtained following yourr field visit. IIn this case w we selected 20cm becauuse the soil was very dence on site e form blow n trees suggests a rootin ng depth of 220cm (Figure e 11, step wet and evid h). The ston niness value of 0 % for thhis soil was deemed to b be correct, sso this value was not changed. Sto oniness for ssome soils suuch a Lithosols, for exam mple, can be e very high (d default is 15%). i) The SMR or SNR can be manuallyy changed by b dragging the scale tto the desirred level depending o on fertilisatio on or cultivattion of the siite. To run results, click on the re esults box inn the right haand panel. You will now no otice that prediction of species suittability is much better. When you compare figure 9a to Figgure 12, you can see th at only Lodggepole pine is very suit able for thiss site, as expeected. The default metho od suggests tthat Sitka sp pruce was alsso very suita ble, which in n unlikely (figu ure 9a). 10 Figurre 12: Results off the Cloosh site e following useer defined classif ification of soilss type and modi dification of SMR R and SNR 2.2.33 Option C: SSpecify Soil Quality Thiss option can be used if th he user cannnot visit the ssite and does not know tthe soil type e, rooting e informationn on soil nuttrient status and moisturre, based on previous deptth etc., but tthey do have obseervation, lab boratory resu ults, archivedd data from the site. For this option, the SNR or SMR can be sselected from m a drop dow wn list using expert judgement or the soil characcteristic figurre shown in Appendix A. To u utilise option n C: a) Select the <<Stand> men nu in the Sta nd analysis menu and select <Speciffy Soil Quality> from the drop dow wn menu (Fiigure 13). Ann extra box called ‘Specified Soil Quallity’ will appe ear. b) Be sure to seelect the SNR and SMR ttoggle button n in this box if option C iss to be used. You will notice the aappearance o of 2 drop doown box listss in the left panel. (Figu re 13). These can be selected to b best characterise the soi ls. ults as before e and note t he difference in the pred dicted outpuuts. c) Run the resu Figurre 13: Specificattion of soil quallity using optionn C 2.2.44 Option D: Specify vege etation The best way to o characterisse the SNR oon a site is to conduct a vegetation survey. Beca ause this R, it is best too use option B in combin nation with ooption D for SNR. The option does not modify SMR pressence of cerrtain key sp pecies is direectly related d to the soil nutrient sstatus. For example, e 11 Calluna vulgaris is often an indicator of poor SNR, while species such as Geranium robertianum (herb Robert) are indicators of good fertile soils. Take particular care noting trees in adjacent forest sites or hedgerows. It is likely that ash, for example, might not be suitable if there is no sign of these species in the landscape. 2.2.4.1 A guide to vegetation surveys Care should be taken when characterising vegetation because some species may occur on site temporality due to soils disturbance, so it is best to note as many species as possible with the relative ground cover in several quadrants (1 m2). Try to identify different common patches where the vegetation populations are slightly different (i.e. different releves), but they are well representative of vegetation on site. It is much easier to identify species when they are in flower because most identification key use flower structure as the main guide. For these reasons, it is best to conduct surveys in Summer or autumn. Where, there is no vegetation cover in the forest understory, it is best to conduct a survey close to the site where soils are the same. The vegetation survey requires rather specialised knowledge, but with a good field guide book and some practise you can get good at species identification. The following field guide books are recommended: Rose (2006). The Wild Flower Key. How to identify wild flowers, trees and scrubs in Britain and Ireland. Penguin Books ISBN 13 978‐0‐7232‐5175‐0 Webb et al (1996) An Irish Flora (7th ed) Dundalgan Press. IBN 0‐85221‐131‐7 Page (1997) The Ferns of Britain and Ireland, Cambridge Press. ISBN 0‐521‐58658‐5 For example, assume you conducted a survey on the site in Cloosh and 3 quadrants you identified the following species and distributions: Releve 1: Calluna vulgaris 20%, Osmunda regalis (Regal fern) 2 %, purple moor grass (Molinia caerulea) 10 % and Sisymbrium officinale 2 % (wild mustard a species suggesting better nutrient status). This may suggest that the site was fertilised before because of the presence of wild mustard, but the low occurrence would indicate that SNR is not changed. Releve 2: Calluna vulgaris 10%, Molinia caerulea 5 %, Sisymbrium officinale 10% Vaccinium oxycoccos 20 % and Eriophorum angustifolium (bog cotton grass) 10 % Releve 3: Calluna vulgaris 20%, Osmunda regalis 3 %, Molinia caerulea 10 % and Eriophorum angustifolium 5 % All of these species suggest a poor SNR The compile the information under option D do the following: a) Select the <Stand> menu in the Stand analysis menu and select <Define vegetation> from the drop down menu (Figure 14). b) Select SNR in the ‘Vegetation’ box below the ‘Specified soil quality’ box in the right panel. Be sure to select SMR from either the ‘Default’, ‘Soil Type’ (recommended see figure 14) or ‘Specified soil quality’ boxes. 12 Figure 14:: Selecting the vegetation specification to moodify SNR c) You will notice a new window in thee left panel. To add speccies and distrributions forr the first ow and start typing the ggenus, you w will notice releve (plot)) place the curser in the open windo a list appearrs and it updates as you type the spe ecies name (e e.g. Calluna vulgarus forr Cloosh). Select the sp pecies and itt will appearr under the sspecies list in n releve 1 (Fiigure 15). No ow enter the percenttage cover (20 using th is example). The SNR bar b on the sslide rule ab bove the species wind dow may cha ange if a spe cies indicativve of a differrent SNR is eentered. Figure 15:: Entering speciies and % coverr for different reeleves on the site. d) Enter all thee species identified in all of the releves in the site e. If a speciees does not o occur in a specific releve, enter the e % cover ass ‘0’. It is nott always posssible to identtify all the sp pecies so the % cover does not ha ave to add too 100%. Also in some cases there mayy be patchess with no cover. e) To delete an n incorrect sp pecies entry highlight the e entry and cclick <Deletee> Releve> and filling the % cover of speecies entered d. By the f) To add a releeve simple select <Add R end your scrreen should look like thee table shown n below (Figu ure 16). You may havve noticed th hat the SNR hhas changes from Poor (P) when usinng option B tto define SNR (see Figgure 11) to ve ery poor (VPP) based on vvegetation co over. (Figure 16) 13 Figurre 16: The comp pleted species d distribution tablle for Cloosh Now w run the ressults by seleccting the clim mate scenario o as before. You can now seee that Lodgepole pine is ssuitable (using the vegettation specifiication of SN NR, Figu ure 17) comp pared to veryy suitable, whhen the Soil type charactterisation of SNR is used (see Figu ure 12). Figure 17: results 2.3 Runn ning results,, saving and printing resuult 2.3.1 Vieewing resultss in the Stand analysis w indow The resu ults for any sselected stan nd can be vieewed by clickking on the re esults box loocated below w the site name an nd site definiition parame eters. E sure that the correct options are selectedd for SNR and d SMR before rresults are ru un (see sectio on 2.2 Optio ns A and B fo or details, yo ou have donee this before e). 2.3.2 Savving and prin nting results as a pdf file . The view w the resultss data in a pd df file: a) Select the climate scenario in the ressults section (see Figure 18). The ,Suiitability> and d <yield> results should be displayyed in the lefft panel. 14 wn on the leeft hand side. Figure 18: The resultts panel show b) Now select <<Report> fro om the Standd Analysis me enu. A new b browser pagee will open a as pdf file (Figure 1 19). You can save or printt this by sele ection the ap ppropriate icoon (circled in n red). An example of a results file is provid ed below an nd a file called cloosh.pdff in your fold der or cd. Figure 19 the pdf results page The info ormation listeed includes ssite name, coo‐ordinates e easting and n north and cliimatic factorrs for the default cclimate (i.e tthe current cclimate), 20550 a2 (Figure 20), 2050 b1 1 and 2080 aa2. Climatic ffactors include 15 Accumulated (temperature) in this ccase 1840 day degrees ab bove 5 deg CC Continentaliity (3.5 in thiis case) sites with values greater thatt 1 are inlandd. Sites far in n land have values of 7 of moderate exposure, higher values indicate higgher exposure. DAMS (16.9) indicative o means surpluus water). De eficit values are positive and vary fro om 0 to Moisture deeficit ‐9999 (m 400 mm. SNR and SM MR using the selected deffinition optio on (A to D se ee section 2.22) The method d used to calcculate the SN NR and SMR are show ab bove the speccies suitability data (see Figure 2 21) Figure 20:: Climatic reporrts for future climate Figure 21:: Methods used d to calculate SN NR and SMR annd list of speciess suitability und der the selectedd climate scenarrio (current cllimate in this exxample) 16 Section 3: Spatial an nalysis 3.1 Naviigating to thee area of inte erest for youur study Click on ,<Spatial analysis> at bo ottom left of screen ng should appear…………… …………… The followin 17 a) Select on Go oogle hybrid to show roaads and town ns (not all tow wn and vilige es are shown, but tthese can bee used as a guide to locatte your site) b) Adjust scale and locationn to clearly sshow your arrea of interesst.(red circle e) Figure 22:: Cloosh area ha as been selecteed again! Seleect required e environmenttal factors. FFor example select frost rrisk by clickin ng on the box under baseline envirronmental faactors. Notee environme ental factors under future e climate cha ange scenariios up to 208 80 can also o be observed d in the sam e way) 18 Figure 23: Frosst risk zones in tthe Cloosh regioon (red is high, green is low) The opacity of th he GIS layer can be reduced by clickin ng the ‘‐‘ barr next to frosst risk ure 24). This should enabble you to see the site with overlayingg GIS information. In (figu this example the e frost risk w would be med dium (see leg gend yellow value is 2, 1is low, 3 is high (red)) Figure 24:: Changing the opacity to see yyour area or forrest of interest Alteernatively the e warmth inddex can be se elected by, cclicking off frrost risk and seleecting AT (acccumulated teemperature above 5 dayy degrees) thhis is a warmtth index, wheere higher va alues represeent warmed climates whe ere productiivity would ggenerally be h higher. In this example thhe site AT value is 1750 to 1800 day ddegrees under the currrent climate (Figure 25). 19 Figure 25: AT fo for regions surro ounding Clooshh forest Ano other site factor with influuenced prod ductivity and yield would be continen ntality (a meaasure of dista ance from thhe ocean). Fo or example in nland regionns would generally be cooller with more frequent f rosts. You m may have noticed the scalle of the map p in figure 26 has been reduced tto show how w continetality varies acrooss the whole ntry. coun Figure 26:: Continetality A AT for regions ssurrounding Clo oosh forest Any number of e environmenttal factors caan be investig gated for reggions or sitess for ure climates. currrent and futu 20 hanges 3.2 Anallysis of futurre climate ch If you would like to ssee future climate click oon <2050 Envvironmental Factors> or <2080 mental Facto ors> the sam me selection bboxes will ap ppear. Environm Note: th he 2080 scenario does no ot have the bb1 scenario b because thesse simulationns were not a available form Meet Eireann att the time the project waas completed d. For example the e two maps oof the Galway region belo ow show thee change in A AT Figurre 27a: AT for G Galway under tthe current clim mate Figurre 27b: AT for G Galway under tthe A2 climatecchange by 2050 0 In this exxample you can clearly see AT, and w warm index w will increase,, but there iss not always good news…… …. Figure 28 shows how w soil moistu ure deficits w will increase iin the SE regions of the ccountry: 21 Figure 28:: SMD under cu urrent climate ccompared to 20 080 (bottom pa anel) 22 w exposure a and windinesss will increaase in the Ma ayo Donegal region unde er future Figure 29 shows how narios. climate change scen 3.3 Using the mosaicc function 23 nmental facto o together w with a satellitte map This function is use ffull if you wissh to displayy the environ o do this clickk <Add mosaaics> and exp plore to the rregion of inteerest. of the saame area. To 24 References Black et al. (2010). Climate Change Impacts and Adaptive Strategies. Journal of Irish Forestry.67 125:139 Cajander, A.K., 1926. The theory of forest types. Acta Forestalia Fennica, 29: 1‐108. Ellenberg, H., 1988. Vegetation ecology of Central Europe. Cambridge University Press, Cambridge. Farrelly et al (2009a). The use of site factors and site classification methods for the assessment of site quality and forest productivity in Ireland. Irish Forestry 66: 21‐39 Farrelly et al (2009b). The distribution and productivity of Sitka spruce (Picea sitchensis) in Ireland in relation to site, soil and climatic factors Irish Forestry 66: 51‐74 Horgan, T., Keane, M., McCarthy, R., Lally, M. and Thompson, D. (2004) A Guide to Forest Tree Species Selection and Silviculture in Ireland. Second Edition. Ed J O'Carroll, Coford, Dublin. Kennedy, F. (2002). Identification of soils for forest management. Forestry omission field guide. Forestry Commission – Edinburgh. Ray et al (2009)Developing a site classification system to assess the impact of climate change on species selection in Ireland. Irish Forestry 66: 101‐123 Ray, D., 2001. Ecological Site Classification Decision Support System V1.7. Forestry Commission – Edinburgh. Ray, D. and Broome, A., 2003. Ecological Site Classification: supporting decisions from the stand to the landscape scale, Forest Research Annual Report 2001‐2002. The Stationery Office, Edinburgh. 25 Appen ndices Appen ndix A: De efault soilss characteeristics Figure 1: A A Guide for soil moisture classsification Soil m moisture regime e (SMR) can be v very dry to slighhtly = well drain ned, fresh to very mo oist = moderatee and wet to ve ery wet = poorlyy drained. Soil n nutrient can vary from carbonnate to ver poor dependingg on the soil typ pe identified ussing the indicattive soil map. 26 Append dix 2: Some e guides to ssoils identiffication (takken form th he NFI) Each soil group is briefly b described in the following se ection. The photographs p s labelled ©Teagasc, 2007 weere reproduced with the permissionn of Teagascc from a pre esentation tto the Forest Service (Radford d,2004). Pho otographs la abelled ©Cooford, 2007 were repro oduced withh the permission of COFORD D from AGu uide to foresst Tree Speccies Selection and Silviculture in Ireeland (Horga an et al., 2003). Brown eearth Relatively mature, w well‐drained mineral soilss, derived from parent m materials of aacidic or bassic status (Figures 2‐4).These ssoils possesss a rather un iform profile e with little d differentiatioon in horizon ns and no removall and deposition of mate erials such ass iron oxidess, humus or clay, althouggh constitue ents such as calciu um and magnesium mayy be leached to some exttent. They o occupy approoximately 13 3% of the land areea of Ireland. Figure 2. B Brown earth. Figure 3.A Acid brown eartth. Figure 4. H High base brow wn earth. Grey bro own podzoliic These w well‐drained mineral soilss are similarr in many resspects to the e brown earrths, except that clay has been translocatted from the e surface to a sub‐surfacce layer (horrizon) (Figuree 5).They are usually 27 dominantly llimestone co omposition a and have a m medium to h high base formed from glacial drift of pred saturatio on status. Th hey occupy a approximatelly 24% of the e land area o of the countrry. Figure 5. G Grey brown pod dzolic (left) and d Grey brown poodzolic (right). podzolic Brown p Well‐draained, acid m mineral soils, derived maiinly from aciidic parent m materials succh as shale, ggranite or sandstone (Figure 6 6). Located o on hills and rrolling lowland. They are e formed unnder the influence of the podzolisation prrocess, subje ect to some lleaching. Du ue to the pre esence of iroon oxides the e horizon has a red ddish‐brown n colour. Thiss group occuupies approxiimately 12% of the land aarea of the ccountry. Figure 6. B Brown podzolicc. Podzol These so oils are subjject to inten nse leachingg of minerals, particularrly iron and aluminium, and are formed from acidic parent materials (Figur e 7). They have h a distin nct sequencee of horizons, with a subsurfaace layer of rremoval, the e A2 horizon and subsurfface layer of accumulatioon, B horizon n. Due to severe leaching of irron and cem mentation, soome podzols may develo op a thin imppervious ‘iron pan’ in theB horizon. They may have a peaty surfacce layer of less than 30 cm drained or 45 cm undrained and aree located on n mountain and hill lannd, where the t high rainfall is a m major factor in their development. They occupy apprroximately 8% % of the land d of the coun ntry. Figure 7. P Podzol (left) and d Peaty podzol (right). 28 Gley This gro oup containss soils in wh hich the effeects of drainage impedance dominnate (Figure 8). They develop under cond ditions of perrmanent or iintermittent waterloggin ng. The mineeral horizons of Gleys ottling frequ uently evide nt. Rooting depth is are greyy or blue‐greey in colourr, with distinnct rusty mo usually limited, aeraation is poo or and rate oof organic matter m decom mposition iss slow. The impeded conditio on may be du ue to a high water level,, seepage orr springs, or it may be duue to the im mpervious nature o of the parentt material. Gleys occupy approximate ely 22% of th he land area of Ireland. Figure 8. G Gley. na Rendzin These arre well‐drain ned, shallow mineral soil s (Figure 9).TThey are very dark in collour, with a h high lime content. Derived fro om limestone bedrock, oor limestone e sands and gravels suchh as eskers, they are less than n 50 cm in deepth. Figure 99. Rendzinas.. Figure 35. R Rendzina. Peats For an area to be claassified as pe eat, the peatt depth has to be greater than 30 cm on drained a and 45 cm on undrained lan nd. Peats are e divided intoo two basic ggroups: Basin peeat Basin peeat consists o of fen peat and raised boog.Fen peat o originally forrmed under tthe influence e of base rich ground water in n shallow lakebeds and depressionss in the landscape. It is uusually alkaline in its me more acidic and thee vegetation changes lower laayers but as it develops,, the upper layers becom from on ne dominateed by Phragm mites and CCarex speciess to one of Sphagnum aand Calluna species, resultingg in raised bo og. Blanket peat wer elevatio Blanket peat occurs in wet, cold d and acid coonditions in e elevated are eas and at low ons along the westtern seaboard. Blanket p peat usually extends ove er the entire landscape, ccovering the hills and valleys. Its vegetatiion is usuallly dominateed by acid‐loving plantts, such as Sphagnum, Calluna, 29 orum, Erioph horum and M Molinia speciies. When it occurs at elevations greeater than 15 50 m it is Tricopho describeed as ‘high leevel’; below tthis, it is des cribed as ‘low level’ blan nket peat. Regosol This gro oup consistts of minerral soils, whhich are im mmature an nd show litttle distinct horizon development (Figuree 10). They o occur in low lying at areaas along riverr courses, lakke‐beds or att mouths of river estuaries. The T texture varies v from ssands to clays, drainage e ranges from m excessive to poor. These m may be acid o or alkaline de epending on the source o of deposits. Figure 10. Regosol. Sand Soils occcurring in this t group are a found iin coastal regions and are charactterised by the t high percentaage (>90%) of sand con ntent (Figuree 11).These soils s have ve ery little horrizon differe entiation. Due to tthe absence of clay and silt particless, these soilss have poor nutrient andd moisture rretention capacityy. Figure 11. Sand. Lithosol ow and stony mineral sooils, usually o overlying solid or shattereed bedrock ((Figure These arre very shallo 12). Locaated mainly at higher ele evations wheere they are associated w with podzols.. These soils are frequently characterrised by outccropping roc k and may occur on stee ep slopes. Figure 12 Lithosols 30