1
The CAMEO Software System
®
ALOHA
®
USER'S MANUAL
February 2007
E
TA
NA
GENCY
VIR O N M
N
IO
•
•
EN
D STAT
ES
ITE
UN
L PROTEC
T
U.S. ENVIRONMENTAL PROTECTION AGENCY
Office of Emergency Management
Washington, D.C.
NATIONAL OCEANIC AND ATMOSPHERIC
ADMINISTRATION
Office of Response and Restoration
Emergency Response Division
Seattle, Washington
Terms and Conditions for ALOHA®
The recipient of the ALOHA software and documentation agrees to the following guidelines and
restrictions:
Use and Distribution Restrictions
ALOHA is available at no charge to those organizations and individuals (recipients) responsible for the
safe handling of chemicals.
Certain physical property data and equation coefficients contained in ALOHA have been supplied by, and
are the property of the Design Institute for Physical Properties (DIPPR®). DIPPR data shall not be
duplicated by the recipient without written permission from DIPPR. Additionally, ALOHA contains other
copyrighted information including ERPGs published by the American Industrial Hygiene Association and
AEGLs published by the National Advisory Committee for AEGLs. The recipient shall honor all
disclaimers and other limits of liability associated with those organizations that have provided data in the
compilation of the ALOHA chemical database.
Limitation of Liability
The United States Government has used its best efforts to incorporate accurate and complete data into
ALOHA. Nevertheless, the United States Government does not warrant accuracy or completeness, is not
responsible for errors and omissions, and is not liable for any direct, indirect, or consequential damages
flowing from the recipient's use of ALOHA.
The ALOHA software is being distributed "as is" and the United States Government does not make any
warranty claims, either express or implied, with respect to the ALOHA software, its quality, accuracy,
completeness, performance, merchantability, or fitness for any intended purpose.
Indemnification
Non-governmental recipients shall indemnify and save harmless the United States and its agents and
employees against any and all loss, damage, claim, or liability whatsoever, due to personal injury or death,
or damage to property of others directly or indirectly due to the use of ALOHA by the recipient, or any
other act or omission of the recipient, including failure to comply with the provisions of these terms and
conditions.
Editing
Any unauthorized editing or alteration of ALOHA chemical data or information provided by the United
States Government will result in the termination of the agreement between recipient and the United States
Government. Upon receipt of notice of termination, the recipient shall immediately return all ALOHA
information to EPA/NOAA, including all documents and all copies of software containing ALOHA
information.
Maintenance
Recipients should keep EPA/NOAA informed of any changes to their contact information. This
information is necessary so that the United States Government may notify users of any ALOHA program
changes or if updated information becomes available.
Trademarks
CAMEO®, ALOHA®, and MARPLOT® are registered trademarks of the United States Government.
Table of Contents
Chapter 1: Welcome to ALOHA. . . . . . . . . . . . . . . . . . . . . . . . . . . . . . . . . . . . . 11
About ALOHA ..................................................................................................................11
Program purpose ....................................................................................................11
Basic program organization ...................................................................................11
ALOHA's menu bar ...............................................................................................13
Getting help............................................................................................................14
In Windows................................................................................................14
On a Macintosh ..........................................................................................14
How to use this manual......................................................................................................14
Modeling in ALOHA.........................................................................................................15
Introduction to dispersion modeling ..................................................................................15
What is dispersion? ................................................................................................16
Gaussian model..........................................................................................16
Heavy gases ...............................................................................................17
Classification of heavy gases .....................................................................17
Flash-boiling and two-phase flow..............................................................17
ALOHA can choose a dispersion model for you .......................................18
Introduction to fires and explosions...................................................................................18
What is a fire? ........................................................................................................19
Thermal Radiation Levels of Concern.......................................................20
What is an explosion? ............................................................................................21
Overpressure ..............................................................................................21
Overpressure Levels of Concern................................................................22
Hazardous fragments .................................................................................23
Types of fire and explosion scenarios................................................................................23
Jet fires ...................................................................................................................24
Pool fire..................................................................................................................24
BLEVEs .................................................................................................................25
Fireball .......................................................................................................25
Explosion and hazardous fragments ..........................................................25
Flash fires (flammable area) ..................................................................................26
5
Table of Contents
Vapor cloud explosions .........................................................................................26
Deflagration and detonation.......................................................................27
Congestion and confinement .....................................................................27
ALOHA's limitations .........................................................................................................28
Conditions that can produce unreliable results ......................................................28
Very low wind speeds................................................................................28
Very stable atmospheric conditions ...........................................................28
Wind shifts and terrain steering effects .....................................................29
Concentration patchiness ...........................................................................30
Effects that are not modeled ..................................................................................31
Byproducts from fires, explosions, or chemical reactions.........................31
Particulates.................................................................................................31
Chemical mixtures .....................................................................................31
Terrain........................................................................................................31
Hazardous fragments .................................................................................31
Chapter 2: Learning the Basics. . . . . . . . . . . . . . . . . . . . . . . . . . . . . . . . . . . . . . 33
Guided tour ........................................................................................................................33
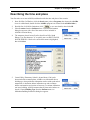
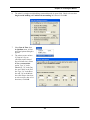
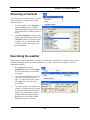
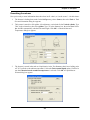
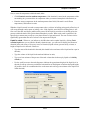
Describing the time and place............................................................................................34
Choosing a chemical ..........................................................................................................36
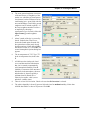
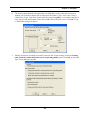
Describing the weather ......................................................................................................36
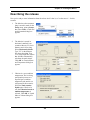
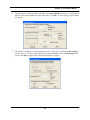
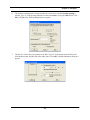
Describing the release ........................................................................................................38
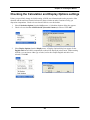
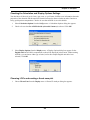
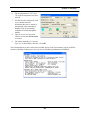
Checking the Calculation and Display Options settings....................................................42
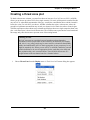
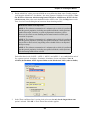
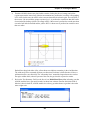
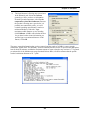
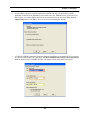
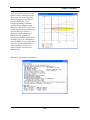
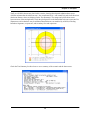
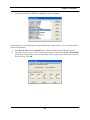
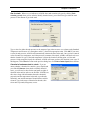
Creating a threat zone plot .................................................................................................43
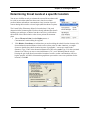
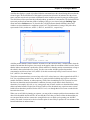
Determining threat levels at a specific location.................................................................46
Exiting (Quitting) ALOHA................................................................................................48
Chapter 3: Examples . . . . . . . . . . . . . . . . . . . . . . . . . . . . . . . . . . . . . . . . . . . . . . 49
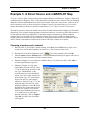
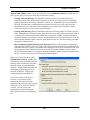
Example 1: A Tank Source (Puddle and Pool Fire)...........................................................49
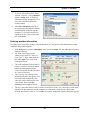
Choosing a location and a chemical ......................................................................49
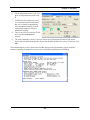
Entering weather information ................................................................................51
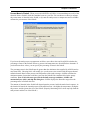
Describing the release ............................................................................................53
Checking the Calculation and Display Options Settings .......................................58
Choosing LOCs and creating a threat zone plot ....................................................58
Modeling a second scenario: pool fire ...................................................................61
Choosing LOCs and creating a threat zone plot for the pool fire ..........................63
6
Table of Contents
Example 2: A Tank Source (Multiple Scenarios) ..............................................................66
Choosing a location and a chemical ......................................................................66
Entering weather information ................................................................................68
Describing the release ............................................................................................70
Choosing LOCs and creating a threat zone plot for a BLEVE ..............................72
Modeling a second scenario: flash fire or vapor cloud explosion .........................74
Choosing LOCs and creating threat zone plots for a flammable vapor cloud .......76
Modeling a third scenario: jet fire..........................................................................82
Choosing LOCs and creating a threat zone plot for a jet fire ................................83
Example 3: A Direct Source and a MARPLOT Map ........................................................85
Choosing a location and a chemical ......................................................................85
Entering weather information ................................................................................87
Describing the release ............................................................................................88
Choosing LOCs and creating a threat zone plot ....................................................90
Using MARPLOT..................................................................................................92
Chapter 4: Reference . . . . . . . . . . . . . . . . . . . . . . . . . . . . . . . . . . . . . . . . . . . . . . 99
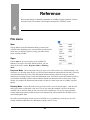
File menu ...........................................................................................................................99
New ........................................................................................................................99
Open.......................................................................................................................99
Response Mode..........................................................................................99
Planning Mode ...........................................................................................99
Close ....................................................................................................................100
Save and Save As.................................................................................................100
Print, Print All, and Print or Page Setup ..............................................................100
Quit or Exit ..........................................................................................................100
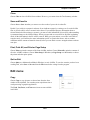
Edit menu .........................................................................................................................100
Copy.....................................................................................................................100
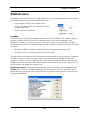
SiteData menu..................................................................................................................101
Location ...............................................................................................................101
Selecting a location..................................................................................101
Adding information about a U.S. city......................................................102
Adding a location outside the U.S. ..........................................................103
Modifying a location................................................................................104
Deleting a location ...................................................................................104
Building Type ......................................................................................................104
Date & Time ........................................................................................................106
7
Table of Contents
SetUp menu......................................................................................................................107
Chemical ..............................................................................................................107
Selecting a pure chemical ........................................................................108
Selecting a chemical solution ..................................................................108
Reactive chemicals ..................................................................................109
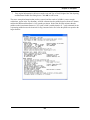
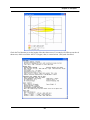
Chemical information in the Text Summary window .............................109
Chemical data ..........................................................................................110
Adding a chemical to the library..............................................................112
Modifying a chemical entry in the library ...............................................112
Deleting a chemical from the library .......................................................113
Atmospheric.........................................................................................................113
User Input ............................................................................................................113
Wind speed, direction, and measurement height .....................................114
Ground roughness ....................................................................................116
Cloud cover..............................................................................................118
Air temperature ........................................................................................118
Stability class ...........................................................................................119
Inversion height .......................................................................................120
Humidity ..................................................................................................121
SAM Station ........................................................................................................122
Choosing a SAM......................................................................................122
Transmitting SAM data to ALOHA ........................................................122
Using a SAM during an incident .............................................................123
Choosing the correct port for receiving SAM data..................................123
Choosing a radio frequency .....................................................................123
Setting up ALOHA when you're using a SAM........................................123
SAM Options ...........................................................................................124
Archive Data ............................................................................................125
Raw Data..................................................................................................126
Processed Data .........................................................................................126
Wind Rose................................................................................................127
Monitoring a long-term release................................................................127
Source ..................................................................................................................128
ALOHA's duration limits.........................................................................129
ALOHA reports release rate ....................................................................130
When you're using a SAM .......................................................................130
8
Table of Contents
Direct source ........................................................................................................130
Direct release of gas into the atmosphere ................................................131
Source height ...........................................................................................132
Puddle Source ......................................................................................................132
Type of Puddle.........................................................................................133
Evaporating Puddle..................................................................................133
Area and Volume .....................................................................................135
Ground Type and Initial Temperatures....................................................135
Tank .....................................................................................................................136
Liquefied gases ........................................................................................137
Tank Size and Orientation .......................................................................138
Chemical State and Temperature .............................................................138
Liquid in a tank ........................................................................................139
Gas in a tank ............................................................................................140
Chemical of unknown state in a tank.......................................................140
Type of Tank Failure ...............................................................................141
Percent Mass in Fireball ..........................................................................142
Area and Type of Leak ............................................................................143
Height of the Tank Opening ....................................................................144
Puddle formation......................................................................................144
Gas Pipeline .........................................................................................................146
Pipe source inputs ....................................................................................146
Source strength information in the Text Summary..................................147
Calculation Options .............................................................................................148
Display menu ...................................................................................................................149
Threat Zone..........................................................................................................149
Level of Concern .....................................................................................150
Vapor Cloud Explosion Parameters.........................................................150
Threat zone plot .......................................................................................152
Interpreting a threat zone .........................................................................153
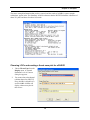
Displaying threat zones in other applications ..........................................153
Threat at Point......................................................................................................153
Using fixed (east-west and north-south) coordinates ..............................154
Using relative (downwind and crosswind) coordinates:..........................154
Threat at Point results ..............................................................................154
Text Summary......................................................................................................156
9
Table of Contents
Source Strength....................................................................................................156
Constant source strength ..........................................................................157
Variable source strength ..........................................................................157
Source strength averaging........................................................................158
Tile and Stack Windows ......................................................................................158
Display Options ...................................................................................................158
Sharing menu ...................................................................................................................159
Items in the Sharing menu ...................................................................................159
CAMEO menu .....................................................................................................159
MARPLOT menu ................................................................................................160
Using MARPLOT................................................................................................160
Chapter 5: Troubleshooting . . . . . . . . . . . . . . . . . . . . . . . . . . . . . . . . . . . . . . . 163
Bibliography . . . . . . . . . . . . . . . . . . . . . . . . . . . . . . . . . . . . . . . . . . . . . . . . . . . . 167
Glossary. . . . . . . . . . . . . . . . . . . . . . . . . . . . . . . . . . . . . . . . . . . . . . . . . . . . . . . . 169
Index . . . . . . . . . . . . . . . . . . . . . . . . . . . . . . . . . . . . . . . . . . . . . . . . . . . . . . . . . . 189
10
Welcome to ALOHA
Welcome to ALOHA! This chapter contains an overview of ALOHA®, an explanation of
how to use this manual and ALOHA's on-screen help, and a discussion of basic concepts.
1
About ALOHA
Program purpose
ALOHA (Areal Locations of Hazardous Atmospheres) is a computer program designed especially for use
by people responding to chemical releases, as well as for emergency planning and training. ALOHA
models key hazards—toxicity, flammability, thermal radiation (heat), and overpressure (explosion blast
force)—related to chemical releases that result in toxic gas dispersions, fires, and/or explosions. (Note: In
versions prior to 5.4, ALOHA only models the toxic threat: specifically, how a toxic gas cloud might
disperse in the atmosphere after an accidental chemical release.)
ALOHA runs quickly on small computers (Microsoft® Windows® or Macintosh®) that are easily
transportable. It is designed to be easy to use so that you can operate it successfully during high-pressure
situations. Its chemical library contains information about the physical properties of approximately 1,000
common hazardous chemicals. Its computations represent a compromise between accuracy and speed;
ALOHA has been designed to produce good results quickly enough to be of use to responders. ALOHA is
designed to minimize operator error. It checks information that you enter and warns you when you make a
mistake. ALOHA's on-screen help offers you quick access to explanations of ALOHA's features and
computations, as well as background information to help you interpret its output.
ALOHA was developed jointly by the National Oceanic and Atmospheric Administration (NOAA) and the
Environmental Protection Agency (EPA).
Basic program organization
To use ALOHA, you'll typically perform several basic steps:
1.
Indicate the city where a chemical release is occurring and the date and time;
2.
Choose the chemical of concern from ALOHA's library of chemical information;
3.
Enter information about current weather conditions;
4.
Describe how the chemical is escaping from containment; and
11
Chapter 1: Welcome to ALOHA
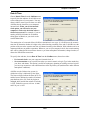
5.
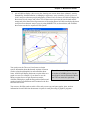
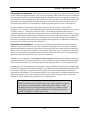
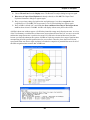
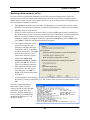
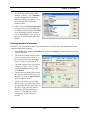
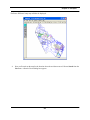
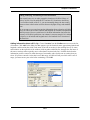
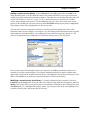
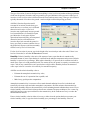
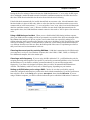
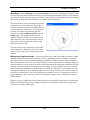
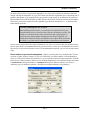
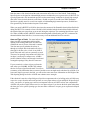
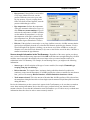
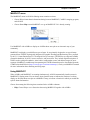
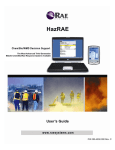
Ask ALOHA to display a threat zone plot, showing one or more areas where a hazard—toxicity,
flammability, thermal radiation, or damaging overpressure—may exceed key Levels of Concern
(LOCs) and pose a threat to people and property. If three LOCs are chosen, ALOHA will display the
threat zones in red, orange, and yellow. The red threat zone represents the worst hazard and the
orange and yellow threat zones represent areas of decreasing hazard. ALOHA can display this threat
zone plot on an electronic map of your city using MARPLOT®, as shown below, and ALOHA's
threat zones can also be exported to GIS systems.
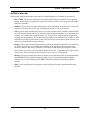
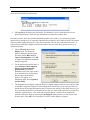
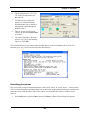
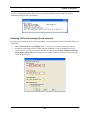
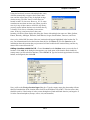
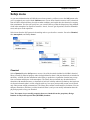
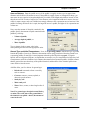
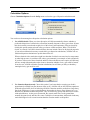
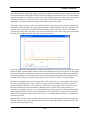
You can also use the Threat at Point feature to obtain
specific information about the hazards at points of interest
(such as schools and hospitals) in and around the threat
zones. ALOHA will display the threat at a point either as a
graph or as text. For example, if you choose to see the
threat at a point for a toxic gas dispersion scenario,
ALOHA will display a graph showing predicted indoor and
outdoor chemical concentrations at the location for the first
hour after the release.
Threat Zones and Footprints
In versions of ALOHA prior to 5.4, the
term footprint was used instead of threat
zone. The two terms are equivalent.
You can save ALOHA results as archive files, and you can copy and paste graphs, plots, and text
information from ALOHA into documents or reports in word processing or graphics programs.
12
Chapter 1: Welcome to ALOHA
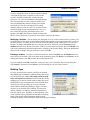
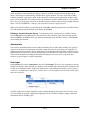
ALOHA's menu bar
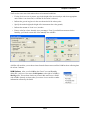
Perform basic ALOHA operations by moving left-to-right through the seven menus in its menu bar:
• File and Edit: Choose items from these two menus to perform basic operations, such as opening,
closing, and saving files; printing the contents of ALOHA's windows; and copying text and graphics
displayed in ALOHA.
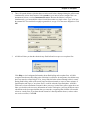
• SiteData: Choose items from the SiteData menu to enter information about the release: (a) the date
and time, (b) location, and (c) the type of buildings downwind of a toxic gas release.
• SetUp: Choose items from the SetUp menu to (a) select a chemical from ALOHA's chemical library
(or to add a chemical to the library), (b) indicate weather conditions (manually or by connecting your
computer to a portable meteorological station), (c) "set the source" (describe how the chemical is
escaping from containment), and (d) choose the type of dispersion calculations for ALOHA to make
(ALOHA can predict the movement of either neutrally buoyant clouds that are about as dense as air
and heavy gas clouds that are denser than air).
• Display: Choose items from the Display menu to indicate the ALOHA results that you would like to
see and to choose how you would like the information to be displayed. Choose to tile or stack
ALOHA's windows and choose whether to see ALOHA's results displayed in English or metric
units. Choose one or more LOCs and display the threat zone plot. If applicable given your scenario,
you may also choose to display a threat at point report or a source strength graph.
• Sharing: Choose items from this menu to (a) display an ALOHA threat zone on a background map
using MARPLOT, the CAMEO® mapping module, or (b) see detailed information about the
chemical you've selected, displayed in CAMEO's Response Information Data Sheets (RIDS)
module.
• Help: Choose items from the Help menu to see the help topics list and to get information about
ALOHA.
13
Chapter 1: Welcome to ALOHA
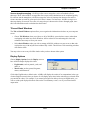
Getting help
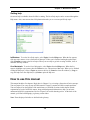
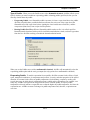
On-screen help is available when ALOHA is running. The list of help topics can be accessed through the
Help menu. Also, most screens have Help buttons that take you to a screen-specific help topic.
In Windows. To see the list of help topics, select Topics from the Help menu. When the list appears,
click any topic name to view a discussion of that topic. When you've finished reading about that topic,
click Contents to return to the list of topics. When you are ready to go back to using ALOHA, close or
minimize the Help window.
On a Macintosh. To see the list of help topics, select Topics from the Help menu. When the list
appears, highlight a topic name, then click Select to view a discussion of that topic. When you've finished
reading the help topic, click (a) Topics to return to the list, (b) Cancel to close the window, (c) Copy to
copy the help text to the clipboard, or (d) Print to print the help text.
How to use this manual
This manual includes five chapters. Begin here in Chapter 1 by reviewing a discussion of basic concepts.
Turn to Chapter 2 for a step-by-step ALOHA tutorial. Chapter 3 contains ALOHA example problems.
Turn to Chapter 4 for descriptions of the main features of ALOHA. Sections in this chapter include
explanations of each of ALOHA's menus, along with background information to help you to better
understand ALOHA's computations. Review Chapter 5 for trouble-shooting advice. At the back of the
manual, you'll find a bibliography, a glossary, and an index.
Note: Terms displayed in italics are defined in the glossary.
14
Chapter 1: Welcome to ALOHA
Modeling in ALOHA
ALHOA models three hazard categories: toxic gas dispersion, fires, and explosions. ALOHA employs
several different models, including an air dispersion model that it uses to estimate the movement and
dispersion of chemical gas clouds. From this model, ALOHA is able to estimate the toxic gas dispersion,
the overpressure values from a vapor cloud explosion, or the flammable areas of a vapor cloud. ALOHA
uses additional models to estimate the hazards associated with other fires and explosions. ALOHA can
solve problems rapidly and provide results in a graphic, easy-to-use format. This can be helpful during an
emergency response or planning for such a response.
ALOHA originated as a tool to aid in emergency response. It
has evolved over the years into a tool used for a wide range
of response, planning, and academic purposes. However,
you must still rely on your own common sense and
experience when deciding how to respond to a particular
incident. There are features that would be useful in some of
ALOHA's models (in the dispersion model, for example,
equations accounting for site topography) that have not been
included in ALOHA because they would require extensive
input and computational time. ALOHA's most important
limitations are discussed later in this chapter.
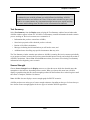
How accurate is ALOHA?
Keep in mind that ALOHA is only a
tool. Its usefulness depends on the
accuracy of the information you enter
into ALOHA and on your accurate
interpretation of the data and how you
apply it to each situation.
Introduction to dispersion modeling
Many different types of air dispersion models exist. They range from simple equations that can be solved
by hand to complex models that require massive amounts of input data and powerful computers. The type
of model appropriate for a particular use depends on the scale of the problem, the level of detail available
for input and required for output, the background of the intended user, and the time available to wait for the
model computations to be completed.
ALOHA was designed with first responders in mind. Its air dispersion model is intended to be used to
estimate the areas near a short-duration chemical release where key hazards—toxicity, flammability,
thermal radiation, or overpressure—may exceed user-specified Levels of Concern (LOCs). (Note: If the
released chemical is not flammable, toxicity is the only air dispersion hazard modeled in ALOHA.)
ALOHA is not intended for use with radioactive chemical releases, nor is ALOHA intended to be used for
permitting of stack gas or modeling chronic, low-level ("fugitive") emissions. Other models are designed
to address larger scale and/or air quality issues (Turner and Bender 1986). Since most first responders do
not have dispersion modeling backgrounds, ALOHA has been designed to require input data that are either
easily obtained or estimated at the scene of an accident. ALOHA's on-screen help can assist you in
choosing inputs.
15
Chapter 1: Welcome to ALOHA
What is dispersion?
Dispersion is a term used by modelers to include advection (moving) and diffusion (spreading). A
dispersing vapor cloud will generally move (advect) in a downwind direction and spread (diffuse) in a
crosswind and vertical direction (crosswind is the direction perpendicular to the wind). A cloud of gas that
is denser or heavier than air (called a heavy gas) can also spread upwind to a small extent.
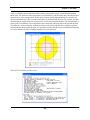
ALOHA can model the dispersion of a cloud of pollutant gas in the atmosphere and display a diagram that
shows an overhead view of the regions, or threat zones, in which it predicts that key hazard levels (LOCs)
will be exceeded. This diagram is called a threat zone plot. To obtain a threat zone estimate, you must first
choose at least one LOC. (ALOHA will suggest default LOCs, and you may keep those or choose up to
three other LOCs.) For toxic gas dispersion scenarios, an LOC is a threshold concentration of the gas at
ground level—usually the concentration above which a hazard is believed to exist. The type of LOC will
depend on the scenario. For each LOC you choose, ALOHA estimates a threat zone where the hazard is
predicted to exceed that LOC at some time after a release begins. These zones are displayed on a single
threat zone plot. If three LOCs are chosen, ALOHA will display the threat zones in red, orange, and
yellow. When you use ALOHA's default LOCs, the red zone represents the worst hazard.
There are two separate dispersion models in ALOHA: Gaussian and heavy gas.
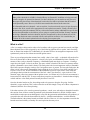
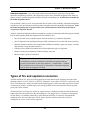
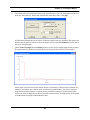
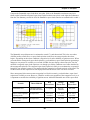
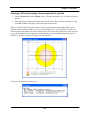
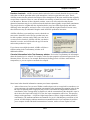
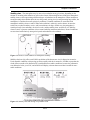
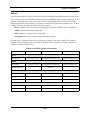
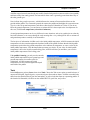
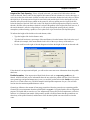
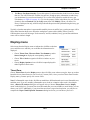
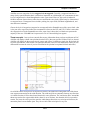
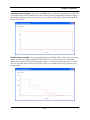
Gaussian model. ALOHA uses the Gaussian model to predict how gases that are about as buoyant as
air will disperse in the atmosphere. Such neutrally buoyant gases have about the same density as air.
According to this model, wind and atmospheric turbulence are the forces that move the molecules of a
released gas through the air, so as an escaped cloud is blown downwind, "turbulent mixing" causes it to
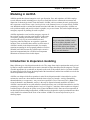
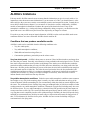
spread out in the crosswind and upward directions. According to the Gaussian model, a graph of gas
concentration within any crosswind slice of a moving pollutant cloud looks like a bell-shaped curve, high
in the center (where concentration is highest) and lower on the sides (where concentration is lower), as in
Figure 1-1. At the point of a release, the pollutant gas concentration is very high, and the gas has not
diffused very far in the crosswind and upward directions, so a graph of concentration in a crosswind slice
of the cloud close to the source looks like a spike. As the pollutant cloud drifts farther downwind, it
spreads out and the "bell shape" becomes wider and flatter.
Figure 1-1. Gaussian distribution (left) and Gaussian spread (right).
16
Chapter 1: Welcome to ALOHA
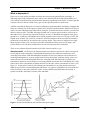
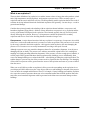
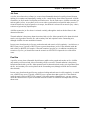
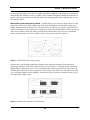
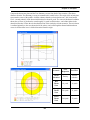
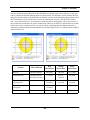
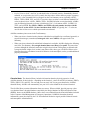
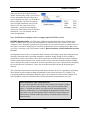
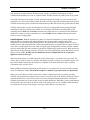
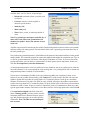
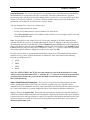
Heavy gases. When a gas that is heavier than air is released, it initially behaves very differently from a
neutrally buoyant gas. The heavy gas will first "slump," or sink, because it is heavier than the surrounding
air. As the gas cloud moves downwind, gravity makes it spread; this can cause some of the vapor to travel
upwind of its release point (Figure 1-2). Farther downwind, as the cloud becomes more diluted and its
density approaches that of air, it begins behaving like a neutrally buoyant gas. This takes place when the
concentration of heavy gas in the surrounding air drops below about 1 percent (10,000 parts per million).
For many small releases, this will occur in the first few yards (meters). For large releases, this may happen
much further downwind.
Figure 1-2. Cloud spread as a result of gravity.
The heavy gas dispersion calculations that are used in ALOHA are based on those used in the DEGADIS
model (Spicer and Havens 1989), one of several well-known heavy gas models. This model was selected
because of its general acceptance and the extensive testing that was carried out by its authors.
Classification of heavy gases. A gas that has a molecular weight greater than that of air (the average
molecular weight of air is about 29 kilograms per kilomole) will form a heavy gas cloud if enough gas is
released. Gases that are lighter than air at room temperature, but that are stored in a cryogenic (lowtemperature) state, can also form heavy gas clouds. If the density of a gas cloud is substantially greater than
the density of the air (the density of air is about 1.1 kilograms per cubic meter), ALOHA considers the gas
to be heavy.
Flash-boiling and two-phase flow. Many substances that are gases under normal pressures and
temperatures are stored under pressures high enough to liquefy them. For example, propane is a gas at
normal pressures and temperatures but is often stored under pressure as a liquid. When a tank rupture or
broken valve causes a sudden pressure loss in a tank of liquefied gas, the liquid boils violently and the tank
contents foam up, filling the tank with a mixture of gas and fine liquid droplets (called aerosol). Flashboiling is the term for that sudden vaporization of a liquid caused by a loss of pressure.
When the liquid and gas phases of a chemical escape together from a ruptured tank, the release is called a
two-phase flow. When a two-phase mixture escapes from storage, the release rate can be significantly
greater than that for a release of pure gas. The two-phase mixture that escapes into the atmosphere may
behave like a heavy gas cloud. The cloud is heavy in part because it is initially cold, and therefore denser
than it would be at ambient temperatures, and also because it consists of a two-phase mixture. The tiny
aerosol droplets mixed into the cloud act to weigh the cloud down and make it denser than a pure gas
cloud, and their evaporation cools the cloud.
17
Chapter 1: Welcome to ALOHA
ALOHA can choose a dispersion model for you. ALOHA can automatically choose whether to
predict the dispersion of a chemical as a Gaussian or heavy gas release (it bases this choice mainly on
molecular weight, size of the release, and temperature of the gas cloud). But sometimes you may want to
specify the model to use rather than letting ALOHA choose. In particular, when a chemical with a
molecular weight less than that of air has been stored at a low temperature or under high pressure, it can
behave like a heavy gas (ammonia is an example of such a chemical). If you have chosen one of these
chemicals, depending on how you model its release, ALOHA may not have enough information about the
release to determine whether a heavy gas could be formed. In such a case, ALOHA will make Gaussian
calculations, but will alert you that you should try running the heavy gas model as well. In such cases, you
should re-run ALOHA using the heavy gas calculations, and compare the threat zone estimates.
Introduction to fires and explosions
Beginning with ALOHA version 5.4, you can model fire and explosion scenarios as well as toxic gas
dispersion scenarios. This section provides basic information about fires and explosions, and then explains
how to model fires and explosions in ALOHA.
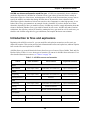
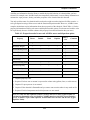
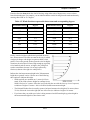
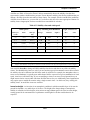
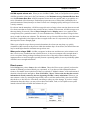
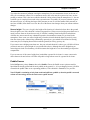
ALOHA allows you to model chemical releases from four types of sources: Direct, Puddle, Tank, and Gas
Pipeline. Refer to Table 1-1 to see what types of scenarios you can run in ALOHA from each source. For a
more detailed discussion on sources, see "Source" on page 128.
Table 1-1: ALOHA sources and scenarios.
Source
Toxic Scenarios
Fire Scenarios
Explosion Scenarios
Direct Release
Toxic Vapor Cloud
Flammable Area (Flash Fire)
Vapor Cloud Explosion
Toxic Vapor Cloud
Flammable Area (Flash Fire)
Vapor Cloud Explosion
Direct
Puddle
Evaporating
Burning (Pool Fire)
Pool Fire
Tank
Not Burning
Toxic Vapor Cloud
Flammable Area (Flash Fire)
Burning
Jet Fire or Pool Fire
BLEVE
BLEVE (Fireball and Pool Fire)
Vapor Cloud Explosion
Gas Pipeline
Not Burning
Toxic Vapor Cloud
Flammable Area (Flash Fire)
Burning (Jet Fire)
Jet Fire
18
Vapor Cloud Explosion
Chapter 1: Welcome to ALOHA
What about chemicals that are flammable and toxic?
Many of the chemicals in ALOHA's chemical library are flammable, in addition to being toxic and
volatile enough to be potential air hazards. For those chemicals, you can model not only the toxic
threat posed by the release of that chemical, but also the fires and/or explosions that the chemical
could potentially cause. However, ALOHA cannot model these threats at the same time.
If a flammable and toxic chemical—such as acrolein—has been released, run a toxic gas dispersion
scenario first. Next, run all of the appropriate fire and explosions scenarios. Finally, consider all of
the threat zone plots (the estimates will vary with each scenario) and any additional site-specific data
and use that information to decide how you are going to respond to the incident. In many situations
involving a flammable and toxic chemical, the area encompassed by the toxic threat zone will be
greater than the threat zones associated with fire and explosion scenarios. It is essential that you
evaluate all of the scenario options before developing your response plan.
What is a fire?
A fire is a complex chain reaction where a fuel combines with oxygen to generate heat, smoke, and light.
Most chemicals fires will be triggered by one of the following ignition sources: sparks, static electricity,
heat, or flames from another fire. Additionally, if a chemical is above its autoignition temperature it will
spontaneously catch on fire without an external ignition source.
There are several properties that measure how readily—that is, how easily—a chemical will catch on fire.
Here we'll discuss three of these properties: volatility, flash point, and flammability limits. Volatility is a
measure of how easily a chemical evaporates. A flammable liquid must begin to evaporate—forming a
vapor above the liquid—before it can burn. The more volatile a chemical, the faster it evaporates and the
quicker a flammable vapor cloud is formed. The flash point is the lowest temperature where a flammable
liquid will evaporate enough to catch on fire if an ignition source is present. The lower the flash point, the
easier it is for a fire to start. Flammability limits, called the Lower Explosive Limit (LEL) and the Upper
Explosive Limit (UEL), are the boundaries of the flammable region of a vapor cloud. These limits are
percentages that represent the concentration of the fuel—that is, the chemical—vapor in the air. If the
chemical vapor comes into contact with an ignition source, it will burn only if its fuel-air concentration is
between the LEL and the UEL. To some extent, these properties are interrelated—chemicals that are highly
volatile and have a low flash point will usually also have a low LEL.
Once the chemical catches on fire, three things need to be present to keep the fire going: fuel (the
chemical), oxygen, and heat. This is often referred to as the fuel triangle. If any one of those components is
eliminated, then the fire will stop burning.
Like other reactions, a fire can also generate byproducts—smoke, soot, ash, and new chemicals formed in
the reaction. Some of these reaction byproducts can be hazardous themselves. While ALOHA cannot
model all the complex processes that happen in a fire (like the generation and distribution of byproducts), it
can predict the area where the heat radiated by the fire—called thermal radiation—could be harmful.
Thermal radiation is the primary hazard associated with fires. However, it is also important to consider the
hazards associated with any secondary fires and explosions that may occur.
19
Chapter 1: Welcome to ALOHA
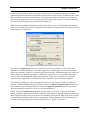
Thermal Radiation Levels of Concern. A Thermal Radiation Level of Concern (LOC) is a threshold
level of thermal radiation, usually the level above which a hazard may exist. When you run a fire scenario,
ALOHA will suggest three default LOC values. ALOHA uses three threshold values (measured in
kilowatts per square meter and denoted as kW/m2) to create the default threat zones:
• Red: 10 kW/m2 (potentially lethal within 60 sec);
• Orange: 5 kW/m2 (second-degree burns within 60 sec); and
• Yellow: 2 kW/m2 (pain within 60 sec).
The thermal radiation effects that people experience depend upon the length of time they are exposed to a
specific thermal radiation level. Longer exposure durations, even at a lower thermal radiation level, can
produce serious physiological effects. The threat zones displayed by ALOHA represent thermal radiation
levels; the accompanying text indicates the effects on people who are exposed to those thermal radiation
levels but are able to seek shelter within one minute.
ALOHA's default thermal radiation values are based on a review of several widely accepted sources for
this topic (e.g., American Institute of Chemical Engineers 1994, Federal Emergency Management Agency
et al. 1988, and Lees 2001).
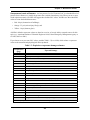
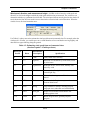
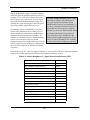
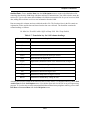
If you set your own LOC values, consider Table 1-2 (Federal Emergency Management Agency et al.
1988), which lists some physiological effects at specific thermal radiation levels and durations (on bare
skin):
Table 1-2: Thermal radiation burn injury criteria.
Radiation Intensity (kW/m2)
Time for Severe Pain (s)
Time for 2nd Degree Burns (s)
1
115
663
2
45
187
3
27
92
4
18
57
5
13
40
6
11
30
8
7
20
10
5
14
12
4
11
Note: The durations that correspond to effects like pain or second-degree burns can vary considerably,
depending on circumstances. The effects above were observed on bare skin that was exposed directly to
the thermal radiation. Some types of clothing can serve as a protective barrier against thermal radiation and
can affect the exposure duration. However, exposure duration should be kept to a minimum, even at low
levels of thermal radiation.
20
Chapter 1: Welcome to ALOHA
What is an explosion?
The most basic definition of an explosion is a sudden, intense release of energy that often produces a loud
noise, high temperatures, and flying debris, and generates a pressure wave. There are many types of
explosions and the causes and effects will vary. ALOHA primarily models explosions that are the result of
accidents involving industrial chemicals. Intentional explosions will generally—but not always—result in
greater hazard damage.
Consider three primary hazards when dealing with an explosion: thermal radiation, overpressure, and
hazardous fragments (flying debris). All three of these hazards are not present in every explosion and the
severity of the hazard will depend on the explosion. These hazards typically last only for a brief period
directly following the explosion. However, it is important to consider the potential for secondary
explosions and fires to occur before deciding that these hazards no longer exist.
Overpressure. A major hazard associated with any explosion is overpressure. Overpressure, also called
a blast wave, refers to the sudden onset of a pressure wave after an explosion. This pressure wave is caused
by the energy released in the initial explosion—the bigger the initial explosion, the more damaging the
pressure wave. Pressure waves are nearly instantaneous, traveling at the speed of sound.
Although a pressure wave may sound less dangerous than a fire or hazardous fragments, it can be just as
damaging and just as deadly. The pressure wave radiates outward like a giant burst of air, crashing into
anything in its path (generating hazardous fragments). If the pressure wave has enough power behind it, it
can lift people off the ground and throw them up against nearby buildings or trees. Additionally, blast
waves can damage buildings or even knock them flat—often injuring or killing the people inside them. The
sudden change in pressure can also affect pressure-sensitive organs like the ears and lungs. The damaging
effects of the overpressure will be greatest near the source of the explosion and lessen as you move farther
from the source.
When you use ALOHA to predict an explosion's effects, assess the surroundings at the explosion site as
you interpret ALOHA's threat zone plot. Large objects (like trees and buildings) in the path of the pressure
wave can affect its strength and direction of travel. For example, if many buildings surround the explosion
site, expect the actual overpressure threat zone to be somewhat smaller than ALOHA predicts. But at the
same time, more hazardous fragments could be generated as the blast causes structural damage to those
buildings.
21
Chapter 1: Welcome to ALOHA
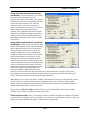
Overpressure Levels of Concern. An Overpressure Level of Concern (LOC) is a threshold level of
pressure from a blast wave, usually the pressure above which a hazard may exist. When you run a vapor
cloud explosion scenario, ALOHA will suggest three default LOC values. ALOHA uses three threshold
values to create the default threat zones:
• Red: 8.0 psi (destruction of buildings);
• Orange: 3.5 psi (serious injury likely); and
• Yellow: 1.0 psi (shatters glass).
ALOHA's default overpressure values are based on a review of several widely accepted sources for this
topic (e.g., American Institute of Chemical Engineers 1994, Federal Emergency Management Agency et
al. 1988, and Lees 2001).
If you choose to set your own LOC values, consider Table 1-3 (Lees 1980), which relates overpressure
values to the structural and physiological effects produced.
Table 1-3: Explosion overpressure damage estimates.
Overpressure*
(psig)
Expected Damage
0.04
Loud noise (143 dB); sonic boom glass failure.
0.15
Typical pressure for glass failure.
0.40
Limited minor structural damage.
0.50-1.0
Windows usually shattered; some window frame damage.
0.70
Minor damage to house structures.
1.0
Partial demolition of houses; made uninhabitable.
1.0-2.0
Corrugated metal panels fail and buckle. Housing wood panels blown in.
1.0-8.0
Range for slight to serious laceration injuries from flying glass and other missiles.
2.0
Partial collapse of walls and roofs of houses.
2.0-3.0
Non-reinforced concrete or cinder block walls shattered.
2.4-12.2
Range for 1-90% eardrum rupture among exposed populations.
2.5
50% destruction of home brickwork.
3.0
Steel frame building distorted and pulled away from foundation.
5.0
Wooden utility poles snapped.
5.0-7.0
Nearly complete destruction of houses.
7.0
Loaded train cars overturned.
9.0
Loaded train box cars demolished.
10.0
Probable total building destruction.
14.5-29.0
Range for the 1-99% fatalities among exposed populations due to direct blast effects.
* These are peak pressures formed in excess of normal atmospheric pressure by blast and shock waves.
22
Chapter 1: Welcome to ALOHA
Hazardous fragments. One of the major hazards associated with any explosion is flying debris
(hazardous fragments) propelled by the explosion's pressure wave. Hazardous fragments come from two
primary sources: container fragments and debris from the surrounding area. ALOHA does not model the
hazardous fragments threat.
If an explosion is likely to occur, first responders must be aware of the possibility of hazardous fragments
and take necessary precautions to shield responders and others from the potentially fatal fragments. Some
hazardous fragments may be projected into areas well beyond those affected by the thermal or
overpressure explosion hazards.
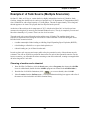
Analysis of data from multiple accident investigations revealed several broad trends that responders should
keep in mind regarding hazardous fragments (Leslie and Birk 1991):
• 80% of fires that lead to container rupture result in missiles (e.g., hazardous fragments);
• 80% of fragments from liquid petroleum gas (LPG) accidents travel less than 200 meters (660 feet);
• Spherical containers produce more missiles than cylindrical containers, spheres average 8.3 missiles
and cylinders average less than 4 missiles;
• End tubes from cylindrical containers travel further than other types of fragments;
• Smaller vessels project fragments further than larger ones; and
• Missiles tend to export fire with them.
Why doesn't ALOHA model hazardous fragments?
It is difficult to predict the distribution of hazardous fragments with any
accuracy because there are too many unknown—or unknowable—variables.
The two main issues of concern are (1) the number of hazardous fragments,
and (2) where the fragments will land.
Types of fire and explosion scenarios
ALOHA models the five types of fire and explosion scenarios that are most frequently associated with
chemical releases: Jet Fires, Pool Fires, BLEVEs, Flammable Areas (where a Flash Fire could occur), and
Vapor Cloud Explosions. Each is described on the following pages. Often, more than one kind of fire and/
or explosion is possible. ALOHA helps you by listing the kinds of fires and explosions that are possible,
given your release scenario.
Chemical releases involving a fire and/or an explosion can be complicated in that an initial incident may
trigger other fires and explosions in the surrounding area. The trigger may be an increase in temperature,
an open flame, or a container punctured by debris from the initial fire or explosion. Throughout this
manual the term "fires and explosions" will be used to describe situations where there may be a
combination or a series of fires and/or explosions.
23
Chapter 1: Welcome to ALOHA
Jet fires
A jet fire, also referred to as a flame jet, occurs when a flammable chemical is rapidly released from an
opening in a container and immediately catches on fire—much like the flame from a blowtorch. ALOHA
can model a jet fire from the Gas Pipeline and Tank sources. For the Tank source, ALOHA can model gas
and two-phase jet fires. A two-phase jet fire occurs when a gas that has been liquefied under pressure is
released. Because the liquid evaporates as it escapes, the chemical is released as an aerosol spray—that is,
a mixture of gas and tiny liquid droplets.
ALOHA assumes the jet fire release is oriented vertically, although the wind can tilt the flames in the
downwind direction.
Thermal radiation is the primary hazard associated with a jet fire. Other potential jet fire hazards include
smoke, toxic byproducts from the fire, and secondary fires and explosions in the surrounding area,
although ALOHA does not model these hazards.
In some cases, heat from the jet fire may weaken the tank and cause it to fail completely—in which case, a
BLEVE may occur. Typically, a BLEVE poses a greater threat than a jet fire. If the chemical inside the
tank is likely to BLEVE (for example, if the tank contains a liquefied gas), in addition to modeling the
scenario as a jet fire, you should also rerun the scenario as a BLEVE to compare the size of the threat
zones.
Pool fire
A pool fire occurs when a flammable liquid forms a puddle on the ground and catches on fire. ALOHA
only models pool fires on land; it does not model pool fires on water. Thermal radiation is the primary
hazard associated with a pool fire. Other potential pool fire hazards include smoke, toxic byproducts from
the fire, and secondary fires and explosions in the surrounding area (although ALOHA does not model
these hazards).
In some cases, heat from the pool fire may weaken a leaking tank and cause it to fail completely—in which
case, a BLEVE may occur. Typically, a BLEVE poses a greater threat than a pool fire. If the chemical
inside the tank is likely to BLEVE (for example, if the tank contains a liquefied gas), you may want to
model the situation first as a pool fire and then rerun the scenario as a BLEVE to compare the size of the
threat zones.
24
Chapter 1: Welcome to ALOHA
BLEVEs
BLEVE stands for Boiling Liquid Expanding Vapor Explosion. BLEVEs typically occur in closed storage
tanks that contain a liquefied gas, usually a gas that has been liquefied under pressure. A gas can be
liquefied by either cooling (refrigerating) it to a temperature below its boiling point or by storing it at a
high pressure. Although both flammable and nonflammable liquefied gases may be involved in a BLEVE,
ALOHA only models flammable liquid BLEVEs.
Propane is an example of a chemical that has been involved in many BLEVE accidents. Most propane
tanks at service stations contain liquid propane. These tanks are neither insulated nor refrigerated, so the
tank contents are at ambient temperature. Since the ambient temperature is almost always significantly
above propane's boiling point of -43.7 ºF, the tanks are highly pressurized.
A common BLEVE scenario happens when a container of liquefied gas is heated by fire, increasing the
pressure within the container until the tank ruptures and fails. When the container fails, the chemical is
released in an explosion. If the chemical is above its boiling point when the container fails, some or all of
the liquid will flash-boil—that is, instantaneously become a gas. If the chemical is flammable, a burning
gas cloud called a fireball may occur if a significant amount of the chemical flash-boils. ALOHA assumes
that any liquid not consumed in the fireball will form a pool fire.
ALOHA estimates the thermal radiation hazard from a fireball and/or a pool fire. Other potential BLEVE
hazards include overpressure, hazardous fragments, smoke, and toxic byproducts from the fire (although
ALOHA does not model these hazards). ALOHA focuses on the thermal radiation because in most
BLEVEs thermal radiation impacts a greater area than the overpressure and is the more significant threat.
Fireball. When you model a BLEVE, ALOHA assumes that a fireball will form. The fireball is made up
of both the chemical that flash-boils when the tank fails and the chemical that sprays out as an aerosol
during the explosion. ALOHA estimates that the amount of chemical in the fireball is three times the
amount of chemical that flash boils. Any liquid that does not participate in the fireball will form a pool fire.
When you choose to model a BLEVE situation in ALOHA, the program estimates the thermal radiation
from both fires; it is not necessary to run an additional Pool Fire scenario. The primary hazard associated
with a fireball is thermal radiation. However, if there are other chemicals near the fireball, it can trigger
additional fires and explosions.
Explosion and hazardous fragments. In a BLEVE, a high-pressure explosion typically causes the
container to fragment. As the container breaks apart, it may strike objects in the surrounding area and
create additional debris. The container fragments and other debris—hazardous fragments—are swept up in
the explosion and rapidly propelled by the explosion over a wide area. ALOHA does not model the
dispersion of hazardous fragments or overpressure (blast force) in a BLEVE. If a BLEVE is likely to occur,
first responders must take the necessary precautions to protect themselves and others from the overpressure
and hazardous fragments.
25
Chapter 1: Welcome to ALOHA
Flash fires (flammable area)
When a flammable vapor cloud encounters an ignition source, the cloud can catch fire and burn rapidly in
what is called a flash fire. Potential hazards associated with a flash fire include thermal radiation, smoke,
and toxic byproducts from the fire. ALOHA will predict the flammable area of the vapor cloud—that is,
the area where a flash fire could occur at some time after the release. The flammable area is bounded by the
Lower Explosive Limit (LEL) and the Upper Explosive Limit (UEL). These limits are percentages that
represent the concentration of the fuel—that is, the chemical—vapor in the air. If the chemical vapor
comes into contact with an ignition source, it will burn only if its fuel-air concentration is between the LEL
and the UEL, because that portion of the cloud is already pre-mixed to the right mixture of fuel and air for
burning to occur.
If the fuel-air concentration is below the LEL, there is not enough fuel in the air to sustain a fire or an
explosion—it is too lean. If the fuel-air concentration is above the UEL, there is not enough oxygen to
sustain a fire or an explosion because there is too much fuel—it is too rich. (This is similar to an engine
that cannot start because it has been flooded with gasoline.) If a flash fire occurs, the part of the cloud
where the fuel-air concentration is above the UEL may continue to slowly burn as air mixes with the cloud.
Is there a difference between a Flammable Limit and an Explosive Limit?
No, there is no difference. The two terms can be used interchangeably. Some people
may prefer to use the terms Lower Flammable Limit (LFL) and Upper Flammable
Limit (UFL), particularly if they are only concerned with fires.
You might expect that the LEL could be used as the LOC to determine the areas in which a fire might
occur. However, the concentration levels estimated by ALOHA are time-averaged concentrations. In an
actual vapor cloud, there will be areas where the concentration is higher than the average and areas where
the concentration is lower than the average. This is called concentration patchiness. Because of
concentration patchiness, there will be areas, called pockets, where the chemical is in the flammable range
even though the average concentration has fallen below the LEL. (ALOHA uses a shorter averaging time
when estimating the flammable areas, to help compensate for this effect, but it cannot completely
compensate for this effect.) Some experiments have shown that flame pockets can occur in places where
the average concentration is above 60% of the LEL. ALOHA uses 60% of the LEL as the default LOC for
the red threat zone. Another common threat level used by responders is 10% of the LEL. ALOHA uses this
concentration as the default LOC for the yellow threat zone.
Vapor cloud explosions
When a flammable chemical is released into the atmosphere, it forms a vapor cloud that will disperse as it
travels downwind. If the cloud encounters an ignition source, the parts of the cloud where the
concentration is within the flammable range (between the LEL and UEL) will burn. The speed at which the
flame front moves through the cloud determines whether it is a deflagration or a detonation (see next
page). In some situations, the cloud will burn so fast that it creates an explosive force (blast wave). The
severity of a vapor cloud explosion depends on the chemical, the cloud size at the time of ignition, the type
of ignition, and the congestion level inside the cloud. The primary hazards are overpressure and hazardous
fragments. ALOHA can help you model the overpressure hazard.
26
Chapter 1: Welcome to ALOHA
Deflagration and detonation. The destructive blast force of a vapor cloud explosion depends in part
on how quickly the explosion spreads—that is, the rate at which its flame front travels. Once an explosion
has been triggered, a flame front will spread through the flammable vapor cloud, igniting areas where the
concentration is in the flammable range. The explosion produces a pressure wave that spreads out into the
surrounding area, causing damage to people and property. The greater the speed of the flame front, the
more intense the pressure wave (overpressure), and the greater the destructive force of the explosion.
For most accidental explosions, the flame front will travel relatively slowly in what is called a
deflagration. For example, a typical deflagration flame front (for hydrocarbon combustions) travels about
2.2 miles per hour, or 1 meter per second (Lees 2001). For intentional explosions (and worst-case
accidental explosions), the flame front travels rapidly in what is called a detonation. For example, a typical
detonation flame front (for hydrocarbon combustions) travels about 5,600 miles per hour, or 2,500 meters
per second (Lees 2001). In some situations, a deflagration flame front can accelerate into a detonation
flame front. Accidental explosions that result in a high-speed deflagration or a detonation are more likely
to occur in areas of high congestion and confinement.
Congestion and confinement. Congestion is a concept used to quantify the way small structures
within the vapor cloud affect the severity of the explosion. Congestion refers to the density of obstacles
that generate turbulence. Obstacles of this nature are generally small, like a shrub, and do not impede the
flame front. Larger objects, like a building, can impede the flame front, so they should not be considered
obstacles for the purposes of congestion. Greater turbulence allows the flame front to accelerate, thereby
generating a more powerful blast wave (i.e., greater overpressure).
ALOHA uses two congestion levels: congested and uncongested. ALOHA's blast estimates are based on
experiments that used a volume blockage ratio (volume occupied by obstacles within the cloud divided by
cloud volume) of less than 1.5% for an uncongested cloud and greater than 1.5% for a congested cloud.
Estimating the level of congestion in a non-laboratory setting is difficult, but the following examples might
be helpful. Uncongested zones include: parking lots, open fields, suburban neighborhoods, and most urban
environments. Generally, a congested zone has so many closely spaced obstacles that it is difficult or
impossible to walk through it. It is uncommon for this level of congestion to be found throughout the entire
vapor cloud. However, pipe racks in industrial facilities and some forested areas (where the trees and
branches are closely spaced) may be characterized as congested areas.
What role does confinement play in vapor cloud explosions?
Partial confinement can also increase the severity of the explosion. In general, a
vapor cloud is considered partially confined when walls, ceilings, or other
extended surfaces keep the cloud from moving freely. For example, an opensided parking garage is a partially confined space. ALOHA does not model
partially or completely confined vapor clouds.
27
Chapter 1: Welcome to ALOHA
ALOHA's limitations
Like any model, ALOHA cannot be more accurate than the information you give it to work with, so it is
important to enter the most accurate information. If you are unsure of a value, you should choose a value
that would give the worst-case scenario or run multiple scenarios and compare the results. Consult the onscreen help or the Reference chapter if you are unsure of what choice to make. Additionally, ALOHA's
models use atmospheric information to estimate the spread of the chemical release. If any of the
atmospheric conditions (e.g., wind speed) change substantially during a response, you should correct the
inputs and create a new threat zone plot because the old plot may no longer be accurate.
Even when you can provide accurate input information, ALOHA's results can be unreliable under some
conditions and there are some effects that ALOHA doesn't model at all.
Conditions that can produce unreliable results
ALOHA's results can be unreliable when the following conditions exist:
• Very low wind speeds;
• Very stable atmospheric conditions;
• Wind shifts and terrain steering effects; or
• Concentration patchiness, particularly near the release source.
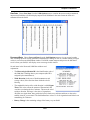
Very low wind speeds. ALOHA's threat zones are accurate if the wind direction does not change from
the value that you entered. Generally, wind direction is least predictable when wind speed is low. To show
how much a dispersion threat zone's position could change if the wind were to shift direction, under the
particular weather conditions that you enter, ALOHA draws two dashed lines, one along each side of the
threat zone. ALOHA predicts that about 95 percent of the time, the wind will not shift direction enough to
move the hazard outside of either line. The wider the zone between the lines, the less predictable is the
wind direction and the more likely it is to change substantially. At the lowest wind speeds acceptable to
ALOHA (about 2 knots, or 1 meter per second, at a height of 10 meters), these lines form a circle to
indicate that the wind could blow from any direction.
Very stable atmospheric conditions. Under the most stable atmospheric conditions (most common
late at night or very early in the morning), there is usually very little wind and almost no mixing of the
released chemical with the surrounding air. Gas concentrations within the cloud can remain high far from
the source. The accidental release of methyl isocyanate gas at Bhopal, India, in 1984 is an example of what
can happen under very stable atmospheric conditions. Thousands of people died, including many who were
far from the release. In a very stable atmosphere, a chemical cloud will spread out in the same manner as
cream poured into a coffee cup. The cream will dilute and spread slowly into the coffee, but it will take a
very long time to mix completely into the coffee without stirring it. Similarly, the cloud will spread slowly,
and high gas concentrations may build up in small valleys or depressions and remain for long periods of
time, even at distances far from the release point. ALOHA does not account for buildup of high gas
concentrations in low-lying areas.
28
Chapter 1: Welcome to ALOHA
First responders should be aware that very stable atmospheric conditions create a dangerous situation in
which models like ALOHA are not very reliable. In this situation, think about whether the chemical will
behave as a heavy gas, and look for physical depressions and topographic features that may trap or steer
the dispersing cloud.
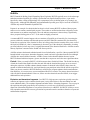
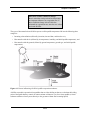
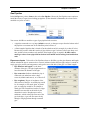
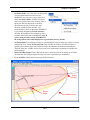
Wind shifts and terrain steering effects. ALOHA allows you to enter only single values for wind
speed and wind direction. It then assumes that wind speed and direction remain constant (at any given
height) throughout the area downwind of a chemical release. ALOHA also expects the ground to be flat
and free of obstacles. In reality, though, the wind typically shifts speed and direction as it flows up or down
slopes, between hills or down into valleys, turning where terrain features turn. The way in which land
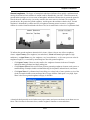
features modify patterns of air flow is called terrain steering and it is shown in Figure 1-3.
Figure 1-3. Wind shifts from terrain steering.
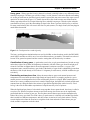
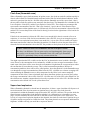
In urban areas, wind flowing around large buildings forms eddies and changes direction and speed,
significantly altering a cloud's shape and movement, as seen in Figure 1-4. Through streets bordered by
large buildings can generate a street canyon wind pattern that constrains and funnels a dispersing cloud.
ALOHA ignores these effects when it produces a threat zone plot; the threat zone will appear to go right
over, or through, obstacles such as buildings. Consider the effects of terrain on wind flow whenever you
are interpreting ALOHA results.
Figure 1-4. Small-scale variations in wind direction.
29
Chapter 1: Welcome to ALOHA
Because the wind is likely to shift in direction and change speed over both distance and time, limits have
been placed on ALOHA's output. ALOHA will not make predictions for more than an hour after a release
begins, or for distances more than 10 kilometers (6.2 miles) from the release point (it truncates threat zones
that are longer than 10 kilometers). ALOHA's 1-hour time cutoff exists because wind shifts direction and
changes speed frequently. One reason for the 10-kilometer cutoff for ALOHA threat zone length is that we
don't know what the wind speed and direction are 10 kilometers away, and can't assume that they are the
same as those at the point where a chemical is being released. If ALOHA has incorrect values for wind
speed and direction, it can't correctly estimate threat zone size or location.
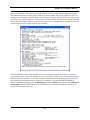
Concentration patchiness. No one can predict the gas concentration at any particular instant
downwind of a release with certainty, because they result partly from random chance. Instead, ALOHA
shows you concentration values that represent averages for time periods of several minutes (it uses the
laws of probability as well as meteorologists' knowledge of the atmosphere to do this). ALOHA predicts
that average concentrations will be highest near the release point and along the centerline of any pollutant
cloud, and will drop off smoothly and gradually in the downwind and crosswind directions. However,
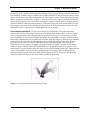
especially near the source of a release, wind eddies push a cloud unpredictably about, causing gas
concentrations at any moment to be high in one location and low in another. This kind of movement is
familiar to anyone who has tried to toast marshmallows over a campfire like the one in Figure 1-5 (no
matter where you sit, the smoke from the fire always seems to come straight towards you). Meanwhile, the
average concentrations are likely to behave approximately as ALOHA predicts. As the cloud moves
downwind from the release point, these eddies shift and spread the cloud, evening out concentrations
within the cloud so that they become more similar to ALOHA's predictions.
Figure 1-5. Concentration patchiness close to the source.
30
Chapter 1: Welcome to ALOHA
Effects that are not modeled
ALOHA doesn't account for the effects of:
• Byproducts from fires, explosions, or chemical reactions;
• Particulates;
• Chemical mixtures;
• Terrain; and
• Hazardous fragments.
Byproducts from fires, explosions, or chemical reactions. ALOHA doesn't account for the
byproducts of combustion (e.g., smoke) or for chemical reactions. ALOHA assumes that a dispersing
chemical cloud does not react with the gases that make up the atmosphere, such as oxygen and water vapor.
However, many chemicals react with dry or humid air, water, other chemicals, or even themselves.
Because of these chemical reactions, the chemical that disperses downwind might be very different from
the chemical that originally escaped from containment. In some cases, this difference may be substantial
enough to make ALOHA's dispersion predictions inaccurate. For example, if aluminum phosphide escapes
from containment and comes in contact with water, the reaction between the water and aluminum
phosphide produces phosphine gas. It is the phosphine, rather than the aluminum phosphide, that escapes
into the atmosphere. If you respond to such an accident, and wish to use ALOHA to obtain a threat zone
estimate, you need to estimate how rapidly phosphine is being generated from the reaction between water
and aluminum phosphide, and you need to model the incident in ALOHA as a release of phosphine, rather
than aluminum phosphide.
Particulates. ALOHA does not account for the processes that affect dispersion of particulates (including
radioactive particles).
Chemical mixtures. ALOHA is designed to model the release of pure chemicals and some chemical
solutions. It's difficult for any model to correctly predict the behavior of a solution or a mixture of
chemicals because it's difficult to accurately predict chemical properties such as vapor pressure for
solutions or mixtures. ALOHA's predictions are greatly affected by this and other chemical properties.
When an incorrect property value is used in ALOHA, the model's release rate and dispersion estimates will
not be valid.
Terrain. ALOHA expects the ground below a leaking tank or puddle to be flat, so that the liquid spreads
out evenly in all directions. It does not account for pooling within depressions or the flow of liquid across
sloping ground.
Hazardous fragments. If a chemical release involves an explosion, there will be flying debris from the
container and the surrounding area. ALOHA does not model the trajectories of the hazardous fragments.
31
Chapter 1: Welcome to ALOHA
32
Learning the Basics
This chapter contains a step-by-step ALOHA example—a toxic gas dispersion scenario
describing a chlorine release at a fictional treatment plant in South Dakota. Follow along,
using your own copy of ALOHA, in order to familiarize yourself with its menus and
features. For more information about any aspect of ALOHA, go to the Reference chapter.
2
Guided tour
The Central Water Facility treatment plant is located in a
rural area about 2 miles from Sioux Falls, South Dakota.
The plant uses 1-ton containers of chlorine in the water
treatment process (these tanks are 2.5 feet in diameter and
6.8 feet long). The highest-risk operation at the plant is the
changing of chlorine tanks. This operation is done only
during daytime hours. At 2:30 p.m. on June 25, 2006,
while being moved into the building, a single container
begins to leak through a valve located in the center of one
end (this valve is one-half inch in diameter). The tank
contains one ton of chlorine when it begins to leak.
Fire and explosion scenarios
This tutorial chapter will give you a solid
understanding of how to move through the
ALOHA menus and enter scenario
information. However, this tutorial only
goes through a toxic gas dispersion
scenario. If you plan on using ALOHA to
run fire and explosion scenarios, you
should also review the fire and explosion
scenarios in the Examples chapter.
Local meteorologists at NOAA's National Weather Service Weather Forecast Office have provided the
weather conditions at Sioux Falls. These conditions are: a wind speed of 5 miles per hour from the south
(measured at a height of 10 meters), sky three-tenths covered, air temperature of 72°F, and 50 percent
relative humidity. There is no low-level inversion.
You'll use ALOHA to assess the potential hazard by estimating:
• The threat zones, representing the areas downwind of the release that may be at risk; and
• The predicted chlorine concentrations at the Central Valley Elementary School, located about 1,500
yards downwind of the treatment plant. In ALOHA, this feature is called the Threat at Point.
Using on-screen ALOHA help
As you use ALOHA, you'll enter information on a series of dialog boxes to describe your
scenario. On most dialog boxes, you'll see at least one Help button, which you can use to access
on-screen help. Click any of these buttons at any time to view an explanation of the ALOHA
feature you're using or input value that you must enter into the model. To return to the dialog box
once you've finished reading the help information: a) with Microsoft Windows, close or
minimize the Help window or, b) on a Macintosh, click Cancel to exit from the on-screen help.
33
Chapter 2: Learning the Basics
Describing the time and place
Your first tasks are to start ALOHA, and then describe the time and place of the scenario.
1.
Start ALOHA. (In Windows, click the Start button, point to Programs, then choose the ALOHA
item. On a Macintosh, double-click the ALOHA program icon located in the ALOHA folder.)
2.
Read the list of ALOHA's limitations (click
3.
Select Location from the SiteData menu. A Location Information
dialog box appears with a list of the names of cities included in
ALOHA's location library.
4.
The treatment plant is located 2 miles from Sioux Falls, South
Dakota. Type the characters "si" to quickly move to SIOUX FALLS,
SOUTH DAKOTA. Check to be sure that this name is highlighted,
then click Select.
5.
Central Valley Elementary School is located about 1,500 yards
downwind of the treatment plant. ALOHA uses information about
building type, along with other information such as wind speed and air
temperature, to determine indoor infiltration rate and to estimate
indoor concentration at a location of concern. (To estimate infiltration
rate into a building, ALOHA assumes that all doors and windows are
closed.) Choose Building Type from the SiteData menu. An
Infiltration Building Parameters dialog box appears.
to see more details), then click OK.
34
Chapter 2: Learning the Basics
6.
The school is a single-storied building, surrounded mostly by open fields. Check to be sure that
Single storied building and Unsheltered surroundings are selected. Click OK.
7.
Select Date & Time from
the SiteData menu. A Date
and Time Options dialog box
appears.
8.
The release occurs on June
25, 2006 at 2:30 p.m.
(ALOHA requires time of
day in 24-hour time). Select
the Set a constant time
option. Type "6" in the
Month box, "25" in the Day
box, and "2006" in the Year
box. Type "14" in the Hour
box and "30" in the Minute
box (click Help to learn how
to convert a time value to 24hour time). Click OK.
35
Chapter 2: Learning the Basics
Choosing a chemical
As you build your ALOHA scenario, your next
task is to choose the chemical that is being
released (chlorine).
1.
To choose chlorine, select Chemical
from the SetUp menu. A Chemical
Information dialog box appears with a list
of the chemicals in ALOHA's chemical
library.
2.
Select Pure Chemicals at the top of the
window (this should be the default). Find
CHLORINE in the list (quickly type the
characters "ch" to locate chlorine more
rapidly in the list), click on this name,
then click Select.
Describing the weather
When entering weather information in ALOHA, you must choose whether you are going to enter weather
information manually or from a portable monitoring—or SAM—station. In this example, you'll enter
information manually.
1.
In the SetUp menu, point to
Atmospheric, then select User Input.
The first Atmospheric Options dialog
box appears.
2.
The wind is travelling from the south at
a speed of 5 miles per hour (mph).
Type "5" in the wind speed box, then
select mph. Type "S" in the wind
direction box.
3.
The wind conditions were measured at
a height of 10 meters (this is the height
at which the National Weather Service
usually takes measurements). Select
the tower icon in the Measurement
Height section. Notice that ALOHA
has filled in a value of 10 meters.
36
Chapter 2: Learning the Basics
4.
The exact ground roughness (a measure
of the unevenness, or roughness, of the
terrain over which the gas cloud passes)
is not known, but the accident occurs in a
rural farming area—open fields with few
trees and buildings. (In ALOHA, ground
roughness can be entered explicitly—if
the exact roughness number is known—
or implicitly by choosing a
representative type of terrain.) Select the
Open Country ground roughness
option.
5.
About 3 tenths of the sky is covered by
clouds. Under Select Cloud Cover,
choose the fourth option from the left
(the option between the partly cloudy
and clear options). Notice that ALOHA
has filled in a value of 3. Click OK. The
second Atmospheric Options dialog box
appears.
6.
The air temperature is 72°F. Type "72"
in the air temperature box, then select
F.
7.
ALOHA uses the wind speed, cloud
cover, and date and time information
that you've entered to automatically
select atmospheric Stability Class B.
(Stability is a measure of the amount of
turbulence in the atmosphere; the more
turbulent the air, the more quickly a
pollutant cloud is diluted; B is a
relatively less stable—that is, more
turbulent—stability class.)
8.
There is no low-level inversion. Check to be sure that No Inversion is selected.
9.
The relative humidity is about 50 percent. Select the icon for medium humidity. Notice that
ALOHA has filled in a value of 50 percent. Click OK.
37
Chapter 2: Learning the Basics
Describing the release
Now you're ready to enter information about the release itself—that is, to "set the source"—for this
scenario.
1.
The chlorine at the treatment
plant is stored in tanks. In the
SetUp menu, point to Source,
then select Tank. A Tank Size
and Orientation dialog box
appears.
2.
The chlorine is stored in
horizontal, standard 1-ton
containers that are 2.5 feet in
diameter and 6.8 feet long.
Select Horizontal cylinder.
Type "2.5" in the diameter
box, then select feet. Type
"6.8" in the length box. Notice
that ALOHA automatically
calculates the tank volume.
Click OK. A Chemical State
and Temperature dialog box
appears.
3.
Chlorine is a gas at ambient
temperatures, but it is being
stored under pressure as a
liquefied gas at ambient
temperature (the tank is not
refrigerated in this scenario).
Select the Tank contains
liquid option. Check to be
sure that Chemical stored at
ambient temperature is
selected. Click OK. A Liquid
Mass or Volume dialog box
appears.
38
Chapter 2: Learning the Basics
4.
The tank contains 1 ton (2,000 lbs) of chlorine. Select tons (2,000 lbs), then type "1" in the mass in
tank box. Notice that ALOHA fills in the other values. Click OK. An Area and Type of Leak dialog
box appears.
5.
The chlorine is leaking from a half-inch diameter valve. Check to be sure that Circular opening is
selected. Type "0.5" in the opening diameter box and select inches. Choose the Short pipe/valve
option. Click OK. A Height of the Tank Opening dialog box appears.
39
Chapter 2: Learning the Basics
6.
The leaking valve is located at the center of one end of the tank. Type "50" in the percent of the way
to the top of the tank box. Notice that ALOHA fills in the other values. Click OK.
ALOHA then calculates the rate of release of chlorine from the tank, the duration of the release, and
the total amount released. You'll see these calculation results in the Text Summary window and in
the source strength graph.
7.
Choose Source Strength from the Display menu to see the source strength graph for this scenario.
The graph shows the predicted averaged release rate during the hour after the release begins.
On the graph, time since the release started (from 0 to 40 minutes) is shown on the horizontal axis
(minutes), and release rate is shown on the vertical axis (pounds/minute). You can see from this
graph that because the chlorine is escaping from a pressurized container, ALOHA predicts that
release rate starts out high, then declines as container pressure drops. The highest step on this graph
is the Maximum Averaged Sustained Release Rate.
40
Chapter 2: Learning the Basics
In the Text Summary, under the Source Strength heading, you can see the estimated Maximum Average
Sustained Release Rate. ALOHA predicts release rate from a puddle, tank, or gas pipeline as a series of
hundreds of brief timesteps. ALOHA then averages this series of many release rates into between one and
five release rates, each averaged over a time period of at least 1 minute. The Maximum Average Sustained
Release Rate is the highest of these averaged release rates. To save calculation time, ALOHA uses only the
averaged release rate(s) to make its threat zone estimates.
The Text Summary window is like a blackboard: you can check its contents at any time to verify that
you've entered correct values into ALOHA, or to review ALOHA's results. If your Text Summary window
doesn't look like the one above, revise any incorrect information by choosing the appropriate menu item,
then modifying the information that you entered. For example, if you indicated that the building is
sheltered rather than unsheltered, choose Building Type from the SiteData menu again, click Unsheltered
surroundings, then click OK. When you are sure that the Text Summary information is correct, you're
ready to move on to the next steps.
41
Chapter 2: Learning the Basics
Checking the Calculation and Display Options settings
Unless you specifically change its default setting, ALOHA uses information about the properties of the
chemical and the amount of chemical released to choose whether to make Gaussian or heavy gas
dispersion computations. Check to be sure that ALOHA is set to this default.
1.
Select Calculation Options from the SetUp menu. A Calculation Options dialog box appears.
2.
Check to be sure that Let ALOHA decide (select this if unsure) is selected. Click OK.
3.
Select Display Options from the Display menu. A Display Options dialog box appears. Select
English units and ALOHA's computation results will be displayed in those units. (When running
ALOHA, you can choose either type of units, but for this example English units have been
selected.) Click OK.
42
Chapter 2: Learning the Basics
Creating a threat zone plot
To obtain a threat zone estimate, you must first choose at least one Level of Concern (LOC). (ALOHA
allows you to choose up to three LOCs for a single scenario.) For toxic gas dispersion scenarios like this
one, an LOC is a threshold concentration of the gas—usually the concentration above which a hazard is
believed to exist. For each LOC you choose, ALOHA estimates the region, or threat zone, where the
ground-level pollutant concentration may exceed your chosen level at some time after a release begins.
ALOHA superimposes those threat zones estimates and displays them on a single composite threat zone
plot—each threat zone is shown in a different color. The red threat zone represents the worst hazard and
the orange and yellow threat zones represent areas of decreasing hazard.
Choosing an LOC
No LOC represents an exact line between hazardous and non-hazardous
conditions, because people differ in their sensitivity to chemicals (for example,
old, sick, or very young people may be more sensitive to chemicals than healthy
adults) and other hazards. An LOC that's appropriate for one person may be too
high for somebody else. When you use an LOC in ALOHA, familiarize yourself
with its definition, to be sure it's appropriate for the work that you're doing and
the population that you're concerned about. Treat ALOHA's threat zone as a
rough estimate of the true hazard zone for a chemical release.
1.
Choose Threat Zone from the Display menu. A Toxic Level of Concern dialog box appears.
43
Chapter 2: Learning the Basics
2.
Decide which LOC values you want ALOHA to use to define the threat zones. For this example,
you'll keep the default LOCs for chlorine—the Acute Exposure Guideline Levels (AEGLs). Note:
the AEGL level increases with increasing hazard. Therefore, ALOHA uses AEGL-3 for the
red threat zone. Many other toxic thresholds besides AEGLs exist. Click the Help button on the
Toxic Level of Concern dialog box to learn more about choosing an LOC.
What do the AEGL levels represent?
AEGL-1: The airborne concentration of a substance above which it is predicted
that the general population, including susceptible individuals, could experience
notable discomfort, irritation, or certain asymptomatic nonsensory effects.
However, the effects are not disabling and are transient and reversible upon
cessation of exposure.
AEGL-2: The airborne concentration of a substance above which it is predicted
that the general population, including susceptible individuals, could experience
irreversible or other serious, long-lasting adverse health effects or an impaired
ability to escape.
AEGL-3: The airborne concentration of a substance above which it is predicted
that the general population, including susceptible individuals, could experience
life-threatening health effects or death.
Each of the three levels of AEGL—AEGL-1, AEGL-2, and AEGL-3—are established for each of
five exposure periods: 10 minutes, 30 minutes, 60 minutes, 4 hours, and 8 hours. Note: In
ALOHA, the 60-minute AEGL exposure limits are the default toxic LOCs (when available).
3.
In the "Show confidence lines" section, check to be sure that only for the longest threat zone
option is selected. Click OK. A Toxic Threat Zone window appears.
44
Chapter 2: Learning the Basics
4.
Examine ALOHA's threat zone plot for this scenario. On the plot, the red, orange, and yellow
regions represent the areas where chlorine concentrations are predicted to exceed the corresponding
LOC values (in this case, the AEGL values) at some time after the release begins. The red AEGL-3
threat zone—the area with the greatest exposure level—is predicted to extend more than half a mile
downwind of the leaking cylinder. The orange AEGL-2 threat zone is predicted to extend more than
one and a half miles downwind and the yellow AEGL-1 threat zone is predicted to extend for more
than two miles.
Dashed lines along both sides of the yellow threat zone indicate uncertainty in the wind direction.
The wind rarely blows constantly from any one direction. Each time it shifts direction, it blows a
pollutant cloud in a new direction. The "uncertainty lines" around the longest threat zone enclose
the region within which, about 95 percent of the time, the gas cloud is expected to remain.
5.
Review the Text Summary. You'll see the line of text, Model Run: Heavy Gas, informing you that
ALOHA used the heavy gas model to make its threat zone estimate. Because the initial cloud of
chlorine is heavier than air, ALOHA models it as a heavy gas rather than as a gas that is about the
same weight as air.
45
Chapter 2: Learning the Basics
Determining threat levels at a specific location
You can use ALOHA not only to estimate the extent of the area that could
be at risk in an incident (that's the threat zone), but also to obtain
predicted indoor and outdoor concentrations at any location of special
concern during the hour after a release begins (that's the threat at a point).
The Central Valley Elementary School is located about 1,500 yards
downwind of the treatment plant. You have already indicated the school's
building type and degree of shelter from the wind. Next, you'll indicate
the location of the school relative to the release point at the treatment
plant.
1.
Choose Threat At Point from the Display menu. A
Concentration Location dialog box appears.
2.
Click Relative Coordinates, to indicate that you are describing the school's location in terms of its
downwind and crosswind distance relative to the release point. (In other situations, you might
choose to describe the school's location in terms of geographic—east-west or north-south—
distances.) Type "1500" in the downwind distance box, then select yards. Type "0" in the crosswind
distance box. (When you enter a crosswind distance of "0," you're indicating that the wind is
blowing the gas cloud directly towards the location of concern, so that concentrations will be as
high as possible. ALOHA's concentration graph then represents the worst-case prediction for the
location.) Click OK.
46
Chapter 2: Learning the Basics
ALOHA then displays a graph of predicted chlorine concentrations at the school during the hour after the
release begins. The horizontal axis of this graph represents time (from 0 to 60 minutes after the release
starts), and the vertical axis represents concentration at the location expressed in parts per million (ppm).
The solid, thin red line represents the predicted outdoor, ground-level concentration. The dashed blue line
represents predicted concentration inside a building of the type you selected using the Building Type
menu item in the SiteData menu. To draw this line, ALOHA assumes that the building's doors and
windows are closed and that its ventilation system is off. The horizontal red, orange, and yellow lines
represent the LOCs (in this case, AEGL-3, AEGL-2, and AEGL-1, respectively).
ALOHA predicts that the cloud of chlorine would arrive at the school in about 7 minutes (that's when the
outdoor concentration line begins to rise steeply on the graph), under the conditions of this scenario. Notice
that the indoor concentration is predicted to remain much lower than the outdoor concentration, as long as
the school's doors and windows are closed. You also can see that ALOHA predicts that outdoor
concentration would exceed one LOC (AEGL-2) for this scenario only briefly, but will exceed a lower
LOC (AEGL-1) for much longer.
The indoor concentration does not exceed any of the LOC values; however, it does approach the AEGL-1
LOC for a significant period of time. At this level, people inside the building may begin to experience
notable discomfort, irritation, or other temporary effects. Bear in mind that no LOC represents an exact
line between hazardous and non-hazardous conditions, because people differ in their sensitivity to
chemicals (for example, old, sick, or very young people may be more sensitive to chemicals than healthy
adults) and other hazards. People who are more sensitive to the chemicals may experience more serious
health effects than those predicted for the AEGL-1 level, even though that level was not exceeded in the
hour after the release.
When you use ALOHA in planning or response, you may wish to compare predicted concentrations with
other toxic thresholds besides AEGLs. Be sure that the LOCs that you choose reflect the hazard that you
are concerned about, and are conservative enough for the uses to which you're putting your ALOHA
results. (You make a conservative choice when the option is more likely to produce an overestimate of the
hazard rather than an underestimate.)
47
Chapter 2: Learning the Basics
Here's how the Text Summary window should look, now that you have completed your work with this
example scenario (note that depending on the type of computer you use, some of the numbers that you see
on your screen may be slightly different than those in the following figure):
Exiting (Quitting) ALOHA
When you've completed your work with ALOHA, just choose Exit from the File menu if you're using
Windows, or Quit from the File menu if you're using a Macintosh. (You can also first save any ALOHA
scenario as a file you can reopen later in ALOHA, see "Save and Save As" on page 100.)
48
Examples
This chapter contains three step-by-step ALOHA example scenarios. You can complete
the first two scenarios using only ALOHA. To complete the third scenario, you'll also need
the electronic mapping application, MARPLOT, as well as the sample map of Prince
William County supplied with MARPLOT.
3
Example 1: A Tank Source (Puddle and Pool Fire)
In a small industrial park outside Baton Rouge, Louisiana, a 500-gallon, 4-foot-diameter, vertical tank
contains liquid benzene. On August 20, 2006, at 10:30 p.m. local time, a security guard discovers that
liquid is leaking out of the tank through a 6-inch circular hole located 10 inches above the bottom of the
tank. He also sees that the liquid is flowing onto a paved area in the industrial park. The guard thinks that
the tank has just been filled that evening.
The temperature on scene is 80°F, with the wind from the southwest at 7 miles per hour (as measured at a
height of 10 meters by a fixed meteorological tower at the site). The sky is more than half covered by
clouds and the humidity is about 75 percent. A thunderstorm is approaching from the southwest. There is
no low-level inversion. There are very few buildings in the industrial park and a large grassy field is
located to the northeast of the industrial park.
The Local Emergency Planning Committee has requested that on-scene responders use ERPG-2
concentrations to define the toxic endpoints in their analysis of benzene hazards.
In this example scenario, you'll determine:
1.
Distance to the ERPG-2 level if the puddle evaporates and forms a toxic vapor cloud; and
2.
Thermal radiation threat if the puddle is ignited by a lightning strike and forms a pool fire.
Choosing a location and a chemical
1.
Start ALOHA. (In Windows, click the Start button, point to Programs, then choose the ALOHA
item. On a Macintosh, double-click the ALOHA program icon located in the ALOHA folder.)
2.
Read the list of ALOHA's limitations (click
3.
Select Location from the SiteData menu. A Location Information dialog box appears with a list of
the names of cities included in ALOHA's location library.
to see more details), then click OK.
49
Chapter 3: Examples
4.
The industrial park is located outside Baton Rouge, Louisiana. Type the characters "ba" to quickly
move to the section of the list containing names beginning with "ba." Scroll down a little farther
until you see BATON ROUGE, LOUISIANA. Click on this name to highlight it, then click Select.
In this example, you will not modify the default building type settings because you will not assess indoor
concentration at specific locations.
5.
Select Date & Time from the SiteData menu. A Date and Time Options dialog box appears.
6.
The release occurs at 10:30 p.m. on August 20, 2006. Select the Set a constant time option. Enter
the month, day, year, hour, and minute for this scenario (press Tab to move from one box to the
next). ALOHA requires you to convert the time of day into 24-hour time (click Help to learn how to
convert time values). Click OK.
50
Chapter 3: Examples
7.
To choose the chemical that is being
released—benzene—select Chemical
from the SetUp menu. A Chemical
Information dialog box appears with a
list of the chemicals in ALOHA's
chemical library.
8.
Select Pure Chemicals at the top of
the window (this should be the default).
Find BENZENE in the list (type the
character "b" to locate benzene more
rapidly in the list), click on this name,
then click Select.
Entering weather information
Now that you've selected the location, time, and chemical, you must provide information about weather
conditions and ground roughness.
1.
In the SetUp menu, point to Atmospheric, then select User Input. The first Atmospheric Options
dialog box appears.
2.
The wind is travelling from the
southwest at a speed of 7 miles per
hour. Type "7" in the wind speed box,
then select mph. Type "SW" in the
wind direction box.
3.
The wind conditions are measured at a
height of 10 meters. Select the tower
icon in the Measurement Height
section. Notice that ALOHA has filled
in a value of 10 meters.
4.
There are very few buildings in the
industrial park and a large grassy field
is located to the northeast (the area
where the wind would blow the toxic
vapor cloud). Select the Open
Country ground roughness option.
5.
The sky is more than half covered by clouds. Under Select Cloud Cover, choose the second option
from the left (the option between the complete cover and partly cloudy options). Notice that
ALOHA has filled in a value of 7. Click OK. The second Atmospheric Options dialog box appears.
51
Chapter 3: Examples
6.
The air temperature is 80°F. Type "80"
in the air temperature box, then select
F.
7.
ALOHA uses the wind speed, cloud
cover, and date and time information
that you've entered to automatically
select atmospheric Stability Class D,
representing conditions of neutral
atmospheric stability.
8.
There is no low-level inversion. Check
to be sure that No Inversion is
selected.
9.
The relative humidity is about 75 percent. Choose the second option from the left (the option
between the wet and medium options). Notice that ALOHA has filled in a value of 75 percent. Click
OK.
The information that you have entered into ALOHA appears in the Text Summary. Ignore ALOHA's
estimate of building exchange rate, since you are not considering infiltration into buildings.
52
Chapter 3: Examples
Describing the release
Now you're ready to enter information about the release itself—that is, to "set the source"—for this release.
1.
The benzene is leaking from a tank. In the SetUp menu, point to Source, then select Tank. A Tank
Size and Orientation dialog box appears.
2.
The benzene is stored in a 500-gallon, 4-foot-diameter, vertical tank. Select Vertical cylinder. Type
"500" in the volume box, then select gallons. Type "4" in the diameter box, then select feet. Notice
that ALOHA automatically calculates the tank length. Click OK. A Chemical State and
Temperature dialog box appears.
3.
The benzene is stored in the tank as a liquid (notice in the Text Summary that it has a boiling point
of 176°F, well above the ambient temperature). Select the Tank contains liquid option. Check to be
sure that Chemical stored at ambient temperature is selected. Click OK. A Liquid Mass or
Volume dialog box appears.
53
Chapter 3: Examples
4.
The security guard thinks the 500-gallon tank was filled that evening, so the most conservative
estimate you can make is that the tank is 100 percent full. Either (1) type "100" in the % full by
volume box, (2) type "500" in the liquid volume box, then click gallons, or (3) scroll the liquid level
bar to the top of the tank diagram. Notice that ALOHA fills in the other values. Click OK. A Type
of Tank Failure dialog box appears.
5.
Initially, the benzene is leaking from a hole in the tank, but it is not burning. Choose the Leaking
tank, chemical is not burning and forms an evaporating puddle option. Click OK. An Area and
Type of Leak dialog box appears.
54
Chapter 3: Examples
6.
The benzene is leaking from a 6-inch circular hole. Check to be sure that Circular opening is
selected. Type "6" in the opening diameter box and select inches. Choose the Hole option. Click
OK. A Height of the Tank Opening dialog box appears.
7.
The hole is 10 inches above the bottom of the tank. Type"10" in the bottom of the leak box and
select in. Notice that ALOHA fills in the other values. Click OK. A Puddle Parameters dialog box
appears.
55
Chapter 3: Examples
8.
The liquid benzene is flowing onto a paved area
in the industrial park. Select the Concrete
ground type. Since you have no information
about the ground temperature, select Use air
temperature (select this if unknown). Because
the product is flowing onto a paved area, it is
probably not contained by a dike, so it will
continue spreading outward until it reaches a
minimum thickness. Under the "Input
maximum puddle diameter or area" heading,
click Unknown. ALOHA will calculate the area
for you based on the release information you
provided (up to a maximum diameter of 200
meters). Click OK.
The source strength information that you have entered, and the results of ALOHA's source strength
calculations, appear in the Text Summary. ALOHA estimates that the release of vapor into the atmosphere
lasts for about 46 minutes, and that the maximum amount of vapor released at any one time is 77.2 pounds
per minute (this is the Maximum Average Sustained Release Rate). ALOHA estimates that the puddle
reached a maximum diameter of 21.7 yards.
56
Chapter 3: Examples
9.
Choose Source Strength from the Display menu to see the source strength graph for this scenario.
The graph shows the predicted averaged release rate during the hour after the release begins.
Whenever you run ALOHA, ask yourself: Is ALOHA accurately representing what is actually occurring in
this scenario? In this case, liquid benzene leaks from a tank to form a puddle; ALOHA expects that
because the puddle is undiked, it spreads out to cover a large area and evaporates at a high rate for a
relatively short period of time. What if the puddle were constrained by small depressions in the ground?
The puddle would not spread out as far because the liquid flowing away from the tank would fill up the
depressions in the ground. The puddle would then be smaller in area and deeper. It would evaporate at a
slower rate and it would take longer to completely evaporate.
Because ALOHA assumes that the puddle is on a perfectly flat surface and would spread out until it was
very thin, ALOHA may overestimate the real puddle size and evaporation rate. At a real accident scene,
check for terrain features that would constrain the puddle from spreading; use this information to estimate
the maximum puddle area.
57
Chapter 3: Examples
Checking the Calculation and Display Options Settings
You don't know if the toxic gas is a heavy gas or not, so you'll want ALOHA to use information about the
properties of the chemical and the amount of chemical released to choose whether to make Gaussian or
heavy gas dispersion computations. Check to be sure that ALOHA is set to this default.
1.
Select Calculation Options from the SetUp menu. A Calculation Options dialog box appears.
2.
Check to be sure that Let ALOHA decide (select this if unsure) is selected. Click OK.
3.
Select Display Options from the Display menu. A Display Options dialog box appears. Select
English units and ALOHA's computation results will be displayed in those units. (When running
ALOHA, you can choose either type of units, but for this example English units have been
selected.) Click OK.
Choosing LOCs and creating a threat zone plot
1.
Choose Threat Zone from the Display menu. A Hazard To Analyze dialog box appears.
58
Chapter 3: Examples
2.
As the puddle evaporates, a vapor cloud forms. ALOHA can help you model three possible
hazardous scenarios for the flammable vapor cloud: toxic area, flammable area, or blast area. For
this example, you want to display the toxic area on a threat zone plot. Select the Toxic Area of
Vapor Cloud option. Click OK. A Toxic Level of Concern dialog box appears.
3.
ALOHA uses ERPGs (Emergency Response Planning Guidelines) as the default LOCs for benzene,
so you'll keep the default LOCs and check that Show confidence lines only for the longest threat
zone has been selected. Click OK. ALOHA will display a threat zone plot for this release.
59
Chapter 3: Examples
You'll see ALOHA's threat zone plot
for this scenario, showing three toxic
threat zones. You want to know the
downwind distance to the ERPG-2
level specified by the Local
Emergency Planning Committee.
ALOHA estimates that the orange
threat zone—the ERPG-2 level—will
extend 281 yards downwind (the exact
value for this threat distance is
displayed in the Text Summary).
Within this zone, ground-level
benzene concentrations might exceed
the ERPG-2 level. At concentrations
above the ERPG-2 level, people could
experience serious health effects or
find their ability to escape to be
impaired (if they are exposed for
about an hour).
Check the Text Summary for this release.
60
Chapter 3: Examples
Modeling a second scenario: pool fire
Now that ALOHA has displayed the downwind distance to the ERPG-2 level, you want to assess the
thermal radiation threat if the puddle is ignited by a lightning strike (or other ignition source) and forms a
pool fire. For this example, you want to assess the threat assuming that the pool fire occurs soon after the
puddle forms. Therefore, you do not need to enter new information for time, atmospheric conditions, or
puddle size.
1.
When you run multiple scenarios for the same incident, the plots and Text Summary screen from the
first scenario will change when you enter new information. Before you start running an additional
scenario, either print out the threat zone plot and the Text Summary screen or paste them into a
word processing document. You'll need the original information to compare the scenarios later.
2.
Close the threat zone plot window.
3.
When you set the source for the first scenario, you told ALOHA that the benzene was leaking from
a tank, but it was not burning. You need to return to the Type of Tank Failure screen and tell
ALOHA that now the chemical is burning and it has formed a pool fire. Begin by selecting the Tank
source again. In the SetUp menu, point to Source, then select Tank. A Tank Size and Orientation
dialog box appears.
4.
Notice that all of your original information is already entered into the dialog box. The dimensions of
the tank have not changed, so you can just click OK to move to the next screen.
5.
Your original information is still correct on the Chemical State and Temperature and the Liquid
Mass or Volume dialog boxes. Click OK on each screen until the Type of Tank Failure dialog box
appears.
6.
Choose the Leaking tank, chemical is burning and forms a pool fire option. Click OK. An Area
and Type of Leak dialog box appears.
61
Chapter 3: Examples
7.
Your original information is still correct on the Area and Type of Leak, Height of the Tank Opening,
and Maximum Puddle Size dialog boxes. Click OK on each screen.
The source strength information that you have entered, and the results of ALOHA's source strength
calculations, appear in the Text Summary. ALOHA estimates that the puddle burns for about two minutes,
and that the Maximum Burn Rate is 1,610 pounds per minute. Notice that ALOHA estimates that the
puddle reached a maximum diameter of 15.0 yards, which is smaller than the 21.7 yards estimated for the
evaporating puddle because the chemical is being consumed in the fire before the puddle can spread to the
larger diameter.
62
Chapter 3: Examples
8.
Choose Source Strength from the Display menu to see the source strength graph for this scenario.
The graph shows the predicted averaged burn rate.
ALOHA estimates that the pool fire would last just under 2 and a half minutes. (In the Text Summary,
ALOHA listed the burn duration as 2 minutes. ALOHA rounds duration estimates to the nearest whole
minute on the Text Summary screen, but uses the more precise source strength value in its threat
calculations.) The increase in burn rate for the first minute and a half is due to the growing puddle size as
the chemical continues to leak from the tank.
Choosing LOCs and creating a threat zone plot for the pool fire
1.
Choose Threat Zone from the
Display menu. A Thermal
Radiation Level of Concern
dialog box appears.
2.
You want to know the thermal
radiation threat for the pool fire.
Keep ALOHA's default LOCs
and click OK. ALOHA will
display a threat zone plot for
this release.
63
Chapter 3: Examples
You'll see ALOHA's threat zone plot for this scenario, showing three nearly circular thermal radiation
threat zones. The red threat zone represents the worst hazard level, and the orange and yellow threat zones
represent areas of decreasing hazard. Unlike the toxic threat, the thermal radiation threat extends in all
directions simultaneously. But it extends a little farther in the downwind direction. For example, ALOHA
estimates that the orange threat zone will extend 51 yards in the downwind direction. This threat distance is
shown in the Text Summary. The orange threat zone extends only about 40 yards in the upwind direction.
This difference exists because the wind tilts the flames in the downwind direction—leading to a greater
thermal radiation threat in that direction. It is important to realize that there may be additional hazards that
are not modeled by ALOHA, including secondary fires and explosions.
Check the Text Summary for this release.
64
Chapter 3: Examples
Compare the threat zone plots and the Text Summary screens from both of the scenarios. (The threat
distances from the Text Summary screens are summarized in a table below.) The origin (0,0) on both plots
represents the center of the puddle. ALOHA estimates that the red toxic threat zone—the worst hazard
level—extends primarily in the downwind direction for about 82 yards. The worst of the thermal radiation
threat (the red zone) is predicted to extend roughly 30 yards in all directions—and a little farther in the
downwind direction. Notice the role that the direction of the wind plays in both scenarios. The toxic threat
is confined primarily to the area downwind of the release, and even though the thermal radiation threat
occurs in all directions it too is shifted downwind from the origin.
65
Scenario
Toxic
Dispersion
Pool Fire
Threat
Modeled
Toxicity
Thermal
radiation
Red
Threat
Zone
82 yards
36 yards
Orange
Threat
Zone
281 yards
51 yards
Yellow
Threat
Zone
564 yards
78 yards
Chapter 3: Examples
Example 2: A Tank Source (Multiple Scenarios)
On June 25, 2006, at 12:30 p.m., a train derails in a highly industrialized section of Columbia, South
Carolina. Among the derailed cars is a tank car of propane in a U.S. Department of Transportation (DOT)
class 112J400W car with a listed capacity of 33,800 gallons. The tank is approximately 70 feet long and
the tank appears to be intact. The propane has been liquefied under pressure.
At the time of the accident, the air temperature is 70°F, with the wind from 360° at 10 miles per hour
(measured at a height of 10 meters by the National Weather Service). The sky is completely overcast and
the relative humidity is 67 percent. There is no low-level inversion.
The tank needs to be removed from the tracks and the cargo off-loaded. The tank has already been
subjected to significant stress during the wreck and it is conceivable that it could fail during this effort.
Possible failure scenarios include:
• A sudden catastrophic failure leading to a Boiling Liquid Expanding Vapor Explosion (BLEVE);
• A leak leading to a flash fire or a vapor cloud explosion; or
• A breach leading to a jet of flame from the tank.
In order to plan a safe response and ensure public safety, the potential severity of these threats must be
evaluated. You will use ALOHA to predict the threat zones for each of these potential scenarios. For the
last two scenarios, you will model the release assuming a seam fails on the tank, creating a rectangular hole
40 inches long and 0.1 inch wide.
Choosing a location and a chemical
1.
Start ALOHA. (In Windows, click the Start button, point to Programs, then choose the ALOHA
item. On a Macintosh, double-click the ALOHA program icon located in the ALOHA folder.)
2.
Read the list of ALOHA's limitations (click
3.
Select Location from the SiteData menu. A Location Information dialog box appears with a list of
the names of cities included in ALOHA's location library.
to see more details), then click OK.
66
Chapter 3: Examples
4.
The train derails in Columbia, South Carolina. Type the characters "co" to quickly move to the
section of the list containing names beginning with "co." Scroll down a little farther until you see
COLUMBIA, SOUTH CAROLINA. Click on this name to highlight it, then click Select.
In this example, you will not modify the default building type settings because you will not assess indoor
concentration at specific locations.
5.
Select Date & Time from the SiteData menu. A Date and Time Options dialog box appears.
6.
The release occurs at 12:30 p.m. on June 25, 2006. Select the Set a constant time option. Enter the
month, day, year, hour, and minute for this scenario (press Tab to move from one box to the next).
ALOHA requires you to convert the time of day into 24-hour time (click Help to learn how to
convert time values). Click OK.
67
Chapter 3: Examples
7.
To choose the chemical that is in the
tank—propane—select Chemical from
the SetUp menu. A Chemical
Information dialog box appears with a
list of the chemicals in ALOHA's
chemical library.
8.
Select Pure Chemicals at the top of
the window (this should be the default).
Find PROPANE in the list (quickly
type the characters "pr" to locate
propane more rapidly in the list), click
on this name, then click Select.
Entering weather information
Now that you've selected the location, time, and chemical, you must provide information about weather
conditions and ground roughness.
1.
In the SetUp menu, point to Atmospheric, then select User Input. The first Atmospheric Options
dialog box appears.
2.
The wind is travelling from 360° at a
speed of 10 miles per hour. Type "10"
in the wind speed box, then select
mph. Type "360" in the wind direction
box.
3.
The wind conditions are measured at a
height of 10 meters. Select the tower
icon in the Measurement Height
section. Notice that ALOHA has filled
in a value of 10 meters.
4.
The area surrounding the derailed cars
is highly industrialized. Select the
Urban or Forest ground roughness
option.
5.
The sky is completely overcast. Under
Select Cloud Cover, choose the
complete cover options. Notice that
ALOHA has filled in a value of 10.
Click OK. The second Atmospheric
Options dialog box appears.
68
Chapter 3: Examples
6.
The air temperature is 70°F. Type
"70" in the air temperature box, then
select F.
7.
ALOHA uses the wind speed, cloud
cover, and date and time
information that you've entered to
automatically select atmospheric
Stability Class D, representing
conditions of neutral atmospheric
stability.
8.
There is no low-level inversion.
Check to be sure that No Inversion
is selected.
9.
The relative humidity is 67 percent.
Type "67" in the humidity value box. Click OK.
The information that you have entered into ALOHA appears in the Text Summary. Ignore ALOHA's
estimate of building exchange rate, since you are not considering infiltration into buildings.
69
Chapter 3: Examples
Describing the release
Now you're ready to enter information about the release itself—that is, to "set the source"—for this release.
You'll begin by modeling the BLEVE scenario.
1.
The propane might leak from a tank car. In the SetUp menu, point to Source, then select Tank. A
Tank Size and Orientation dialog box appears.
2.
The propane is stored in a 33,800-gallon, 70-foot long, horizontal tank car. Select horizontal
cylinder. Type "33800" in the volume box, then select gallons. Type "70" in the length box, then
select feet. Notice that ALOHA automatically calculates the tank diameter. Click OK. A Chemical
State and Temperature dialog box appears.
3.
The propane is stored in the tank as a liquid; the propane was liquefied by pressure, not by
refrigeration. Select the Tank contains liquid option. Check to be sure that Chemical stored at
ambient temperature is selected. Click OK. A Liquid Mass or Volume dialog box appears.
70
Chapter 3: Examples
4.
You are not sure how full the tank is, but you want to make a worst-case estimate, so you will
assume the tank is filled to capacity (33,800 gallons). Either (1) type "100" in the % full by volume
box, (2) type "33800" in the liquid volume box, then click gallons, or (3) scroll the liquid level bar
to the top of the tank diagram. Notice that ALOHA fills in the other values. Click OK. A Type of
Tank Failure dialog box appears.
5.
You want to begin by modeling the potential BLEVE scenario. Choose the BLEVE, tank explodes
and chemical burns in a fireball option. Click OK.
71
Chapter 3: Examples
The source strength information that you have entered, and the results of ALOHA's source strength
calculations, appear in the Text Summary. ALOHA estimates that the BLEVE fireball has a diameter of
about 253 yards and burns for about 14 seconds.
Choosing LOCs and creating a threat zone plot for a BLEVE
1.
Choose Threat Zone from the
Display menu. A Thermal
Radiation Level of Concern
dialog box appears.
2.
You want to know the thermal
radiation threat for a BLEVE.
Keep ALOHA's default LOCs
and click OK. ALOHA will
display a threat zone plot for
this release.
72
Chapter 3: Examples
You'll see ALOHA's threat zone plot for this scenario, showing three thermal radiation threat zones.
ALOHA estimates that the red threat zone—the worst hazard level—will extend 560 yards in all directions
(the threat distance values are displayed in the Text Summary). The orange and yellow threat zones
represent areas of decreasing hazard. Check the plot legend to see the hazard that each zone represents. It is
important to realize that there may be additional hazards that are not modeled by ALOHA, including
hazardous fragments, overpressure, and secondary fires and explosions.
Check the Text Summary for this release to see a summary of the scenario and the threat zones.
73
Chapter 3: Examples
Modeling a second scenario: flash fire or vapor cloud explosion
Now that ALOHA has displayed the thermal radiation hazard from a BLEVE, you want to assess the threat
if the tank leaks and a flammable vapor cloud forms instead. If this situation occurs, either a flash fire or a
vapor cloud explosion could occur, depending on the scenario specifics. For both of these scenarios, you
will need to begin by estimating the flammable area of the vapor cloud. You do not need to enter new
information for time, atmospheric conditions, or tank size.
1.
When you run multiple scenarios for the same incident, the plots and Text Summary screen from the
first scenario will change when you enter new information. Before you start running an additional
scenario, either print out the threat zone plot and the Text Summary screen or paste them into a
word processing document. You'll need the original information to compare the scenarios later.
2.
Close the threat zone plot window.
3.
When you set the source for the first scenario, you told ALOHA that a BLEVE occurred. You need
to return to the Type of Tank Failure screen and tell ALOHA that now you want to model a scenario
where the chemical is not burning as it escapes into the atmosphere. Begin by selecting the Tank
source again. In the SetUp menu, point to Source, then select Tank. A Tank Size and Orientation
dialog box appears.
4.
Notice that all of your original information is already entered into the dialog box. The dimensions of
the tank have not changed, so you can just click OK to move to the next screen.
5.
Your original information is still correct on the Chemical State and Temperature and the Liquid
Mass or Volume dialog boxes. Click OK on each screen until the Type of Tank Failure dialog box
appears.
6.
Choose the Leaking tank, chemical is not burning as it escapes into the atmosphere option.
Click OK. An Area and Type of Leak dialog box appears.
74
Chapter 3: Examples
7.
The tank appears to be intact. However, you want to model a release assuming a seam fails on the
tank, creating a rectangular hole 40 inches long and 0.1 inch wide. Select Rectangular opening.
Type "40" in the opening length box and select inches. Type "0.1" in the opening width box. Choose
the Hole option. Click OK. A Height of the Tank Opening dialog box appears.
8.
Since you are modeling this scenario in order to plan for a potential release, you don't know where
the hole might occur. However, a hole that occurs at the bottom of the tank will give the worst-case
estimate for this type of scenario because the weight of the remaining propane in the tank will push
the propane through the hole faster. Type "0" in the % of the way to the top of the tank box. Click
OK.
75
Chapter 3: Examples
The source strength information that you have entered, and the results of ALOHA's source strength
calculations, appear in the Text Summary. ALOHA estimates that the release lasts for about 26 minutes,
and that the Maximum Average Sustained Release Rate is 5,730 pounds per minute.
Choosing LOCs and creating threat zone plots for a flammable vapor cloud
1.
Choose Threat Zone from the Display menu. A Hazard To Analyze dialog box appears.
2.
ALOHA can help you model three possible hazardous scenarios for the flammable vapor cloud:
toxic area, flammable area, or blast area. For this example, first you want to display the flammable
area of the vapor cloud on a threat zone plot. The flammable area is the predicted area where the
ground-level vapor (fuel) concentration in air is within the flammable range and can be ignited.
Then, you will use the threat zone plot to determine possible ignition sources and the level of
congestion within the vapor cloud, both of which affect whether a vapor cloud explosion is possible.
Select the Flammable Area of Vapor Cloud option. A Flammable Level of Concern dialog box
appears.
76
Chapter 3: Examples
3.
Keep ALOHA's default LOCs and check that Show confidence lines only for the longest threat
zone has been selected. Click OK. ALOHA will display a threat zone plot for this release.
You'll see ALOHA's threat zone plot for this scenario, showing two flammable threat zones. The red threat
zone represents the estimated flammable area where a flash fire or a vapor cloud explosion could occur at
some time after the release begins. ALOHA estimates that the red threat zone will extend 171 yards in the
downwind direction. The yellow threat zone represents the estimated area where propane concentrations
could exceed 10% LEL, a level often used by responders.
77
Chapter 3: Examples
Check the Text Summary for this release.
4.
Either print out the threat zone plot and the Text Summary screen or paste them into a word
processing document. You'll need the information to compare the scenarios later.
Now that you know where the estimated flammable portion of the cloud is, you can identify possible
ignition sources and the level of congestion within that area to model a vapor cloud explosion. The portion
of the cloud that might participate in a vapor cloud explosion—the red zone on the threat zone plot—is
expected to travel through a slightly congested area where there are many likely ignition sources (e.g.,
mechanical sparks).
5.
Choose Threat Zone from the
Display menu. The Hazard To
Analyze dialog box appears again.
This time, choose Blast Area of
Vapor Cloud Explosion. Click OK.
A Vapor Cloud Explosion Parameters
dialog box appears.
6.
You do not know the ignition time, so
select unknown (show composite
threat zone from all possible
ignition times). Because the
flammable area of the vapor cloud is
in an industrial area, you determine
that the vapor cloud could be
ignited—if it ignites—by a
mechanical spark. Select ignited by
spark or flame.
7.
The flammable area is slightly congested. However, slightly congested doesn't seem to fit into either
of ALOHA's congestion categories. After reading the on-screen help, you are fairly sure that you
should choose the uncongested option because it describes the majority of the cloud. However, you
also realize that congestion level can affect the severity of a vapor cloud explosion, so you decide to
model the explosion twice—once with each congestion option—so that you can compare the
potential explosions. Begin by selecting the uncongested option, because you feel it is the most
accurate guess. Click OK. An Overpressure Level of Concern dialog box appears.
78
Chapter 3: Examples
8.
You want to know the overpressure threat for the vapor cloud explosion. Keep ALOHA's default
LOCs and check that Show confidence lines only for the longest threat zone has been selected.
Click OK. ALOHA will display a threat zone plot for this release.
ALOHA's threat zone window appears. None of the LOCs were exceeded for the given scenario so
ALOHA does not create a threat zone plot. A vapor cloud explosion generating a dangerous overpressure
is not likely to occur with the settings you chose for this scenario. (The cloud could still burn as a flash fire,
but it would not generate a dangerous blast wave.) In fact, there are only a few chemicals in ALOHA's
chemical library that have a high enough fuel reactivity to result in a vapor cloud explosion when the cloud
is ignited by a spark or flame in an uncongested area: Acetylene; Ethylacetylene; Ethylene oxide;
Hydrogen; Propylene oxide; and 1,3-Propylene oxide. A vapor cloud explosion is more likely to occur if
the area is congested or if the cloud was ignited by a detonation (e.g., by a high-power explosive device).
Now you will model the explosion for a congested area.
9.
Either print out the Text Summary screen or paste it into a word processing document. You'll need
the information to compare the scenarios later.
79
Chapter 3: Examples
10. Choose Threat Zone from the Display menu. The Hazard To Analyze dialog box appears again.
11. Blast Area of Vapor Cloud Explosion is already selected, so click OK. The Vapor Cloud
Explosion Parameters dialog box appears again.
12. Keep you previous settings for ignition time and ignition type, but choose congested as the
congestion level. Click OK. The Overpressure Level of Concern dialog box appears again.
13. Keep ALOHA's default LOCs and check that Show confidence lines only for the longest threat
zone has been selected. Click OK. ALOHA will display a threat zone plot for this release.
ALOHA's threat zone window appears. ALOHA has plotted the orange and yellow threat zones. A review
of the Text Summary reveals that the red threat zone was not plotted because the LOC was never exceeded
and that the orange threat zone is predicted to extend 129 yards in the downwind direction. Note that
because you chose the unknown time option, ALOHA ran explosion scenarios for a range of ignition times
encompassing all of the possible ignition times for your scenario. Therefore, these threat zones do not
represent the blast area from a single explosion, but rather the composite of potential blast areas for all of
the different ignition time scenarios that ALOHA ran.
80
Chapter 3: Examples
Compare the flammable vapor cloud threat zone plots. (Below, the flammable area threat zone plot is
shown on the left and the congested vapor cloud explosion threat zone plot is on the right; threat distances
from the Text Summary screens for all of the flammable vapor cloud scenarios are summarized in a table.)
The flammable area red threat zone is estimated to extend 171 yards downwind. This is the area where
ALOHA predicts a flash fire or a vapor cloud explosion could occur at some point after the release
begins—depending on the release conditions, congestion level, and availability of ignition sources. When
you modeled the uncongested vapor cloud explosion, you found that a vapor cloud explosion generating a
dangerous overpressure is not likely to occur and ALOHA does not display a threat zone plot. You also
modeled a congested vapor cloud explosion, even though you felt the conditions were better described by
the uncongested explosion. The congested vapor cloud explosion is likely to overestimate the overpressure
hazard for your scenario, because it does not describe the congestion level in the majority of the cloud. The
red threat zone for this explosion was not displayed because the chosen LOC was never exceeded.
Since uncongested is the most accurate congestion level for this scenario, you decide that a vapor cloud
explosion is not likely to occur. However, a flash fire could occur (regardless of the congestion level), so it
is important to consider the availability of ignition sources within the flammable area of the vapor cloud.
Scenario
Threat Modeled
Red
Threat Zone
Orange
Threat Zone
Yellow
Threat Zone
Flammable area
Thermal radiation,
if a flash fire occurs
171 yards
No LOC
selected
489 yards
Vapor cloud explosion
(uncongested)
Overpressure
LOC never
exceeded
LOC never
exceeded
LOC never
exceeded
Vapor cloud explosion
(congested)
Overpressure
LOC never
exceeded
129 yards
221 yards
81
Chapter 3: Examples
Modeling a third scenario: jet fire
Now that you have considered the flammable area and the overpressure hazard from a vapor cloud
explosion, you want to assess the thermal radiation threat if the tank leaks and the escaping propane is
quickly ignited, so that a jet fire occurs instead. Therefore, you do not need to enter new information for
time, atmospheric conditions, or tank size.
1.
Either print out the threat zone plot and the Text Summary screen from the last scenario or paste
them into a word processing document. You'll need the information to compare the scenarios later.
2.
Close the threat zone plot window.
3.
When you set the source for the second scenario, you told ALOHA that the tank was leaking, but
the chemical was not on fire. You need to return to the Type of Tank Failure screen and tell ALOHA
that now you want to model a scenario where the chemical is burning as it escapes into the
atmosphere. Begin by selecting the Tank source again. In the SetUp menu, point to Source, then
select Tank. A Tank Size and Orientation dialog box appears.
4.
Your original information is still
correct on the Tank Size and
Orientation, Chemical State and
Temperature, and the Liquid Mass
or Volume dialog boxes. Click OK
on each screen until the Type of
Tank Failure dialog box appears.
5.
Choose the Leaking tank,
chemical is burning as a jet fire
option. Click OK. An Area and
Type of Leak dialog box appears.
6.
Your original information is still
correct on the Area and Type of
Leak dialog box. Click OK. A
Height of the Tank Opening dialog
box appears.
7.
ALOHA models jet fires assuming
the opening is on the top of the tank. Type "100" in the % of the way to the top of the tank box. Click
OK.
The source strength information
that you have entered, and the
results of ALOHA's source strength
calculations, appear in the Text
Summary. ALOHA limited the jet
fire to one hour, and estimated that
the Maximum Burn Rate is 5,730
pounds per minute.
82
Chapter 3: Examples
Choosing LOCs and creating a threat zone plot for a jet fire
1.
Choose Threat Zone from the Display menu. A Thermal Radiation Level of Concern dialog box
appears.
2.
You want to know the thermal radiation threat for the jet fire. Keep ALOHA's default LOCs and
click OK. ALOHA will display a threat zone plot for this release.
You'll see ALOHA's threat zone plot for this scenario, showing three thermal radiation threat zones.
ALOHA estimates that the red threat zone—the worst hazard level—will extend about 50 yards in all
directions (and a little farther in the downwind direction). The orange and yellow threat zones represent
areas of decreasing hazard. It is important to realize that there may be additional hazards that are not
modeled by ALOHA, including secondary fires and explosions.
Check the Text Summary for this release.
83
Chapter 3: Examples
You have already compared the plots for the flammable area and the vapor cloud explosion, so now you
want to compare the thermal radiation threat zone plots and the Text Summary screens from the BLEVE
and jet fire scenarios (Below, the BLEVE threat zone plot is shown on the left and the threat distances from
the Text Summary screens for all of the scenarios are summarized in a table.) The BLEVE red threat
zone—the worst hazard level—is estimated to extend 560 yards in all directions. The jet fire red zone is
only predicted to extend about 50 yards in all directions. However, the BLEVE will last about 14 seconds,
whereas the jet fire is predicted to last over an hour. When considering thermal radiation hazards it is
important to consider both the thermal radiation level and the length of time over which someone might be
exposed to that level.
Scenario
Threat Modeled
Red
Threat Zone
Orange
Threat Zone
Yellow
Threat Zone
BLEVE
Thermal radiation
560 yards
790 yards
1231 yards
Flammable area
Thermal radiation,
if a flash fire occurs
171 yards
No LOC
selected
489 yards
Vapor cloud explosion
(uncongested)
Overpressure
LOC never
exceeded
LOC never
exceeded
LOC never
exceeded
Vapor cloud explosion
(congested)
Overpressure
LOC never
exceeded
129 yards
221 yards
Jet fire
Thermal radiation
58 yards
83 yards
129 yards
84
Chapter 3: Examples
Example 3: A Direct Source and a MARPLOT Map
At 3 p.m. on June 4, 2006, a train traveling on the Southern Railway near Manassas, Virginia, collides with
a stalled truck at Lee Highway. Three 150-pound chlorine cylinders that were in the truck bed are damaged
during the collision and simultaneously release their contents. At the time of the release, winds are out of
the east at about 6 miles per hour, measured at a height of 3 meters. One-third of the sky is covered by
clouds, the humidity is about 80% and the air temperature is 72° F. There is no low-level inversion.
The land between the accident site and the intersection of Gallerher Road with Lee Highway is flat with no
obstructions. Two workmen repairing potholes at this intersection are overcome by fumes and treated at a
local hospital for chlorine gas inhalation. To what approximate concentration of chlorine might the
workmen have been exposed? You'll evaluate this scenario first by using ALOHA to obtain a source
strength estimate and a threat zone plot, and then by displaying the threat zones on a MARPLOT map in
order to obtain a concentration estimate for the location where the workmen were injured.
Choosing a location and a chemical
1.
Start ALOHA, or, if ALOHA is already running, select New from the File menu to begin a new
scenario (you will be asked whether you wish to save a file of your previous work).
2.
Read the list of ALOHA's limitations (click
3.
Select Location from the SiteData menu. A Location Information dialog box appears with a list of
the names of cities included in ALOHA's location library.
4.
Manassas, Virginia, is not a location in ALOHA's library, so you'll need to add it. Click Add. A
Location Input dialog box appears.
5.
Manassas, Virginia, is a city in the
United States, located at 38°50' N and
77°30' W, and with an elevation of 200
feet. Type "MANASSAS" in the
location name box. Select the In U.S.
option. Type "200" in the elevation box
and select ft. Type "38" in the latitude
degree box and "50" in the latitude
minute box. Select N. Type "77" in the
longitude degree box and "30" in the
longitude minute box. Select W. Scroll
through the list of states and territories
until you see Virginia. (You can also
click anywhere within the list, then type
"v" to quickly move to that letter's
location in the list). Click on Virginia.
Click OK. ALOHA's list of locations
will reappear.
to see more details), then click OK.
85
Chapter 3: Examples
6.
Click on MANASSAS, VIRGINIA to highlight it, then click Select.
In this example, you will not modify the default building type settings because you are only interested in
outdoor concentrations.
7.
Select Date & Time from the SiteData menu. A Date and Time Options dialog box appears.
8.
The release occurs at 3 p.m. (1500 in 24-hour time) on June 4, 2006. Select the Set a constant time
option. Enter the month, day, year, hour, and minute for this scenario (press Tab to move from one
box to the next). Click OK.
86
Chapter 3: Examples
9.
To choose the chemical that is being
released—chlorine—select Chemical
from the SetUp menu. A Chemical
Information dialog box appears with a
list of the chemicals in ALOHA's
chemical library.
10. Check to be sure that Pure Chemicals is
selected at the top of the window (this
should be the default). Find CHLORINE
in the list (quickly type the characters
"ch" to locate chlorine more rapidly in
the list), click on this name, then click
Select.
Entering weather information
Now that you've selected the location, time, and chemical, you must provide information about weather
conditions and ground roughness.
1.
In the SetUp menu, point to Atmospheric, then select User Input. The first Atmospheric Options
dialog box appears.
2.
The wind is travelling from the east at a
speed of 6 miles per hour. Type "6" in
the wind speed box, then select mph.
Type "E" in the wind direction box.
3.
The wind conditions were measured at
a height of 3 meters. Type "3" in the
measurement height value box, and
select meters.
4.
The area between the accident site and
the injured workmen is flat and free of
obstacles, so select the Open Country
ground roughness option.
5.
The sky is one-third covered. Under
Select Cloud Cover, choose the fourth
option from the left (the option between
the partly cloudy and clear options).
Notice that ALOHA has filled in a
value of 3. Click OK. The second
Atmospheric Options dialog box
appears.
87
Chapter 3: Examples
6.
The air temperature is 72°F. Type
"72" in the air temperature box,
then select F.
7.
ALOHA uses the wind speed,
cloud cover, and date and time
information that you've entered to
automatically select atmospheric
Stability Class C.
8.
There is no low-level inversion.
Check to be sure that No Inversion
is selected.
9.
The relative humidity is about 80
percent. Type "80" in the humidity
value box. Click OK.
The information that you have entered into ALOHA appears in the Text Summary. Review the Text
Summary to be sure you have entered all of the data correctly.
Describing the release
Now you're ready to enter information about the release itself—that is, to "set the source"—for this release.
This is a release from three cylindrical tanks, but you don't have all the information that you would need to
model the release with ALOHA's Tank source option. You can model this release as a Direct source,
however.
1.
In the SetUp menu, point to Source, then select Direct. A Direct Source dialog box appears.
88
Chapter 3: Examples
2.
Three 150-pound chlorine cylinders that were in the truck bed are damaged during the collision and
simultaneously release their contents. Select pounds as your units of source strength. This is an
instantaneous release, so select Instantaneous source. Because the chlorine is released
simultaneously, you can model the release from all three tanks as a single release. Type "450" into
the amount box. The truck bed is roughly at ground level, so type "0" in the source height box. Click
OK.
3.
ALOHA will alert you that the chemical may flash-boil and/or escape as a two-phase flow.
Click Help to view background information about flash-boiling and two-phase flow. ALOHA
recognizes that because the boiling point of chlorine is well below air temperature, the chlorine may
have been stored as a liquefied gas. If so, it may flash-boil when released through a hole in a tank.
During flash-boiling, much of the stored liquid would turn instantly to vapor, so that a mixture of
liquid droplets and vapor (a "two-phase flow") would be released to the atmosphere. ALOHA's
Tank source release calculations account for these processes, but the Direct source option does not.
Since you don't have the necessary information to run the Tank option, you'll use the Direct source
calculations as the best approximation that you can make, recognizing that ALOHA will treat this
release as a steady flow of gas from the tank instead of a time-dependent release (a release where
rate varies over time). Click OK.
89
Chapter 3: Examples
The source strength information that you have entered into ALOHA and the results of ALOHA's
computations appear in the Text Summary.
Choosing LOCs and creating a threat zone plot
Now that you've entered all of the release information, you can display the results of ALOHA's threat zone
calculations.
1.
Choose Threat Zone from the Display menu. A Toxic Level of Concern dialog box appears.
2.
ALOHA uses 60-minute AEGLs (Acute Exposure Guideline Levels) as the default Levels of
Concern (LOCs) for chlorine. Keep the default LOCs and check that Show confidence lines only
for the longest threat zone has been selected. Click OK. ALOHA will display a threat zone plot
for this chlorine release.
90
Chapter 3: Examples
Check the Text Summary to see the lengths of the three threat zones. For example, ALOHA expects the red
threat zone, which exceeds the AEGL-3 (20 ppm) value, to extend at least 1,484 yards downwind.
91
Chapter 3: Examples
Using MARPLOT
Now you are ready to plot ALOHA's threat zone estimates on a map of the area in MARPLOT, and to
obtain a concentration estimate for the workmen's location.
1.
Select Go to Map from the MARPLOT submenu under ALOHA's Sharing menu to start
MARPLOT.
2.
If this is the first time you've used MARPLOT, a dialog box may appear directing you to browse to
the location of your MARPLOT application. Once MARPLOT is located, ALOHA will
automatically open MARPLOT. Click OK on the opening screen. If this is the first time you’ve
used MARPLOT, the Prince William County, VA, map should automatically be displayed. If it is
not, then select Go to View from MARPLOT's View menu. A Go to View dialog box appears.
3.
Click to highlight <entire map> Prince William County, VA, then click Go to View.
92
Chapter 3: Examples
The Prince William County map will then be displayed.
4.
Now you'll search on the map for the location where the accident occurred. Choose Search from the
List menu. A Search Criteria dialog box appears.
93
Chapter 3: Examples
5.
The workmen are working at the intersection of Gallerher Road with Lee Highway. To search for
Gallerher Road, type "GALL" in the box next to the search "have names that start with..." box.
Make sure that Individual Layer has been selected in the menu just below the "Layer(s) to search:"
heading, then select Roads from the pulldown menu below that. Check to be sure that Maps in
View is selected in the menu below the "Map(s) to search:" heading. Click Search. A Search
Collection dialog box appears.
6.
The search collection includes three roads. Click once on Gallerher Rd to highlight it, then click
Intersections. An Intersections dialog box appears.
94
Chapter 3: Examples
7.
There are five intersections along Gallerher Road. Click to highlight Lee Hwy in the list, then click
Show on Map & Zoom.
A map similar to the one below appears. Lee Hwy crosses the map as a straight line from the lower left to
the upper right of the map. The Norfolk Southern Railway crosses the map horizontally, and intersects with
Lee Hwy near the right side of the map. (Your map may look different than this one, depending on the
display settings you have choosen.)
Location of
workmen
Location
of release
95
Chapter 3: Examples
8.
In this example, the chlorine is released at the point where the Norfolk Southern Railway line
crosses Lee Highway. To indicate this location, choose the arrow tool
from MARPLOT's tool
palette, then click once at this intersection. MARPLOT will place a visible crosshair mark, or "click
point," at this location.
9.
In MARPLOT's Sharing menu, select the ALOHA submenu, then click Set Source Point.
ALOHA's threat zone estimates will automatically be drawn on the map.
Note: The colors of the threat zones may differ in older versions of MARPLOT.
96
Chapter 3: Examples
10. Now you want to estimate the concentration level where the workers were exposed (at the
intersection of Gallerher Road and Lee Highway). Find the intersection (this is just outside of the
red threat zone). Select the arrow tool in the tool palette, then click on this location.
11. In MARPLOT's Sharing menu, select the ALOHA submenu, then click Set Threat Point. The
ALOHA window will come to the front and it will display a Concentration at Point graph for this
location (threat at point). Review the graph and the Text Summary. ALOHA estimated that the
workmen were exposed to an outdoor concentration above the AEGL-2 level for roughly three
minutes. Note: Your graph may differ slightly from the one below if you click on a slightly
different point on the map when setting your threat point.
Don't be concerned if the numbers that you see on your screen differ slightly from those shown in the Text
Summary. ALOHA's estimates are affected by exactly where on the map you click. The purpose of running
this scenario in ALOHA and MARPLOT was to get an estimate of the concentration of chlorine to which
the workmen were exposed.
97
Chapter 3: Examples
ALOHA was designed to give you "ballpark" estimates of source strength and dispersion. It cannot give
you completely accurate predictions for a real release, because no model can account for every uncertainty.
For example, ALOHA predicted that the workmen were exposed to a concentration of 11.7 ppm of
chlorine for only a few minutes. However, if the wind shifted during the course of the release, the
concentration at the workmen's location could have been higher or lower than ALOHA's estimate. If you
were to respond to a real event similar to this example, you might wish to obtain values for the tank's
dimensions, the size and location of the hole, and other information that you'd need to run ALOHA's Tank
source option, which takes time-dependent release rates into account.
12. When you've finished this example problem, simply choose Exit (in Windows) or Quit (on a
Macintosh) from MARPLOT's File menu. ALOHA's threat zones will then be deleted from the
map.
98
Reference
Refer to this chapter for detailed explanations of ALOHA program operations, features,
and menu items. The sections of this chapter correspond to ALOHA's menus.
4
File menu
New
Choose New to clear all information about a scenario from
ALOHA before beginning a new scenario.When you choose this
menu item, you have the option of saving your old scenario
before clearing ALOHA.
Open
Choose Open to open a previously saved ALOHA file.
Whenever you open a saved file within ALOHA, you can
choose between two modes: Response Mode or Planning
Mode.
Response Mode. Choose this mode when you open a saved file in order to use ALOHA during a real
emergency. As ALOHA opens the file, it will restore the information contained in the file that is expected
to stay the same from day to day. This information includes location, chemical of concern, and the
dimensions of existing storage vessels and containment areas. You'll need to enter information specific to
your incident, including current weather conditions and the circumstances of the release (these could
include, for example, the dimensions and location of a hole in a tank, or the area of a puddle of spilled
liquid).
Planning Mode. Choose this mode when you want to look at a saved scenario again—with all of the
same input values as at the time it was saved. If you were using the computer's clock to set the time,
ALOHA will use the time when the file was saved as the constant time. If you were using a portable
weather monitoring station (SAM), the most recent transmission will be entered into ALOHA as userentered atmospheric data.
Saved files created from the current version of ALOHA are cross-platform: you can open a save file
created in Microsoft Windows on a Macintosh computer, and vice versa.
99
Chapter 4: Reference
Close
Choose Close to close ALOHA's front window. However, you cannot close the Text Summary window.
Save and Save As
Choose Save or Save As when you want to save the results of your work in a data file.
Do this if you wish (a) to prepare in advance for an incident response by creating a set of saved ALOHA
files or (b) to be able to rerun a scenario in the future. If you modified property information about a
selected chemical while setting up a scenario, you can save this information in a saved file without making
a permanent change to the chemical library. When you open and use a saved file in ALOHA in planning
mode, all the information in the file will be restored. When you open and use a saved file in ALOHA in
response mode, you'll still need to enter information specific to a particular release, such as weather
conditions and the amount of material released, before you can obtain a source strength estimate or threat
zone plot.
Print, Print All, and Print or Page Setup
Choose Print to print the contents of the front ALOHA window. Choose Print All to print the contents of
all active ALOHA windows. Choose Print Setup in Windows (or Page Setup on a Macintosh) to choose
the printer and other print options.
Quit or Exit
Choose Quit (on a Macintosh) or Exit (in Windows) to exit ALOHA. To save the scenario you have been
working with, select Save or Save As from the File menu before exiting from the program.
Edit menu
Copy
Choose Copy to copy pictures or selected text from the front
window to the clipboard. You can then paste copied items into a
word processing or graphics application.
The Undo, Cut, Paste, and Clear menu items are not available
in ALOHA.
100
Chapter 4: Reference
SiteData menu
The SiteData menu is the first menu in ALOHA that you use to enter information about a release scenario.
Use the three items in this menu to enter information about:
• The geographic location of the chemical release;
• The type of buildings in the area downwind of a toxic
chemical release; and
• The date and time of the release.
Location
Choose this item to specify the geographical location of a release. ALOHA uses the latitude, longitude,
elevation, and time zone of the location of a chemical release in some of its computations. This
information, for many cities and towns where ALOHA users reside, is already included in ALOHA's
location library (CityLib). You can add descriptions of other locations. ALOHA uses location information
to estimate:
• Sun angle (ALOHA uses latitude, longitude, and time of day for this calculation); and
• Atmospheric pressure (determined by the location's elevation).
The angle of the sun is important when a chemical has formed a puddle on the ground that is evaporating.
ALOHA calculates the amount of energy coming into the puddle from the atmosphere and from the
ground. For example, if the sun is high in the sky (around noon), the amount of energy coming into the
puddle is greater than it would be in the early morning or late afternoon, when the sun is lower. The more
energy coming in, the higher the evaporation rate.
Selecting a location. To specify the location where a release is occurring, select Location from the
SiteData menu. You'll see a scrolling, alphabetical list of cities (mostly U.S. cities and towns). Scroll
through the list (to speed your search, type the first one or two letters of the city name), click on the city
name, then click Select.
101
Chapter 4: Reference
Adding, modifying, and deleting location information
You can add a new city or other geographic location to ALOHA's library of
cities (CityLib). You can add both U.S. and non-U.S. locations to the library.
For a location outside of the U.S., you must manually change the time setting
whenever time at the location switches between daylight savings and standard
time.
Be as accurate as you can when entering information about a location; ALOHA
uses your values for elevation, latitude, and longitude to calculate solar radiation
and air pressure. However, small errors in location information don't affect the
accuracy of ALOHA's predictions. An estimate is accurate enough if it is within
a degree or so in latitude and longitude and a few hundred feet in elevation of
the actual site.
Adding information about a U.S. city. Choose Location from the SiteData menu to access the list
of locations. Click Add. In the dialog box that appears, type the location's name, approximate latitude and
longitude, and elevation, then click on the name of its state or territory in the scrolling list of U.S. states
and territories on the right side of the window (click anywhere within the list, then type the first letter of
the state or territory name to quickly move to that letter's location in the list). ALOHA checks that the
information you have entered is within the range of reasonable values for the state or territory that you
select. (If you have entered a value that is not in this range, ALOHA will tell you which value is out of
range; you must correct your value before continuing.) Click OK.
102
Chapter 4: Reference
Unless the location is in a state with multiple time zones,
ALOHA automatically recognizes the location's time
zone, and also adjusts time of day for daylight savings
when necessary. ALOHA "knows" which states are
located in each U.S. time zone. However, 11 U.S. states
extend across more than one time zone. When you add a
new city in any of these states to ALOHA's city library,
you may need to indicate the time zone in which the city
is located, if it is close to a boundary between time
zones. If the city is not located near a time zone
boundary, ALOHA will not display this dialog box. States with multiple time zones are: Idaho, Indiana,
Kansas, Kentucky, Michigan, Nebraska, North Dakota, Oregon, South Dakota, Tennessee, and Texas.
Once you've clicked OK, the name of the new location should appear highlighted in the location list. To
save your information and select the location from the list, click Select. If you click Cancel now, the
information about the location that you just entered will not be added to the location library, and the city
name will be removed from the list.
Adding a location outside the U.S. Choose Location from the SiteData menu to access the list of
locations. Click Add. In the dialog box that appears, type in the name of the location. Don't include its
country name (you'll be asked for that later). Select Not in U.S. Type the location's approximate elevation,
latitude, and longitude, then click OK.
Next, you'll see the Foreign Location Input dialog box. Type the country name, then the number of hours
that local standard time at the location differs from Greenwich Mean Time (GMT). This time offset value
should be positive if the location is in the western hemisphere (North and South America), and negative if
it's in the eastern hemisphere (Europe, Africa, Asia, and Australia).
103
Chapter 4: Reference
Click the appropriate button to indicate whether standard
or daylight savings time is currently in effect at this
location. ALOHA automatically switches the time
setting for U.S. cities from Standard to Daylight Savings
Time (using the date on your computer's clock), but it
does not automatically make this change for locations
outside the U.S. Be sure to change the time setting
manually whenever time at a non-U.S. location switches
between daylight savings and standard time. Once you
have entered all necessary information about a new
location, click OK. Click Select to add the location to the
library. Click Cancel only if you decide not to add the location to the library.
Modifying a location. You can modify the description of a city or other location in the city library. You
can modify the location name, its approximate latitude and longitude, its average elevation above sea level,
the state, territory, or country where it exists, the local time setting, and the GMT offset if it's a non-U.S.
location. To change information that you've already entered for a location, choose Location from the
SiteData menu to access the list of locations. Click on its name in the location list, then click Modify. You
will see the information about that location that is currently in the location library. Delete the information
that you wish to change, then type in the new value. Click OK.
Deleting a location. To remove a location from the list, choose Location from the SiteData menu to
access the list of locations. Click on its name in the location list, then click Delete. Click Cancel to avoid
deleting the location; click OK to delete the location from the list.
If you accidentally click OK to delete the wrong city, once you've returned to the Location dialog box,
click Cancel. If instead you click Select to close this dialog box, the city will be deleted.
Building Type
For toxic gas dispersion scenarios, ALOHA can estimate
the pollutant gas concentration within buildings downwind
of a chemical release. (Note: This setting cannot be used
in fire and explosion scenarios.) You first must specify the
building type of concern, which could be either the type of
building that is most common in the area downwind of the
release point, or the type that you are most concerned
about. Indicate whether the building is single- or doublestoried or is an enclosed office building. You also must
indicate whether it is relatively sheltered or unsheltered
from the wind by trees, buildings, or other obstacles to the
wind. ALOHA expects pollutant concentrations to build up
faster within single-storied rather than double-storied
buildings and faster within unsheltered rather than sheltered buildings.
104
Chapter 4: Reference
To estimate indoor pollutant concentration, ALOHA first estimates the building's air exchange rate—that
is, the number of times per hour that the volume of air within the building is completely replaced by new
outdoor air when doors and windows are closed. This rate is less than 1.0 if it takes more than an hour to
completely change the air within the building. You also can choose to enter a value for air exchange rate,
rather than specifying a building type, if you have this information. To estimate infiltration rate into a
building, ALOHA assumes that all doors and windows are closed.
Whether you specify building type to be (a) a single- or double-storied building or (b) an enclosed office
building makes a big difference in how ALOHA chooses an exchange rate value.
For single- and double-storied buildings, ALOHA accounts for the effects of wind speed and temperature
to compute air exchange rate. ALOHA expects a building's air exchange rate to increase if the wind speed
increases, because a faster wind exerts more force to push air through the small openings in a building's
walls. The degree of difference between indoor and outdoor air temperature also affects ALOHA's air
exchange rate estimate (ALOHA assumes the temperature within the building to be 68°F, or 20°C). The
greater the temperature difference, the higher the air exchange rate, regardless of whether the air within the
building is warmer or cooler than the outside air (this is because air masses of different temperatures have
different pressures, and pressure differences stimulate air movement). The higher a building's air exchange
rate, the faster the concentration of a toxic gas is predicted to rise within the building. To estimate
exchange rate, ALOHA assumes that single- and double-storied buildings are about as leaky as typical
North American houses that have been studied by researchers (Wilson 1987).
For enclosed office buildings, ALOHA uses a constant air exchange rate of 0.5, regardless of wind speed
and air temperature. This is because the environment within a large, modern, enclosed building is
controlled and kept nearly constant, regardless of weather conditions, using a heating, ventilating, and airconditioning (HVAC) system. The American Society of Heating, Refrigerating, and Air-Conditioning
Engineers (ASHRAE) recommends that air exchange rates for buildings be kept within the range of 0.5 to
1.0 complete changes per hour to maintain air quality.
If you know a building's air exchange rate (the number of times per hour that the total air volume within
the building is replaced), type this number next to No. of air changes. You also can adjust this number to
compare the effects of different air exchange rates on indoor infiltration of a pollutant gas.
When you specify single- or double-storied building type, you also must indicate whether the building is
sheltered or unsheltered. Pollutant gases infiltrate more slowly into sheltered than unsheltered buildings of
the same type. Below is a decision aid for choosing between sheltered or unsheltered surroundings.
Surrounding Features
Selection Choice
If the buildings are surrounded by trees, bushes, or other buildings in
the direction from which the chemical cloud will be coming.
Sheltered surroundings
If the buildings are in an open space, with nothing near them.
Unsheltered surroundings
If you don't know about the surrounding features, or if you are unsure.
Unsheltered surroundings
105
Chapter 4: Reference
Date & Time
Choose Date & Time from the SiteData menu
to specify the date and time for ALOHA to use
as the starting time of your scenario. You may
choose either to enter a specific time, or to have
ALOHA take the time from your computer's
internal clock. When you use the internal
clock option, you will need to set your
computer's clock to the local time where a
release has occurred. For example, if you are
running ALOHA in Seattle for an incident
taking place in Miami, set your clock to the
current Miami time.
The starting time of a scenario affects ALOHA's calculations in two ways: (1) ALOHA uses the scenario
start time to determine whether it is night or day when choosing a stability class, and (2) ALOHA uses the
position of the sun at the scenario start time to estimate incoming solar radiation. Solar radiation can be an
important influence on puddle evaporation. Whenever you use your computer's clock, the scenario starting
time will be updated to the current time whenever you enter atmospheric information, change location, or
choose the Date &Time menu item.
To specify date and time, choose Date & Time from the SiteData menu, then select either:
• Use internal clock to use your computer's internal clock; or
• Set a constant time to set a specific time when you want a scenario to begin. Type in the month, day,
year, hour, and minute. This option is useful for contingency planning or training exercises because
you can set up scenarios to run at different times of the day and/or year (and therefore under different
atmospheric conditions).
ALOHA uses the 24-hour time system, in
which time of day is indicated by four digits.
The first two digits indicate the hour (00 to 23)
and the last two indicate the number of minutes
past that hour (00 to 59). Each day begins at
midnight, 0000, and the last minute of each day
is 2359. Under this system, 6:00 a.m. is 0600,
and 2:30 p.m. is 1430.
106
Chapter 4: Reference
SetUp menu
As you enter information into ALOHA about a release scenario, you'll move on to the SetUp menu after
you've completed your work with the SiteData menu. Choose items from this menu to select a chemical
from ALOHA's chemical library, describe weather conditions, and explain how the chemical is escaping
from containment. You also can specify how you want ALOHA to predict the dispersion of the pollutant
cloud in the atmosphere for dispersion scenarios—that is, for toxic gas dispersions, flash fire flammable
areas, and vapor cloud explosions.
Select items from the SetUp menu in descending order as you describe a scenario: first select Chemical,
then Atmospheric, and finally Source.
Chemical
Select Chemical from the SetUp menu to access a list of the chemicals included in ALOHA's chemical
library (ChemLib). Physical property and toxicological data for about 1,000 pure chemicals are included in
the library. ALOHA uses the information in the library to predict how a particular chemical may escape
from a container and disperse in the atmosphere. The library does not include any chemical mixtures,
chemicals with unstable structures, or chemicals of such low volatility and toxicity that they don't represent
air dispersion hazards (that is, solids or liquids with very low vapor pressures that present a toxic hazard
only when present at high concentrations). The library does contain a small number of solutions. You can
add pure chemicals to the library or delete chemicals from it, and you can modify information about the
physical properties of any pure chemical.
Note: You cannot view or modify properties that were obtained from the proprietary Design
Institute for Physical Properties Data (DIPPR®) database.
107
Chapter 4: Reference
Selecting a pure chemical. To choose a pure chemical, locate its name in the chemical list. Chemical
names appear in alphabetical order in the list, with prefixes such as "n-," "tert-," or "1, 2-" ignored. To
navigate quickly through the list, type the first one or two letters of the name, then scroll up or down until
you see the name of the chemical that you wish to select. Double-click on the name (or click once on the
name, then click Select) to select it. Once you have selected a chemical, you'll see some of its most
important properties listed in the Text Summary window.
Selecting a chemical solution. To choose one of ALOHA's chemical solutions, click on the
Solutions option to display the list of solutions. Double-click on the name (or click once on the name, then
click Select) to select it. Type in its percent by weight in the Solution Strength box (ALOHA shows you
the allowable range). Once you have selected a solution, you'll see some of its most important properties
listed in the Text Summary window.
108
Chapter 4: Reference
Reactive chemicals. ALOHA assumes that the molecules in the released chemical do not react with
each other or with the gases that make up the atmosphere, such as oxygen and water vapor. That is,
ALOHA assumes that the molecules that disperse in the atmosphere are the same molecules that originally
escaped from a container. However, some chemicals react with dry or humid air, water, other chemicals, or
even themselves. Because of these chemical reactions, some or all of the molecules that disperse
downwind sometimes may be very different from the molecules that originally escaped from containment.
They may be heavier or lighter than the original molecules, may have different properties and behave
differently in the atmosphere, and may be more or less toxic than the original chemical. In some cases,
these differences may be substantial enough to make ALOHA's predictions inaccurate.
ALOHA will allow you to model any reactive chemical as a
non-reactive chemical, but it will warn you that it may not
be able to produce accurate results. When you select an airor water-reactive chemical, ALOHA will alert you that the
chemical is reactive, and will describe the type of reaction
and reaction products to expect.
If you choose to model the chemical, ALOHA will place a
similar warning in the Text Summary window as an
additional reminder.
Chemical information in the Text Summary window. Review the Text Summary for information
about the chemical you've selected. For example, values for some properties of benzene appear in the Text
Summary below. You can see, for example, that benzene's boiling point is well above most ambient
temperatures, so you can expect to encounter it as a liquid.
Some items in the chemical information summary need some explanation:
• Ambient Saturation Concentration. Within a confined space such as a cargo hold or warehouse, at a
given temperature, the ambient saturation concentration is the maximum concentration in the air that
the vapor evaporating from a liquid pool may reach. If a chemical has a high ambient saturation
concentration, it has a strong ability to displace air, and the concentration of the chemical's vapor in
the air above the liquid will be high. If it's low, the vapor concentration will be low. This property
changes with temperature—a liquid at a higher temperature will have a higher ambient saturation
concentration. The ambient saturation concentration of a gas is 1,000,000 parts per million, or 100
percent. ALOHA displays ambient saturation concentration because it can sometimes be useful to
you to compare it with a threshold concentration of concern, such as a Lower Explosive Limit.
109
Chapter 4: Reference
• Level of Concern (LOC). An LOC is a threshold value of a hazard (toxicity, flammability, thermal
radiation, or overpressure); the LOC is usually the value above which a threat to people or property
may exist. A list of standard LOCs will appear on the Text Summary screen, including: AEGLs,
ERPGs, TEELs, IDLH, UEL, and LEL. For toxicity, there are often several different standard LOC
values to choose from—AEGLs, ERPGs, TEELs, and IDLH all relate to toxic thresholds. ALOHA
uses the following hierarchy to choose a default toxic LOC: (1) 60-minute AEGL, (2) ERPG, (3)
TEEL, and (4) IDLH. For AEGLs, ERPGs, and TEELs, the rank number increases with the
hazard level, so that AEGL-3 is more hazardous than AEGL-1. Typically, the "-3" values are
used for the red threat zones which represent the worst hazard.
ALOHA sometimes places notes in the Text Summary:
• When you select a chemical such as benzene which has been identified as a confirmed, potential, or
suspected carcinogen, a notation (Carcinogenic risk - see CAMEO) will appear in the Text
Summary.
• When you select a chemical for which little information is available, ALOHA displays the following
note in the Text Summary: Not enough chemical data to use Heavy Gas option. This note alerts
you that, although the chemical's molecular weight is heavier than 29 kilograms per kilomole (the
average molecular weight of air) so that it may behave like a heavy gas, ALOHA will have to use
Gaussian dispersion calculations to model its behavior in the atmosphere, unless you add additional
property information.
Chemical data. The chemical library includes information about the physical properties of each
ALOHA chemical. It also includes—depending on the chemical—values for AEGLs (60-minute), ERPGs,
TEELs, IDLH, UEL, and LEL. You can add your own toxic LOC for any pure chemical to ALOHA's
chemical library. ALOHA will automatically use your LOC as the default for the selected chemical.
The ALOHA library contains information from two sources. When available, physical property values
were obtained from a chemical database compiled by the Design Institute for Physical Properties Data
(DIPPR), known as the DIPPR database. Other values were obtained from the chemical database included
in the Computer-Aided Management of Emergency Operations (CAMEO®) hazardous chemical
information system (developed by the U.S. Environmental Protection Agency and the National Oceanic
and Atmospheric Administration).
110
Chapter 4: Reference
ALOHA uses information from the library to model the physical behavior of a chemical that you have
selected. For example, once ALOHA knows the temperature within a tank, it can use library information to
estimate the vapor pressure, density, and other properties of the chemical stored in the tank.
You only need the name of a chemical and its molecular weight to run the simplest ALOHA scenario—a
toxic gas dispersion using a Direct source and the Gaussian dispersion model. However, ALOHA's more
complex calculations require information about other properties of the chemical. Check Table 4-1 for the
property information needed for each source and dispersion model option. (You do not need to add a value
for liquid density because ALOHA estimates this property from other information that you enter.)
Table 4-1: Properties needed to use each ALOHA source and dispersion option.
Direct
Puddle
Tank
Pipeline
Heavy
Gas
Gaussian
Chemical Name
+
+
+
+
+
+
Molecular Weight
+
+
+
+
+
+
Normal Boiling Point
<>
+
+
+
+
Critical Pressure
<>
+
+
+
[]
Critical Temperature
<>
+
+
+
[]
Property
Gas Density
+
Normal Freezing Point
+
+
Gas Heat Capacity
+
+
Liquid Heat Capacity
+
+
F
F
Heat of Combustion
F
+
+
F
Vapor Pressure
**
+ Required property value.
<> Required if release rate or amount is expressed in volume units (gallons, liters, or cubic meters).
[] Required if vapor pressure is not entered.
F Required if the chemical is flammable and you want to run scenarios where it may catch on fire.
** Required if critical temperature and critical pressure are not entered.
Note: For some fire and explosion scenarios you may also have to enter explosive limits. To
calculate the flammable areas of a flash fire, ALOHA must have the LEL (Lower Explosive
Level). To model a vapor cloud explosion, ALOHA must have the LEL and the UEL (Upper
Explosive Limit).
111
Chapter 4: Reference
Adding a chemical to the library. Select Chemical from the SetUp menu, then click Add on the
dialog box that appears. Type the chemical's name in the Chemical Name box. Next, type its molecular
weight (in grams per mole) in the molecular weight box. Then add values for all other properties that you'll
need to run ALOHA (see Table 4-1 on page 111 to see which properties are necessary for ALOHA's
various source and dispersion options). To enter additional property values, click on the name of each
property in the scrolling list of property names (or click Next Field until the property name is highlighted).
Type property values in the appropriate boxes, then choose units.
You must add a reference temperature and pressure for all properties that change their values when
temperature and/or pressure changes. For example, if you were adding a fictional chemical (such as methyl
ethyl death) into the chemical library, you would need to know that it has a gas heat capacity of 1,500
joules per kilogram Kelvin at a temperature of 320 Kelvin and a pressure of 101,325 pascals.
Once you have entered all information about a new chemical, click OK to permanently add your new
chemical to ALOHA's chemical library. The Chemical Information dialog box appears with the newly
updated list of chemicals in ALOHA's chemical library. Click Select to select the chemical that you've just
added. Click Cancel if you decide not to permanently add the chemical to the library.
Modifying a chemical entry in the library. To modify information about a chemical, first select
Chemical from the SetUp menu. Select the name of the chemical in the dialog box that appears, then click
Modify. Click on the name of each property that you are adding or modifying in the scrolling list (or click
Next Field until you've highlighted the property name). Type property values in the corresponding boxes,
or modify existing values, and modify units if necessary.
112
Chapter 4: Reference
You'll find that you cannot modify all property values for ALOHA chemicals already included in the
library. Values that you cannot modify, and their units, appear dimmed. These are values that ALOHA
calculates internally, using either values for the chemical's critical properties (molecular weight, boiling
point, critical temperature, and critical pressure) or information from the DIPPR database. If you would
like to use your own property values for an ALOHA chemical, add the chemical using a slightly different
name—such as CHLORINE-2—and type your own values in the new property boxes.
When you're finished making your modifications, click OK to add them permanently to ALOHA's library.
To avoid making permanent changes to the library, click Cancel.
Deleting a chemical from the library. To permanently delete a chemical from ALOHA's library,
select Chemical from the SetUp menu. Select the name of the chemical in the dialog box that appears,
then click Delete. Click OK to delete the chemical permanently from ALOHA's library. Click Cancel to
avoid deleting the chemical.
Atmospheric
You can enter information about current weather conditions into ALOHA either manually (by typing in
values for wind speed, air temperature, and other weather factors) or by connecting your computer to a
portable meteorological station, called a SAM (Station for Atmospheric Measurement). ALOHA uses the
information that you enter to account for the main processes that affect the results of the various scenarios.
These include atmospheric heating and mechanical stirring, low-level inversions, wind speed and
direction, ground roughness, and air temperature.
User Input
In the SetUp menu, point to Atmospheric, then select User Input. The first of two Atmospheric Options
dialog boxes appears. In the dialog boxes, manually enter the following information about conditions in the
vicinity of an accidental release: wind speed and direction, wind measurement height, ground roughness,
cloud cover, air temperature, atmospheric stability class, inversion height (if a low-level inversion exists),
and relative humidity.
ALOHA assumes that weather conditions remain constant throughout the incident area. For this reason,
use values that best represent conditions throughout this area. If weather conditions change, update this
information and run ALOHA again.
113
Chapter 4: Reference
Wind speed, direction, and measurement height. ALOHA needs to know the wind speed and
direction, as well as the height at which the wind speed and direction are measured. The wind direction
determines which way a pollutant cloud will drift. The wind speed affects not only how fast the cloud will
travel downwind, but also how much it moves about in the crosswind and vertical directions. When the
wind is slower, the cloud meanders more.
Use Table 4-2 when you need to estimate the wind speed from environmental clues. For example, when the
wind speed is 12 knots, you would expect to see small branches of trees and bushes moving slightly, and
dust and loose paper blowing along the ground.
Table 4-2: Estimating wind speed from environmental clues.
(One knot equals 1.15 miles per hour.)
Meters per
Second
Knots
International
Description
Specifications
<1
<1
Calm
Calm; smoke rises vertically
<1-2
1-3
Light air
Direction of wind shown by smoke drift, but not
by wind vanes
2-3
4-6
Light breeze
Wind felt on face; leaves rustle; ordinary vane
moved by wind
4-5
7-10
Gentle breeze
Leaves and small twigs in constant motion; wind
extends light flag
5-8
11-16
Moderate
Raises dust, loose paper; small branches are
moved
8-11
17-21
Fresh
Small trees in leaf begin to sway; crested wavelets
form on inland water
11-14
22-27
Strong
Large branches in motion; whistling heard in
telegraph wires; umbrellas used with difficulty
14-17
28-33
Near gale
Whole trees in motion; inconvenience felt
walking against wind
17-21
34-40
Gale
Breaks twigs off trees; generally impedes
progress
114
Chapter 4: Reference
Enter the direction from which the wind is blowing, using either units of degrees true, or one- to threeletter directional terms. For example, you can indicate that the wind is blowing from the north-northeast by
entering either NNE or 22.5 degrees.
Table 4-3: Wind directions expressed in letter terms and corresponding degrees.
Directional Letter(s)
Degrees
Directional Letter(s)
Degrees
N
0 or 360
S
180
NNE
22.5
SSW
202.5
NE
45
SW
225
ENE
67.5
WSW
247.5
E
90
W
270
ESE
112.5
WNW
292.5
SE
135
NW
315
SSE
157.5
NNW
337.5
Finally, enter the height at which wind speed and direction
have been measured. ALOHA accounts for the way in which
wind speed changes with height in a pattern called a wind
profile. Close to the ground, friction slows the wind. At higher
elevations, the wind speed is faster. High enough up (typically
a few hundred yards or meters, or higher), the wind speed
reaches a maximum, because it is no longer affected by
friction (as shown at the right in a wind profile).
Indicate the wind measurement height in the "Measurement
height above ground" section. Choose one of the following
three options to indicate the height:
• SAMs typically are mounted on a 3-meter (9.8-foot)
stand, so the wind reference height for readings from a
SAM is likely to be 3 meters. Select the icon on the left (the one with the close-up view of a person)
to indicate a height of 3 meters—this is ALOHA's default measurement height.
• The National Weather Service usually reports wind speed measured at a height of 10 meters (about
33 feet). Select the icon on the right (the one of the tower) to indicate a height of 10 meters.
• If you know that your wind speed value is being measured at a different height, type that height in
the measurement height box, then choose units.
115
Chapter 4: Reference
Ground roughness. The degree of atmospheric turbulence influences how quickly a pollutant cloud
moving downwind will mix with the air around it and be diluted below your LOC. Friction between the
ground and air passing over it is one cause of atmospheric turbulence. Because the air nearest the ground is
slowed the most, eddies develop, just as they would in the water next to a riverbank. The rougher the
ground surface, the greater the ground roughness, and the greater the turbulence that develops. Ground
roughness is determined by number and size of roughness elements present in an area. A roughness
element is a surface feature that disturbs the flow of air, but is small relative to the size of a pollutant cloud.
To indicate the ground roughness downwind of a release, either (a) choose one of three roughness
classes—Open Country (low roughness, low turbulence), Urban or Forest (high roughness, high
turbulence), or Open Water (very low roughness, very low turbulence)—or (b) enter your own value for
roughness length, Zo, a term used by meteorologists to describe ground roughness.
• Click Open Country if there are only small or few roughness elements in the area. Examples
include farmland, grassland, and large parking lots.
• Click Urban or Forest if the area has many friction-generating roughness elements, such as trees or
small buildings. Examples include residential housing developments, industrial areas, and forests.
• Click Open Water if a pollutant cloud is travelling over a large body of water (relative to size of the
cloud). Examples include oceans and large lakes. Except when the wind speed is very high, Open
Water is the lowest ground roughness category in ALOHA.
A chemical cloud generally travels farther across open country and open water than over an urban area or a
forest. This is because it encounters fewer, smaller roughness elements to create turbulence.
116
Chapter 4: Reference
Choose the dominant category of ground roughness
in the area where the pollutant cloud may travel. For
example, if 70% of the area is urban or forest and
30% is open country, click Urban or Forest. If you
can't easily determine the dominant category, run
ALOHA once with each category selected to get an
idea of the possible range in threat zone size.
If something, such as a tall building, is very large
relative to the pollutant cloud, it is likely to be an
obstacle that diverts a pollutant cloud rather than a
roughness element that generates turbulence. For
example, in a downtown area on a Sunday morning
with no cars on the streets, the best ground
roughness category for a small release may be Open
Country. In this case, the buildings are obstacles and
the street is the roughness the pollutant cloud will
experience.
How does ALOHA interpret your Zo value?
It depends on whether it uses Gaussian or
heavy gas dispersion calculations. When
ALOHA makes its heavy gas calculations, it
uses the Zo value that you entered, unless it is
greater than 10 cm. In such cases, ALOHA
assumes Zo to be 10 cm. When ALOHA makes
its Gaussian calculations, if you enter a Zo
value of 20 cm or more, ALOHA uses the
Urban or Forest roughness parameters. If you
enter a Zo value of less than 20 cm, ALOHA
uses the Open Country roughness parameters.
If you prefer to type in a value for roughness length (Zo), you can refer to Table 4-4. Note that roughness
length is not a simple function of the height of the roughness elements in an area.
Table 4-4: Surface Roughness (Zo) Equivalences from Brutsaert 1982.
Zo (cm)
Surface description
Mud flats, ice
0.001
Smooth tarmac (airport runway)
0.002
Large water surfaces (average)
0.01- 0.06
Grass (lawn to 1 cm high)
0.1
Grass (airport)
0.45
Grass (prairie)
0.64
Grass (artificial, 7.5 cm high)
1
Grass (thick to 10 cm high)
2.3
Grass (thin to 50 cm)
5
Wheat stubble plain (18 cm)
2.44
Grass (with bushes, some trees)
4
1-2 m high vegetation
20
Trees (10-15 m high)
40-70
Savannah scrub (trees, grass, sand)
40
Large city (Tokyo)
165
117
Chapter 4: Reference
Cloud cover. ALOHA needs a value for cloud cover, the proportion of the sky that is covered by clouds,
in order to estimate the amount of incoming solar radiation at the time of a chemical release. Solar
radiation is an important influence on puddle evaporation rate because heat from the sun can warm a
puddle and speed up evaporation. In the U.S., cloud cover is usually measured in tenths: when the sky is
completely covered by clouds, cloud cover is 10 tenths; when half the sky is covered by clouds, it is 5
tenths; when the sky is completely clear, it is 0 tenths. These values are represented by the complete cover,
partly cloudy, and clear icons, respectively.
To select cloud cover, either:
• Click the button corresponding to either 0, 3, 5, 7, or 10 tenths; or
• Type a whole number between 0 and 10 in the box for cloud cover value in tenths (for example, type
"6" if cloud cover is 6 tenths).
Air temperature. ALOHA requires a value for the air temperature in the vicinity of a chemical release.
You can enter a value in either degrees Fahrenheit (°F) or degrees Celsius (°C). Air temperature influences
ALOHA's estimate of the evaporation rate from a puddle surface (the higher the air temperature, the more
the puddle is warmed by the air above it, the higher the liquid's vapor pressure is, and the faster the
substance evaporates). Because several physical processes involved in a chemical release are affected by
temperature, use as accurate a value as possible.
118
Chapter 4: Reference
Stability class. The atmosphere may be more or less turbulent at any given time, depending on the
amount of incoming solar radiation as well as other factors. Meteorologists have defined six atmospheric
stability classes, each representing a different degree of turbulence in the atmosphere. When moderate to
strong incoming solar radiation heats air near the ground, causing it to rise and generating large eddies, the
atmosphere is considered unstable (relatively turbulent). Unstable conditions are associated with
atmospheric stability classes A and B. When solar radiation is relatively weak or absent, air near the
surface has a reduced tendency to rise, and less turbulence develops. In this case, the atmosphere is
considered stable (less turbulent), the wind is weak, and the stability class would be E or F. Stability
classes D and C represent conditions of more neutral stability (moderate turbulence). Neutral conditions
are associated with relatively strong wind speeds and moderate solar radiation.
Figure 4-1. Effects of solar radiation on atmospheric stability.
Stability class has a big effect on ALOHA's prediction of the threat zone size for dispersion scenarios.
Under unstable conditions, a dispersing gas mixes rapidly with the air around it. ALOHA expects that the
cloud will not extend as far downwind as it would under more stable conditions, because the pollutant is
soon diluted to below your LOC, and ALOHA will display a shorter threat zone than it would for more
stable conditions.
Figure 4-2. Stability class and mixing of a pollutant cloud.
119
Chapter 4: Reference
ALOHA uses Table 4-5 (based on Turner 1994) to automatically choose the stability class that best
represents the weather conditions that you enter. If more than one stability class fits the conditions that you
indicate, ALOHA selects the most stable of these classes. For example, if both A and B fit the conditions,
ALOHA selects B. However, you can click A if you believe this class to be more appropriate. Buttons for
stability classes inappropriate for those conditions are unavailable for selection.
Table 4-5: Stability class and wind speed.
Wind Speed*
Day: Incoming Solar Radiation
Night: Cloud Cover
Meters per
second
Knots
Miles per
hour
Strong**
Moderate
Slight***
>50%
<50%
<2
<3.9
<4.5
A
A-B
B
E
F
2-3
3.9-5.8
4.5-6.7
A-B
B
C
E
F
3-5
5.8-9.7
6.7-11.2
B
B-C
C
D
E
5-6
9.7-11.7
11.2-13.4
C
C-D
D
D
D
>6
>11.7
>13.4
C
D
D
D
D
Note: Stability is D for completely overcast conditions during day or night.
Note: This table is for releases over land. If the release occurs over water, the stability class will be either D or E.
*
Wind reference height is 10 meters.
**
"Strong" solar radiation corresponds to clear skies with the sun high in the sky (solar angle greater than 60 degrees).
+
"Slight" solar radiation corresponds to clear skies with the sun low in the sky (solar angle between 15 and 35 degrees).
You can click Override to change ALOHA's stability class choice and choose any of the six stability
classes. You should do this, however, only if you are sure that a special circumstance causes the best choice
for stability class to be different from the choice made by ALOHA. For example, the atmosphere above a
snow-covered landscape is typically more stable than would be expected for a given combination of wind
speed, cloud cover, and time of day. If you are modeling a release over snow-covered ground, then you
might want to choose a more stable class than ALOHA chooses for you. Additionally, some organizations
may require users to model all scenarios using a single scenario class—in which case, they usually pick
stability class F to model the worst-case scenarios.
Inversion height. An inversion is an atmospheric condition in which an unstable layer of air near the
ground lies beneath a very stable layer of air above. The height of the abrupt change of atmospheric
stability is called the inversion height. An inversion can trap pollutant gases below the inversion height,
causing ground-level concentrations of a pollutant to reach higher levels than would otherwise be
expected.
120
Chapter 4: Reference
The type of inversion of concern for dispersion modeling is a low-level inversion that could trap a pollutant
cloud near the ground. Sea smoke and low ground fog are good indicators of the presence of this type of
inversion. A low-level inversion is different from the inversion that causes smog. That type of inversion is
typically thousands of feet above the ground—much too high to affect a dispersing gas cloud.
ALOHA's Gaussian dispersion model
accounts for inversions, but the heavy gas
model does not, even when you've indicated
that an inversion exists. A low-level
inversion may significantly increase groundlevel concentrations of a neutrally buoyant
gas. Molecules of such gases disperse
upwards and outwards as they are transported
downwind, and are reflected from an
inversion layer back towards the ground. A
heavy gas cloud, in contrast, remains close to
the ground as it disperses, and is not normally
affected even by low-level inversions.
If a low-level inversion is present, type in the height of the inversion layer and select units. If there is no
low-level inversion, be sure that No Inversion is selected.
Humidity. Relative humidity is the ratio of the amount of water vapor that the air contains to the
maximum amount of water vapor that the air could hold at the ambient temperature and pressure. Relative
humidity is expressed as a percentage. When relative humidity is 50 percent, the air contains one-half as
much water vapor as it could potentially hold. The warmer the air, the greater its capacity to contain water
vapor. Cold air may contain little water vapor but have a high relative humidity because the amount of
water vapor in the air is near the air's relatively low maximum capacity.
ALOHA uses the relative humidity value to:
• Estimate the atmospheric transmissivity value;
• Estimate the rate of evaporation from a puddle; and
• Make heavy gas dispersion computations.
Atmospheric transmissivity is a measure of how much thermal radiation from a fire is absorbed and
scattered by the water vapor and other atmospheric components. ALOHA estimates the transmissivity
from relative humidity and uses the transmissivity when estimating thermal radiation threat zones. Lower
relative humidly values will result in longer threat zone estimates. Response techniques, like a water-fog,
artificially increase water vapor and decrease the transmissivity in the incident area to try to reduce the
thermal radiation hazard.
Enter a relative humidity value in either of two ways: either select the option that best represents your
relative humidity value, or type the relative humidity (as a percentage) in the humidity value box.
121
Chapter 4: Reference
SAM Station
Although you can enter all weather information into ALOHA manually, ALOHA can also accept data from
an external portable meteorological monitoring station, called a Station for Atmospheric Measurement
(SAM). SAM data can be transmitted to ALOHA by either radio frequency or a cable. ALOHA can use
SAM measurements of wind speed and direction, standard deviation of the wind direction, and air
temperature. (ALOHA cannot accept relative humidity readings made by a SAM; you'll need to enter these
measurements into ALOHA manually.)
Choosing a SAM. A few companies manufacture SAMs for use with ALOHA. Before purchasing a
SAM to use with ALOHA, check with its manufacturer to be sure that it is designed to work with ALOHA,
and to learn how to connect the station to your computer so that it can transmit data to ALOHA. Before
using a station not specifically designed for ALOHA, be sure that it transmits data in a format that ALOHA
can accept (this format is described below).
Transmitting SAM data to ALOHA. For use with ALOHA, a SAM must meet several design criteria.
The SAM should sample wind speed and direction at a rate of at least one sample every 2 seconds. It must
transmit wind speed and direction and air temperature readings every 30 seconds. (Because air temperature
does not change quickly over time, it may be sampled less frequently than wind speed and direction.) Data
transmitted from your SAM to ALOHA must be in the following free-field, comma-delimited format
(ALOHA displays unprocessed SAM data in the same format):
<cr> <lf> ID,VS,WD,SD,TA,SP,DI,TI,B,CHK,
Table 4-6: Translation key for SAM data codes.
Code
Required Information
<cr>
Carriage return (ASCII character code 13)
<lf>
Line feed (ASCII character code 10)
ID
Station identification number
VS
Vector mean wind speed, averaged over 5 minutes in meters per second
WD
Mean wind direction, averaged over 5 minutes, in degrees true
SD
Standard deviation of the wind direction ("sigma theta") in degrees
TA
Mean air temperature, averaged over 5 minutes, in degrees Celsius
SP
Instantaneous wind speed in meters per second
DI
Instantaneous wind direction in degrees true
TI
Instantaneous air temperature in degrees Celsius
B
Instantaneous SAM battery voltage in volts
CHK
Checksum, computed by summing the ASCII values of all preceding
characters in the data line, including the carriage return and line feed
characters and the preceding comma
122
Chapter 4: Reference
During the first five minutes of data collection, the SAM should transmit "-1" as its value for SD (sigma
theta). Although a station ID number must be included in each data transmission, ALOHA does not use
this value. Wind direction should be the direction from which the wind is blowing.
If the SAM checks automatically for invalid data and finds an erroneous value, it should transmit a data
line that includes, in place of that value, either no value (the data line would then contain two successive
commas with no value between them: ",,") or a word such as "error" as its value for an invalid datum (the
data line would then contain ",error,"). Because ALOHA does not check SAM data transmissions for
unacceptable values, the SAM should not transmit a numeric value such as "999" in place of an erroneous
value.
Using a SAM during an incident. When you use a SAM with ALOHA during incident response,
place your SAM so that its readings will be as representative as possible of the whole area through which
the pollutant cloud may travel. Be sure to place it at a location such as an open field, parking lot, or
clearing where the wind is not affected by obstacles, such as trees, buildings, or hills. Avoid placing a SAM
in the lee of buildings, vehicles, or other obstacles to wind flow, where wind speed and direction may be
very different from the rest of the area. Place the SAM upwind of the source of a pollutant gas release so
that you will not need to decontaminate it after use.
Choosing the correct port for receiving SAM data. SAM data is transmitted to ALOHA through
your computer's serial port. On a Windows computer, this is the COM1, COM2, COM3, or COM4 port.
On a Macintosh computer, this is the modem port.
Choosing a radio frequency. If you are using ALOHA within the U.S., you'll find that the rules for
assigning and using radio frequencies are specific to your locality; no national guidelines exist. Check with
the manufacturer of your SAM, or with the government authority in your area that assigns radio
frequencies, if you want to be assigned a frequency that you can use to transmit SAM information to
ALOHA. This authority could be a local, state, or federal agency, depending on your location.
Setting up ALOHA when you're using a SAM. Check to be sure that your SAM is properly
connected, configured, and turned on (you'll need to check with the manufacturer if you have questions on
how to do this). Next, in the SetUp menu, point to Atmospheric, then select SAM Station. If you are
using a Windows computer, you will be asked to indicate the port to which the SAM station is connected.
123
Chapter 4: Reference
You'll need to enter some information about environmental conditions:
• If a low-level inversion is present, type in the height of the inversion layer and select appropriate
units. If there is no inversion, be sure that No Inversion is selected.
• Indicate the ground roughness in the area downwind of the release point.
• Specify the station height (the height of the instruments above the ground).
• Indicate the amount of cloud cover, in tenths.
• Enter a value for relative humidity (as a percentage). Even if your SAM can measure relative
humidity, you'll need to enter this value manually into ALOHA.
ALOHA will not allow you to choose items from the Source menu until the SAM has been collecting data
for at least 5 minutes.
SAM Options. After you click OK on the Cloud Cover and Humidity
dialog box, you'll see a new menu, SAM Options, to the right of ALOHA's
Sharing menu. You need not choose any items in this menu to use a SAM
with ALOHA. Instead, use them when you want to view or archive weather
information collected by the SAM.
124
Chapter 4: Reference
Archive Data. Choose Archive Data from the SAM Options menu to create a tab-delimited text file
containing data from the SAM along with dates and times of transmissions. You will be asked to name the
archive file. Type in a file name, then click Save. ALOHA then creates this file for you as it receives SAM
data, adding data each time it receives new information from the SAM.
Data are arranged in columns and rows within the archive file. The first three lines in the file contain an
explanation of units, and the date and time when the data were collected. The fourth line contains the
column headings, as follows:
Hr Min Sec ID mW/S mDir SigTh mTemp iW/S iDir iTemp BatVol,
Table 4-7: Translation key for SAM column headings.
Column Heading
Hr
Required Information
Hours
Min
Minutes
Sec
Seconds
ID
Station identification number
mW/S
Vector mean wind speed in meters per second
mDir
Mean direction in degrees true
SigTh
Sigma theta (standard deviation of the wind direction) in degrees
mTemp
Mean air temperature in degrees Celsius
iW/S
Instantaneous wind speed in meters per second
iDir
Instantaneous direction in degrees true
iTemp
Instantaneous temperature in degrees Celsius
BatVol
Instantaneous SAM battery voltage in volts
ALOHA does not place a limit on the amount of data you may archive. To stop data archiving, choose End
Archive Data from the SAM Options menu. You can then open and view the file in any word-processing
program. To view the most recently transmitted SAM data without interrupting data archiving, select either
Raw Data or Processed Data from the SAM Options menu.
125
Chapter 4: Reference
Raw Data. Choose Raw Data from the SAM Options menu to examine the most recently transmitted,
unprocessed SAM data. ALOHA displays unprocessed SAM data in the same format in which it is
transmitted from the SAM.
Processed Data. Choose Processed Data from the SAM Options menu to view processed weather
data, including the most recently transmitted instantaneous readings as well as 5-minute running averaged
values, in a new Processed SAM Data window. If ALOHA cannot interpret and process the data that it
receives from your SAM, it will display an error message in this window.
Several items in the Processed SAM Data window need
explanation:
• The Meteorological Station ID is the identification code of
the SAM that is sending data to your computer (this ID is
assigned by the manufacturer).
• Wind Direction (in the case of both instantaneous and
average values) is the direction from which the wind is
blowing.
• The standard deviation of the wind direction is called Sigma
Theta. This value reflects the amount of fluctuation in the
wind direction during the last 5 minutes. The more the wind
switches direction, the larger is the value of sigma theta.
ALOHA uses sigma theta, along with wind speed, cloud cover, and time and date, to choose the
stability class for your scenario. The SAM transmits a value of -1.00 for sigma theta until it has been
transmitting for 5 minutes.
• Battery Voltage is the remaining voltage of the battery on your SAM.
126
Chapter 4: Reference
Wind Rose. Choose Wind Rose from the SAM Options menu to view a diagram showing the 10 most
recent average wind speed and direction values received from the SAM station. Each line on the diagram
represents a 5-minute running average speed and direction. Each line is drawn from the center out towards
the direction to which the wind is blowing. Line length indicates wind speed.
The two concentric circles on the diagram represent
wind speeds of 10 and 20 miles per hour (mph), if
you have indicated a preference for English units, or
5 and 10 meters per second (m/s), if you indicated a
preference for metric units (indicate your units
preference by choosing Display Options from the
Display menu). The length of each line on the
diagram indicates wind speed. For example, a line
drawn from the center of the diagram out to the 10
miles per hour circle represents an average wind
speed of 10 miles per hour.
The most recent average wind value is represented
on the diagram by a darker line. The most recent 5minute average wind speed is displayed below the
diagram.
Monitoring a long-term release. You may sometimes use a SAM with ALOHA to monitor weather
conditions during a long-term release (such as a slowly evaporating pool of toxic liquid) or a potential
spill. When you do so, bear in mind that although your SAM is providing current weather information,
other ALOHA inputs may become out-of-date during the course of the response as conditions change. At
least once each hour, assess whether you need to adjust important model inputs that could affect ALOHA's
estimates of source strength or cloud dispersion. For example, you may respond to a release of a liquid
from a storage tank, originally running the release in ALOHA as a Tank source. After an hour or so, the
tank may stop leaking, but an evaporating puddle may have formed. In such a case, rerun the scenario in
ALOHA as a Puddle source. Later, if the puddle becomes smaller in size as it evaporates or because it is
being cleaned up or diked, enter new values for its area and its volume, mass, or depth, then rerun your
Puddle scenario.
Whenever you use a SAM with ALOHA, make sure that your computer's internal clock is set to the time
and date of the release that you are modeling. ALOHA uses time and date, along with wind speed and
cloud cover, to choose stability class.
127
Chapter 4: Reference
Source
In an ALOHA scenario, the source is the vessel or pool from which a hazardous chemical is released. The
source strength is the rate at which the chemical enters the atmosphere or the burn rate, depending on the
scenario. A chemical may escape very quickly (so that source strength is high), as when a pressurized
container is ruptured, or more slowly over a longer period of time (so that source strength is low), as when
a puddle evaporates. ALOHA can model four types of sources.
• Direct: chemical release directly into the atmosphere (bypassing ALOHA's source calculations).
• Puddle: chemical has formed a liquid pool.
• Tank: chemical is escaping from a storage tank.
• Gas Pipeline: chemical is escaping from a ruptured gas pipeline.
For each source, ALOHA will allow you to choose the scenario(s) you wish to model. The number of
available scenarios depends on the source and the chemical released. Table 4-8 lists the scenarios that
ALOHA can model for each source.
Table 4-8: ALOHA sources and scenarios.
Source
Toxic Scenarios
Fire Scenarios
Explosion Scenarios
Direct Release
Toxic Vapor Cloud
Flammable Area (Flash Fire)
Vapor Cloud Explosion
Toxic Vapor Cloud
Flammable Area (Flash Fire)
Vapor Cloud Explosion
Direct
Puddle
Evaporating
Burning (Pool Fire)
Pool Fire
Tank
Not Burning
Toxic Vapor Cloud
Flammable Area (Flash Fire)
Burning
Jet Fire or Pool Fire
BLEVE
BLEVE (Fireball and Pool Fire)
Vapor Cloud Explosion
Gas Pipeline
Not Burning
Toxic Vapor Cloud
Flammable Area (Flash Fire)
Burning (Jet Fire)
Jet Fire
128
Vapor Cloud Explosion
Chapter 4: Reference
When you choose one of the four source
options from the SetUp menu, you will need
to enter information about the release on a
series of dialog boxes. Once you click OK on
the last dialog box, ALOHA will make its
source strength calculations, and you'll be
able to review the results of the source
calculations—predicted release duration,
release rates, total amount released, and other
information—in a text summary and on a
source strength graph.
Note: ALOHA does not display a source strength graph for BLEVE scenarios.
ALOHA's duration limits. ALOHA places minimum and maximum limits on the duration of any
release. ALOHA expects a release into the atmosphere to continue for at least 1 minute. If ALOHA
calculates a source strength (evaporation rate or burn rate) for your current scenario, it estimates it for no
more than 1 hour after a release begins. If ALOHA predicts that a release would last longer than 1 hour,
you will see a message on the Text Summary window: Release Duration: ALOHA limited the duration
to 1 hour.
One important reason for the 1-hour duration limit is that the wind changes speed and switches direction
frequently. Researchers have found that atmospheric conditions change enough to affect ALOHA's
predictions on a time scale of about 1 hour. Bear in mind that ALOHA assumes that weather conditions
remain constant for the duration of any release. Another reason is that the calculation methods ALOHA
uses are based on the results of experiments. In these experiments, gases were released into the atmosphere
for time periods from 10 minutes to 1 hour; the researchers then observed how the dispersing gases
behaved.
This 1-hour limit represents the maximum possible release duration. If you are responding to an incident,
check whether release conditions change substantially before an hour has passed. For example, if an
evaporating puddle has substantially changed in area, or the wind speed or direction has changed, enter
new atmospheric and source information into ALOHA and obtain an updated threat zone plot.
Release duration for vapor cloud explosions
For vapor cloud explosions, the release can be modeled for less than 1 minute.
However, if your chosen release duration—that is, the time until the cloud
ignites—is less than one minute, you will not get the maximum possible
explosion. Additionally, if you are modelling an instantaneous release from a
Direct source, not all of the chemical will be released for times less than one
minute because ALOHA models the release as a constant release with a one
minute duration.
129
Chapter 4: Reference
ALOHA reports release rate. When you use ALOHA's Puddle, Tank, or Gas Pipeline source options,
ALOHA reports the release rate in the Text Summary as the Maximum Average Sustained Release Rate
or as the Maximum Burn Rate. ALOHA computes release rate from a puddle, tank, or gas pipeline as a
series of hundreds of brief timesteps. Each timestep represents a rate of release that is maintained for a
particular amount of time (timesteps are short if release rate is changing rapidly, and longer if release rate
is nearly constant).
For releases into the atmosphere, ALOHA averages this series of many release rates into between one and
five release rates that are each for a time period of at least 1 minute. For burn rates, ALOHA averages over
timesteps lasting 20 seconds. (Choose Source Strength from the Display menu to see a graph of these
averaged rate(s) for a particular scenario.) To save calculation time, ALOHA uses these averaged release
rate(s) to make its threat zone estimates. The Maximum Average Sustained Release Rate (or the Maximum
Burn Rate, if applicable) is the highest of these averaged release rates. It is represented by the tallest
timestep on the Source Strength graph.
When a gas or liquid escapes from a pressurized container, the release rate may drop very quickly
(sometimes within seconds) as the pressure within the container drops. In such cases, the initial release rate
may be much higher than the maximum average release rate.
When you're using a SAM. ALOHA recomputes its threat zone and threat at a point estimates each
time it receives new weather data from a SAM. However, it does not recompute source strength when it
receives new data. During prolonged incidents, because time of day and weather conditions may have
important effects on source strength (especially from an evaporating puddle), be sure to periodically update
ALOHA's source strength calculations.
Direct source
In the SetUp menu, point to Source, then select Direct. Choose the Direct source option if you know the
amount of pollutant gas released directly (or evaporated), or if you have too little information about a
release to use another source option but feel that you can make a "ballpark estimate" of the total amount of
chemical released into the atmosphere. Note: In ALOHA, "direct" refers to the fact that the scenario
information is directly entered by the user, bypassing ALOHA's source calculations. Whenever you
must estimate a value, try entering the largest likely value as well the smallest likely value into ALOHA,
then check to see how the size of the threat zone changes when your value changes. If you have enough
information about the release, you may wish to choose the Puddle, Tank, or Gas Pipeline source option
instead so that ALOHA will make the estimates for you.
130
Chapter 4: Reference
To model a direct release of gas into the atmosphere, you will need to estimate the amount of pollutant
directly entering the atmosphere as a gas. This could be the amount of pollutant vapor evaporating from a
puddle or the amount of gas escaping from a gas pipeline or tank rupture. It would not be the amount of
liquid spilling from a tank and forming a puddle, because the liquid is not directly entering the atmosphere.
In this case, you need to estimate the rate at which the gas enters the atmosphere (i.e., evaporation rate)
rather than the spill rate.
Accurately estimating the rate of release
When modeling a Direct source, you can only enter a constant rate for your
chosen duration. However, in most releases the rate will change over time. For
example, if a chemical escapes from a pressurized tank or gas pipeline, its
release rate may decline rapidly as storage pressure drops. If possible, you
should choose either the Tank or Gas Pipeline source option. Both account for
rate changes over time and will result in more accurate threat zone estimates.
Once you have entered all of the required information, you can set your LOCs and view the threat zones
for the vapor cloud. For flammable chemicals you can view the (1) toxic area, (2) flammable area, and (3)
blast area (if a vapor cloud explosion occurs). For nonflammable chemicals you can view the toxic threat
zones.
Direct release of gas into the atmosphere. Begin by selecting the source strength units. You can
use units of either weight or volume. (If you use volume units, you must complete a second dialog box
where you will specify whether the chemical is a gas or liquid and enter its storage temperature. ALOHA
then converts volume to mass to make its source strength computations.) Next, indicate whether the release
is instantaneous (lasting one minute) or continuous (lasting more than one minute). If a release is
continuous, type its duration in minutes. (ALOHA has a maximum duration of 60 minutes.)
131
Chapter 4: Reference
Type either the amount of pollutant entering the atmosphere (for an instantaneous release) or the rate of
entry (for a continuous release). For a continuous source, this value must be expressed as a rate, such as
pounds per minute. This is the rate at which a chemical is being released into the atmosphere (i.e., the rate
at which a gas is escaping from a tank or the evaporation rate of a puddle). If you must estimate or guess
the amount or rate, try entering the largest likely amount (or rate) as well the smallest likely amount (or
rate) into ALOHA, then check to see how the size of the threat zone changes when your amount estimate
changes.
Source height. The source height is the height of the location of a chemical release above the ground.
Source height is zero if the chemical is released at ground level. Enter a source height greater than zero to
model a release from an elevated source only if ALOHA is making Gaussian dispersion calculations.
ALOHA does not account for any substantial upward or downward movement of a gas cloud in the
atmosphere. Enter a non-zero source height only when the released chemical disperses passively away
from the release point, without rising substantially upwards (as a gas emitted from a heated or burning
source may do) or slumping downward towards the ground (as a heavy gas may do).
If you enter a source height greater than zero, but your selected chemical is a heavy gas, ALOHA will alert
you that it must use a source height of zero to model the release. Although the source height that you
entered appears in the Text Summary, ALOHA assumes the height to be zero when making its dispersion
computations.
If you are not sure of the source height, bear in mind that a ground-level release is a more conservative
choice than an elevated release: ALOHA will predict a longer threat zone for a ground-level release.
Puddle Source
In the SetUp menu, point to Source, then select Puddle. Choose the Puddle source option to model a
liquid that has already spilled and formed a puddle on the ground (i.e., it is not changing in area). ALOHA
can model the puddle either as an evaporating puddle or, if the chemical is flammable, as a pool fire.
Note: If liquid is continuing to leak from a tank and spill into a puddle (so that the puddle's area and
volume are increasing) choose the Tank source option instead.
132
Chapter 4: Reference
Type of Puddle. When you use the Puddle source with a flammable chemical, ALOHA will ask you to
specify whether you want to model an evaporating puddle or burning puddle (pool fire) before you can
enter any details about the puddle.
• Evaporating Puddle: As a flammable puddle evaporates, it forms a vapor cloud above the puddle.
ALOHA can predict three possible hazardous outcomes: the toxic area of the vapor cloud, the
flammable area of the vapor cloud (where igniting the cloud would cause a flash fire), and the
overpressure (blast force) from a vapor cloud explosion.
• Burning Puddle (Pool Fire): When a flammable puddle catches on fire, it is called a pool fire.
Potential hazards associated with a pool fire include thermal radiation, smoke, and toxic byproducts
from the fire. ALOHA can help you model the thermal radiation hazard.
When you use the Puddle source with a nonflammable chemical, ALOHA will automatically select the
evaporating puddle option and the toxic gas output (the only options for a nonflammable chemical).
Evaporating Puddle. To model evaporation from a puddle, ALOHA accounts for the effects of wind
speed, atmospheric turbulence, air temperature and pressure, viscosity, and other properties of the spilled
chemical. It accounts for the effects on puddle temperature of solar heating, evaporative cooling, and
several other ways in which heat is exchanged between a puddle and its environment. For example, on a
sunny day, ALOHA will expect heat energy from the sun to warm the puddle. It expects puddle
temperature to directly influence evaporation rate so that the higher the puddle temperature, the faster the
evaporation rate. ALOHA accounts for changes in puddle temperature and, therefore, evaporation rate
over time.
133
Chapter 4: Reference
What if the weather conditions change?
Bear in mind that wind speed and air temperature
are important influences on evaporation rate. If
these conditions change after ALOHA has
estimated an evaporation rate, enter the new values
and rerun ALOHA.
The types of heat transfer that ALOHA expects to affect puddle temperature fall into the following three
categories:
• Incoming solar radiation (affected by location, time and date, and cloud cover);
• Heat transfer with the air (affected by air temperature, humidity, and initial puddle temperature); and
• Heat transfer with the ground (affected by ground temperature, ground type, and initial puddle
temperature).
Figure 4-3. Factors influencing ALOHA's puddle evaporation estimates.
ALOHA can model evaporation from puddles that are either boiling or that are cooler than the boiling
point of the liquid that they contain. It cannot estimate sublimation rate for a frozen puddle (a frozen
substance sublimes when it passes directly to the gas state without first becoming liquid).
134
Chapter 4: Reference
Area and Volume. Enter the puddle area or, if the puddle is roughly circular, type its approximate
diameter and ALOHA will estimate its area. If the puddle is roughly square or rectangular in shape, you
must enter its area (equal to its length multiplied by its width). If the length and width are in units of feet,
then the area will be in units of square feet; if the diameter or the length and width are in meters, the area
will be in square meters, and so on. Puddle area strongly influences the evaporation rate (or burn rate if the
puddle is burning). When all else is equal, the larger the area of a puddle, the higher is its evaporation rate
or burn rate.
Next, enter the amount of chemical contained in the
puddle. Specify the amount of liquid contained in the
puddle by selecting:
• Volume of puddle;
• Average depth of puddle; or
• Mass of puddle.
Type a volume, depth, or mass value in the
corresponding box and select the appropriate units.
Ground Type and Initial Temperatures. Next, for evaporating puddles, indicate the type of ground
beneath the puddle. Ground type influences the amount of heat energy transferred from the ground to an
evaporating puddle. Ground type is most important when the spilled liquid is cryogenic. Cryogenic
liquids, such as refrigerated propane, are liquids that are stored at very low temperatures because they boil
at temperatures well below ambient. As it estimates heat transfer from ground to puddle, ALOHA assumes
that the ground does not absorb any of the spilled chemical, and that none of the chemical spilled onto
water dissolves into the water.
ALOHA offers you five choices for ground type:
• Default soil: unwetted soil not covered by
rock or concrete.
• Concrete: concrete, cement, asphalt, or
otherwise paved surfaces.
• Sandy dry soil.
• Moist sandy soil.
• Water: lakes, oceans, or other large bodies of
water.
Note: For ground type, descriptive terms like dry
or moist refer to the state of the ground before
the chemical was spilled—that is, the amount of
water in the soil.
135
Chapter 4: Reference
ALOHA expects heat to be transferred most readily from default ground or concrete surfaces into a puddle,
and least readily from sandy ground. The heat transfer from water is generally greater than that of any of
the other ground types.
Next, indicate the ground temperature, which influences the amount of heat transferred between the
ground and the puddle. The warmer the ground, the warmer the puddle and the higher the evaporation rate.
Type in a value for ground temperature, and choose either degrees Fahrenheit or Celsius. If you do not
know the ground temperature, you can choose to estimate that it is about equal to the air temperature. In
this case, click Use air temperature (select this if unknown).
Air and ground temperatures can be very different in some situations, such as in a parking lot on a hot day
late in the afternoon, or on a street during the early morning after a very cold night. Be sure to estimate air
and ground temperatures carefully in such situations.
The last piece of information ALOHA needs is the initial puddle temperature. ALOHA assumes the initial
temperature to be the same throughout the depth and width of the puddle. Indicate that the initial puddle
temperature equals either the ground temperature or the ambient air temperature, or enter a value for the
initial puddle temperature. Click the button that represents your choice. If your value for initial puddle
temperature is above the liquid's normal boiling point, ALOHA will alert you and allow you to set the
initial puddle temperature to the boiling point.
If the puddle is burning, you only need to enter the
initial puddle temperature because ground type and
ground temperature do not affect pool fire
calculations. ALOHA assumes the initial
temperature to be the same throughout the depth
and width of the puddle.
Tank
In the SetUp menu, point to Source, then select Tank. Choose the Tank source option to model releases of
unpressurized liquids, liquefied gases, or pressurized gases from tanks or drums. ALOHA can model leaks
that release the chemical directly into the atmosphere, as well as leaks that form an evaporating puddle. If
the chemical is flammable, ALOHA can also model BLEVEs, pool fires, and jet fires.
136
Chapter 4: Reference
You can choose to model releases from three types of tanks: a cylindrical tank lying on its side, a
cylindrical tank standing on its end, or a spherical tank. ALOHA assumes any tank to be on level ground.
If the tank contains pressurized gas or liquid, ALOHA computes the change over time in pressure and
temperature (as well as liquid volume) inside the tank as it leaks. If the tank contains unpressurized liquid,
ALOHA assumes that gravity will drain the tank and that a puddle will form on the ground below the tank.
ALOHA cannot model a release in which there is both a pre-existing puddle on the ground and liquid
continuing to leak from a tank into the puddle. If you encounter this situation, and the puddle is still
spreading, choose Tank from the Source submenu to model the release as a tank leak. If the puddle has
reached, or is about to reach, its maximum size, choose Puddle from the Source submenu to treat the
release as a pre-existing puddle.
Liquefied gases. Both the liquid and gas phases of a chemical sometimes can escape together from a
ruptured tank as a two-phase flow. Many substances that are gases under normal pressures and
temperatures are stored under high enough pressures to liquefy them. For example, propane is a gas at
normal pressures and temperatures but is often stored under pressure as a liquid. When a rupture or broken
valve causes a sudden pressure loss in a tank of liquefied gas, the liquid boils violently, the tank contents
foam up, and the tank fills with a mixture of gas and fine liquid droplets (called aerosol). When such a twophase mixture escapes from the container, the release rate can be significantly greater than that for a purely
gaseous release. Note: ALOHA does not model the release of a liquid that has an overpressure
applied to it from an inert gas.
When liquefied propane or a similar chemical escapes from storage, it can form a heavy gas cloud. The
cloud is heavy, in part, because it is initially cold and also because it consists of a two-phase mixture. The
tiny aerosol droplets mixed into the cloud act to weigh the cloud down and make it denser, and their
evaporation acts to cool the cloud.
When ALOHA predicts that a liquefied gas will escape as a two-phase flow, it alerts you with a message
on the Text Summary: Note: The chemical escaped as a mixture of gas and aerosol (two phase flow).
When you use ALOHA to model a release from a tank of a liquefied gas such as propane, generally
ALOHA will predict that the substance will escape as a two-phase flow if the tank is pressurized. It treats
ammonia and chlorine as special cases, however, because enough information about these chemicals is
available to permit the use of more refined source strength calculations. When there is only a small amount
of material in a tank, the hole in the tank is small, or the tank pressure is low, ALOHA predicts that these
two chemicals will escape from storage as a pure gas, rather than as a two-phase flow.
137
Chapter 4: Reference
Tank Size and Orientation. To model the release of a liquid or gas from a storage tank, you must
indicate both the size of the tank and its general shape (which affects how it will drain). Choose the most
appropriate of three tank types:
• Horizontal cylinder;
• Vertical (upright) cylinder; or
• Sphere.
Next, enter the tank's dimensions. If it
is a cylinder, enter any two of the
following three values: (a) diameter,
(b) length, or (c) volume. If it is a
sphere, enter either the tank's
diameter or its volume. ALOHA will
compute and display values for the
remaining dimensions. Volume refers
to the total volume of the tank, rather
than the volume of chemical within
the tank.
Chemical State and Temperature. Next you'll need to specify the state and temperature of the
chemical in the tank. How the chemical is stored affects how the chemical may escape from the tank (as a
pure gas, an unpressurized liquid, or a liquefied gas).
Click the button corresponding to one of the following options:
• Tank contains liquid. Choose this option if there is any liquid in the tank, even if it's just a small
amount.
• Tank contains gas only. Choose this option if you know that the tank contains only gas, with no
liquid present.
• Unknown. Choose this option if you don't know the chemical's state.
138
Chapter 4: Reference
Next, to enter the temperature within the tank, either:
• Click Chemical stored at ambient temperature, if the chemical is stored at the temperature of the
surrounding air (you entered the air temperature when you entered atmospheric information), or
• Enter the storage temperature in the tank temperature data field (if the tank is at a different
temperature), and indicate its units.
Whether a liquid is stored in a tank at a temperature above or below its boiling point greatly affects how it
will escape through a tank rupture or leaking valve. If the liquid is stored below its boiling point, it will
flow out of the tank, and form a puddle on the ground. If the liquid is stored above its boiling point, the
pressure within the tank will be greater than atmospheric pressure. When such a tank is punctured, the
liquefied gas contents may escape as a two-phase mixture of gas and aerosol. The rate of release can be
significantly greater than the rate of release of an unpressurized liquid.
Liquid in a tank. Whenever you indicate to ALOHA that a tank contains liquid (by clicking Tank
contains liquid when you are asked to identify chemical state), you will need to identify the amount of
chemical in the tank in any of four ways: mass of chemical, liquid volume, percent full by volume, or
height of liquid level in the tank. Choose to:
• Type the mass of the chemical in the tank (this should be the total mass of the liquid and its vapor in
the tank);
• Type the volume of the liquid in the tank and indicate its units;
• Type your best estimate of the percent of the tank volume that is taken up by liquid as % full by
volume; or
• Use the scroll bar next to the tank diagram to indicate the approximate height of the liquid level in
the tank. Scroll up or down to position the horizontal bar on the diagram to indicate the liquid height.
(If possible, check for a condensation line on the outer tank wall to get an estimate of the liquid level
within the tank.)
139
Chapter 4: Reference
Gas in a tank. Whenever you indicate to ALOHA that a tank contains only gas (by clicking Tank
contains gas only when you are asked to identify chemical state), you will need to type either the tank
pressure or the amount of gas in the tank.
Type a value for either the tank pressure or the amount of gas (either as mass or as volume at the Standard
Temperature and Pressure of 1 atmosphere and 0°C), then select appropriate units. Click OK. If you enter
a value for tank pressure, ALOHA will automatically estimate the mass in the tank. Once you have entered
values for tank size, temperature, and either pressure or amount of chemical, ALOHA will check to be sure
that the chemical is a gas. If the tank temperature is below the chemical's boiling point, or if the tank
pressure is high enough to liquefy the chemical, ALOHA will warn you that your chemical is not a gas. If
this happens, click Cancel to return to the previous dialog box, click Tank contains liquid, then continue.
Chemical of unknown state in a tank. If you are
unsure whether a chemical in a tank is a gas or liquid (and
you clicked Unknown when asked to identify chemical
state), you will need a value for the total mass (weight) of
chemical in the tank in order to run ALOHA. ALOHA uses
this value, along with information about the chemical's
properties and the temperature in the tank, to predict the
chemical's state and the amount of chemical that could be
released. Type in the mass of chemical in the tank, then
select units of pounds, kilograms, or tons.
140
Chapter 4: Reference
Type of Tank Failure. When you use the Tank source with a flammable chemical, ALOHA will ask
you to specify the type of release. Select one of these three options:
• Leaking Tank (Not Burning): If a flammable chemical escapes from a tank and does not
immediately burn, either the chemical will go directly into the air or it may form an evaporating
puddle (depending on the storage conditions). In either case, a flammable vapor cloud will form.
ALOHA can predict three possible hazardous outcomes: the toxic area of the vapor cloud, the
flammable area of the vapor cloud (where igniting the cloud would cause a flash fire), and the
overpressure (blast force) from a vapor cloud explosion.
• Leaking Tank (Burning): When a flammable liquid forms a burning puddle it is called a pool fire.
When a flammable gas or an aerosol (two-phase flow) burns as it sprays from an opening in a tank, it
is called a jet fire. Based on the storage conditions you specified, ALOHA will decide whether to
model the chemical as a pool fire or a jet fire. Potential hazards associated with a pool fire or jet fire
include thermal radiation, smoke, and toxic byproducts from the fire. ALOHA can help you model
the thermal radiation hazard.
• BLEVE (Boiling Liquid Expanding Vapor Explosion): When a tank containing a liquefied gas
fails completely, a BLEVE can occur. Some of the released chemical will burn in a fireball while the
remainder will form a pool fire. The amount of the chemical involved in the fireball and/or the pool
fire will depend on the conditions at the time of release. The primary hazards associated with a
BLEVE are thermal radiation, overpressure, hazardous fragments, smoke, and toxic byproducts from
the fire. ALOHA can help you model the thermal radiation hazard.
When you use the Tank source with a
nonflammable chemical, ALOHA will
automatically select the leaking tank (not
burning) option and the toxic gas output
(the only options for a nonflammable
chemical). Although both flammable and
nonflammable liquefied gases can be
involved in BLEVEs, ALOHA only
models flammable liquid BLEVEs.
If you choose either of the first two
scenarios, you will need to enter
information about the type of leak,
beginning with the Area and Type of Leak
dialog box. If you choose the BLEVE
scenario, you may need to enter
information about the fireball in the
BLEVE Percent Mass in Fireball dialog
box.
141
Chapter 4: Reference
Percent Mass in Fireball. When you model a BLEVE in ALOHA, it is assumed that part, or all, of the
chemical forms a fireball, while the remainder burns as a pool fire. You can choose to either (a) estimate
the percent mass of chemical in the fireball, or (b) enter the tank pressure or temperature and let ALOHA
estimate the percent mass of the fireball.
If you know the tank pressure or temperature at failure, enter either value and let ALOHA calculate the
percentage of mass in the fireball. However, pressure and temperature are often difficult to determine. If
you don't know those values, you can specify the percentage of mass in the fireball.
The percentage mass in the fireball must be greater than the minimum value supplied by ALOHA and no
more than 100%. Choosing 100% will usually give you the worst-case scenario with the largest thermal
radiation hazard. Based on the pressure and temperature of the tank at storage, ALOHA calculates the
minimum amount of mass that would have gone into the fireball if the container failed at the storage
conditions. Note: If all of the mass goes into the fireball at storage conditions, ALOHA will
automatically use 100% and skip this dialog box. ALOHA displays the allowable range above the
percentage mass in fireball value box.
The amount of chemical in the fireball will depend upon the pressure inside the tank when it ruptures. As
the chemical is heated, the internal pressure in the tank increases—the higher the temperature, the higher
the pressure, and the greater the size of the fireball. (Properly functioning relief valves may help limit the
tank pressure and the size of the fireball.)
142
Chapter 4: Reference
Both the nature of the chemical and the tank construction affect the size of the fireball. Tanks holding
liquefied gases are designed to withstand high pressures and therefore pose a greater risk of a BLEVE. For
typical propane tanks, the internal tank pressure under normal storage conditions is already high enough
that 100% of the released chemical would form a fireball; no pool fire would form. While flammable
liquids are typically stored in vessels less capable of withstanding high internal pressures, fireballs have
been generated by the heat-induced rupture of such tanks.
When you model a BLEVE in ALOHA, three times the amount of the flammable chemical that flash-boils
during the BLEVE is assumed to form a fireball, which includes both the chemical that flash-boiled and
the chemical that was sprayed out as an aerosol during the explosion. The remaining liquid forms a pool
fire. When ALOHA models a BLEVE situation including both a fireball and a pool fire, it estimates the
thermal radiation from both fires; it is not necessary to run an additional Pool Fire scenario.
Area and Type of Leak. You must indicate the
shape (circular or rectangular) and size of the
opening in the leaking tank before ALOHA can
calculate the rate of release of the tank's contents.
You also must specify whether the release is
through (a) a simple hole in the tank wall or (b) a
short pipe or broken valve. A hole is any kind of
break in the tank wall, such as a puncture or crack.
The area of an opening is important to ALOHA, but
its shape is used only to compute area. ALOHA
predicts identical release rates through circular and
rectangular openings if they have the same area.
If your scenario is a release of pure gas from the
tank, when you click OK, ALOHA will estimate
the rate of release of gas from the tank. You will see
a summary of the information that you entered, and the source strength results calculated by ALOHA. If at
least some liquid is present in the tank, you will need to enter some more information on the Height of the
Tank Opening dialog box before ALOHA can estimate source strength.
If the chemical is stored as a liquefied gas (a liquid at a temperature above its boiling point), ALOHA may
expect it to escape from the tank under pressure as a two-phase mixture of gas and liquid. In liquefied gas
cases, your choice of opening type can have an important effect on ALOHA's release rate computations.
ALOHA will predict a higher release rate for a two-phase release if you choose the hole option rather than
the short pipe/valve option. Opening type does not make a difference in a pure gas or unpressurized liquid
release case.
143
Chapter 4: Reference
Height of the Tank Opening. If there is liquid in the tank, you must tell ALOHA where the leak
occurs on the tank. Enter a value for the height of the bottom of the leak (whether it is a hole, short pipe, or
valve) above the floor of the tank. ALOHA uses this value to determine whether the leak is above or below
the liquid level. If an unpressurized liquid is stored in the tank and the leak is below the liquid level, the
chemical will spill out and form a puddle on the ground. It will stop spilling once the liquid level falls
below the bottom of the leak. If the leak is above the liquid level and an unpressurized liquid is stored in
the tank, ALOHA will report that no chemical is released. Regardless of the height of the leak, however, if
the stored chemical is stored as a liquefied gas, it will escape through the opening directly into the
atmosphere (without forming a puddle) as a two-phase flow of gas and aerosol (fine liquid droplets).
To indicate the height of the leak above the tank bottom, either:
• Type the height of the leak in distance units;
• Type the leak location as a percentage of the total distance from the bottom of the leak to the top of
the tank (for example, 90% means that the leak is 90% of the way to the top of the tank); or
• Use the scroll bar to the right of the tank diagram to indicate the height of the leak on the tank wall.
If the chemical is an unpressurized liquid, you will need to enter some more information about the puddle
that forms.
Puddle formation. If an unpressurized liquid leaks from a tank, an evaporating puddle may be
formed. ALOHA will ask you for information about the area where the puddle will form. You will need to
enter ground type and ground temperature, just as you would if you had selected the Puddle source option
(however, in a Tank release case, ALOHA computes initial puddle temperature for you). You will also
need to enter the maximum puddle diameter or area.
Ground type influences the amount of heat energy transferred from the ground to an evaporating puddle.
Ground type is most important when the spilled liquid is cryogenic. Cryogenic liquids, such as refrigerated
propane, are liquids that are stored at very low temperatures because they boil at temperatures well below
ambient. As it estimates heat transfer from ground to puddle, ALOHA assumes that the ground does not
absorb any of the spilled chemical, and that none of the chemical spilled onto water dissolves into the
water.
144
Chapter 4: Reference
ALOHA offers you five choices for ground type:
• Default soil: unwetted soil not covered by rock
or concrete.
• Concrete: concrete, cement, asphalt, or
otherwise paved surfaces.
• Sandy dry soil.
• Moist sandy soil.
• Water: lakes, oceans, or other large bodies of
water.
Note: For ground type, descriptive terms like dry or
moist refer to the state of the ground before the
chemical was spilled—that is, the amount of water
in the soil.
ALOHA expects heat to be transferred most readily from default ground or concrete surfaces into a puddle,
and least readily from sandy ground. The heat transfer from water is generally greater than that of any of
the other ground types.
Next, indicate the ground temperature, which influences the amount of heat transferred between the ground
and the puddle. The warmer the ground, the warmer the puddle and the higher the evaporation rate. Type in
a value for ground temperature, and choose either degrees Fahrenheit or Celsius. If you do not know the
ground temperature, you can choose to estimate that it is about equal to the air temperature. In this case,
click Use air temperature (select this if unknown).
Air and ground temperatures can be very different in some situations, such as in a parking lot on a hot day
late in the afternoon, or on a street during the early morning after a very cold night. Be sure to estimate air
and ground temperatures carefully in such situations.
The last piece of information ALOHA needs is the maximum puddle area or diameter. If there are no
barriers to prevent a puddle from spreading, click Unknown. For spills on land, ALOHA will expect the
puddle to spread until it reaches an average depth of 0.5 centimeter (about 0.2 inch) up to a maximum
diameter of 200 meters (220 yards). For spills on water, ALOHA will expect the puddle to spread until it
reaches an average depth of 0.17 centimeter (about 0.07 inch). Unlike spills on land, there is no maximum
diameter for spills on water. If there is a barrier to liquid flow (such as a containment or diked area), then
type the approximate diameter of the barrier or area that it encloses. Select appropriate units, and click OK.
If an unpressurized liquid leaks from a tank and
forms a burning puddle, you only need to enter the
maximum puddle area or diameter because ground
type and ground temperature do not affect pool fire
calculations. Note: ALOHA does not model pool
fires on water.
145
Chapter 4: Reference
Gas Pipeline
In the SetUp menu, point to Source, then select Gas Pipeline. Choose the Gas Pipeline source option to
model the release of a gas from a leaking gas pipeline. (If the chemical is flammable, the release can be
modeled as a jet fire as well.)
You can use ALOHA to model two types of gas pipeline leak scenarios:
• A pipeline connected to a very large (infinite) reservoir, so that gas escapes from the broken end of
the pipeline at a constant rate for an indefinite period of time; or
• A finite length of pipeline that is closed-off at the unbroken end (for example, by a shut-off valve).
Because the pressure within this section of pipe declines as gas is released, release rate drops over
time, and the release continues only until the finite length of pipe is emptied. ALOHA cannot
model gas release from a pipe that has broken in the middle and is leaking from both broken
ends.
Pipe source inputs. To describe a Gas Pipeline release to ALOHA, type the pipe diameter and length,
indicate whether the pipe is connected to a reservoir, indicate whether the inner pipe surface is smooth or
rough, type pipe pressure and temperature, and type the area of the hole (if the pipe is of finite length).
• Pipe diameter and length. Use the inner
diameter of the pipe. The pipe length must be at
least 200 times the diameter of the pipe.
• Pipe connection. Indicate whether the pipe is
connected at its unbroken end to a large
reservoir (infinite tank source), or is closed-off.
• Pipe roughness. Degree of roughness of the
inner surface of the pipe. A smooth pipe would
be, for example, a new metal, glass, or plastic
pipe. A rough pipe would be, for example, a
metal pipe with a rusted inner surface or a pipe
that has been corroded on the inside by the
chemicals it carries. Rough texture causes
turbulence, which reduces the flow rate of the
gas in the pipe. A gas will flow more slowly
through a rough pipe than through a smooth
pipe.
146
Chapter 4: Reference
• Pipe pressure. If the pipeline is connected to
a very large (infinite) reservoir, use the
pressure within the reservoir as your value
for pipe pressure. If gas is escaping from a
finite, closed-off section of pipeline, enter the
pressure within that pipe section.
• Pipe temperature. Indicate the temperature
of the pipe contents in either of two ways: (a)
click Unknown (assume ambient) if you do
not know the temperature (ALOHA will then
use the ambient air temperature), or (b) type
the temperature of the pipe's contents in the
pipe temperature box, then select appropriate
units (either degrees Fahrenheit or Celsius).
• Hole size. If the pipeline is connected to a very large (infinite) reservoir, ALOHA assumes that the
pipe has been completely sheared-off, so that the hole diameter equals the pipe diameter. If only a
closed-off length of the pipeline is leaking, you can choose to (a) allow ALOHA to use the pipe
diameter as its value for the hole diameter, or (b) enter a value for the area of the hole, if the hole is
smaller in area than the pipe diameter.
Source strength information in the Text Summary. Regardless of the source option you choose,
once you have entered all necessary inputs and clicked OK on the last source strength dialog box, ALOHA
estimates source strength. It then displays the source input values you entered and the results of its
calculations in the Text Summary. For example, for non-burning sources, you might see the following
information:
• Source type. A brief description of the type of source modeled, for example, Flammable gas
escaping from pipe (not burning).
• Release duration. The length of time, in minutes, during which the chemical is predicted to
continue to escape into the atmosphere. If ALOHA predicts the release to continue for more than an
hour, you'll see the message Release Duration: ALOHA limited the duration to 1 hour.
• Total amount released. This is the amount of chemical that ALOHA predicts will be released into
the atmosphere during the hour after a release begins (not the amount of liquid that spills from a tank
during that time).
Review the information you have entered as it appears in the Text Summary, to be sure that you made no
errors when entering information. Review the source type, predicted release rate, duration, and total
amount released to be sure that this information seems reasonable to you. If it does not, try to obtain more
information about the release in order to more accurately model it.
147
Chapter 4: Reference
Calculation Options
Choose Calculation Options from the SetUp menu to select the type of dispersion calculation used.
You can choose from among three dispersion calculation options:
1.
Let ALOHA decide. When you select this option, ALOHA automatically chooses whether to
predict the dispersion of a chemical as a Gaussian (neutrally buoyant) or heavy gas release. It bases
this choice mainly on molecular weight, size of the release, and temperature of the gas cloud. By
default, this option remains selected unless you choose a different option. When "Let ALOHA
decide" is selected, if ALOHA's chemical library does not include values for all physical properties
of your selected chemical necessary to make heavy gas dispersion calculations, ALOHA will use
Gaussian dispersion calculations to predict threat zone size.
When a chemical with a molecular weight less than that of air has been stored at a low temperature
or under high pressure, it can behave like a heavy gas (ammonia is an example of such a chemical).
If you have chosen one of these chemicals and have chosen the Direct source option, ALOHA may
not have enough information about the release to determine whether a heavy gas could be formed.
In such a case, ALOHA will make Gaussian calculations, but will alert you that you should try
running the heavy gas model as well.
2.
Use Gaussian dispersion only. Choose this option if you know that the escaping gas cloud is
approximately neutrally buoyant (about as dense as air). ALOHA will use the Gaussian equation to
predict the spread of the cloud. Avoid using ALOHA's Gaussian model to predict how a large heavy
gas cloud will disperse. Large gas clouds that are denser than air (heavy gases) disperse in a very
different way than this model would predict. They are affected by gravity and other forces besides
wind and turbulence. As they move downwind, they remain much lower to the ground than
neutrally buoyant clouds, and flow like water. Ground-level concentrations within such clouds may
reach much higher levels at some locations than the Gaussian model would predict.
148
Chapter 4: Reference
3.
Use Heavy Gas dispersion only. Choose this option if you know that the cloud is heavier or denser
than air. You will be alerted if ALOHA does not have enough property information to make heavy
gas calculations for your selected chemical. To see a list of the properties needed for heavy gas
calculations, see Table 4-1 on page 111. (To view the property values in the library for your selected
chemical, choose Chemical from the SetUp menu, then click Modify.) When you choose Use
Heavy Gas dispersion only, ALOHA will predict the dispersion of the pollutant using the heavy gas
computations.
Typically, when the atmosphere is most unstable (stability classes A and B), heavy gas threat zones will be
longer than Gaussian threat zones. When the atmosphere is most stable (stability classes E and F),
Gaussian threat zones will be longer. Under neutral (C and D) conditions, heavy gas and Gaussian threat
zones will be similar in length.
Display menu
Select items from the Display menu to indicate the ALOHA results that
you would like to see and how you would like the information to be
displayed:
• Choose Threat Zone, Threat at Point, Text Summary, and/or
Source Strength to display the corresponding windows.
• Choose Tile or Stack to organize ALOHA's windows on your
screen.
• Choose Display Options to have ALOHA's output displayed in
either English or metric units.
Threat Zone
Choose Threat Zone from the Display menu to have ALOHA create a threat zone plot, where up to three
hazard levels are plotted based on your Levels of Concern (LOC). Once you select Threat Zone from the
Display menu, you must specify one or more LOCs.
Note: For flammable vapor clouds, ALOHA can model three different hazards (toxic area, flammable area,
and blast area). If you are modeling a flammable vapor cloud (or a situation where such a cloud might
form), a Hazard To Analyze dialog box will appear after you choose Threat Zone from the Display
menu. In this dialog box, you must first select the hazard that you want ALOHA to model before you can
choose your LOCs. Additionally, if you select blast area from a vapor cloud explosion, you will have to
complete the Vapor Cloud Explosion Parameters dialog box before you can choose your LOCs.
149
Chapter 4: Reference
Level of Concern. A Level of Concern (LOC) is a threshold value of a hazard (toxicity, flammability,
thermal radiation, or overpressure); the LOC is usually the value above which a threat to people or
property may exist. You may keep ALOHA's default values as your LOCs, or you may choose up to three
of your own LOCs. For each LOC you choose, ALOHA estimates a threat zone where the hazard is
predicted to exceed that LOC at some time after a release begins.
You may designate LOC values in one of three ways:
• Use ALOHA's default LOC choice.
• Use the LOC pulldown menus to choose another LOC from the list.
• Select User specified from the LOC pulldown menu and enter your own temporary LOC value and
select the appropriate units.
Note: You can add your own default Toxic LOC for any pure chemical in ALOHA's chemical library.
ALOHA will then use your LOC by default rather than its Toxic LOC defaults for the selected chemical.
To permanently add your own default LOC, choose Chemical from the SetUp menu, click to highlight the
name of the chemical in the list, then click Modify. In the list of physical properties, click Default Level of
Concern, then type your LOC values in the "Default LOC Value - 1, - 2, -3" boxes. Choose the appropriate
units (either parts per million or milligrams per cubic meter), then click OK.
For toxic releases, there are several hazard classification systems in use. Some chemicals have not been
classified in every system. ALOHA determines its default toxic LOC values based on the following
hierarchy of well-known LOCs:
1.
AEGL
2.
ERPG
3.
TEEL
4.
IDLH
Note: For AEGLs, ERPGs, and TEELs, the rank number increases with the hazard level, so that
AEGL-3 is more hazardous than AEGL-1. Typically, the"-3" values are used for the most hazardous
(red) threat zones because they represent the threshold concentration above which health effects
may be life threatening.
Vapor Cloud Explosion Parameters. The severity of a vapor cloud explosion depends on many
factors, including the chemical, the cloud size at the time of ignition, the type of ignition, and the
congestion level in the flammable area of the vapor cloud. Before ALOHA can generate a threat zone plot
for a vapor cloud explosion, you must complete the Vapor Cloud Explosion Parameters dialog box.
Begin by filling in the ignition time. The ignition time represents the length of time that the cloud mixes
with the air around it and becomes diluted in concentration. Therefore, the amount of the vapor cloud that
is between the Lower and Upper Explosive Limits (LEL and UEL) will depend on the ignition time. Enter
the time in minutes or seconds. If you do not know the ignition time, ALOHA allows you to choose an
unknown ignition time option.
150
Chapter 4: Reference
If you choose the unknown ignition time option, ALOHA will run explosion scenarios for a range of
ignition times that encompass all of the possible ignition times for your scenario. ALOHA takes the results
from all of these scenarios and combines them on a single threat zone plot. The threat zone in this case
does not represent the blast area from a single explosion, but rather the composite of potential blast areas
for all of the different ignition time scenarios that ALOHA ran.
Note: If you are modeling an instantaneous release from a Direct source, ALOHA models the chemical
release for 60 seconds. If you choose an ignition time less than 60 seconds, not all of the chemical will be
released prior to the explosion.
Next, choose the ignition type. The type of ignition source has a big influence on the severity of the
explosion. Accidental explosions are most often triggered by common ignition sources, such as sparks,
flames, heat, and static electricity. Accidental explosions are generally deflagration explosions. Explosions
that are triggered by detonation (usually by a high-power explosive device) are detonation explosions,
which are far more damaging than deflagration explosions. Under rare circumstances, an accidental
explosion can be triggered by a common ignition source and still become a detonation explosion.
If you know the ignition type, choose the appropriate option. If you are using ALOHA for planning
purposes, consider modeling both types of ignition. Choose the ignited by spark or flame option if you
want to model a typical accidental explosion. Choose the ignited by detonation option if you want to
model an intentional explosion or a worst-case accidental explosion.
Finally, choose the congestion level within the majority of the vapor cloud. Congestion refers to the
density of obstacles that generate turbulence. Obstacles of this nature are generally small, like a shrub, and
do not impede the flame front. Larger objects, like a building, can impede the flame front, so they should
not be considered obstacles for the purposes of congestion. Greater turbulence allows the flame front to
accelerate, thereby generating a more powerful blast wave (i.e., greater overpressure).
151
Chapter 4: Reference
ALOHA uses two congestion levels: congested and uncongested. Generally, a congested zone has so
many closely spaced obstacles that it is difficult or impossible to walk through it. It is uncommon for this
level of congestion to be found throughout the entire vapor cloud. However, pipe racks in industrial
facilities and some forested areas (where the trees and branches are closely spaced) may be characterized
as congested areas. Uncongested zones include: parking lots, open fields, suburban neighborhoods, and
most urban environments.
Choose the level of congestion (congested or uncongested) in the flammable area of the vapor cloud—that
is, the part of the vapor cloud where the concentration is between the LEL and UEL. If there is more than
one congestion level in the flammable area of the vapor cloud, choose the level that best represents the
majority of the area. Click OK. An Overpressure Level of Concern dialog box appears.
Threat zone plot. Once you have entered all necessary information about a release and chosen an LOC,
ALOHA will display a threat zone plot based on the LOC(s) that you specified. If three LOCs are chosen,
ALOHA will display the threat zones in red, orange, and yellow, overlaid on a single plot. By default, the
red zone represents the worst hazard. (The pattern of dots also varies for each threat zone so that you can
differentiate between the zones if you are color blind or the plot has been printed in black and white.)
On ALOHA's threat zone plot for all dispersion scenarios, the dashed lines along both sides of the threat
zone represent uncertainty in the wind direction. The wind rarely blows constantly from any one direction.
As it shifts direction, it blows the released chemical in a new direction. The "uncertainty lines" around the
threat zone enclose the region within which, about 19 out of 20 times, the chemical cloud is expected to
remain. The lower the wind speed, the more the wind changes direction, so as wind speed decreases, the
uncertainty lines become farther apart. They form a circle when wind speed is very low.
152
Chapter 4: Reference
Interpreting a threat zone. ALOHA's threat zone estimate represents its "best guess" of what will
happen downwind of a chemical release. It's not an exact prediction of just where the gas cloud will travel
and how large it will be. As you examine any threat zone plot, remember the many uncertainties involved
in trying to predict the effects of a chemical release:
• When you enter information into ALOHA, you often have to guess at some of the necessary inputs.
• Many things that happen by chance—such as unexpected changes in wind speed or direction during
a release—can influence how a gas cloud disperses, but are not accounted for in ALOHA's
computations.
• Although ALOHA is a relatively complex computer program (it contains thousands of lines of
computer code), reality is much more complex. ALOHA makes simplifying assumptions in order to
make its predictions. Try to identify ways in which reality may be different from what ALOHA
assumes. For example, ALOHA expects the terrain under a dispersing gas cloud to be flat and free of
obstacles, but in the real world, that's rarely the case.
Treat any threat zone plot as a "ballpark estimate," and always use it along with—never instead of—your
own judgment, experience, and observations, when you make response or planning decisions.
Displaying threat zones in other applications. Threat zones can also be overlaid on electronic
maps displayed in ALOHA's companion mapping application, MARPLOT.
You can also import an ALOHA threat zone plot into either of two Geographic Information System (GIS)
products manufactured by ESRI: ArcView and ArcMap. To import a threat zone plot, you will need to
download and install the appropriate plugin from NOAA's Office of Response and Restoration Web site:
http://response.restoration.noaa.gov/cameotoolkit.
Threat at Point
Once you have displayed a hazard—toxicity, flammability, thermal radiation, or overpressure—on a threat
zone plot, you can use the Threat at Point option to obtain specific information about the hazard at a point
of interest (such as a school or hospital) in or around the threat zones.
You can find the threat at a point by either:
• Selecting Threat at Point from the Display menu; or
• Double-clicking on a location on the threat zone plot.
Note: If ALOHA was unable to generate a Threat Zone plot, you can still look at the threat at a point by
selecting Threat at Point from the Display menu.
If you select Threat at Point from the Display menu, a dialog box will appear and you can define the
point where you would like to obtain a threat estimate using either of two types of location coordinates—
fixed or relative coordinates. Your choice of coordinates will affect the information ALOHA will present
to you if the wind changes direction (whether you're using a SAM, or you manually enter a new value).
153
Chapter 4: Reference
Using fixed (east-west and north-south)
coordinates. Choose this option if you wish to
know the hazard expected at a specific
geographical location. This could be, for example,
a school 100 yards to the west and 400 yards to the
north of the release location. This is the best
method to choose if you wish to monitor the
expected hazard at the school, and you are using a
SAM to track wind speed and direction in
ALOHA. If the wind shifts direction, the results
displayed by ALOHA may change, depending on
whether or not the shift in wind direction moves
the pollutant cloud closer to the school or farther
away from it.
Using relative (downwind and crosswind)
coordinates: Choose this option when you wish
to know the hazard expected at a position that can
best be described in terms of its downwind and
crosswind distance from the release point. For
example, suppose that you have estimated the
straight-line distance between the site of a release
and a nearby hospital to be a half mile. At the
moment, the wind is not blowing the chemical
cloud directly towards the hospital, but the wind is
variable in direction. You wish to know the hazard
value you could expect if the wind were to shift
and carry the cloud of escaping chemical directly
towards the hospital. To get that estimate, you
would use ALOHA to obtain threat at a point
results for a location a half-mile downwind and with a crosswind distance of 0 miles. These results
represent the worst-case hazard levels that could develop at any point one half-mile downwind of the
source, should the wind shift to blow the cloud towards that point.
Note: When you use relative coordinates, ALOHA will remember the location of the point that you have
specified in terms of its downwind and crosswind distance to the source. Therefore, the geographic
location of the point that you have specified to ALOHA will move when the wind direction changes. A
point specified in this manner "follows the wind."
If you select your Threat at Point by double-clicking on its location within the threat zone window,
ALOHA will use relative coordinates to track your location.
Threat at Point results. Once you designate a location, ALOHA will display its estimate of the threat
at a point either as a graph or as text. For example, if you choose to see the threat at a point for a toxic gas
dispersion scenario, ALOHA will display a Concentration at Point graph.
154
Chapter 4: Reference
The Concentration at Point graph displays ground-level chemical concentrations in indoor and outdoor air
at the specified location during the first hour after the beginning of a chemical release. The concentrations
shown on the graph are averaged over a few minutes; they are not instantaneous values. Gas concentrations
can fluctuate greatly over time periods of several seconds. The maximum peak concentration can
significantly exceed the maximum averaged concentration shown on the graph.
There may be up to five lines visible on the graph. The thin red line represents the outdoor, ground-level
concentration. The dashed blue line represents concentration within a building of the type you selected. To
compute indoor concentration, ALOHA assumes that all doors and windows are closed. If applicable to
your chosen location, there may also be up to three horizontal lines (red, orange, and yellow) representing
the LOCs. The red horizontal line represents the worst hazard level.
In the Concentration at Point graph above, ALOHA predicts that a cloud of chlorine gas would arrive at the
location in about 7 minutes (that's when the outdoor concentration line begins to rise steeply on the graph).
Notice that the indoor concentration is predicted to remain much lower than the outdoor concentration, as
long as the building's door and windows are closed. ALOHA predicts that outdoor concentration would
exceed one LOC (AEGL-2) only briefly, but will exceed a lower LOC (AEGL-1) for much longer.
The indoor concentration does not exceed any of the LOC values; however, it does approach the AEGL-1
LOC for a significant period of time. At this level, people inside the building may begin to experience
notable discomfort, irritation, or other temporary effects. Bear in mind that no LOC represents an exact
line between hazardous and non-hazardous conditions, because people differ in their sensitivity to
chemicals (for example, old, sick, or very young people may be more sensitive to chemicals than healthy
adults) and other hazards. People who are more sensitive to the chemicals may experience more serious
health effects than those predicted for the AEGL-1 level, even though that level was not exceeded in the
hour after the release.
Note: ALOHA will place a blue crosshair mark on the threat zone plot to indicate the location where the
hazard is evaluated. If you have plotted the threat zones on a map in MARPLOT, ALOHA will place the
crosshair mark on the map as well.
155
Chapter 4: Reference
What if the doors and windows are open?
To estimate the rate at which pollutant gas could infiltrate into buildings, ALOHA
assumes that all doors and windows are closed. If doors and/or windows are open, as they
might be on a warm summer day, concentrations might increase more rapidly and drop
off sooner inside buildings than ALOHA's indoor concentration line indicates.
Text Summary
Select Text Summary from the Display menu to bring the Text Summary window forward when other
ALOHA windows appear in front of it. ALOHA's Text Summary contains information about the scenario
you are working on. Review its contents to see summaries of:
• Information that you have entered into ALOHA;
• Some basic properties of the chemical you have selected;
• Results of ALOHA's calculations;
• Messages indicating the information that you still need to enter; and
• Additional notes describing any special circumstances that may exist.
The Text Summary window remains open whenever ALOHA is running. Review its contents periodically
as you prepare a scenario to ensure that you have entered model inputs correctly, and to check the results of
ALOHA's calculations. Choose New from the File menu when you want to clear existing Text Summary
information before beginning a new scenario.
Source Strength
Choose Source Strength from the Display menu to see either the rate at which the chemical enters the
atmosphere or the burn rate, depending on the scenario. When you choose this menu item, ALOHA
displays a graph showing the rate (source strength) predicted for the first hour after a release begins or until
the release is complete, whichever is shortest.
Note: ALOHA does not display a source strength graph for BLEVE scenarios.
ALOHA produces two main types of source strength estimates, depending on the type of release that you
have chosen. Source strength graphs for the two types of estimates differ in appearance.
156
Chapter 4: Reference
Constant source strength. Release rate for a Direct source, whether it's instantaneous or continuous,
will remain constant for the duration of the release. ALOHA expects an instantaneous release to last for 1
minute, and a continuous release to last for up to 1 hour. Graphs of either type of Direct release look like
the plot shown below.
Variable source strength. Source strength predicted by the Puddle, Tank, or Pipe source options can
change over time. For example, consider the rate of release of a pressurized gas from a tank rupture.
Initially, the chemical escapes rapidly through the rupture. As the tank pressure drops, the rate of release
slows. If you model such a release using ALOHA, you'll see a line that descends in steps on the source
strength graph.
157
Chapter 4: Reference
Source strength averaging. ALOHA predicts source strength as a series of hundreds of brief
timesteps. These values must be averaged into fewer steps so that calculations can be completed quickly.
For releases into the atmosphere, ALOHA averages the series of timesteps into between one and five
release rates that are each for a time period of at least 1 minute. For burn rates, ALOHA averages over
timesteps lasting 20 seconds. The series of averaged steps is shown on the Source Strength graph, since
this is the information used to calculate the threat zones.
Tile and Stack Windows
The Tile and Stack Windows options allow you to organize the information windows on your computer
screen.
• Choose Tile Windows when you wish to see all of ALOHA's open windows at once (rather than
overlapping each other in a stack). Windows will be reduced in size and arranged in rows and
columns as necessary to fit on your screen.
• Select Stack Windows when you wish to arrange ALOHA's windows on your screen so that each
overlaps the next, with only the front window fully visible. The title bars of the remaining windows
will remain visible.
You may resize or move any ALOHA window after you have chosen either option.
Display Options
Choose Display Options from the Display menu to
have ALOHA output displayed in either:
• English units, such as pounds, yards, and
miles, or
• Metric units, such as grams, kilograms,
meters, and kilometers.
Click either English units or Metric units. ALOHA will display the results of its computations in the type
of units (English or metric) that you choose. It will display input values in the units that you selected when
you entered the values. For example, if you entered wind speed in miles per hour (an English unit), you
will see wind speed displayed in those units on the Text Summary screen, even if you selected metric
output units.
158
Chapter 4: Reference
Sharing menu
The programs that make up the CAMEO (Computer-Aided Management of Emergency Operations)
package work together by means of the Sharing menu. Any application that can communicate with
ALOHA can install a menu under ALOHA's Sharing menu. A menu installed by another application into
the ALOHA Sharing menu belongs to the installing application. Both CAMEO and MARPLOT
automatically install menus under ALOHA's Sharing menu.
ALOHA automatically saves menus that other applications have placed in its Sharing menu. When you use
a saved menu that belongs to an application that is not currently running, ALOHA will start that
application so that it can carry out the specified action. You can delete a menu from the Sharing menu if
you wish (you might want to do so if you remove an application from your hard drive). To do this, choose
Edit Shared Menus from the Sharing menu, select the menu that you wish to delete, then click Delete.
Items in the Sharing menu
Two items always appear in the Sharing menu, whether or not ALOHA is sharing information with another
program:
• Choose About Shared Menus to view on-screen help information about information sharing
between ALOHA and other programs.
• Choose Edit Shared Menus to delete an application's menu from the Sharing menu.
CAMEO menu
When CAMEO is running, a CAMEO menu appears in ALOHA's Sharing menu. The CAMEO menu in
ALOHA's Sharing menu contains two items:
• If you have selected a chemical in ALOHA, choose Get RIDS Info to see information about this
chemical in CAMEO's RIDS (Response Information Data Sheets) database.
• Choose Go to CAMEO to start CAMEO or to go to CAMEO if it is already running.
159
Chapter 4: Reference
MARPLOT menu
The MARPLOT menu in ALOHA's Sharing menu contains two items:
• Choose Help to learn about information-sharing between MARPLOT, CAMEO's mapping program,
and ALOHA.
• Choose Go to Map to start MARPLOT or to go to MARPLOT if it is already running.
Use MARPLOT with ALOHA to display an ALOHA threat zone plot on an electronic map of your
community.
MARPLOT can display several different types of maps. It was primarily designed to use special maps
generated from TIGER (Topologically Integrated Geographic Encoding and Referencing) files, prepared
by the U.S. Census Bureau from U.S. Geological Survey base maps. TIGER files are computer-readable
geographic databases for all U.S. states, territories, and possessions. They include digital descriptions of
features such as political boundaries, water bodies, transportation routes, and address ranges for street
segments. MARPLOT-readable maps incorporating this TIGER information can be downloaded from the
CAMEO download Web site (http://www.epa.gov/oem/cameo/marmaps/). Check your MARPLOT manual
for more information about obtaining and using maps.
Using MARPLOT
When ALOHA and MARPLOT are running simultaneously, ALOHA automatically installs a menu in
MARPLOT's Sharing menu. You can choose items from this menu to indicate the location of a release,
display an ALOHA threat zone plot on a MARPLOT map, or indicate a location for which you would like
specific hazard information.
Choose from among the following items contained in the ALOHA submenu:
• Help: Choose Help to see a discussion about using MARPLOT together with ALOHA.
160
Chapter 4: Reference
• Set Source Point: First, click once on the location
of an accidental chemical release on your
MARPLOT map; this is the source point. Next,
choose Set Source Point. ALOHA will place a
pink cross symbol at the source location. Once a
threat zone has been displayed in ALOHA,
ALOHA's threat zone, as well as the wind
direction confidence lines around it, will
automatically be drawn on the map in MARPLOT.
If you already designated a Threat at Point in
ALOHA, that location will be marked by a blue
crosshair mark on the map in MARPLOT. Note: If
you are using an older version of MARPLOT,
the orange threat zone will be displayed as a green threat zone by default.
• Set Threat Point: First, click the location on your MARPLOT map for which you wish to see threat
information. Next, choose Set Threat Point to tell ALOHA the location. ALOHA will place a
symbol at that location, then come forward to make concentration calculations and display the
Threat at Point plot. ALOHA will use fixed (east-west, north-south) coordinates to remember the
point's position.
• Delete ALOHA Objects: Choose this item to remove all objects placed on the map by ALOHA.
ALOHA then will no longer update the map every time it generates new information.
• Go to ALOHA: Choose this item to bring ALOHA forward.
Source
Point
Threat
Point
161
Confidence Line
Chapter 4: Reference
162
Troubleshooting
Often, when you encounter difficulties while running ALOHA, it will alert you of the
problem and suggest a solution. At other times, you may encounter a problem and not
know how to solve it. Below are some of these cases. For more ALOHA information,
check the ALOHA Web site at http://response.restoration.noaa.gov/aloha.
5
In the Text Summary, I see tank volume
estimated to be "5.2e8 gallons." How many
gallons is that?
ALOHA displays its results in exponential
notation whenever numbers are too large to
display in decimal notation. Exponential
notation is a way of displaying a number as a
digital number multiplied by a power of 10. In
the number 5e3, for example, 5 is the digital
number and 3 is the power to which 10 is taken.
Interpret 5e3 as "5 times the quantity 10 taken to
the power of 3," which equals 5,000 in decimal
notation. Likewise, interpret 5e-3 as "5 times the
quantity 10 taken to the power of -3," which
equals 0.005 in decimal notation. Interpret 5.2e8
as "5.2 times 10 taken to the power of 8," or
520,000,000.
ALOHA gave me an outdoor concentration
estimate that's greater than 1 million parts
per million—how can that be?
You have asked for a concentration estimate for
a point very close to the source. ALOHA
"knows" that concentrations of a pollutant are
extremely high right at the point of release and
drop off as you move downwind. It uses
equations to approximate what happens in
reality. Modelers call ALOHA a "far-field"
model because these equations much more
accurately predict events at distances of more
than a few yards from the source than very near
the source. In fact, according to these equations
concentration is infinite at the point of release.
163
Chapter 5: Troubleshooting
I want to modify a chemical, but I can't
change some properties—they appear grey.
These properties are estimated by ALOHA from
other information in its chemical library. To use
different property values, add a new chemical
(use a name such as "CHLORINE-2"), then
enter new property values.
I am trying to model the release of gas from a
gas pipeline, but ALOHA says the pipe is too
short. It tells me that the length must be at
least 200 times the diameter of the pipe. What
should I do?
If the pipe is too short relative to its diameter,
and its diameter is greater than about 8 inches
(20 centimeters), use the Tank option instead,
selecting the configuration of a horizontal tank.
If the pipe is less than 1 meter long and
connected to a tank, you also can use the Tank
option (in this case, select Short pipe/valve as
the type of leak). Either of these methods should
produce a conservative threat estimate.
I am using a SAM with ALOHA. I have set
the SAM options using the Atmospheric
menu, but the Source menu is not available—
I can't set my source.
Either the SAM has not yet been collecting data
for 5 minutes, or ALOHA has not received valid
data. Before ALOHA can estimate atmospheric
stability, it must have received data from the
SAM for at least 5 minutes. Check the Text
Summary window for a message alerting you
that either the SAM has not been transmitting for
5 minutes, or the transmitted data are not valid.
ALOHA tells me that the input value I just
entered is not within allowable limits.
ALOHA will accept a numeric input value (that
is, a value such as puddle area or tank hole
diameter that you enter as a number) only if it is
within a specified range. These restrictions help
to prevent you from inadvertently entering an
unrealistic input value. If you enter a value
outside of the allowable range, ALOHA will
warn you and tell you what the limits are. You
must modify your value before ALOHA will
continue. Check ALOHA's on-screen help topics
for more information about ALOHA inputs.
164
Chapter 5: Troubleshooting
When I changed some atmospheric
conditions, ALOHA told me that it is unable
to verify the consistency between my new
atmospheric data and the source data. Then I
had to reset the source.
ALOHA's Puddle, Tank, and Gas Pipeline
source strength calculations are affected by
atmospheric conditions. ALOHA recomputes
source strength whenever possible after you
have modified atmospheric information. In some
cases it cannot, so it asks you to reenter
information about the source. For example, by
increasing air temperature, you may cause a tank
to be filled to more than 100 percent of capacity,
or a puddle's temperature to increase above its
boiling point. In such cases, you must enter new
source information to resolve the problem.
I set up a release scenario in ALOHA, then
started MARPLOT, clicked on a location on
my map, and chose Set Source Point from the
ALOHA menu (in MARPLOT's Sharing
menu). But I don't see a threat zone on my
map. What's wrong?
Before ALOHA can place a threat zone on your
MARPLOT map, a threat zone plot needs to be
displayed in ALOHA. To solve your problem, in
ALOHA, choose Threat Zone from the Display
menu, then return to MARPLOT. You should
now see the threat zone on your map.
My computer crashed while I had an ALOHA
threat zone plotted on a map in MARPLOT.
Now whenever I reopen the map, I see the old
threat zone on the map, and I can't delete it;
MARPLOT tells me that the ALOHA layer is
locked.
To delete a threat zone remaining on a map after
a crash, delete the entire ALOHA layer (open the
map again in MARPLOT, choose Layer List
from MARPLOT's List menu, click on the lock
icon for the ALOHA layer to unlock the layer,
then click Delete while the ALOHA layer is
highlighted in the layer list). A new ALOHA
layer will be added next time you plot a threat
zone on the map.
I'm running MARPLOT with ALOHA while
I respond to a spill. I'm also using a SAM
station to collect weather data. I've had a
threat zone displayed in MARPLOT for the
last half hour. I know the wind has shifted
direction but the threat zone hasn't changed
at all. What's wrong?
Whenever you bring MARPLOT forward (so
that its windows are in front of ALOHA's
windows), you'll halt data transmission from the
SAM to ALOHA. Bring ALOHA forward to
update the weather data and threat zone.
165
Chapter 5: Troubleshooting
We have two computers in our office that
sometimes give different answers for the same
ALOHA scenario.
Individual computers can come up with different
answers when they make the same calculations.
In particular, different computers can round off
numbers differently as they make their
calculations. This can have a visible effect on
ALOHA's source and dispersion estimates.
166
Bibliography
American Conference of Governmental Industrial Hygienists (ACGIH). 2004. 2004 TLVs and BEIs.
ACGIH, http://www.acgih.org. Most recent annual list of threshold limit values (TLVs) and biological
exposure indices (BEIs) for several hundred chemical substances; also discusses how these values were
derived and how to interpret them.
American Institute of Chemical Engineers (AIChE). 1994. Guidelines for Evaluating the Characteristics
of Vapor Cloud Explosions, Flash Fires, and BLEVEs. New York: Center for Chemical Process Safety.
Brutsaert, Wilfried. 1982. Evaporation into the Atmosphere: Theory, History, and Applications. Boston: D.
Reidel Publishing Company.
Committee on Toxicology, National Research Council. 2000 to present. Acute Exposure Guideline Levels
for Selected Airborne Chemicals. Multiple volumes. Washington D.C.: National Academy Press
(http://www.nap.edu). Presents Acute Exposure Guideline Levels (AEGLs); describes AEGL development
process and data used for each AEGL value.
Design Institute for Physical Property Data. 2006. DIPPR® Database of Evaluated Process Design Data.
Described at http://dippr.byu.edu.
Federal Emergency Management Agency, U.S. Department of Transportation, and U.S. Environmental
Protection Agency. 1988. Handbook of Chemical Hazard Analysis Procedures. Washington, D.C.: Federal
Emergency Management Agency Publications Office.
Havens, Jerry and Tom Spicer. 1990. LNG Vapor Dispersion Prediction with the DEGADIS Dense Gas
Dispersion Model. Topical Report (April 1988-July 1990). Chicago: Gas Research Institute.
Lees, Frank P. 1980. Loss Prevention in the Process Industries, Vol. 1. London and Boston: Butterworths.
Lees, Frank P. 2001. Loss Prevention in the Process Industries, Vol. 2. Second edition. New Delhi:
Butterworth-Heinemann.
Leslie, I.R.M and A.M. Birk. 1991. State of the art review of pressure liquefied gas container failure modes
and associated projectile hazards. Journal of Hazardous Materials 28(3): 329-365.
National Institute for Occupational Health and Safety (NIOSH), U.S. Department of Health and Human
Services (DHHS). 2005. NIOSH Pocket Guide to Chemical Hazards. NIOSH Publication No. 2005-149.
Online version and ordering information at http://www.cdc.gov/niosh/npg/. Lists TLVs, permissible
exposure limits (PELs), and IDLH values, as well as general industrial hygiene information for 677
chemical substances.
167
Bibliography
U.S. Environmental Protection Agency (EPA), the Federal Emergency Management Agency (FEMA), and
the U.S. Department of Transportation (DOT). 1987. Technical Guidance for Hazards Analysis:
Emergency Planning for Extremely Hazardous Substances (1987). Download a PDF copy from
http://yosemite.epa.gov/oswer/ceppoweb.nsf/content/consolidatedPubs.htm. Describes step-by-step
procedures for hazards analysis; recommends and discusses use of one-tenth of the IDLH as the Level of
Concern for Extremely Hazardous Substances in emergency planning.
Spicer, Tom and Jerry Havens. 1989. User's Guide for the DEGADIS 2.1 Dense Gas Dispersion Model.
EPA-450/4-89-019. Cincinnati: U.S. Environmental Protection Agency.
Turner, D. Bruce. 1994. Workbook of Atmospheric Dispersion Estimates: An Introduction to Dispersion
Modeling. Second edition. Boca Raton, Florida: Lewis Publishers.
Turner, D. Bruce and Lucille W. Bender. 1986. Description of UNAMAP (Version 6). Springfield, Virginia:
National Technical Information Service.
Wilson, D.J. 1987. Stay indoors or evacuate to avoid exposure to toxic gas? Emergency Preparedness
Digest 14(1):19-24.
Woodward, V.L. 1998. Estimating the Flammable Mass of a Vapor Cloud. New York: Center for Chemical
Process Safety, American Institute of Chemical Engineers.
168
Glossary
AEGLs
Acute Exposure Guideline Levels (AEGLs) are Toxic Levels of
Concern (LOCs) that you can use in ALOHA to predict the area
where a toxic gas concentration might be high enough to harm
people. The AEGLs are under development by the National
Research Council's National Advisory Committee on AEGLs.
AEGLs take into account sensitive individuals and are meant to
protect nearly all people. As of October 2005, the final AEGL
values for more than 20 chemicals have been released, interim
AEGL values for more than 60 additional chemicals have also
been established, and proposed AEGL values for more chemicals
are under review. The committee's objective is to define AEGLs
for the 300+ extremely hazardous substances listed in Title III of
the Superfund Amendment and Reauthorization Act (the U.S.
Environmental Protection Agency offers an online list of these
substances). AEGL Web site: http://www.epa.gov/oppt/aegl/
index.htm.
Aerosol
Fine liquid droplets (or solid particles) suspended in a gas.
Air dispersion model
A computer model that predicts the movement and dispersion of a
gas in the atmosphere.
Air exchange rate
The number of times per unit time that the volume of air within a
building is completely replaced by new outdoor air when doors
and windows are closed. Usually expressed as number of air
changes per hour.
ALOHA
ALOHA stands for Areal Locations of Hazardous Atmospheres.
(ALOHA is a registered trademark of the U.S. Government).
169
Glossary
Ambient saturation
concentration
The maximum concentration of vapor that could be attained in the
air in a closed space above a liquid at ambient temperature and
pressure. If a chemical has a high ambient saturation
concentration, it has a strong ability to displace air, and the
concentration of the chemical's vapor in the air above the liquid
will be high. If it has a low ambient saturation concentration, the
vapor concentration will be low. This property changes with
temperature—a liquid at a higher temperature will have a higher
ambient saturation concentration. A chemical that is a gas at
ambient temperature and pressure has an ambient saturation
concentration of 100% (1,000,000 ppm).
Anhydrous
Without water. A chemical shipped or stored without water, rather
than in solution, is in anhydrous form (anhydrous ammonia is a
common example).
Atmospheric stability
A measure of the tendency of air to move upward or downward
within the atmosphere, generating turbulence. The atmosphere
may be more or less turbulent at any given time, depending on the
amount of incoming solar radiation as well as other factors.
Meteorologists have defined six atmospheric stability classes,
from A to F, each representing a different degree of turbulence in
the atmosphere. When moderate to strong incoming solar
radiation heats air near the ground, causing it to rise and
generating large eddies, the atmosphere is considered unstable.
Unstable conditions are associated with atmospheric stability
classes A and B (air has a strong tendency to move up or down,
and the atmosphere is more turbulent). When solar radiation is
relatively weak or absent, air near the surface has a reduced
tendency to rise and less turbulence develops. In this case, the
atmosphere is considered stable, the wind is weak, and the
stability class would be E or F. Stability classes D and C represent
conditions of more neutral stability (moderately turbulent).
Neutral conditions are associated with relatively strong wind
speeds and moderate solar radiation.
170
Glossary
BLEVE
BLEVE stands for Boiling Liquid Expanding Vapor Explosion.
BLEVEs typically occur in closed storage tanks that contain a
liquefied gas, usually a gas that has been liquefied under pressure.
Although both flammable and nonflammable liquefied gases may
be involved in a BLEVE, ALOHA only models flammable liquid
BLEVEs.
A common BLEVE scenario happens when a container of
liquefied gas is heated by fire, increasing the pressure within the
container until the tank ruptures and fails. When the container
fails, the chemical is released in an explosion. If the chemical is
above its boiling point when the container fails, some or all of the
liquid will flash-boil—that is, instantaneously become a gas. If the
chemical is flammable, a burning gas cloud called a fireball may
occur if a significant amount of the chemical flash-boils. ALOHA
assumes that any liquid not consumed in the fireball will form a
pool fire. Potential BLEVE hazards include thermal radiation,
overpressure, hazardous fragments, smoke, and toxic byproducts
from the fire.
Boiling point
The maximum temperature at which a substance's liquid phase can
exist in equilibrium with its vapor phase. Above the boiling point
a liquid vaporizes completely. The boiling point depends on a
chemical's composition and the applied pressure. As pressure
increases, the boiling point of a substance also increases. The
boiling point is also the temperature at which the vapor pressure of
a liquid is equal to the applied atmospheric pressure. The "normal
boiling point" is the temperature at which a liquid under 1
atmosphere of pressure boils. The "ambient boiling point" is the
temperature at which the chemical boils at the ambient pressure.
Burn Duration
The length of time that a flammable substance burns. ALOHA
limits burn duration to 1 hour.
Cloud cover
The fraction of the sky that is obscured by clouds. ALOHA uses a
scale in which cloud cover is measured in tenths (for example,
when half the sky is covered by clouds, the cloud cover is 5
tenths).
171
Glossary
Concentration
The amount of a chemical present in a given weight or volume of
air. In ALOHA, concentration of a gas in air is expressed in units
such as parts per million (by volume) or milligrams per cubic
meter.
Concentration
patchiness
Distribution of a pollutant gas as patches of high and low
concentration. Especially near the source of a release, wind eddies
push a pollutant cloud unpredictably about, causing gas
concentrations at any moment to be high in one location and low
in another. ALOHA does not account for concentration patchiness
near the point of a release.
Congestion
A concept used to quantify the way small structures within the
vapor cloud affect the severity of a vapor cloud explosion.
Congestion refers to the density of obstacles that generate
turbulence. Obstacles of this nature are generally small, like a
shrub, and do not impede the flame front. Larger objects, like a
building, can impede the flame front, so they should not be
considered obstacles for the purposes of congestion. Greater
turbulence allows the flame front to accelerate, thereby generating
a more powerful blast wave (i.e., greater overpressure). ALOHA
uses two congestion levels: congested and uncongested.
Conservative
An estimate that is more likely to result in threat zone and hazard
estimates that are too large rather than too small. Selecting
conservative choices for weather conditions (low wind speed and
a stable atmosphere), source strength (larger puddle area or higher
release rate), or LOC (a small LOC) results in a larger threat zone.
Continuous source
A source that releases gas into the atmosphere at a constant or
near-constant rate for an extended period of time.
Crosswind
Perpendicular to the wind.
Cryogenic
Relating to processing or storing substances at very low
temperatures. For purposes of ALOHA, the use and storage of
gases liquefied by refrigeration.
172
Glossary
Daylight savings time
At most U.S. locations, daylight savings time is put into effect
each spring when local standard time is advanced by 1 hour (the
time is moved back 1 hour in the fall to become standard time
again). When you select a U.S. location, ALOHA automatically
switches between standard to daylight savings time for you when
necessary, depending on the date that you enter. You must
manually make this switch for locations outside the U.S.
Deflagration
explosion
Rapid, sharp combustion with sudden evolution of flame. The
flame front travels relatively slowly (subsonic speeds), as
compared to a supersonic detonation.
Density
The ratio of the mass (weight) of a substance to the volume it
occupies. For example, if 1 cubic foot of a substance weighs 10
pounds, its density is 10 pounds per cubic foot.
Detonation explosion
An explosion where the flame front travels at supersonic speeds as
a shock wave. Explosions of this nature are often triggered by a
high-power explosive device. Typically, detonation explosions are
significantly more damaging than deflagration explosions.
DIPPR data
Values for physical properties compiled by the Department of
Chemical Engineering of Brigham Young University for the
Design Institute for Physical Property Data (DIPPR) of the
American Institute of Chemical Engineers. These values are
included in ALOHA's chemical library for more than half of the
chemicals in the library. DIPPR Web site: http://dippr.byu.edu.
Direct source
Choose this source option when you know, or can estimate, either
the amount of pollutant gas entering the atmosphere or its rate of
entry (i.e., evaporation rate).
Dispersion
For ALOHA's purposes, the process by which a cloud of pollutant
gas spreads out into the atmosphere, mixing with the air and
eventually becoming diluted to below hazardous levels.
173
Glossary
Eddies
Parcels of air of various sizes that leave their normal position
within an otherwise orderly, smooth flow. For example, air that
encounters an obstacle must go over or around it. This change in
the direction of air flow often causes "swirls" of air, or eddies, to
tumble off the back of the obstacle. Impediments to airflow—
ranging from simple friction (grass) to larger obstacles
(buildings)—can cause eddies in a variety of sizes to form.
ERPGs
The Emergency Response Planning Guidelines (ERPGs) are Toxic
Levels of Concern (LOCs) that you can use in ALOHA to predict
the area where a toxic gas concentration might be high enough to
harm people. The ERPGs were developed by the ERPG
committee of the American Industrial Hygiene Association. The
ERPGs were developed as planning guidelines, to anticipate
human adverse health effects caused by exposure to toxic
chemicals. The ERPGs are three-tiered guidelines with one
common denominator: a 1-hour contact duration. Each guideline
identifies the substance, its chemical and structural properties,
animal toxicology data, human experience, existing exposure
guidelines, the rationale behind the selected value, and a list of
references. ERPG Web site: http://www.aiha.org.
Exponential notation
ALOHA displays its results in exponential notation whenever
numbers are too large to display in decimal notation. Exponential
notation is a way of displaying a number as a digital number
multiplied by a power of 10. In the number 5e3, for example, 5 is
the digital number and 3 is the power to which 10 is taken.
Interpret 5e3 as "5 times the quantity 10 taken to the power of 3,"
which equals 5,000 in decimal notation.
Fireball
A burning and expanding gas cloud formed during a BLEVE of a
flammable chemical. The fireball is made up of both the chemical
that flash-boils when the tank fails and the chemical that sprays
out as an aerosol during the explosion. The primary hazard
associated with a fireball is thermal radiation.
Flammable
Easy to ignite and burns readily. The U.S. Department of
Transportation defines flammable liquids as those liquids that
have a flash point below 100°F (37.8°C).
174
Glossary
Flammable area
The part of a flammable vapor cloud where the concentration is in
the flammable range, between the Lower and Upper Explosive
Limits (LEL and UEL). The flammable area will burn rapidly
when ignited because that portion of the cloud is already premixed to the right mixture of fuel and air for burning to occur.
Following the rapid burning, the part of the cloud where the fuelair concentration is above the UEL may continue to slowly burn as
air mixes with the cloud.
Flash fire
When a flammable vapor cloud encounters an ignition source, the
cloud can catch fire and burn rapidly in what is called a flash fire.
Possible hazards associated with a flash fire include thermal
radiation, smoke, and toxic byproducts from the fire. ALOHA will
predict the flammable area of the vapor cloud—that is, the area
where a flash fire could occur at some time after the release.
Flash point
The lowest temperature at which a liquid gives off enough vapor
to be ignited at its surface.
Flash-boil
The sudden vaporization of a liquid. This occurs most often when
a chemical is a gas at standard temperature and pressure, but is
stored as a liquid under pressure. If the storage container ruptures,
the sudden reduction in pressure can cause the liquid to boil
violently ("flash-boil") and the tank contents to foam up, filling
the tank with a two-phase mixture of gas and liquid.
Footprint
See Threat zone.
Freezing point
Also, melting point. The temperature at which the solid and liquid
phases of a substance exist in equilibrium. The freezing point
depends on the chemical composition and the applied pressure.
The "normal freezing point" is defined at a pressure of 1
atmosphere. For example, the normal freezing point of water is
0°C (32°F).
175
Glossary
Fuel reactivity
A characteristic of a chemical that rates the tendency of the flame
front to accelerate when a vapor cloud burns. The reactivity
ratings are related to the speed of the flame front when there is no
turbulence (laminar burning velocities).
Fumes
Dense, smoke-like vapors given off by fuming materials such as
very reactive liquids, gases, or molten metals (for example,
concentrated hydrochloric acid or sulfur monochloride). Fuming
corrosive materials produce dense, choking, smoke-like clouds on
contact with the moisture in air. Some liquefied gases that react
with water when they evaporate (such as anhydrous hydrogen
fluoride and anhydrous hydrogen chloride) also produce fumes.
Fumes from hot or molten metals may not have a dense, smokelike appearance but are hazardous, usually by inhalation.
Gas(es)
Evenly dispersed molecules of a material at a temperature above
its boiling point. A gas, unlike solids and liquids, does not have an
independent shape or volume (a gas expands to fill available
space, and the volume taken up by a gas depends on the pressure
exerted on it). Examples of gases include oxygen, air (a mixture of
nitrogen, oxygen, and trace amounts of other gases), chlorine, and
carbon dioxide.
Gaussian
A Gaussian curve is a bell-shaped, or "normal," probability curve
(named after a famous mathematician). ALOHA uses a Gaussian
distribution to describe the movement and spreading of a gas that
is neutrally buoyant (about as dense as air).
GMT
Greenwich Mean Time or Coordinated Universal Time. The
reference time along the prime meridian (0° longitude), which
passes through Greenwich, England.
176
Glossary
Ground roughness
The roughness of the ground (over which a pollutant cloud is
moving). Degree of ground roughness depends on the size and
number of roughness elements, which can range in size from
blades of grass to buildings. Ground roughness generates air
turbulence, which acts to mix air into the pollutant cloud and
dilute the pollutant gas. When all else is equal, a threat zone will
be smaller when you choose a larger ground roughness value.
Ground temperature
The temperature of the ground beneath an evaporating puddle.
ALOHA uses your value for ground temperature to estimate the
amount of heat that is transferred from the ground to an
evaporating puddle.
Ground type
The physical composition of the ground beneath a puddle. The
ground type is especially important when a refrigerated liquid
spills to form a boiling puddle. In such cases, often more of the
heat required for puddle evaporation is supplied by the ground
rather than the atmosphere.
Hazardous fragments
One of the major hazards associated with any explosion.
Hazardous fragments are flying debris propelled by the
explosion's pressure wave. Hazardous fragments come from two
primary sources: container fragments and debris from the
surrounding area.
Heat of combustion
Energy released as heat when a chemical undergoes complete
combustion with oxygen—that is, burns completely. The heat of
combustion is usually determined experimentally. The units are
expressed as energy/amount of fuel (e.g., J/kg or BTU/lb).
Heavy gas
A gas cloud that is denser than the air around it. There are several
reasons why a gas forms a heavy gas cloud, or behaves like a
heavy gas: 1) because its molecular weight is greater than that of
air (about 29 kilograms/kilomole), 2) because it is stored
cryogenically (refrigerated), or 3) because aerosols form in
sufficient quantity during a release to cause the mixture to behave
like a heavy gas.
177
Glossary
IDLH
The Immediately Dangerous to Life or Health (IDLH) level is a
limit originally established for selecting respirators for use in
workplaces by the National Institute for Occupational Safety and
Health (NIOSH). A chemical's IDLH is an estimate of the
maximum concentration in the air to which a healthy worker could
be exposed without suffering permanent or escape-impairing
health effects. NIOSH Web site: http://www.cdc.gov/niosh.
Infinite tank source
A case in which a gas pipeline is connected to a reservoir that is so
large that gas escapes from the broken end of the pipeline at a
constant rate for an indefinite period of time.
Instantaneous source
A very short-term release. ALOHA assumes that an instantaneous
release lasts 1 minute.
Inversion
An atmospheric condition in which an unstable layer of air near
the ground lies beneath a very stable layer of air above. The height
of the abrupt change of atmospheric stability is called the
inversion height. An inversion can trap pollutant gases below the
inversion height. This may cause ground-level concentrations of a
pollutant to reach higher levels than would otherwise be expected.
The type of inversion of concern for dispersion modeling is a lowlevel inversion that could trap a pollutant cloud near the ground.
Sea smoke or low ground fog are good indicators of the presence
of this type of inversion. A low-level inversion is different from
the inversion that causes smog. That type of inversion is typically
thousands of feet above the ground—much too high to affect a
dispersing gas cloud.
Jet fire
A jet fire, also referred to as a flame jet, occurs when a flammable
chemical is rapidly released from an opening in a container and
immediately catches on fire—much like the flame from a
blowtorch. Thermal radiation is the primary hazard associated
with a jet fire. Other potential jet fire hazards include smoke, toxic
byproducts from the fire, and secondary fires and explosions in the
surrounding area.
178
Glossary
Level of Concern
(LOC)
A threshold value of a hazard (toxicity, flammability, thermal
radiation, or overpressure); the LOC is usually the value above
which a threat to people or property may exist. For each LOC you
choose, ALOHA estimates a threat zone where the hazard is
predicted to exceed that LOC at some time after a release begins.
Liquefied gas
A gas that has been liquefied by applying a high pressure or by
cooling (refrigerating) it below its boiling point. Chemicals that
are stored as liquefied gases are gases at ambient pressure and/or
temperature.
Lower Explosive
Limit (LEL)
The Lower Explosive Limit (LEL), also called the Lower
Flammability Limit, is the minimum concentration of fuel in the
air needed for a fire or an explosion to occur if an ignition source
is present. If the concentration is below the LEL, there is not
enough fuel in the air to sustain a fire or an explosion—it is too
lean. The LEL is determined experimentally using standard
temperature and pressure settings. Additionally, if the fuel
concentration in the air exceeds the Upper Explosive Limit (UEL),
then a fire (or an explosion) cannot occur.
Mass
Mass is a physical property related to weight. Mass is a measure of
the amount of a substance that occupies a given space. While the
weight of a given amount of a substance is a measure of the force
by which it is attracted by gravity (and is less on the moon than on
the earth), the substance's mass is independent of gravity.
Maximum Average
Sustained Release
Rate and Maximum
Burn Rate
ALOHA computes release rate from a puddle, tank, or gas
pipeline as a series of hundreds of brief timesteps. Each timestep
represents a rate of release that is maintained for a particular
amount of time (timesteps are short if release rate is changing
rapidly, and longer if release rate is nearly constant).
For releases into the atmosphere, ALOHA averages this series of
many release rates into between one and five release rates that are
each for a time period of at least 1 minute. For burn rates, ALOHA
averages over timesteps lasting 20 seconds. The Maximum
Average Sustained Release Rate (or the Maximum Burn Rate, if
applicable) is the highest of these averaged release rates. It is
represented by the tallest timestep on the Source Strength graph.
179
Glossary
Mixing
The process by which air is mixed into a pollutant gas cloud. This
includes both mechanical (induced by the wind passing over rough
ground) and thermal (induced by surface heating) mixing.
Mole
Amount of a substance containing 6.02 x 10²³ molecules. The
molecular weight of a chemical is the mass of 1 mole of that
chemical.
Molecular weight
The sum of the atomic weights of all the atoms in the molecule
(the weight of one molecule of the chemical).
Neutrally buoyant gas
A gas that is about as dense as air, and neither positively nor
negatively buoyant (neither rises nor sinks in air).
Open Country
An area of low ground roughness, such as a parking lot or open
field.
Open Water
A body of water that is large relative to the size of the pollutant
cloud that is travelling over it, such as oceans or large lakes.
Except when the wind speed is very high, Open Water is the
lowest ground roughness category in ALOHA.
Overpressure
Overpressure, also called a blast wave, refers to the sudden onset
of a pressure wave after an explosion. This pressure wave is
caused by the energy released in the initial explosion—the bigger
the initial explosion, the more damaging the pressure wave.
Partial pressure
At equilibrium, molecules move from the liquid to the gas phase at
the same rate as they return to the liquid from the gas phase. In
liquids that are mixtures of chemicals, each component vaporizes
(evaporates) at its own characteristic rate. The partial pressure of a
chemical in a mixture is a measure of the concentration of that
chemical's gas-phase molecules in the air directly in contact with
the liquid. In most actual cases equilibrium is not reached so the
partial pressure represents the limiting value for chemical
concentration in the air.
180
Glossary
Particulates
Solid particles so small that they can disperse in the air like gases
(however, unlike gases, particulates eventually "rainout," or fall to
the ground). ALOHA does not model particulate dispersion.
Parts per billion (ppb)
Units of gas or vapor concentration in air: parts of gas per billion
parts of air. ALOHA uses parts per million (ppm). (1 ppm = 1 ppb
x 1,000)
Parts per million
(ppm)
Units of gas or vapor concentration in air: parts of gas per million
parts of air. In ALOHA, ppm is by volume, not by weight.
Plume
A cloud of pollutant gas dispersing from a continuous source. A
typical plume is a long, cigar-shaped gas cloud.
Plume rise
The upward transport of a gas plume (such as smokestack gases,
which rise because they have been heated). ALOHA does not
account for plume rise.
Pool fire
A pool fire occurs when a flammable liquid forms a puddle on the
ground and catches on fire. ALOHA only models pool fires on
land; it does not model pool fires on water.
Thermal radiation is the primary hazard associated with a pool
fire. Other potential pool fire hazards include smoke, toxic
byproducts from the fire, and secondary fires and explosions in the
surrounding area.
Relative humidity
The ratio of the amount of water vapor that the air contains to the
maximum amount of water vapor that it could hold at the ambient
temperature and pressure. Relative humidity is expressed as a
percentage. When relative humidity is 50%, the air contains onehalf as much water vapor as it could potentially hold.
Release duration
The period of time over which a release occurs. ALOHA limits
release duration to 1 hour.
181
Glossary
Roughness length
Also, Zo. A numerical measure of ground roughness.
Running average
An average taken in consecutive, overlapping segments (e.g., the
average of the first five values, then the average of the second
through sixth values, then the average of the third through seventh
values, etc.).
SAM
Station for Atmospheric Measurements. A portable
meteorological measurement station that can transmit weather
data to ALOHA through a computer's serial port.
Save file
A file containing information about a release scenario that you
have entered into ALOHA. You can reopen and modify a save file
in ALOHA. Choose Save from the File menu to create a save file.
Serial port
A data interface on a computer through which peripheral devices,
such as a SAM, scanner, printer, or digitizing tablet, can be
connected. ALOHA can receive weather data from a SAM
through a serial port.
Sigma theta
The standard deviation of the wind direction. A SAM configured
for use with ALOHA measures changes in wind direction, then
transmits an estimate of sigma theta. ALOHA uses this value for
sigma theta and the wind speed to estimate stability class.
Smoke
A mixture of gases, suspended solid particles, and vapors resulting
from combustion.
Solubility
A measure of a chemical's ability to dissolve in water. If a
chemical is highly soluble, it will dissolve easily into water.
182
Glossary
Solution strength
Mixtures of chemicals in which the components are interspersed
uniformly at the molecular level are called solutions. The strength
of a solution in ALOHA is defined as the mass of the volatile
hazardous component divided by the mass of the solution. For
example, the strength of an oleum solution is defined as the mass
of free sulfur trioxide divided by the combined mass of the free
sulfur trioxide and sulfuric acid.
Solutions
Mixtures of chemicals in which the components are interspersed
uniformly at the molecular level. ALOHA's chemical library
includes a short list of solutions. Most are solutions of an
anhydrous acid and water (e.g., hydrogen fluoride and water). In
all cases, only one component of the solution is both toxic and
volatile enough to pose an air hazard. For example, in
hydrofluoric acid (a solution of hydrogen fluoride and water) it is
the hydrogen fluoride that is the air hazard.
Source
The vessel or pool releasing a hazardous chemical into the
atmosphere.
Source height
The distance above the ground at which a chemical is being
released.
Source Strength
Either the rate the chemical enters the atmosphere or the burn rate,
depending on the scenario. A chemical may escape very quickly
(so that source strength is high), as when a pressurized container is
ruptured, or more slowly over a longer period of time (so that
source strength is low), as when a puddle evaporates.
Stability class
See Atmospheric stability.
Stable
The atmosphere is stable when little air turbulence exists, so that
there is little tendency for air to be mixed into a dispersing
pollutant cloud.
183
Glossary
Standard deviation
A measure of the degree to which individual values deviate from
an average value. Computed as the square root of the sum of the
squared deviations divided by the number of measurements.
STP
Standard Temperature and Pressure. Physical properties, such as
boiling point, are often expressed at standard temperature (0°C)
and standard pressure (1 atmosphere).
Street canyon
A street bordered along both sides by high-rise buildings that
block air movement, so that the wind and any dispersing pollutant
cloud are channeled down the street.
Sublimation
A frozen substance sublimates when it passes directly into the gas
phase without first becoming liquid.
TEELs
Temporary Emergency Exposure Limits (TEELs) are temporary
Toxic Levels of Concern (LOCs) similar to ERPGs, and defined
by the U.S. Department of Energy for use when ERPGs aren't
available. Unlike AEGLs and ERPGs, TEELs are not peerreviewed, and are intended as temporary guidance. AEGLs,
ERPGs, and TEELs do not incorporate safety factors. Rather, they
are designed to represent the predicted response of members of the
general public to different concentrations of a chemical during an
incident.
Terrain steering
The way in which land features, such as hills and valleys, modify
the speed and direction of air flow.
Thermal radiation
Heat released during a fire and explosion that may pose a hazard
to people and structures. The effects people experience will
depend on both the level of thermal radiation and the length of
time they are exposed to it.
184
Glossary
Threat at Point
ALOHA can model one or more of the following hazards: toxicity,
flammability, thermal radiation, or overpressure. Once you have
displayed a hazard on a threat zone plot, you can use the Threat at
Point option to obtain specific information about the hazards at
points of interest (such as schools and hospitals) in and around the
threat zones.
Threat distance
The downwind distance along the centerline of a chemical cloud,
out to the level of concern that you set. ALOHA's threat zone
lengths, reported in the Text Summary window, are threat
distances.
Threat zone
Area within which the hazard level (toxicity, flammability,
thermal radiation, or overpressure) is predicted to exceed your
Level of Concern (LOC) at some time after a release begins. You
may specify up to three LOCs in ALOHA. If three LOCs are
chosen, ALOHA will display the threat zones in red, orange, and
yellow, overlaid on a single threat zone plot. By default, the red
zone represents the worst hazard.
Time-dependent
dispersion
A time-dependent value is something that changes over time.
ALOHA's dispersion predictions account for release rates that
change over time; in this sense, these predictions are timedependent. However, ALOHA does not account for changing
atmospheric conditions when predicting dispersion: in this sense,
its predictions are not time-dependent.
Time-dependent
source
A release rate that changes over time. For example, release rate
from a pressurized tank declines over time as tank pressure drops.
185
Glossary
Two-phase flow
Both the liquid and gas phases of a chemical sometimes can
escape together from a ruptured tank or pipeline as a two-phase
flow. Many substances that are gases under normal pressures and
temperatures are stored under high enough pressures to liquefy
them. For example, ammonia is a gas at normal pressures and
temperatures but is often stored under pressure as a liquid. When a
rupture or broken valve causes a sudden pressure loss in a tank of
liquefied gas, the liquid boils violently, the tank contents foam up,
and the tank fills with a mixture of gas and fine liquid droplets
(called aerosol). When such a two-phase mixture escapes from the
container, the release rate can be significantly greater than that for
a purely gaseous release.
Unstable
The atmosphere is unstable when substantial air turbulence exists,
so that there is a strong tendency for air to be mixed into a
dispersing pollutant cloud.
Upper Explosive
Limit (UEL)
The Upper Explosive Limit (UEL), also called the Upper
Flammability Limit, is the maximum concentration of fuel in the
air that can sustain a fire or an explosion if an ignition source is
present. If the concentration is above the UEL, there is not enough
oxygen to sustain a fire or an explosion—it is too rich (much like
an engine that cannot start because it has been flooded with
gasoline). The UEL is determined experimentally using standard
temperature and pressure settings. Additionally, if the fuel
concentration in the air falls below the Lower Explosive Limit
(LEL), then a fire (or an explosion) cannot occur.
Urban or Forest
An area of relatively high ground roughness, such as residential
housing developments, industrial areas, or forests.
Vapor
The gas produced by the evaporation of a liquid (or sublimation of
a solid). For example, the gas produced when liquid water
evaporates is water vapor.
186
Glossary
Vapor cloud explosion
When a flammable chemical is released into the atmosphere, it
forms a vapor cloud that will disperse as it travels downwind. If
the cloud encounters an ignition source, the parts of the cloud
where the concentration is within the flammable range (between
the Lower and Upper Explosive Limits) will burn. The speed at
which the flame front moves through the cloud determines
whether it is a deflagration or a detonation. In some situations, the
cloud will burn so fast that it creates an explosive force (blast
wave). Two primary hazards are associated with a vapor cloud
explosion: overpressure and hazardous fragments.
Vapor pressure
Vapor pressure is a property of a liquid. At equilibrium, molecules
move from the liquid to the gas phase at the same rate as they
return to the liquid from the gas phase. The vapor pressure is a
measure of the concentration of gas-phase molecules in the air
directly in contact with the liquid, at equilibrium. In most actual
cases equilibrium is not reached so the vapor pressure represents
the limiting value for chemical concentration in the air.
Volatility
The tendency of a liquid (or solid) to form a vapor (evaporate).
Wind direction
The direction from which the wind is blowing.
Wind Rose
For ALOHA's purposes, a diagram displaying recent
measurements of average wind speed and direction at a location
when a SAM is used.
Zo
See Roughness length.
187
Glossary
188
Index
A
BLEVE
explanation of: 25
fireball: 25
hazardous fragments: 25
boiling point: 171
Building Type menu item: 104–105
air exchange rate: 105
choice of building: 104
surroundings: 105
burning puddle: See pool fire.
byproducts: 31
accuracy: 15
advection: 16
AEGLs: 44, 169
aerosol
definition of: 169
heavy gas: 17
jet fire: 24
Tank source: 137
air dispersion model: 15
air exchange rate: 105
air temperature: 118
ALOHA
basic organization: 11
choosing a model: 148
duration limits: 129
help: 14
limitations of: 28–31
menu bar: 13
purpose of: 11
save files: 100
ambient saturation concentration: 109
anhydrous: 170
Atmospheric menu item
SAM Station: 122–127
User Input: 113–121
atmospheric stability
definition of: 170
very stable conditions: 28
See also stability class.
atmospheric transmissivity: 121
autoignition temperature: 19
C
Calculation Options menu item: 148
CAMEO: 159
carcinogen: 110
chemical
adding to library: 112
deleting from library: 113
flammable and toxic: 19
library (ChemLib): 107
mixtures: 31
modifying library: 112
properties needed table: 111
reactive chemicals: 31, 109
selecting a chemical: 108
selecting a solution: 108
CityLib: 101
cloud cover: 118
concentration
average: 30
definition of: 172
patchiness near source: 30
Threat at Point: 155
Concentration at Point graph: 155
concentration patchiness: 26, 30
B
blast force: See overpressure.
blast wave: See overpressure.
189
Index
confidence lines
threat zone plot: 152
very low wind speeds: 28
confinement: 27
congested: 27
congestion: 27
conservative: 172
continuous release: 131
Coordinated Universal Time: 176
coordinates, fixed: 154
coordinates, relative: 154
Copy menu item: 100
crosswind: 16
cryogenic
definition of: 172
heavy gas: 17
Puddle source: 135
Tank source: 144
dispersion
choice of model: 18
dispersion modeling: 15–18
Gaussian: 16
heavy gas: 17
particulates: 31
radioactive particles: 31
stability class: 119
street canyon: 29
terrain steering: 29
Display menu: 149–158
Display Options menu item: 158
display units: 158
double-storied building: 105
E
eddies: 29, 174
Edit menu: 100
elevation: 102
English units: 158
ERPGs: 174
evaporating puddle: See puddle evaporation.
Exit menu item: 100
explosion
explanation of: 21
hazardous fragments: 23
overpressure: 21
thermal radiation: 21
D
Date & Time menu item: 106
daylight savings time
at non-U.S. locations: 104
at U.S. locations: 103
definition of: 173
multiple time zones: 103
deflagration explosion: 27
DEGADIS model: 17
dense gas dispersion: 17
density: 173
detonation explosion: 27
diffusion: 16
Direct source: 130–132
continuous release: 131
instantaneous release: 131
source height: 132
threat zones: 131
F
File menu: 99–100
fire
explanation of: 19
fuel triangle: 19
thermal radiation: 20
toxic byproducts: 19
fireball: 25
190
Index
fires and explosions
ALOHA scenarios: 23–27
flammable-toxic chemicals, 19
introduction to: 18–23
sources and scenarios table: 18
flame jet: See jet fire.
flame pockets: 26
flammability limits: 19
flammable area
explanation of: 26
flame pockets: 26
flammable: 174
flash fire: 26
flash point: 19
flash-boil
BLEVE: 25
definition of: 175
heavy gas: 17
flying debris: See hazardous fragments.
footprint: 12
freezing point: 175
fuel reactivity: 176
fuel triangle: 19
fugitive emissions: 15
fumes: 176
GIS: 153
GMT (Greenwich Mean Time): 103, 176
Greenwich Mean Time (GMT): 103, 176
ground roughness
about: 116
choosing a type: 116
roughness length: 117
ground temperature: 136, 145
ground type: 135, 145
G
IDLH: 178
ignition sources (common): 19
ignition time: 150
ignition type: 151
indoor pollutant concentration: 105, 155
infiltration rate: 105
instantaneous release: 131
inversion: 120
H
hazardous fragments
BLEVE: 25
definition of: 177
explanation of: 23
from overpressure: 21
heavy gas
definition of: 177
dispersion: 17
inversions: 121
properties needed: 111
Help, on-screen: 14
humidity: 121
I
Gas Pipeline source: 146–147
hole size: 147
infinite reservoir: 146
pipe diameter: 146
pipe length, troubleshooting: 164
pipe length: 146
pipe pressure: 147
pipe roughness: 146
pipe temperature: 147
Text Summary: 147
Gaussian
definition of: 176
dispersion: 16
J
jet fire: 24
191
Index
L
O
latitude: 102
Level of Concern (LOC)
default toxic LOC: 150
in Text Summary: 110
overpressure: 22
thermal radiation: 20
threat zone: 150
toxic hierarchy: 110
liquefied gas: 137, 179
Location menu item
adding a non-U.S. location: 103
adding a U.S. location: 102
CityLib: 101
deleting a location: 104
modifying a location: 104
selecting a location: 101
sun angle: 101
longitude: 102
Lower Explosive Limit (LEL): 19, 26
Lower Flammable Limit (LFL): 26
low-level inversion: 121
office building (enclosed): 105
open country ground roughness: 116
Open menu item
planning mode: 99
response mode: 99
saved file: 99
open water ground roughness: 116
output units: 158
overpressure
damage table: 22
definition of: 180
explanation of: 21
Levels of Concern: 22
P
partial pressure: 180
particulates: 181
parts per billion (ppb): 181
parts per million (ppm): 181
patchiness (concentration): 30
pipe racks: 27
planning mode: 99
plume rise: 181
plume: 181
pool fire: 24
pressure wave: See overpressure.
Print menu items: 100
puddle evaporation
about: 133
air temperature: 118
cloud cover: 118
sun angle: 101
terrain: 31
Puddle source: 132–136
area and volume of: 135
evaporating puddle: 133
ground temperature: 136
ground type: 135
initial temperature: 136
type of puddle: 133
M
MARPLOT
menu: 160
threat zone: 161
troubleshooting
SAM: 165
Set Source Point: 165
threat zone: 165
using: 160
Max Average Sustained Release Rate: 130
Max Burn Rate: 130
melting point: 175
Metric units: 158
N
near-field patchiness: 30
neutrally buoyant gas: 16, 17
New menu item: 99
192
Index
Q
SiteData menu: 101–106
solubility: 182
solution strength
definition of: 183
entering: 108
solutions: 183
Source
about: 128
Direct source: 130–132
duration limits: 129
Gas Pipeline source: 146–147
Puddle source: 132–136
release rate: 130
sources and scenarios table: 128
Tank source: 136–145
source height: 132
source strength
about: 156
averaging: 158
constant: 157
variable: 157
stability class
about: 119
overriding ALOHA: 120
wind speed table: 120
Stack Windows menu item: 158
street canyon: 29, 184
sublimation rate: 134
Quit menu item: 100
R
radioactive particles: 31
rainout: 181
release rate: 130
Response Information Data Sheets: 159
response mode: 99
RIDS: 159
roughness element: 116
roughness length (Zo): 117
S
SAM
choosing a SAM: 122
data codes: 122
dialog boxes: 124
radio frequency: 123
serial port: 123
sigma theta: 126
transmitting data: 122
troubleshooting: 164
using during an incident: 123, 127
SAM Options menu
about: 124
Archive Data menu item: 125
Processed Data menu item: 126
Raw Data menu item: 126
Wind Rose menu item: 127
SAM Station menu item: 122–127
Save and Save As menu items: 100
save file
definition of: 182
opening: 99
serial port: 123
SetUp menu: 107–149
Sharing menu: 159–161
sheltered surroundings: 105
shock wave: See overpressure.
single-storied building: 105
T
Tank source: 136–145
BLEVE: 141
chemical state: 138
contains gas: 140
contains liquid: 139
describing the leak: 143
fireball: 142
ground temperature: 145
ground type: 144
height of leak: 144
leaking tank: 141
liquefied gases: 137
193
Index
orientation of: 138
puddle area: 145
puddles: 137, 144
size of: 138
storage temperature: 139
type of tank failure: 141
TEELs: 184
terrain (effect on puddles): 31
terrain steering: 29, 184
Text Summary
about: 156
chemical data: 109
Gas Pipeline source: 147
notes: 110
thermal radiation
burn injury table: 20
definition of: 184
Levels of Concern: 20
transmissivity: 121
Threat at Point
about: 153
fixed coordinates: 154
MARPLOT: 161
relative coordinates: 154
results: 154
threat distance
definition of: 185
example of: 60
threat zone
colors: 152
displaying in other applications: 153
flammable vapor clouds: 149
interpreting: 153
Level of Concern: 150
MARPLOT: 161
menu item: 149
plot: 152
threat zone plot: 152
Tile Windows menu item: 158
timestep: 130
toxic byproducts from fire: 19
two-phase flow
definition of: 186
heavy gas: 17
Tank source: 137
U
uncertainty lines: See confidence lines.
uncongested: 27
unsheltered surroundings: 105
Upper Explosive Limit (UEL): 19, 26
Upper Flammable Limit (UFL): 26
urban or forest ground roughness: 116
User Input menu item: 113–121
V
vapor cloud explosion
congestion level: 151
deflagration and detonation: 27
explanation of: 26
ignited by detonation: 151
ignition time: 150
ignition type: 151
threat zone: 150
ventilation systems: 105
volatility: 19
volume blockage ratio: 27
W
wind
direction: 115
eddies: 174
estimating speed: 114
measurement height: 115
one-hour duration: 30
profile: 115
stability class: 120
terrain steering: 29
very low speeds: 28
Wind Rose menu item: 127
194
Index
Z
Zo (roughness length): 117
195