1
PSoC Based Blood Pressure Monitor
By
Escares, Jonas T.
Garcia, Arben M.
Geronimo, Edzel P.
Regala, Jerby C.
A Design Report Submitted to the School of Electrical Engineering,
Electronics and Communications Engineering, and Computer
Engineering in Partial Fulfillment of the Requirements for the Degree
Bachelor of Science in Computer Engineering
Mapua Institute of Technology
April 2009
ii
ACKNOWLEDGMENT
The group would like to acknowledge and extend their deepest gratitude
to the following who have contributed to the development of the project.
First and foremost, our Heavenly Father, for giving them the knowledge,
wisdom, and strength to finish the design and other requirements on time;
Engr. Noel B. Linsangan, for allowing them to pursue this study, and
giving advice, guidance, and consideration to assure the success of the project
design;
Engr. Cyrel C. Ontimare, for sharing her expertise and experience which
gave them the confidence and inspiration; and also for spending her time in
meetings and consultations which the team needed;
Prof. Filomena J. Berenguela, for guiding them in constructing their
paragraphs and checking the grammar of their documents;
And lastly, to their respective parents/guardians’ support throughout the
development of the design.
iii
TABLE OF CONTENTS
TITLE PAGE
i
APPROVAL SHEET
ii
ACKNOWLEDGEMENT
iii
TABLE OF CONTENTS
iv
LIST OF TABLES
vi
LIST OF FIGURES
vii
ABSTRACT
viii
Chapter 1:
DESIGN BACKGROUND AND INTRODUCTION
1
Introduction
The Design Setting
Statement of the Problem
The Objective of the Design
The Significance of the Study
Conceptual Framework
The Scope and Delimitation
Definition of Terms
1
3
4
5
5
6
7
9
Chapter 2:
REVIEW OF RELATED LITERATURE AND RELATED STUDIES 14
Chapter 3:
DESIGN METHODOLOGY AND PROCEDURES
22
Design Methodology
Design Procedure
Design Procedure for Actual Design
Hardware Design
List of Materials
Hardware Component
Circuit Design
Hardware Implementation
Software Design
Software Component
System Flowchart
Prototype Development
22
22
24
25
28
29
30
31
31
31
32
35
iv
Chapter 4:
Chapter 5:
TESTING, PRESENTATION, AND INTERPRETATION OF DATA 36
Testing of Accuracy
Testing of Reliability
36
44
CONCLUSION AND RECOMMENDATION
47
Conclusion
Recommendation
47
47
BIBLIOGRAPHY
49
APPENDICES
50
Appendix
Appendix
Appendix
Appendix
Appendix
Appendix
Appendix
Appendix
A
B
C
D
E
F
G
H
Circuit/Schematic Diagram
Source Code
Actual Photo
28Pin CY8C29466 Datasheet
LM324 Datasheet
MPS-2000 Pressure Sensor Datasheet
L78XX Voltage Regulator Datasheet
User’s Manual
50
53
71
74
82
84
87
93
v
LIST OF TABLES
Table
Table
Table
Table
Table
Table
Table
Table
Table
Table
3.1:
4.1:
4.2:
4.3:
4.4:
4.5:
4.6:
4.7:
4.8:
4.9:
List of Materials and Cost
Classifications of Blood Pressure for Adults
Test Results of Test Subject A
Test Results of Test Subject B
Test Results of Test Subject C
Test Results of Test Subject D
Computed Average of Test Results
Computed Percentage Errors for Accuracy
Test Results for Reliability Testing
Computed Percentage Errors for Reliability
28
38
39
39
41
42
43
44
45
46
vi
LIST OF FIGURES
Figure
Figure
Figure
Figure
Figure
Figure
Figure
Figure
Figure
Figure
Figure
Figure
Figure
Figure
Figure
1.1:
2.1:
2.2:
3.1:
3.2:
3.3:
3.4:
3.5:
6.1:
6.2:
6.3:
6.4:
6.5:
6.6:
6.7:
Conceptual Framework of the System
Indirect Blood Pressure Measurements
Hardware Block Diagram of SE-1000
Design Procedure Flowchart
Block Diagram of Hardware Design
Schematic Diagram of the Design
System Flowchart of the Design Prototype
Actual Photo of the Prototype
Schematic Diagram of the Design Prototype
PCB Layout with Components of the Design
PCB Layout of the Design
Internal View of the Prototype
Top View of the Prototype
Front View of the Prototype
Back View of the Prototype
6
15
18
23
27
30
34
35
51
52
52
72
72
73
73
vii
ABSTRACT
The design study is all about PSoC based Blood Pressure Monitor. It is
developed using a Programmable System on Chip which is being manufactured
by Cypress Semiconductor Corporation. The systolic, diastolic and the pulse rate
reading are displayed on a Liquid Crystal Display or LCD making it digital. The
date and time is present in the display. It can also store the readings with the
date and time information included. Also, this prototype has a battery
rechargeable function. The purpose of the design is to create a low cost design
and to enhance the functionality of the blood pressure meter in the market using
the PSoC microcontroller. The design is conducted by gathering related literature
and studies which was used in determining the features that is needed in the
design. It is followed by creating the circuit diagram, studying the program to be
used and developing the design with all the gathered components. After
developing the design and did actual testing, the group can say that the
accuracy of the design is almost the same with the existing blood pressure
monitor in the market. The functionality of the design and all of its features are
properly working.
Keywords: Programmable System on Chip, systolic, diastolic, pulse rate,
rechargeable
viii
CHAPTER 1
DESIGN BACKGROUND AND INTRODUCTION
Introduction
Hypertension, or commonly referred to as high blood pressure, is one of
the most serious conditions our society is facing nowadays. It is dangerous in a
sense that it can lead to coronary heart disease, heart failure, stroke, kidney
failure, and other health problems. “Blood pressure” is the force of blood pushing
against the walls of the arteries as the heart pumps out blood. When this
pressure rises and stays high over time, it can damage the body in many ways.
There is a device that monitors the blood pressure condition of a person
and that is the blood pressure meter. A blood pressure meter is a device used to
measure blood pressure, comprising an inflatable cuff to restrict blood flow, and
a mercury or mechanical manometer to measure the pressure. It is always used
in conjunction with a means to determine at what pressure blood flow is just
starting, and at what pressure it is unimpeded. The device was invented by
Samuel Siegfried Karl Ritter von Basch. Scipione Riva-Rocci, an Italian physician,
introduced a more easily used version in 1896. Harvey Cushing discovered this
device
in
1901
and
popularized
it.
This
device
is
also
known
as
sphygmomanometer, which came from the Greek word sphygmós or pulse, plus
the scientific term manometer which is a pressure meter.
A sphygmomanometer usually consists of an inflatable cuff, a measuring
unit, a tube to connect the two, and an inflation bulb also connected by a tube to
1
the cuff which is commonly found in models that don't inflate automatically. The
inflation bulb contains a one-way valve to prevent inadvertent leak of pressure
while there is an adjustable screw valve for the operator to allow the pressure in
the system to drop in a controlled manner. This device had been improved to
different kind of models that include application of modern technology having
microcontrollers in it.
Developing a digital blood pressure meter that does the same job as what
the analog devices do will have numerous advantages. There are existing digital
blood pressure meters but these are expensive because of the microcontrollers
and components used in these devices. That is why innovating the existing blood
pressure monitor that uses PSoC or the Programmable System on Chip will be
very efficient in terms of its functionality, portability and cost effectiveness. It
will read and display the pressure through the blood pressure cuff getting its
systolic and diastolic pressure. Systolic blood pressure is the pressure when the
heart beats while pumping blood. Diastolic blood pressure is the pressure when
the heart is at rest between beats. The unit of measurement for blood pressure
reading is millimeters of mercury (mmHg). The blood pressure readings can be
classified according to the range of systolic and diastolic reading to determine if
it is normal, hypotension or hypertension condition (see Table 4.1). The pulse
rate reading can be measured and can be classified if the user has bradycardia,
tachycardia or has normal pulse rate.
2
The Design Setting
Developing this PSoC based Blood Pressure Monitor will help avoid high
blood pressure condition. It can be used in monitoring the blood pressure status
of a person so that they are always aware of their heart condition even when
they are at home, office, or anywhere since this design is portable. The design is
also easy to use as compared to the usual blood pressure device because it is
automatic, meaning there is no need to pump air manually and to be
knowledgeable on how to use a stethoscope. By pushing the start button, the
design will automatically pump air and display the result in systolic and diastolic
reading as well as the pulse rate reading.
The user of the existing blood pressure meter in the market either analog
or digital requires them to record the readings that they got so that there is still
a record for future comparison of their blood pressure measurements. Doing this
design study will make it easier for them to automatically record and view their
blood pressure measurements.
In addition, current digital blood pressure meter in the market are quite
expensive and uses only a battery to make them work. This design would
enhance the usability and reliability of blood pressure meter by making it
rechargeable.
3
Statement of the Problem
High blood pressure is a serious condition that tends to rise with age. A
healthy lifestyle can prevent it but there is always a need to monitor our heart’s
condition. Having a personal blood pressure meter is a good way of monitoring
blood pressure.
At present, people spend their money on cheaper products without
considering the efficiency and functionality of the product. When it comes to
blood pressure meter, an aneroid blood pressure meter is still being used and
available at home because of its cheaper price compared to the digital blood
pressure meter. This requires a medical knowledge and a stethoscope in using
this device, and a companion who will assist you while getting the readings.
Although there is already an existing digital blood pressure meter in the
market which is easier to use, the price is not affordable. The company who
manufactures this device uses microcontrollers and other components that make
it expensive. People who will buy this device will spend more money in
maintaining its functionality and usability because it requires a battery to make it
work.
Due to the problems that arise, our group needs to create a low cost
digital blood pressure monitor that can reassure the user of its accuracy,
efficiency and reliability.
4
The Objective of the Design
The main objective of this design is to create a low-cost digital blood
pressure monitor prototype using Programmable System on Chip or PSoC
microcontroller. The group considered the following to implement the design
project:
1. To be able to store systolic reading, diastolic reading and pulse rate
reading.
2. To be able to store the readings into four different memory modules that
contain the date and time it was taken.
3. To be able to design a prototype that will work using either a battery
supply or a direct power supply as its main power source.
4. To be able to incorporate rechargeability feature through the use of
rechargeable battery supply.
The Significance of the Study
Having this design done will be very beneficial to people especially to
those who suffer high blood pressure condition. This study promotes health
awareness to people and that they can monitor their own blood pressure using
this prototype. Using this would be simple and some features were enhanced
making it valuable. This was created to minimize the expenses of the people who
are using a battery operated blood pressure meter which costs much and not
environment friendly. Through this study, the group was able to apply their
5
technical skills and knowledge learned not just in engineering but also their
research in the field of health and science.
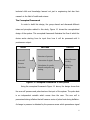
The Conceptual Framework
In order to build this design, the group shared and discussed different
ideas and principles related to this study. Figure 1.1 shows the conceptualized
design of the system. This conceptual framework illustrates the flow of which the
device works starting from its input then how it will be processed until it
produces an output.
INPUT
PROCESS
OUTPUT
Detection of pressure
Arm cuff
Pressure
Pulse Beat
Conversion of signal
Blood Pressure
reading
Calculation of systolic,
diastolic and pulse rate
reading
Pulse Rate
reading
Figure 1.1 Conceptual Framework of the System
Using the conceptual framework Figure 1.1 above, the design shows that
the arm cuff pressure and pulse beat are the input of the system. The pulse beat
is an independent variable which comes from the user. The arm cuff is
pressurized during inflation that will cause a series of pulse beat during deflation.
A change in pressure is detected by the pressure sensor which generates a signal
6
that will pass to the operational amplifier. The process of converting the signal
from analog to digital takes place in the microcontroller. The calculation of the
systolic, diastolic and pulse rate is also processed in the PSoC microcontroller.
The process will continue until deflation is finished. After the systolic, diastolic
and pulse rate has been determined, it will be sent to the LCD to display the
blood pressure reading and the pulse rate reading.
The Scope and Delimitations
The design will cover innovation and development of the Programmable
System on Chip based Blood Pressure Monitor. The group has set the scope and
delimitation of the design as follows:
The Scope:
1. The design uses a PSoC microcontroller as a substitute to the usual
microcontroller used in the market.
2. The blood pressure monitor works automatically once started.
3. The blood pressure monitor can also determine and display the pulse rate
reading.
4. It can record blood pressure reading and pulse rate reading including the
date and time it was taken.
5. It can record 30 blood pressure readings on each memory modules.
6. It consists of 4 memory modules which are A, B, C and D.
7. An indicator SA that means save is displayed every after blood pressure
reading.
7
8. An indicator EE that means error is displayed if the reading is out of range.
9. The prototype uses a rechargeable battery and a 6V-12V adaptor.
10. The prototype still works while charging.
11. The date and time can be set manually and updates automatically.
12. There is a light indicator when the prototype is charging.
13. There is a display indicator when the battery is drained or emptied.
Delimitations:
1. The battery should not be emptied so that the records in the memory will not
be deleted.
2. The blood pressure monitor can only record up to a maximum of 120
readings.
3. The maximum range of the blood pressure reading is up to 190 mmHg.
4. The time setting in the device uses only 24 hour military time.
5. The arm cuff cannot be detached from the main device.
7. The prototype is unable to determine and display the hypertension
classification of the reading.
8. The prototype has a preset of memory locations A, B, C, and D and cannot
store names as indicator for each memory module.
9. There is no indicator when the battery is fully charged.
10. There is no display indicator of how much battery charge is remaining.
8
Definition of Terms
Adaptor is a device connecting electric appliances to a single socket. (Oxford,
2007).
Amplitude is the maximum value of a signal. (Alexander and Sadiku, 2003).
Artery is one of the tube-shaped blood vessels that carries blood away from the
heart; these are thick-walled, flexible and muscular. (Brueschke, 1993).
Auscultation is the technical term for listening to the internal sounds of the
body using a stethoscope. Auscultation is performed for the purposes of
examining the circulatory system and respiratory system (heart sounds and
breath sounds), as well as the gastrointestinal system (bowel sounds).
(Brueschke, 1993).
Bradycardia occurs when the pulse rate is below 60 per minute. (Brueschke,
1993).
Battery is a device containing electrical cells or cells used as a source of power.
(Oxford, 2007).
Brachial Artery is the major blood vessel of the upper arm. (Brueschke, 1993).
Blood Pressure is the pressure blood against the walls of the arteries.
(Brueschke, 1993).
Blood Pressure Meter also called as sphygmomanometer; is a device used to
measure blood pressure, comprising an inflatable cuff to restrict blood flow, and
a mercury or mechanical manometer to measure the pressure. It is always used
in conjunction with a means to determine at what pressure blood flow is just
9
starting, and at what pressure it is unimpeded. Manual sphygmomanometers are
used in conjunction with a stethoscope. (Brueschke, 1993).
Blood Vessel is any tube in the body through which blood circulates. The most
important vessels in the system are the capillaries, the microscopic vessels which
enable the actual exchange of water and chemicals between the blood and the
tissues, while the conduit vessels, arteries and veins, carry blood away from the
heart and through the capillaries or back towards the heart, respectively.
(Brueschke, 1993).
Capacitor is a passive element designed to store energy in its electric field, the
most common electrical components. It is consisted of two conducting plates
separated by an insulator (or dielectric). (Alexander and Sadiku, 2003).
Deflate means to let out air or gas from an inflatable object with the result that
it shrinks or collapses, or lose air or gas. (Encarta, 2007).
Diastole is the normal period of relaxation of the heart muscles. The diastolic
blood pressure is the point of least pressure in the arteries, because blood is not
being pumped by the heart during this phase. (Brueschke, 1993).
Diode is a semiconductor device with a single pn junction that conducts current
in only one direction. (Floyd, 2002).
Fuse is a protective device that burns open when the current exceeds a rated
limit. (Floyd, 2002).
Hypertension is a condition in which a person’s blood pressure is persistently
above normal. (Brueschke, 1993).
10
Hypotension is a condition in which the blood pressure is reduced or below
normal. (Brueschke, 1993).
Inflate means to fill something such as a ball, mattress, tire, or boat with air or
gas to bring it to the proper size, shape, and firmness for use, or to become filled
with air or gas. (Encarta, 2007).
Korotkoff Method is a non-invasive auscultatory technique for determining
both systolic and diastolic blood pressure levels. The method requires а
sphygmomanometer and а stethoscope. Due to ease and accuracy, it is
considered a "gold standard" for blood pressure measurement. (Brueschke,
1993).
Korotkoff Sounds are the sounds that medical personnel listen for when they
are taking blood pressure using non-invasive measurement. (Brueschke, 1993).
LED (Light Emitting Diode) is a type of diode that emits light when there is
forward current. (Floyd, 2002).
Manometer could also be referring to a pressure measuring instrument, usually
limited to measuring pressures near to atmospheric. The term manometer is
often used to refer specifically to liquid column hydrostatic instruments. (Encarta,
2007).
Microcontroller consists of an integrated CPU, memory (a small amount of
RAM, program memory, or both) and peripherals capable of input and output. A
microcontroller (also MCU) is a functional computer system-on-a-chip. (Ashby,
2005).
11
Normal Pulse Rate for a healthy adult, while resting, can range from 60 to 100
beats per minute (BPM), although well-conditioned athletes may have a healthy
pulse rate lower than 60 BPM. During sleep, the pulse can drop to as low as 40
BPM; during strenuous exercise, it can rise as high as 150–200 BPM. Generally,
pulse rates are higher in infants and young children. The resting heart rate for an
infant is usually close to an adult's pulse rate during strenuous exercise (average
110 BPM for an infant). (Brueschke, 1993).
Occlusion is an obstruction or a closure of a passageway or vessel. (Brueschke,
1993).
Operational Amplifier which is often called an op-amp is a DC-coupled highgain electronic voltage amplifier with differential inputs and, usually, a single
output. (Floyd, 2002).
Pressure is an expression of the force required to stop a fluid from expanding,
and is usually stated in terms of force per unit area. (Encarta, 2007).
Pressure Sensor generates a signal related to the pressure imposed. Typically,
such a signal is electrical, but optical, visual, and auditory signals are not
uncommon. (Encarta, 2007).
PSoC (Programmable System on Chip) is a device, configurable mixed
signal arrays that integrate the microcontroller and related peripheral circuits
typically found in an embedded design. (Ashby, 2005).
Pulse is the rhythmical expansion and contraction of an artery that can be felt
near the surface of the body. It can be palpated in any place that allows for an
12
artery to be compressed against a bone, such as at the neck (carotid artery), at
the wrist (radial artery), behind the knee (popliteal artery), on the inside of the
elbow (brachial artery), and near the ankle joint (posterior tibial artery). The
pulse rate can also be measured by measuring the heart beats directly (the
apical pulse). (Brueschke, 1993).
Relay is essentially an electromagnetic device used to open or close a switch
that controls another circuit. (Alexander and Sadiku, 2003).
Resistor is the simplest passive element. It is a device that has the ability to
resist the flow of electric current that is measured in ohms. It is usually made
from metallic alloys and carbon compounds. (Alexander and Sadiku, 2003).
Solenoid Valve is an electromechanical valve used for liquid or gas controlled
by running or stopping an electric current through the solenoid, which is a coil of
wire, thus changing the state of the valve. (Encarta, 2007).
Stethoscope is an instrument for listening to the internal sounds of the body.
(Brueschke, 1993).
Systole is the contraction of the heart muscle that causes the forceful ejection
of blood into the arterial system. (Brueschke, 1993).
Tachycardia occurs when the pulse rate is above 100 BPM. (Brueschke, 1993).
Transistor is a semiconductor device commonly used for amplification or
switching appliances. (Floyd, 2002).
Voltage Regulator is an electrical device that maintains an essentially constant
output voltage for a range of input voltage or load values. (Floyd, 2002).
13
Chapter 2
REVIEW OF RELATED LITERATURE AND RELATED STUDIES
The concept of doing the system of the design was brought up through
the ideas of the existing studies and principles from related literatures while
conducting the research.
According to the concepts from the book Blood Pressure Measurements by
Shyam Rithalia, et al. in 2000 stated that indirect measurement is often called as
non-invasive blood pressure measurement. The upper arm, containing the
brachial artery, is the common site for indirect measurement because of its
closeness to the heart and convenience of measurement, although many other
sites may have been used such as forearm or radial artery, finger etc. Distal sites
such as the wrist may give much higher systolic pressure than brachial or central
sites as the result of the phenomena of impedance mismatch or reflective waves
(Saul, 1995). A cuff is normally placed over the upper arm and is inflated to a
pressure greater than the systolic blood pressure. The cuff is then gradually
deflated, while a detector system simultaneously employed determines the point
at which the blood flow restored to the limb.
The author explained non-invasive blood pressure measurement as well
the comparison of upper arm and wrist in getting blood pressure. These
concepts were used and gave the group an idea of implementing the design
using the upper arm as the source of indirect blood pressure measurement.
14
There are two common methods of indirect blood pressure measurement
that we have learned based from the Blood Pressure Measurements book. These
methods were analyzed and studied by the group to determine the method that
is applicable to our design.
Auscultatory method uses sphygmomanometer, a cuff and a stethoscope.
The stethoscope is placed over the blood vessel for auscultation of the Korotkoff
sounds, which defines the systolic pressure and diastolic pressure. The Korotkoff
sounds are mainly generated by the pulse wave propagating through the brachial
artery. The Korotkoff sounds consist of five phases. The onset Phase I Korotkoff
sounds (first appearance of clear, repetitive tapping sounds) signifies systolic
pressure and the onset of Phase V Korotkoff sounds (sounds disappear
completely) often defines diastolic pressure.
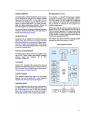
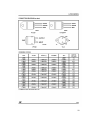
Figure 2.1 Indirect Blood Pressure Measurements
15
The Figure 2.1 illustrates the methods for indirect blood pressure
measurements. It shows how the pressure wave or sound wave moves during
the process of detecting the blood pressure. The information illustrated was used
in the study to understand the behavior of the signal from the pressure in the
arm cuff during the deflation period at a given pressure.
In recent years, electronic pressure and pulse monitors based on
oscillometry have become popular for their simplicity of use and reliability. The
measurement principle of the Oscillometric Method is a measurement of the
amplitude of the pressure change in the cuff as it is inflated from above the
systolic pressure. The amplitude suddenly grows larger as the pulse breaks to
the occlusion. This is very close to systolic pressure. As the cuff pressure is
further reduced, the pulsation increase in amplitude reaches a maximum and
then diminishes rapidly. The index of the diastolic pressure is taken where this
rapid transition begins. Therefore, the systolic blood pressure and diastolic blood
pressure is obtained by identifying the region where there is a rapid increase
then decrease in the amplitude of the pulses respectively. An approach using this
technique could start with a cuff placed around the upper arm and rapidly
inflated to about 30 mmHg above the systolic blood pressure, occluding blood
flow to the brachial artery (Rithalia et al., 2000).
It is important to know on how blood pressure is measured using those
two techniques. The oscillometric method is the technique which was used to the
design because of its simplicity to use. There is no need for a small improvised
16
stethoscope to determine which Korotkoff sound is the systolic and diastolic but
instead a pressure sensor will be used in the arm cuff of the design to determine
the amplitude of the pressure during deflation. This information helped the group
to understand the principles in getting the blood pressure measurements
automatically.
A study entitled “Development of Automatic Blood Pressure Meter at
Home” by Nan H. Kim, et al. published in Annual International Conference of the
IEEE Engineering in Medicine and Biology Society (1990), it is stated that most
clinical
measurements
of
arterial
blood
pressure
are
made
by
sphygmomanometer. Automated blood pressure meter has been developed as a
substitute for the manual sphygmomanometer. The design in this study is named
SE-1000 which has been manufactured by Sein Electronic Co. in Korea.
Using oscillometric method and a microcomputer MN175451 the digital
blood pressure meter was developed to measure blood pressure automatically
and the composition of this equipment is divided into three parts such as
hardware, software and specifications how the blood pressure meter is
developed.
Using this article, it helped the group to bring out an idea on how the
design will be developed as shown in Figure 2.2 on page 18.
17
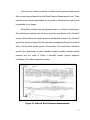
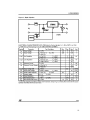
Figure 2.2 Hardware Block Diagram of SE-1000
The figure above gave the idea about the components that are going to
use for the design. It shows the different components used in SE-1000 such as
micro computer, LCD display, battery, speaker, power supply, motor, solenoid
valve, timer, pressure/frequency converter and cuff. It shows the interaction
between the components and the micro computer that was used. Some of the
components here were applied in the hardware construction of the design.
The software part in the article explains the controls on the hardware and
processes the input signal. These are the functions of the software of SE-1000
written in the article such as auto zeroing, auto power off, removal of artifacts,
display of the blood pressure and pulse rate readings. These functions that were
stated in the article are used to conceptualize the process and form the
programming part of the design.
18
The article also gave us the concept of improving the functions of this
study, and helped us to plan on how to record the measurements displayed from
the design. The function of SE-1000 is only to display the readings.
In the article “Oscillometric Blood Pressure Monitor Identification”
published in the journal 30th Annual International IEEE EMBS Conference by
Eduardo C. Pinheiro in year 2008, demonstrated a study and experiment that he
conducted. The experiments were conducted using a wrist-OBPM air pump KOGE
KPM14A, a KOGE KSV05A solenoid valve, the MEASUREMENT SPECIALITIES
1451 pressure sensor and a NATIONAL INSTRUMENTS USB-6008 Multifunction
I/O board with a defined sampling and writing rate of 50 Samples/second.
The OBPM identification tests were developed connecting the air flow
circuit output to a wrist inflatable cuff, and repeated in a constant volume
reservoir, to perceive the differences in the system behavior induced by the
reservoir inflation.
This information helped the researchers to know the type of motor and
valve that will be used in the design prototype. The idea of using KOGE as brand
of motor and solenoid valve was also adapted to our design to guarantee the
function of the inflation and deflation process. The motor to be used is important
in producing an air during the inflation process. Every motor has its own
specifications and pressure range. The solenoid valve is also needed to consider
in the design.
19
Another related study that was used in the design is the article entitled
“Integrating Analog and Digital Signal Conditioning in a Programmable System on
Chip” published by Dennis Seguine from IEEE journal in 2000, it is stated that
sensors
are
analog
and
modern
communication
methods
are
digital.
Programmable System on Chip (PSoC) mixed signal microcontrollers offer
interconnect and signal processing techniques for the design of very low cost
smart sensors. Interface requirements of the sensors drive the analog design of
the PSoC microcontroller application in multiplexer, amplifier, filter, and digitizing
methodologies to support creation of the basic blocks which can be configured to
meet system needs.
The group is going to use a pressure sensor that will be interfaced in a
CY8C29466 microcontroller. An example in the article uses a CY8C25xxx type of
PSoC microcontroller. The microcontroller architecture has analog module and
digital module. The analog functions are organized as groups of general purpose
analog blocks that can be configured into a user determined functions. The
controls of these blocks are register based and may be programmed or
reprogrammed by the user at run time. The analog array has twelve
programmable blocks that are connected to direct port inputs, input multiplexers,
column clock resources and output buffers.
The digital module blocks include preprogrammed functions for basic
timer, counter and pulse width modulator. Flexible interconnect to analog and
20
digital
blocks,
General
Purpose
Input/Output
(GPIO)
and
run-time
programmability makes the blocks an essential part of the analog acquisition.
These concepts about the analog and digital module of the PSoC
microcontrollers helped the group to understand how the analog to digital
conversion takes place after the pressure has been detected by the sensor.
Specialized features in the CPU of the PSoC include a decimator for conversion of
delta sigma Analog-Digital Converter outputs to parallel data. The idea on
interfacing the sensor of the design to a PSoC microcontroller was also learned
from the article.
In our design, the use of PSoC microcontroller offers a unique set of
flexible resources to accomplish sensor interface and system control. The ability
to reprogram analog and digital hardware functionality allows the design to be
implemented in a microcontroller.
21
Chapter 3
DESIGN METHODOLOGY AND PROCEDURES
Design Methodology
The design methodology used is developmental research. It is a process
of finding or developing a better design that has been available. Using this type
of research is important in improving this field of technology. The group research
focused on the different studies from the past up to the present in relation to the
design project. To further understand the design concepts, additional information
and concepts needed were gathered from books, journals and internet. The data
gathered provides a solution to the process of the system. This method helps the
design obtain balance objectives and expectations from the actual results of the
produced design prototype.
Design Procedure
Figure 3.1 on page 23 shows the process on how the research study is
done. The first step is to identify the problem of the study; the group has
gathered information about the problems that were encountered using the
existing digital blood pressure meter available in the market. After gathering
information, we researched on different related literature and studies through
books, journals and internet to support our design. Using all the articles that we
selected, the group discussed all the concepts that we are going to apply in our
design. We determined the features and functions it will cover. The circuit
diagram was then created, and we gathered all the appropriate components that
22
we are going to use considering its usability and functionality in the design. Since
we already have all the tools and components for our design, the development of
the PSoC based blood pressure monitor was started.
Start
Identify the problem with
the existing digital blood
pressure in the market
Gather all related literature
and studies
Are data
sufficient
?
N
Y
Determine the features and
functions of the design
Design the circuit and gather
the materials needed
Develop the design
Test the design
End
Figure 3.1 Design Procedure Flowchart
23
Design Procedure for Actual Design
The design started after gathering all the components and information
needed for the development.
Here are the steps that we followed in creating the design:
1. Develop the PCB layout of the blood pressure monitor using the PCB Wizard
software. Print the PCB layout on acetate.
2. Cut the printed circuit board acetate.
3. Place the acetate with PCB layout on top of the printed circuit board. Expose
it to UV light.
4. Dissolve developer into the right amount of water. Place the printed circuit
board into the solution and wait for a few minutes until the solution reacts
with the PCB.
5. Etch the layout on the printed circuit board.
6. When the layout is visible, wash the PCB with water. Place the etched circuit
board on a ferric chloride to dissolve unwanted copper.
7. Test all the connections of the circuit board using VOM, and check for
continuity. Drill holes for all the proper layout of the components.
8. Mount all the components needed for the design except for the
microcontroller.
9. Solder all the components properly.
10. Make a program for the design using PSoC Express 3.0 or PSoC Programmer
using C language and Assembly language.
24
11. Simulate program in the PSoC Express if all the functions are working and if
there are no errors.
12. Transfer the program on the PSoC microcontroller using a compatible PSoC
Burner device.
13. Mount the microcontroller on the corresponding IC socket on the circuit
board.
14. Place and screw the circuit board inside the casing.
15. Measure the dimensions of the LCD module. Mark the outline on the center
of the cover of the plastic case. Cut the edges on the marked outline, and
position the LCD module, and screw it on.
16. Mark outlines for the push buttons, and AC adaptor slot. Cut holes on the
outlines that fit the components.
17. Place the motor, solenoid valve, relay and batteries inside the case properly.
Make sure to attach each of them by using adhesive.
18. Connect all the ports from the circuit board to the LCD module.
19. Create a hole on the box and attach the arm cuff. Glue it properly so that
there is no opening for the air to leak.
20. Test if the design is working according to its functions. Troubleshoot if
necessary.
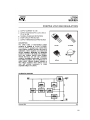
Hardware Design
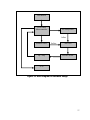
Figure 3.2 on page 27 is an illustration of the block diagram of the
hardware design. Initially, the user will press the push button to start the
25
operation. The prototype is using CY8C29466 PSoC microcontroller which
triggers the air pump motor to inflate the arm cuff. After the inflation period, the
microcontroller activates the solenoid valve to deflate the arm cuff gradually.
During deflation period, the pressure sensor detects all the pressure change
produced by the pulse beat of the user. The pressure sensor outputs a signal
that travels to the op-amp and will be amplified so that it will not lose the
efficiency of the data. This amplified signal will go to the ADC Module of PSoC
microcontroller to convert the signal from analog to digital. The CY8C29466
handles the process of determining the blood pressure and pulse rate as it is
being stored temporarily to the memory of the microcontroller. After that, the
microcontroller will send a signal to the LCD driver to open the segments of the
I/O ports of the LCD. The results of the readings will be displayed and then
stored to the memory of the microcontroller.
26
Push Button
CY8C29466
Microcontroller
Air Pump Motor
Inflate
Solenoid Valve
Op - Amp
Deflate
Arm Cuff
Pressure Sensor
LCD
Figure 3.2 Block Diagram of Hardware Design
27
List of Materials
Description
Quantity
Price per unit
Total
28 pin CY8C29466-24PXI
1pc
Php 360.00
Php 360.00
28 pin IC Socket
1pc
Php 8.00
Php 8.00
6V KMP27C Motor pump
1pc
Php 180.00
Php 180.00
6V KSV05B Solenoid valve
1pc
Php 87.00
Php 87.00
MPS 2000 dip pressure sensor
1pc
Php 600.00
Php 600.00
LM324
1pc
Php 9.00
Php 9.00
12V SPST Relay
1pc
Php 35.00
Php 35.00
12V/1A DC Fuse
1pc
Php 12.00
Php 12.00
L7806CV Regulator
1pc
Php 12.50
Php 12.50
LCD Module
1pc
Php 1,500.00
Php 1,500.00
625-ohm 1/4 watt Resistor
1pc
Php 0.50
Php 0.50
125-ohm 1/4 watt Resistor
1pc
Php 0.50
Php 0.50
5k-ohm 1/4 watt Resistor
4pcs
Php 0.50
Php 2.00
1k-ohm 1/4 watt Resistor
4pcs
Php 0.50
Php 2.00
160k-ohm 1/4 watt Resistor
2pcs
Php 0.50
Php 1.00
100k-ohm 1/4 watt Resistor
2pcs
Php 0.50
Php 1.00
1.6M-ohm 1/4 watt Resistor
1pc
Php 0.50
Php 0.50
0.01mF Capacitor
2pcs
Php 2.00
Php 4.00
2N3702 pnp Transistor
2pcs
Php 5.00
Php 10.00
LED Indicator
1pc
Php 0.50
Php 0.50
1N4001 Diode
1pc
Php 1.00
Php 1.00
Printed Circuit Board
2pcs
Php 50.00
Php 100.00
Push button
4pcs
Php 16.25
Php 65.00
Plastic casing
1pc
Php 140.00
Php 140.00
Wires
3m
Php 1.50
Php 4.50
AC Adaptor
1pc
Php 150.00
Php 150.00
Rechargeable AA Battery
5pcs
Php 40.00
Php 200.00
Arm cuff
1pc
Php 175.00
Php 175.00
Total Price
Table 3.1 List of Materials and Cost
Php 3,661.00
28
Hardware Component
The blood pressure monitor that was designed consists of different
components such as push button, rechargeable battery, pressure sensor,
operational amplifier, air pump motor, solenoid valve, LCD module, resistor,
transistor, relay, voltage regulator and 28 pin PSoC microcontroller.
The push buttons serve as input for the design. It is used for switching on
and off the power, setting the mode, searching for recorded data and changing
the date and time. The rechargeable batteries are the source of power of the
prototype to make it work. Once the prototype is on and is set to start the
operation, the air pump motor produces air to inflate the arm cuff. The solenoid
valve role is to release the pressure from the arm cuff if it is triggered by the
microcontroller. The pressure sensor is a component which generates a signal
from the pressure change detected in the arm cuff. That signal will be amplified
as it passes through the op amp then it goes to the microcontroller and will be
converted from analog to digital signal. The LCD module utilizes a built-in LCD
driver which is used to activate the segments of the LCD display. Resistors are
used to limit the flow of the electric current in the entire circuit. A relay is used
as a switch in transferring an electric power while charging the device.
Transistors are used as a switch also to drive the positive signal to run the air
pump motor and the solenoid valve. The voltage regulator is used to regulate the
voltage supply for the PSoC and to the components of the entire circuit. The
29
PSoC is the IC that was programmed to call and do the functions of the
components of the entire circuit.
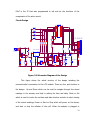
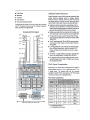
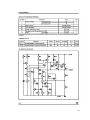
Circuit Design
1
SW1_start
2
1
SW2_mode
2
1
2
3
4
5
6
7
8
9
10
11
12
13
14
SW3_inc
1
2
1
SW4_dec
2
28
27
26
25
24
23
22
PSOC_PDIP 21
20
19
18
17
16
15
LCD MODULE
625
5.1k 5.1k 5.1k
1
2
3
4
5
6
7
8
9
10
11
12
13
14
15
16
5.1k
125
1
1k
1k
4
2
LM78L06 Voltage Regulator
1
VIN
VOUT
2
160k
GND
RELAY SPST
2
1
3
0.01m
3
12V/1A DC FUSE
1
1k
10k
1m
2
LED
7.5V BATTERY
100k
1
2
3
4
5
6
7
4
1
2
3
6
5
4
14
13
12
11
10
9
8
2N3702 PNP
100k
2N3702 PNP
KMP27C
AIR PUMP MOTOR
LCD
1k
+
KSV05B Solenoid Valv e
160k
0.01m
1.6M
1
1N4001
DC Jack 12V
A
1
2
LM324 Quad Op Amp
2
160k
MPS2000 DIP Pressure Sensor
1
2
3
4
5
6
7
8
9
10
11
12
13
14
15
16
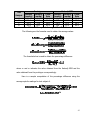
Figure 3.3 Schematic Diagram of the Design
This figure shows the whole circuitry of the design including the
microcontroller’s connection to the LCD module. There are four push buttons in
the design: Up and Down which can be used to navigate through the stored
readings in the memory and help in setting the time and date; Mode or Set
which is used to invoke the set time and date function and also to start viewing
of the stored readings; Power or Start or Stop which will power on the device,
and start or stop the inflation of the cuff. When the adaptor is plugged or
30
connected on the power outlet, the circuit will automatically get the regulated
current from the adaptor while charging the battery. If not plugged, the circuit
will get electric current from its rechargeable battery. See Figure 6.1 for the
enhanced version of the circuit diagram.
Hardware Implementation
In the implementation of the circuit design, a 6V voltage regulator is used
to control the voltage coming from either the DC voltage from the adaptor (while
the device is charging), or from the battery (while operating on battery power).
The output of 6V is used to power other components such as the solenoid valve,
the air pump motor, the pressure sensor, the operational amplifier, and the LCD
module. A voltage divider circuit, composed of a 125 ohm and a 625 ohm
resistor, is used to obtain a 5V input for powering the PSoC. The computation of
the voltage is shown below.
The typical PSoC input current is 8mA, at input voltage of 5V:
Where Vin is the input voltage coming from the 6V voltage regulator, and
Vout is the voltage used for powering the PSoC.
31
Software Design
The program was created using the free software of the Cypress
Company for the beginners. PSoC Express 3.0 is the software that we have used
in developing the program. The software is designed for the PSoC
microcontroller to handle the process of getting blood pressure up to the
function of displaying the reading. The software was created by selecting all the
components needed for the design in the PSoC Express 3.0; and was developed
using C Language. Assembly Language is also used in doing the software, a lowlevel language that implements numeric machine code since port addressing is
very important to make all the components working.
Software Component
PSoC Express is the development tool that we used to develop a
microcontroller-based design. Due to its features, we are able to create, simulate
and program the software for our design. Assembly language and C Language
are the languages that we used.
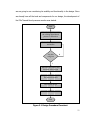
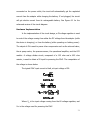
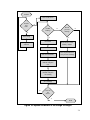
System Flowchart
The system flowchart of the design project is illustrated in Figure 3.4 on
page 34. It shows how the operation of the system works under different
conditions.
To start the system, press and hold the power button to switch on the
device. There are two operations that a user can choose from: to get blood
32
pressure reading or to recall previous reading. An option to configure the date
and time can be done before starting the operation.
If the user chooses an operation to get blood pressure reading, wrap the
arm cuff at the upper arm and press start button; inflation of the arm cuff will
follow. Anytime during this process, the user may stop the inflation by pressing
the stop button. Upon reaching the required pressure, it will start to deflate
gradually. The systolic and diastolic pressures, as well as the pulse rate, are
detected and calculated until the arm cuff deflates completely. Readings will be
displayed and then will be stored in the memory of the microcontroller.
If the user chooses an operation to recall previous reading, press the
mode button and select which memory module. Previous readings can be viewed
using the up and down buttons.
The system will still continue working every after operation unless the
user chose to turn off the device by pressing and holding the start button. The
device automatically switches off when left idle for a few minutes.
33
START
Turn on the device
Set date
and
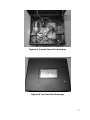
time?
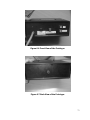
N
N
Get BP
reading?
Recall
previous
reading?
N
Y
Press Setup
Y
Y
Press Start
Configure date
and time
Press Mode to select
memory module
Arm cuff will inflate
Arm cuff will deflate
Press Up and Down to
view previous readings
Calculate systolic,
diastolic and pulse
rate
Display systolic,
diastolic and pulse
rate reading
Save readings
N
Turn off
the
device?
Y
END
Figure 3.4 System Flowchart of the Design Prototype
34
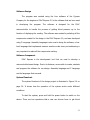
Prototype Development
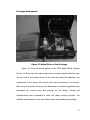
Figure 3.5 Actual Photo of the Prototype
Figure 3.5 show the actual picture of the PSoC based Blood Pressure
Monitor. It shows here how each component is properly placed inside the case.
The arm cuff is connected outside of the case and cannot be detached. The
components of the design were tested and chosen according to its function.
After doing all research and study, the ideas came in and were applied through
developing the correct circuit and program for the design. Testing and
troubleshooting were conducted to make this design working correctly. The
reliability and accuracy are the main features that we considered accordingly.
35
CHAPTER 4
TESTING, PRESENTATION AND INTERPRETATION OF DATA
Majority of the concepts behind the design are generally based on many
of the existing types of blood pressure monitoring devices that are currently
available in the market. Therefore, it is necessary to test whether the device
would yield similar results as compared to the existing ones. We are to test the
design prototype for its accuracy, reliability, and efficiency. This chapter covers
all the tests done and the discussions of the results, as well as the significance
to the study.
Testing of Accuracy
It is very important to determine how accurate the design prototype is
when obtaining results. This test is conducted to prove that the accuracy of the
design is as consistent as any other blood pressure measuring device available in
the market. As for this test, the blood pressure monitor that the prototype will
be compared to is the Full Automatic Kodea® Blood Pressure Monitor, which
also utilizes arm cuff automated inflation and pressure sensor to obtain pulse
readings.
Before the test is conducted, there were several pointers to obtain
accurate results. When measuring blood pressure, an accurate reading requires
that one should not drink coffee, smoke cigarettes, or engage in strenuous
exercise for 30 minutes before taking the reading. A full bladder may have a
small effect on blood pressure readings, so if the urge to urinate exists, one
36
should do so before the reading. For 5 minutes before the reading, one should
sit upright in a chair with one's feet flat on the floor and with limbs uncrossed.
The blood pressure cuff should always be against bare skin, as readings taken
over a shirt sleeve are less accurate. During the reading, the arm that is used
should be relaxed and kept at heart level, for example by resting it on a table
(National Heart, Lung and Blood Institute. Tips for having your blood pressure
taken.). The following procedures are done for testing the accuracy of the
prototype device:
1. Choose four random persons to be the test subjects.
2. Gather information about each test subject through a simple interview.
3. Make necessary preparations before obtaining the readings. Refer to
Appendix H: User’s Manual for step-by-step procedures.
4. After each reading, rest the test subject for five minutes before
performing another reading.
5. After obtaining ten readings, follow the same procedures to get results
using the Kodea® BPM.
6. Follow the same procedures for all test subjects.
7. Compute for the average of the systolic, diastolic, and pulse rate readings
for both devices respectively.
8. Compute for the percentage difference and analyze the results.
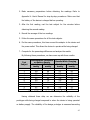
There are certain assumptions that should first be considered when
conducting the test. The readings are determined to be correct, or at least
37
reliable, based on the classification of blood pressure. The following table
indicates how the readings are being classified according to WHO (World Health
Organization).
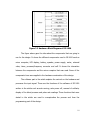
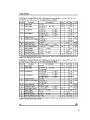
Category
Systolic, mmHg
Diastolic, mmHg
Optimal
less than 120
or less than 80
Normal
less than 130
or less than 85
High Normal
130 – 139
85 – 89
Stage 1
140 – 159
90 – 99
Hypertension
Stage 2
160 – 179
100 - 109
Hypertension
Stage 3
greater than or equal to 180
greater than or equal to 110
Hypertension
Table 4.1 Classification of Blood Pressure Reading for Adults
There are many physical factors that influence arterial pressure. Each of
these may in turn be influenced by physiological factors, such as diet, exercise,
disease, drugs or alcohol, obesity, excess weight and so-forth. Therefore, to tell
whether the readings are acceptable, we determined physical information on the
test subjects, as well as their medical background. This is to distinguish if the
readings are still in accordance with these physical factors.
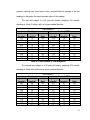
There are four different persons to undertake the tests. Two of which has
been determined to have medical illness which is critical in the analysis of the
results. The following tables show the systolic and diastolic readings of the test
subjects, as well as the pulse rate readings. For comparison, the readings from
the prototype and from the Kodea® BPM are made adjacent in each table. A
total of ten readings shall be taken from each test subjects. Since the blood
38
pressure readings vary from time to time, we shall take the average of the ten
readings to determine the most accurate value of the reading.
The first test subject is a 53 year-old female, weighing 100 pounds,
standing at 4-feet-3-inches, with no known medical disorder.
Systolic
(mmHg)
111
104
108
112
117
116
112
118
115
108
Test Subject A
Prototype
Kodea® BPM
Diastolic
Pulse
Systolic
Diastolic
(mmHg)
Rate
(mmHg)
(mmHg)
73
61
112
70
61
60
114
71
67
59
110
70
70
64
115
72
77
62
111
69
70
60
115
74
65
58
109
67
77
69
112
70
71
65
113
71
70
58
112
70
Table 4.2 Test Results of Test Subject A
Pulse
Rate
62
62
61
63
61
63
60
62
62
62
The second test subject is a 25 year-old female, weighing 105 pounds,
standing at 5-feet, also without any known medical disorder.
Systolic
(mmHg)
103
100
103
109
107
103
113
114
105
109
Test Subject B
Prototype
Kodea® BPM
Diastolic
Pulse
Systolic
Diastolic
(mmHg)
Rate
(mmHg)
(mmHg)
69
81
107
67
66
88
101
63
70
84
113
72
69
85
107
67
66
84
108
67
72
81
104
64
66
80
111
71
74
89
107
67
66
86
105
68
68
84
107
67
Table 4.3 Test Results of Test Subject B
Pulse
Rate
85
87
84
83
88
85
86
85
84
85
39
As observed, the test results for both test subjects A and B have been
identified to be in the optimal category, which shows no hint of hypertension
conditions. That is, the systolic and diastolic readings are all below 120 and 80
respectively for both test subjects. This supports the fact that both test subjects
are in healthy condition.
Moreover, all readings obtained from both blood pressure monitors
indicate only a very minor differential compared to the readings from each other.
When averaged, the prototype test results yield 112.1 over 70.1 with average
pulse rate of 61.6, while the branded BPM test results yield 112.3 over 70.4 with
average pulse rate of 61.8 for the test subject A. The prototype test results yield
106.6 over 68.6 with average pulse rate of 84.2, while the branded BPM test
results yield 107.0 over 67.3 with average pulse rate of 85.2 for the test subject
B. There is only a differential of less than 1.0 mmHg obtained for the averaged
value of blood pressure readings.
The next test subject is a 24 year-old male, weighing 144 pounds,
standing at 5-feet-4-inches, and is known to have developed an asthmatic
condition.
40
Systolic
(mmHg)
134
131
127
123
125
137
129
128
131
130
Test Subject C
Prototype
Kodea® BPM
Diastolic
Pulse
Systolic
Diastolic
(mmHg)
Rate
(mmHg)
(mmHg)
81
68
126
86
81
65
128
79
73
61
135
77
73
65
128
77
79
68
127
83
88
67
128
85
87
66
127
85
75
71
136
84
85
66
136
84
77
69
128
85
Table 4.4 Test Results of Test Subject C
Pulse
Rate
64
62
61
68
67
72
73
71
72
72
The test results for test subject C yielded a more distinct range of values
and are observed to be above the normal readings. The test subject has been
identified to be at the High Normal category, in which the readings are
considered to be at pre-hypertension level. The readings may have been
influenced by the condition of the test subject of having asthma.
Similarly from the results of the previous test subjects, the readings from
both blood pressure monitor indicate a very minimal differential. When
averaged, the prototype test results yield 129.5 over 79.9 with average pulse
rate of 66.6, while the branded BPM test results yield 129.9 over 82.5 with
average pulse rate of 68.2 for the test subject. There is a differential of 2.6
mmHg obtained for the averaged value of the blood pressure readings.
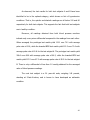
The last test subject is a 62 year-old male, weighing 140 pounds,
standing at 5-feet-4-inches, and is known to have diabetes.
41
Systolic
(mmHg)
140
136
136
144
145
140
134
138
143
138
Test Subject D
Prototype
Kodea® BPM
Diastolic
Pulse
Systolic
Diastolic
(mmHg)
Rate
(mmHg)
(mmHg)
92
85
138
82
88
84
140
84
86
84
140
85
90
84
139
87
92
88
140
90
92
84
142
90
86
80
139
88
89
79
141
90
90
85
140
88
86
82
141
89
Table 4.5 Test Results of Test Subject D
Pulse
Rate
78
80
81
81
80
86
83
84
85
85
The test results for test subject D yielded the highest range of values and
are observed also to be above normal readings. The test subject has been
identified to be between the High Normal category and the Stage 1
Hypertension category. The readings may have been influenced by the condition
of the test subject of having diabetes.
The readings for the test subject from both blood pressure monitor also
indicate a very minimal differential. The prototype test results yield an average
of 139.4 over 89.1 with average pulse rate of 83.5, while the branded BPM test
results yield an average of 140.0 over 87.3 with average pulse rate of 82.3 for
the test subject. There is a differential of 1.8 mmHg obtained for the averaged
value of the blood pressure readings.
Having obtained these data, we can determine the accuracy of the
prototype as compared to the branded BPM. Table 4.6 shows the tabulated
values of the averaged readings for the four test subjects.
42
Test
Subject
A
B
C
D
Prototype
Kodea® BPM
Systolic Diastolic
Pulse
Systolic Diastolic
Pulse
(mmHg) (mmHg)
Rate
(mmHg) (mmHg)
Rate
112.1
70.1
61.6
112.3
70.4
61.8
106.6
68.6
84.2
107
67.3
85.2
129.5
79.9
66.6
129.9
82.5
68.2
139.4
89.1
83.5
140
87.3
82.3
Table 4.6 Computed Average of Test Results
The following are the formulas used to obtain the average values:
The formula below is used to obtain the percentage difference:
where x1 and x2 indicates the value obtained from the Kodea® BPM and the
value obtained from the prototype correspondingly.
Here is a sample computation of the percentage difference using the
average systolic readings for test subject A.
%
43
Percentage Difference (%)
Systolic
Diastolic
Pulse Rate
0.18
0.43
0.32
0.37
1.91
1.18
0.31
3.20
2.37
0.43
2.04
1.45
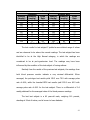
Table 4.7 Computed Percentage Errors for Accuracy
Test Subject
A
B
C
D
The largest percentage difference computed based on the table is at
3.20%, the percentage difference obtained for the diastolic pressure of test
subject C. This basically means that the PSoC-based Blood Pressure Monitor
prototype operates at 96.80% accuracy compared to the Kodea® BPM.
Since the Kodea® BPM operates at a percentage difference of 3% or a
±5 mmHg differential of blood pressure readings, we may conclude that the
prototype is as accurate as the market-based BPM based on its specifications.
Testing of Reliability
The design prototype may be operated either while on battery supply, or
while the device is being charged. It is necessary to determine whether the
device, while being charged, behaves and functions similarly when operating on
battery supply. This is to prove that the direct connection to the power outlet of
220V does not affect the operation of the system.
Similar assumptions from the previous test conducted are to be followed.
The following procedures are done for testing the reliability of the prototype
device:
1. Choose ten random persons to be the test subjects.
44
2. Make necessary preparations before obtaining the readings. Refer to
Appendix H: User’s Manual for step-by-step procedures. Make sure that
the battery of the device is charged before operating.
3. After the first reading, rest the test subject for five minutes before
obtaining the second reading.
4. Record the average of the two readings.
5. Follow the same procedures for all the test subjects.
6. Do the same procedures, this time connect the adaptor to the device and
the power outlet. This allows the device to operate while being charged.
7. Compute for the percentage difference and analyze the results.
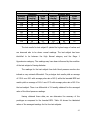
By following these procedures, we have come up with these results:
Results While Operating
Results While Charging
on Battery Supply
Test
Subject
Systolic,
Diastolic,
Systolic,
Diastolic,
mmHg
mmHg
mmHg
mmHg
1
97
63
95
65
2
124
88
127
85
3
121
92
118
95
4
132
92
130
90
5
127
89
130
93
6
112
70
120
70
7
118
84
110
81
8
123
87
118
90
9
127
94
125
92
10
130
80
132
79
Table 4.8 Test Results for Reliability Testing
Having obtained these data, we can determine the reliability of the
prototype while being charged compared to when the device is being operated
on battery supply. The reliability of the design prototype is measured according
45
to the percentage difference of the readings. The formula below is used to
obtain the percentage difference:
where the x1 and x2 is assumed to be the values obtained from the results while
the prototype operates on battery supply and the values obtained from the
results while prototype is being charged respectively.
Here is a sample computation of the percentage difference using the
systolic values of the first test subject.
%
Test Subject
1
2
3
4
5
6
7
8
9
10
Percentage Difference (%)
Systolic
2.08
2.39
2.51
1.53
2.33
6.90
7.02
4.15
1.59
1.53
Diastolic
3.13
3.47
3.21
2.20
4.40
0.00
3.64
3.39
2.15
1.26
Table 4.9 Computed Percentage Differences for Reliability
The largest percentage difference computed based on the table is at
7.02%, the percentage difference obtained for the systolic pressure of sixth test
subject. This basically means that the PSoC-based Blood Pressure Monitor
prototype operates at 92.98% accuracy while being charged compared to when
the prototype operates on battery supply.
46
Chapter 5
CONCLUSION AND RECOMMENDATION
Conclusion
A Programmable System on Chip based Blood Pressure Monitor was
created. The design prototype was tested for its accuracy, reliability, and
efficiency. The design prototype has been determined to operate at an accurate
percentage as compared to a similar blood pressure monitor available in the
market.
The design prototype is capable of accurately reading systolic reading,
diastolic reading and pulse rate reading. The prototype is successfully designed
to be able to store the readings into four different memory modules that contain
the date and time it was taken. This functionality was incorporated into the
design for the user to have future reference of the previous readings.
The design prototype is also capable of operating using either a battery
supply or a direct power supply as its main power source. The design
implements the concept of a rechargeability function, through the use of
rechargeable batteries. The battery supply can be recharged when a direct
power supply is used by the circuit. The hardware implementation utilizes a relay
to toggle operation while recharging the battery supply.
Recommendation
There could be further improvements or studies on this design. One way
to innovate this is by creating a sugar level monitor aside from its main function,
47
which is getting the blood pressure of a person. A detachable arm cuff can also
be implemented in this design so that it will not be limited to a specific arm
circumference range. Lastly, it is also recommended to study the process on
how a user creates a personal profile for storing their own readings properly.
48
BIBLIOGRAPHY
Alexander, Charles K. and Sadiku, Matthew N.O. (2003). Fundamentals of
Electric Circuits, 2nd Edition, McGraw-Hill, New York.
Ashby, Robert (2005). Designer’s Guide to the Cypress PSoC, Newnes, MA.
Brueschke, Erich E. M.D. (1993). The World Book Rush-Presbyterian St. Luke’s
Medical Center Medical Encyclopedia, 6th edition, World Book, Inc., Chicago, IL.
Floyd, Thomas L. (2002). Electronic Devices, 6th Edition, Pearson Education,
Inc., publishing as Prentice Hall, New Jersey.
Fortmann, S.P. M.D. and P. Breitrose M.A. (1996). The Blood Pressure Book, 4th
Edition, Bull Publishing, Boulder, Colorado.
Rithalia, Shyam, et al. (2000). Blood Pressure Measurement, CRC Press LLC.
49
APPENDIX A
Circuit / Schematic Diagram
50
DC Jack 12V
4
2
LED
1k
3
4
10k
RELAY SPST
2
1
5.1k
7.5V BATTERY
VIN
1
2
3
2
6
5
4
5.1k
5.1k
MPS2000 DIP Pressure Sensor
VOUT
LM78L06 Voltage Regulator
SW4_dec
2
1
1
2
1
5.1k
1.6M
0.01m
160k
125
625
14
13
12
11
10
9
8
PSOC_PDIP
160k
LM324 Quad Op Amp
1
2
3
4
5
6
7
1
2
3
4
5
6
7
8
9
10
11
12
13
14
0.01m
100k
28
27
26
25
24
23
22
21
20
19
18
17
16
15
160k
100k
1k
-
A
+
1k
KMP27C
AIR PUMP MOTOR
2N3702 PNP
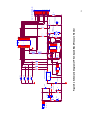
Figure 6.1 Schematic Diagram of PSoC based Blood Pressure Monitor
1m
12V/1A DC FUSE
1N4001
SW2_mode
2
1
SW3_inc
SW1_start
2
1
GN D
3
1
1
2
1
2
1
2
KSV05B Solenoid Valv e
2N3702 PNP
1k
LCD
1
2
3
4
5
6
7
8
9
10
11
12
13
14
15
16
51
1
2
3
4
5
6
7
8
9
10
11
12
13
14
15
16
LCD MODULE
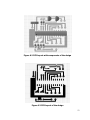
Figure 6.2 PCB Layout with components of the design
Figure 6.3 PCB Layout of the design
52
APPENDIX B
Source Code
53
//--------------------------------------------------------------------------// C main line
//--------------------------------------------------------------------------#include <m8c.h>
#include "PSoCAPI.h"
#include
#include
#include
#include
// part specific constants and macros
// PSoC API definitions for all User Modules
"driverdecl.h"
"CMXSystem.h"
"CMXSystemExtern.h"
"TransferFunction.h"
#include "cmx.h"
#include "ProjectProperties.h"
#include "Custom.h"
// Channel includes
// ADC_00 Include
#include "CMX_ADC_CHAN.h"
void main()
{
// Initialize Project
M8C_EnableGInt;
// Turn on interrupts
I2C_CFG &= 0xFC;
// Disable I2C in case
it's not used.
SystemTimer_Start();
SystemTimer_SetInterval(SystemTimer_64_HZ);
SystemTimer_EnableInt();
// Initialize Channels
// ADC_00 Initialization
ADCBUF_Start(3); // Power up ADC Buffer PGA
ADC_Start(3); // Power up ADC
AdcScanReset(); // Initialize ADC scanner
ADC_GetSamples(0); // Turn on GetSamples
// Initialize Variables
SystemVars.ReadOnlyVars.pse_Minus = 0;
SystemVars.ReadOnlyVars.pse_Mode = 0;
SystemVars.ReadOnlyVars.pse_Plus = 0;
SystemVars.ReadOnlyVars.pse_Switch_on = 0;
SystemVars.ReadOnlyVars.pse_air = 0;
SystemVars.ReadOnlyVars.pse_air_switch = 0;
SystemVars.ReadOnlyVars.pse_motor = 0;
SystemVars.ReadOnlyVars.pse_neg = 0;
SystemVars.ReadOnlyVars.pse_pos = 0;
SystemVars.ReadOnlyVars.pse_power = 0;
SystemVars.ReadOnlyVars.pse_pump = 0;
SystemVars.ReadOnlyVars.pse_set = 0;
// Driver instantiations
CMX_DIO_Instantiate(&pse_neg);
CMX_DIO_Instantiate(&pse_motor);
CMX_DIO_Instantiate(&pse_air);
54
CMX_GSWITCH_Instantiate(&pse_Switch_on);
CMX_DIO_Instantiate(&pse_power);
CMX_GSWITCH_Instantiate(&pse_Mode);
CMX_DIO_Instantiate(&pse_set);
CMX_GSWITCH_Instantiate(&pse_Plus);
CMX_DIO_Instantiate(&pse_pos);
CMX_GSWITCH_Instantiate(&pse_Minus);
CMX_mVolts_Instantiate(&pse_pump);
CMX_mVolts_Instantiate(&pse_air_switch);
// Custom initization code.
CustomInit();
// End Initialize Project
while(1)
{
// Sync loop sample rate
#if ( SAMPLE_DIVIDER )
SystemTimer_SyncWait(SAMPLE_DIVIDER, SystemTimer_WAIT_RELOAD);
#endif
// update input variables
SystemVars.ReadOnlyVars.pse_Minus =
CMX_GSWITCH_GetValue(&pse_Minus);
SystemVars.ReadOnlyVars.pse_Mode =
CMX_GSWITCH_GetValue(&pse_Mode);
SystemVars.ReadOnlyVars.pse_Plus =
CMX_GSWITCH_GetValue(&pse_Plus);
SystemVars.ReadOnlyVars.pse_Switch_on =
CMX_GSWITCH_GetValue(&pse_Switch_on);
SystemVars.ReadOnlyVars.pse_air_switch =
CMX_mVolts_GetValue(&pse_air_switch);
SystemVars.ReadOnlyVars.pse_pump =
CMX_mVolts_GetValue(&pse_pump);
// Custom Post Input function
CustomPostInputUpdate();
// run transfer function and update output variables
TransferFunction();
// CustomPreOutputUpdate();
CustomPreOutputUpdate();
// set outputs
CMX_DIO_SetValue(&pse_air,
(BYTE)SystemVars.ReadOnlyVars.pse_air);
CMX_DIO_SetValue(&pse_motor,
(BYTE)SystemVars.ReadOnlyVars.pse_motor);
CMX_DIO_SetValue(&pse_neg,
(BYTE)SystemVars.ReadOnlyVars.pse_neg);
CMX_DIO_SetValue(&pse_pos,
(BYTE)SystemVars.ReadOnlyVars.pse_pos);
CMX_DIO_SetValue(&pse_power,
(BYTE)SystemVars.ReadOnlyVars.pse_power);
CMX_DIO_SetValue(&pse_set,
(BYTE)SystemVars.ReadOnlyVars.pse_set);
55
}
}
//*********************************************************************
********
//*********************************************************************
********
// FILENAME: calibration.c
// @Version@
// `@PSOC_VERSION`
//
// DESCRIPTION: This files contains the calibration constansts for
the
//
ADC. Currently these values are default values that
//
are not calibrated.
//
//---------------------------------------------------------------------------//
Copyright (c) Cypress MicroSystems 2004. All Rights Reserved.
//*********************************************************************
********
//*********************************************************************
********
#pragma abs_address:0x7FC0
const int CountsPerVolt = 25206;
const int ADC_Offset
= 0;
// ADC gain for 0 to 2.6 volt range.
// ADC offset in counts
// This array of offsets allows for custom calibration
// of each input that uses the mVolts channel. The offset
// will be in the drivers native units. For the mVolts
// driver it will be in mVolts. For a temperature driver
// it will be in tenths of degrees, etc.
const int imVolts_Chan_Offset[8] = {0,0,0,0,0,0,0,0};
#pragma end_abs_address
; Generated by PSoC Designer ???
;
;@Id: boot.tpl#101 @
;======================================================================
=======
; FILENAME:
boot.asm
; VERSION:
4.15
; DATE:
2 August 2004
;
; DESCRIPTION:
; M8C Boot Code for CY8C29xxx microcontroller family.
;
; Copyright (C) Cypress MicroSystems 2000-2004. All rights reserved.
;
; NOTES:
; PSoC Designer's Device Editor uses a template file, BOOT.TPL, located
in
; the project's root directory to create BOOT.ASM. Any changes made to
; BOOT.ASM will be overwritten every time the project is generated;
therfore
; changes should be made to BOOT.TPL not BOOT.ASM. Care must be taken
when
56
; modifying BOOT.TPL so that replacement strings (such as
@PROJECT_NAME)
; are not accidentally modified.
;
;======================================================================
=======
include
include
include
include
".\lib\GlobalParams.inc"
"m8c.inc"
"m8ssc.inc"
"memory.inc"
;-------------------------------------; Export Declarations
;-------------------------------------export
export
export
export
export
export
export
export
__Start
__bss_start
__data_start
__idata_start
__func_lit_start
__text_start
_bGetPowerSetting
bGetPowerSetting
;-------------------------------------; Optimization flags
;-------------------------------------;
; To change the value of these flags, modify the file boot.tpl, not
; boot.asm. See the notes in the banner comment at the beginning of
; this file.
; Optimization for Assembly
projects
; that do not depend on the
variables.
;
Set to 1: Support for C
;
Set to 0: Support for C
space.
;
C_LANGUAGE_SUPPORT:
language (only) projects and C-language
C compiler to initialize the values of RAM
Run-time Environment initialization
not included. Faster start up, smaller code
equ 1
; The following equate is required for proper operation. Reseting its
value
; is discouraged. WAIT_FOR_32K is effective only if the crystal
oscillator is
; selected. If the designer chooses to not wait then stabilization of
the ECO
; and PLL_Lock must take place within user code. See the family data
sheet for
; the requirements of starting the ECO and PLL lock mode.
;
;
Set to 1: Wait for XTAL (& PLL if selected) to stabilize before
;
invoking main
57
;
Set to 0: Boot code does not wait; clock may not have stabilized by
;
the time code in main starts executing.
;
WAIT_FOR_32K:
equ 1
; For historical reasons, by default the boot code uses an lcall
instruction
; to invoke the user's _main code. If _main executes a return
instruction,
; boot provides an infinite loop. By changing the following equate from
zero
; to 1, boot's lcall will be replaced by a ljmp instruction, saving two
; bytes on the stack which are otherwise required for the return
address. If
; this option is enabled, _main must not return. (Beginning with the
4.2
; release, the C compiler automatically places an infinite loop at the
end
; of main, rather than a return instruction.)
;
ENABLE_LJMP_TO_MAIN:
equ 0
;---------------------------------------------------------------------------; Interrupt Vector Table
;---------------------------------------------------------------------------;
; Interrupt vector table entries are 4 bytes long. Each one contains
; a jump instruction to an ISR (Interrupt Service Routine), although
; very short ISRs could be encoded within the table itself. Normally,
; vector jump targets are modified automatically according to the user
; modules selected. This occurs when the 'Generate Application' opera; tion is run causing PSoC Designer to create boot.asm and the other
; configuration files. If you need to hard code a vector, update the
; file boot.tpl, not boot.asm. See the banner comment at the beginning
; of this file.
;---------------------------------------------------------------------------AREA TOP (ROM, ABS, CON)
org
0
jmp
__Start
following a Reset
org
halt
04h
;Reset Interrupt Vector
;First instruction executed
;Supply Monitor Interrupt Vector
;Stop execution if power falls too
low
org
08h
// call void_handler
reti
;Analog Column 0 Interrupt Vector
org
;Analog Column 1 Interrupt Vector
0Ch
58
// call void_handler
reti
org
10h
// call void_handler
reti
;Analog Column 2 Interrupt Vector
org
14h
// call void_handler
reti
;Analog Column 3 Interrupt Vector
org
18h
// call void_handler
reti
;VC3 Interrupt Vector
org
1Ch
// call void_handler
reti
;GPIO Interrupt Vector
org
20h
// call void_handler
reti
;PSoC Block DBB00 Interrupt Vector
org
ljmp
reti
;PSoC Block DBB01 Interrupt Vector
24h
_ADC_ADConversion_ISR
org
28h
// call void_handler
reti
;PSoC Block DCB02 Interrupt Vector
org
2Ch
// call void_handler
reti
;PSoC Block DCB03 Interrupt Vector
org
30h
// call void_handler
reti
;PSoC Block DBB10 Interrupt Vector
org
34h
// call void_handler
reti
;PSoC Block DBB11 Interrupt Vector
org
38h
// call void_handler
reti
;PSoC Block DCB12 Interrupt Vector
org
3Ch
// call void_handler
reti
;PSoC Block DCB13 Interrupt Vector
org
40h
// call void_handler
reti
;PSoC Block DBB20 Interrupt Vector
org
44h
// call void_handler
;PSoC Block DBB21 Interrupt Vector
59
reti
org
48h
// call void_handler
reti
;PSoC Block DCB22 Interrupt Vector
org
4Ch
// call void_handler
reti
;PSoC Block DCB23 Interrupt Vector
org
50h
// call void_handler
reti
;PSoC Block DBB30 Interrupt Vector
org
54h
// call void_handler
reti
;PSoC Block DBB31 Interrupt Vector
org
58h
// call void_handler
reti
;PSoC Block DCB32 Interrupt Vector
org
5Ch
// call void_handler
reti
;PSoC Block DCB33 Interrupt Vector
org
60h
// call void_handler
reti
;PSoC I2C Interrupt Vector
org
ljmp
reti
;Sleep Timer Interrupt Vector
64h
_SystemTimer_ISR
;---------------------------------------------------------------------------; Start of Execution.
;---------------------------------------------------------------------------; The Supervisory ROM SWBootReset function has already completed the
; calibrate1 process, loading trim values for 5 volt operation.
;
org 68h
__Start:
; initialize SMP values for voltage stabilization, if required,
; leaving power-on reset (POR) level at the default (low) level, at
; least for now.
;
M8C_SetBank1
mov
reg[VLT_CR], SWITCH_MODE_PUMP_JUST | LVD_TBEN_JUST |
TRIP_VOLTAGE_JUST
M8C_SetBank0
IF ( WATCHDOG_ENABLE )
M8C_EnableWatchDog
ENDIF
; WDT selected in Global Params
60
IF ( SELECT_32K )
or
reg[CPU_SCR1], CPU_SCR1_ECO_ALLOWED
this project
ELSE
and reg[CPU_SCR1], ~CPU_SCR1_ECO_ALLOWED
enabled
ENDIF
; ECO will be used in
; Prevent ECO from being
;--------------------------; Set up the Temporary stack
;--------------------------; A temporary stack is set up for the SSC instructions.
; The real stack start will be assigned later.
;
_stack_start:
equ 80h
mov
A, _stack_start
; Set top of stack to end of used
RAM
swap SP, A
; This is only temporary if going to
LMM
;----------------------------------------------; Set Power-related Trim & the AGND Bypass bit.
;----------------------------------------------IF ( POWER_SETTING & POWER_SET_5V0)
; *** 5.0 Volt operation
***
IF ( POWER_SETTING & POWER_SET_SLOW_IMO)
; *** 6MHZ Main
Oscillator ***
or reg[CPU_SCR1], CPU_SCR1_SLIMO
M8SSC_Set2TableTrims 2, SSCTBL2_TRIM_IMO_5V_6MHZ, 1,
SSCTBL1_TRIM_BGR_5V, AGND_BYPASS_JUST
ELSE
; *** 12MHZ Main
Oscillator ***
IF ( AGND_BYPASS )
;- - - - - - - - - - - - - - - - - - - - - - - - - - - - - - - - - ; The 5V trim has already been set, but we need to update the
AGNDBYP
; bit in the write-only BDG_TR register. Recalculate the register
; value using the proper trim values.
;- - - - - - - - - - - - - - - - - - - - - - - - - - - - - - - - - M8SSC_SetTableVoltageTrim 1, SSCTBL1_TRIM_BGR_5V, AGND_BYPASS_JUST
ENDIF
ENDIF
ENDIF ; 5.0 V Operation
IF ( POWER_SETTING & POWER_SET_3V3)
; *** 3.3 Volt operation
***
IF ( POWER_SETTING & POWER_SET_SLOW_IMO)
; *** 6MHZ Main
Oscillator ***
or reg[CPU_SCR1], CPU_SCR1_SLIMO
M8SSC_Set2TableTrims 2, SSCTBL2_TRIM_IMO_3V_6MHZ, 1,
SSCTBL1_TRIM_BGR_3V, AGND_BYPASS_JUST
ELSE
; *** 12MHZ Main
Oscillator ***
61
M8SSC_SetTableTrims 1, SSCTBL1_TRIM_IMO_3V_24MHZ,
SSCTBL1_TRIM_BGR_3V, AGND_BYPASS_JUST
ENDIF
ENDIF ; 3.3 Volt Operation
mov [bSSC_KEY1], 0
operations
mov [bSSC_KEYSP], 0
; Lock out Flash and Supervisiory
;--------------------------------------; Initialize Crystal Oscillator and PLL
;--------------------------------------IF ( SELECT_32K & WAIT_FOR_32K )
; If the user has requested the External Crystal Oscillator (ECO)
then turn it
; on and wait for it to stabilize and the system to switch over to
it. The PLL
; is left off. Set the SleepTimer period is set to 1 sec to time
the wait for
; the ECO to stabilize.
;
M8C_SetBank1
mov
reg[OSC_CR0], (SELECT_32K_JUST | OSC_CR0_SLEEP_1Hz |
OSC_CR0_CPU_12MHz)
M8C_SetBank0
M8C_ClearWDTAndSleep
; Reset the sleep timer to
get a full second
or
reg[INT_MSK0], INT_MSK0_SLEEP
; Enable latching of
SleepTimer interrupt
mov
reg[INT_VC],
0
; Clear all pending
interrupts
.WaitFor1s:
tst
reg[INT_CLR0], INT_MSK0_SLEEP
; Test the SleepTimer
Interrupt Status
jz
.WaitFor1s
; Interrupt will latch but
will not dispatch
;
since interrupts are not
globally enabled
ELSE ; !( SELECT_32K & WAIT_FOR_32K )
; Either no ECO, or waiting for stable clock is to be done in main
M8C_SetBank1
mov
reg[OSC_CR0], (SELECT_32K_JUST | PLL_MODE_JUST |
SLEEP_TIMER_JUST | OSC_CR0_CPU_12MHz)
M8C_SetBank0
M8C_ClearWDTAndSleep
; Reset the watch dog
ENDIF ;( SELECT_32K & WAIT_FOR_32K )
IF ( PLL_MODE )
; Crystal is now fully operational (assuming WAIT_FOR_32K was
enabled).
; Now start up PLL if selected, and wait 16 msec for it to
stabilize.
;
M8C_SetBank1
62
mov
reg[OSC_CR0], (SELECT_32K_JUST | PLL_MODE_JUST |
OSC_CR0_SLEEP_64Hz | OSC_CR0_CPU_3MHz)
M8C_SetBank0
M8C_ClearWDTAndSleep
; Reset the sleep timer to
get full period
mov
reg[INT_VC], 0
; Clear all pending
interrupts
.WaitFor16ms:
tst
reg[INT_CLR0],INT_MSK0_SLEEP
; Test the SleepTimer
Interrupt Status
jz
.WaitFor16ms
M8C_SetBank1
; continue boot at CPU Speed
of SYSCLK/2
mov
reg[OSC_CR0], (SELECT_32K_JUST | PLL_MODE_JUST |
OSC_CR0_SLEEP_64Hz | OSC_CR0_CPU_12MHz)
M8C_SetBank0
IF
( WAIT_FOR_32K )
ELSE ; !( WAIT_FOR_32K )
; Option settings (PLL-Yes, ECO-No) are incompatible - force a
syntax error
ERROR_PSoC Disabling WAIT_FOR_32K requires that the PLL_Lock must
be enabled in user code.
ENDIF ;(WAIT_FOR_32K)
ENDIF ;(PLL_MODE)
;-----------------------; Close CT leakage path.
;-----------------------mov
reg[ACB00CR0], 05h
mov
reg[ACB01CR0], 05h
mov
reg[ACB02CR0], 05h
mov
reg[ACB03CR0], 05h
;--------------------------------------------; Enter the Large Memory Model, if applicable
;--------------------------------------------IF ( SYSTEM_LARGE_MEMORY_MODEL )
RAM_SETPAGE_STK SYSTEM_STACK_PAGE
; relocate stack page ...
mov
A, SYSTEM_STACK_BASE_ADDR
;
and offset, if any
swap A, SP
RAM_SETPAGE_IDX2STK
; initialize other page pointers
RAM_SETPAGE_CUR 0
RAM_SETPAGE_MVW 0
RAM_SETPAGE_MVR 0
IF ( SYSTEM_IDXPG_TRACKS_STK_PP ); Now
or
F, FLAG_PGMODE_11b
; LMM
ELSE
or
F, FLAG_PGMODE_10b
; LMM
ENDIF ; SYSTEM_IDXPG_TRACKS_STK_PP
ELSE
mov
A, __ramareas_end
; Set
RAM
swap SP, A
ENDIF ; SYSTEM_LARGE_MEMORY_MODEL
enable paging:
w/ IndexPage<==>StackPage
w/ independent IndexPage
top of stack to end of used
63
;------------------------; Load Base Configuration
;------------------------; Load global parameter settings and load the user modules in the
; base configuration. Exceptions: (1) Leave CPU Speed fast as
possible
; to minimize start up time; (2) We may still need to play with the
; Sleep Timer.
;
lcall LoadConfigInit
;----------------------------------; Initialize C Run-Time Environment
;----------------------------------IF ( C_LANGUAGE_SUPPORT )
IF ( SYSTEM_SMALL_MEMORY_MODEL )
mov A,0
; clear the 'bss' segment to
zero
mov [__r0],<__bss_start
BssLoop:
cmp [__r0],<__bss_end
jz
BssDone
mvi [__r0],A
jmp BssLoop
BssDone:
mov A,>__idata_start
; copy idata to data segment
mov X,<__idata_start
mov [__r0],<__data_start
IDataLoop:
cmp [__r0],<__data_end
jz
C_RTE_Done
push A
romx
mvi [__r0],A
pop A
inc X
adc A,0
jmp IDataLoop
ENDIF ; SYSTEM_SMALL_MEMORY_MODEL
IF ( SYSTEM_LARGE_MEMORY_MODEL )
mov
reg[CUR_PP], >__r0
instructions
; force direct addr mode
; to use the Virtual Register
page.
; Dereference the constant (flash) pointer pXIData to access the
start
; of the extended idata area, "xidata." Xidata follows the end of
the
; text segment and may have been relocated by the Code Compressor.
;
mov
A, >__pXIData
; Get the address of the flash
mov
X, <__pXIData
;
pointer to the xidata area.
push A
64
romx
address
mov
pop
inc
adc
romx
address
swap
mov
the
; get the MSB of xidata's
[__r0], A
A
X
A, 0
; get the LSB of xidata's
A, X
A, [__r0]
; pXIData (in [A,X]) points to
;
flash
jmp
XIData structure list in
.AccessStruct
; Unpack one element in the xidata "structure list" that specifies
the
; values of C variables. Each structure contains 3 member elements.
; The first is a pointer to a contiguous block of RAM to be
initial; ized. Blocks are always 255 bytes or less in length and never
cross
; RAM page boundaries. The list terminates when the MSB of the
pointer
; contains 0xFF. There are two formats for the struct depending on
the
; value in the second member element, an unsigned byte:
; (1) If the value of the second element is non-zero, it represents
; the 'size' of the block of RAM to be initialized. In this case,
the
; third member of the struct is an array of bytes of length 'size'
and
; the bytes are copied to the block of RAM.
; (2) If the value of the second element is zero, the block of RAM
is
; to be cleared to zero. In this case, the third member of the
struct
; is an unsigned byte containing the number of bytes to clear.
.AccessNextStructLoop:
inc
X
; pXIData++
adc
A, 0
.AccessStruct:
; Entry point for first block
;
; Assert: pXIData in [A,X] points to the beginning of an XIData
struct.
;
M8C_ClearWDT
; Clear the watchdog for long
inits
push A
romx
; MSB of RAM addr (CPU.A <*pXIData)
mov
reg[MVW_PP], A
;
for use with MVI write
operations
inc
A
; End of Struct List?
(MSB==0xFF?)
65
jz
.C_RTE_WrapUp
complete
pop
A
inc
X
adc
A, 0
push A
romx
*pXIData)
mov
[__r0], A
[reg[MVW_PP],[__r0]]
pop
A
inc
X
adc
A, 0
push A
romx
*pXIData)
jz
.ClearRAMBlockToZero
mov
[__r1], A
__r1
pop
A
;
Yes, C runtime environment
; restore pXIData to [A,X]
; pXIData++
; LSB of RAM addr (CPU.A <; RAM Addr now in
; restore pXIData to [A,X]
; pXIData++ (point to size)
; Get the size (CPU.A <; If Size==0, then go clear RAM
;
else downcount in
; restore pXIData to [A,X]
.CopyNextByteLoop:
; For each byte in the structure's array member, copy from flash to
RAM.
; Assert: pXIData in [A,X] points to previous byte of flash source;
;
[reg[MVW_PP],[__r0]] points to next RAM destination;
;
__r1 holds a non-zero count of the number of bytes
remaining.
;
inc
X
; pXIData++ (point to next data
byte)
adc
A, 0
push A
romx
; Get the data value (CPU.A <*pXIData)
mvi
[__r0], A
; Transfer the data to RAM
tst
[__r0], 0xff
; Check for page crossing
jnz
.CopyLoopTail
;
No crossing, keep going
mov
A, reg[ MVW_PP]
;
If crossing, bump MVW page
reg
inc
A
mov
reg[ MVW_PP], A
.CopyLoopTail:
pop
A
; restore pXIData to [A,X]
dec
[__r1]
; End of this array in flash?
jnz
.CopyNextByteLoop
;
No, more bytes to copy
jmp
.AccessNextStructLoop
;
Yes, initialize another RAM
block
.ClearRAMBlockToZero:
pop
A
inc
X
byte)
adc
A, 0
push A
romx
*pXIData)
; restore pXIData to [A,X]
; pXIData++ (point to next data
; Get the run length (CPU.A <-
66
mov
mov
[__r1], A
A, 0
; Initialize downcounter
; Initialize source data
.ClearRAMBlockLoop:
; Assert: [reg[MVW_PP],[__r0]] points to next RAM destination and
;
__r1 holds a non-zero count of the number of bytes
remaining.
;
mvi
[__r0], A
; Clear a byte
tst
[__r0], 0xff
; Check for page crossing
jnz
.ClearLoopTail
;
No crossing, keep going
mov
A, reg[ MVW_PP]
;
If crossing, bump MVW page
reg
inc
A
mov
reg[ MVW_PP], A
mov
A, 0
; Restore the zero used for
clearing
.ClearLoopTail:
dec
[__r1]
; Was this the last byte?
jnz
.ClearRAMBlockLoop
;
No, continue
pop
A
;
Yes, restore pXIData to
[A,X] and
jmp
.AccessNextStructLoop
;
initialize another RAM
block
.C_RTE_WrapUp:
pop
A
; balance stack
ENDIF ; SYSTEM_LARGE_MEMORY_MODEL
C_RTE_Done:
ENDIF ; C_LANGUAGE_SUPPORT
;------------------------------; Voltage Stabilization for SMP
;------------------------------IF ( POWER_SETTING & POWER_SET_5V0)
; 5.0V Operation
IF ( SWITCH_MODE_PUMP ^ 1 )
; SMP is operational
;- - - - - - - - - - - - - - - - - - - - - - - - - - - - - - - - - ; When using the SMP at 5V, we must wait for Vdd to slew from 3.1V
to
; 5V before enabling the Precision Power-On Reset (PPOR).
;- - - - - - - - - - - - - - - - - - - - - - - - - - - - - - - - - or
reg[INT_MSK0],INT_MSK0_SLEEP
M8C_SetBank1
and
reg[OSC_CR0], ~OSC_CR0_SLEEP
or
reg[OSC_CR0], OSC_CR0_SLEEP_512Hz
M8C_SetBank0
M8C_ClearWDTAndSleep
; Restart the sleep timer
mov
reg[INT_VC], 0
; Clear all pending
interrupts
.WaitFor2ms:
67
tst
reg[INT_CLR0], INT_MSK0_SLEEP
Interrupt Status
jz
.WaitFor2ms
has passed
ENDIF ; SMP is operational
ENDIF ; 5.0V Operation
; Test the SleepTimer
; Branch fails when 2 msec
;------------------------------; Set Power-On Reset (POR) Level
;------------------------------M8C_SetBank1
IF (POWER_SETTING & POWER_SET_5V0)
IF (POWER_SETTING & POWER_SET_SLOW_IMO)
ELSE
IF ( CPU_CLOCK_JUST ^ OSC_CR0_CPU_24MHz )
POR in user code, if desired
ELSE ; 24HMz
or
reg[VLT_CR], VLT_CR_POR_HIGH
trip point required
ENDIF ; 24MHz
ENDIF ; Slow Mode
ENDIF ; 5.0V Operation
; 5.0V Operation?
; and Slow Mode?
;
No, fast mode
;
As fast as 24MHz?
;
no, set midpoint
;
;
yes, highest POR
M8C_SetBank0
;---------------------------; Wrap up and invoke "main"
;---------------------------; Disable the Sleep interrupt that was used for timing above. In
fact,
; no interrupts should be enabled now, so may as well clear the
register.
;
mov reg[INT_MSK0],0
; Everything has started OK. Now select requested CPU & sleep
frequency.
;
M8C_SetBank1
mov reg[OSC_CR0],(SELECT_32K_JUST | PLL_MODE_JUST |
SLEEP_TIMER_JUST | CPU_CLOCK_JUST)
M8C_SetBank0
; Global Interrupt are NOT enabled, this should be done in main().
; LVD is set but will not occur unless Global Interrupts are
enabled.
; Global Interrupts should be enabled as soon as possible in
main().
;
mov reg[INT_VC],0
; Clear any pending interrupts which
may
; have been set during the boot
process.
IF ENABLE_LJMP_TO_MAIN
68
ljmp
_main
; goto main (no return)
ELSE
lcall _main
.Exit:
jmp .Exit
off or reset
ENDIF
; call main
; Wait here after return till power-
;--------------------------------; Library Access to Global Parms
;--------------------------------;
bGetPowerSetting:
_bGetPowerSetting:
; Returns value of POWER_SETTING in the A register.
; No inputs. No Side Effects.
;
mov
A, POWER_SETTING
ret
;--------------------------------; Order Critical RAM & ROM AREAs
;--------------------------------; 'TOP' is all that has been defined so far...
; ROM AREAs for C CONST, static & global items
;
AREA lit
(ROM, REL, CON)
; 'const' definitions
AREA idata
(ROM, REL, CON)
; Constants for
initializing RAM
__idata_start:
AREA func_lit
__func_lit_start:
(ROM, REL, CON)
; Function Pointers
IF ( SYSTEM_LARGE_MEMORY_MODEL )
; We use the func_lit area to store a pointer to extended
initialized
; data (xidata) area that follows the text area. Func_lit isn't
; relocated by the code compressor, but the text area may shrink
and
; that moves xidata around.
;
__pXIData:
word __text_end
; ptr to extended idata
ENDIF
AREA psoc_config
Unload
AREA UserModules
(ROM, REL, CON)
; Configuration Load &
(ROM, REL, CON)
; User Module APIs
; CODE segment for general use
;
AREA text (ROM, REL, CON)
__text_start:
; RAM area usage
;
69
AREA data
__data_start:
(RAM, REL, CON)
AREA virtual_registers (RAM, REL, CON)
AREA InterruptRAM
(RAM, REL, CON)
AREA bss
(RAM, REL, CON)
__bss_start:
; initialized RAM
; Temp vars of C compiler
; Interrupts, on Page 0
; general use
; end of file boot.asm
70
APPENDIX C
Actual Photos
71
Figure 6.4 Internal View of the Prototype
Figure 6.5 Top View of the Prototype
72
Figure 6.6 Front View of the Prototype
Figure 6.7 Back View of the Prototype
73
APPENDIX D
28Pin CY8C29466 Datasheet
74
75
76
77
78
79
80
81
APPENDIX E
LM324 Datasheet
82
83
APPENDIX F
MPS-2000 Pressure Sensor Datasheet
84
85
86
APPENDIX G
L78XX Voltage Regulator Datasheet
87
88
89
90
91
92
APPENDIX H
User’s Manual
93
Parts of the Design Prototype
8
1
6
2
7
4
3
5
1. LCD Screen
2. Arm Cuff
3. Air Hose
4. Power/Start/Stop Button
5. Mode/Setup Button
6. Up Button
7. Down Button
8. AC Adaptor Slot
94
Parts of the LCD Display
3
5
6
1
8
2
4
7
9
1. Systolic Reading
2. Diastolic Reading
3. Hour
4. Minute
5. Month
6. Day
7. Memory Module (A,B,C & D)
8. Memory Location (1-30)
9. Pulse Rate Reading
95
Tips before taking a blood pressure measurement
1. Avoid eating, smoking, exercising and bathing for 30 minutes before
taking a measurement. Rest at least 15 minutes before taking a
measurement.
2. Stress raises blood pressure. Avoid taking measurements during stressful
times.
3. Measurement should be taken in a quiet place.
4. Remove tight-fitting clothing from your arm.
5. Seat in a chair with your feet flat on the floor. Rest your arm on a table so
that the cuff is at the same level as your heart.
6. Remain still and do not talk during the measurement.
7. A single measurement does not provide an accurate indication of your
true blood pressure. You need to take several readings over a period of
time. Try to measure your blood pressure at about the same time for
consistency.
8. Wait 2-3 minutes between measurements. The wait time allows the
arteries to return to the condition prior to taking blood pressure
measurement. You may need to increase the wait time depending on your
individual physiological characteristics.
96
Procedure in getting blood pressure reading
1. Wrap the arm cuff into your upper arm well gripped. Be sure to place the
cord a distance of about two fingers above the brachial artery. The grip
should be able to allow at most two fingers be inserted inside the arm
cuff.
2. Press the power button and hold it for a couple of seconds. The LCD
screen will display 0/0 when you first press the power button.
3. To start getting the blood pressure reading, press the start button lightly.
Note. After pressing the start button, the device will automatically pump
air into the arm cuff; expect the cuff to get tighter until it reaches around
190 mmHg.
4. The arm cuff will deflate gradually while the reading in the LCD screen is
decreasing.
5. The LCD will display the systolic reading, diastolic reading and pulse rate
reading.
6. After a few seconds display SA will be seen as a sign that readings are
stored in the memory.
7. After so, remove the arm cuff carefully.
8. To turn the device off, press and hold the power button.
Note: User may press stop button to discontinue the process of getting the
blood pressure reading.
97
Procedure in setting the date and time
1. Press the setup button.
2. The month mode will blink.
3. Press the mode button to select which mode to change such as hour,
minute, month and day.
4. After selecting the mode, use the up and down button to change the
setting.
5. Setting will be saved by pressing the mode button until it goes back to the
month mode and hold for a second.
6. The setting is changed if the mode stops blinking.
Note: Configuring the date and time can only be done before starting the
operation.
Procedure in recalling previous reading
1. Press and hold the power button.
2. Press setup button.
3. The memory location will blink.
4. Press the mode button to select memory module (A, B, C & D).
5. The memory module will blink. (A is the default memory module).
6. Press the up and down button to select from A to D.
7. After selecting the memory module, press mode button to go back to the
memory location mode.
8. Press up and down button to view the readings.
98
Troubleshooting Procedures
Problems
Causes and Solutions
No Power.
Get the AC adapter, plug it to the jack
No Display on the LCD Screen.
of the prototype then connect it to the
power outlet. Charge the prototype.
There is a display but cannot start the The power of the battery is insufficient,
operation.
charge the prototype.
The display is dim.
An ‘EE’ error appears after getting An accurate reading cannot be
blood pressure measurement.
obtained. The arm cuff in underinflated. Wait 15 minutes and measure
again. Try loosening the cuff to allow
blood circulation in your arm while
waiting.
The arm cuff does not inflate after The tube inside the case is not
starting.
connected to the sensor. Connect the
tube properly.
Measurement values appear too high Blood pressure varies constantly.
or too low.
Review tips before taking blood
pressure.
The LED does not lit up while using the The AC adapter is not properly
AC adapter and charging.
connected to the jack. Connect the
adapter properly.
99
Safety Measures
1. Do not spill any liquid or insert any foreign objects
Do not spill any liquids or insert any foreign objects into the PSoC
Based Blood Pressure Monitor or the adapter. If any liquids or foreign
objects enter the system, immediately remove the adapter from the wall
outlet. Continued use could cause fire damage to the system.
2. Do not expose to strong impacts
Do not expose the blood pressure meter to strong impact by
striking the system with other objects, or by dropping it. If the LCD is
damaged, it could cause injury, or if the built in battery pack is damaged
and builds up heat, it could cause burns.
3. Do not use any adapters other than the one suited to the PSoC Based
Blood Pressure Monitor
Be sure to use the adapter suited to this device. Failure to do such
could cause fire or injury.
4. Do not use any power source other than household power.
The adapter can only be used with household power (220 Volts),
such as overseas; it could cause fire or injury.
5. Do not use defective adapter.
Do not use a deformed adapter or one with damaged adapter
prongs. Doing so could cause fire or electric shock.
6. Insert the adapter prongs fully into the wall outlet.
Insert the adapter prongs fully into the wall outlet. If it is inserted
inappropriately, it could cause fire or electric shock.
7. Do not damage the adapter itself and cord.
8. The LCD screen is made of glass. External causes, including striking it with
an object, pushing hard on it or dropping the Blood Pressure Meter could
break it. Take great care when handling it.
9. Although an LCD screen is made using high precision technology, due to
the characteristics of the LCD, there are some dots that do not light up or
that never turn OFF. However, please take note that this is not a defect.
100