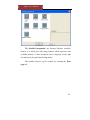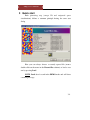
1
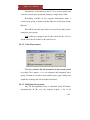
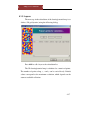
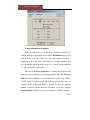
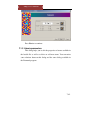
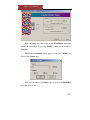
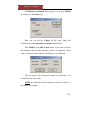
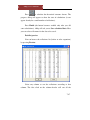
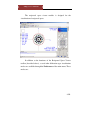
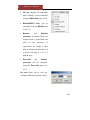
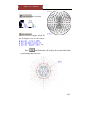
eMap
User’s Manual
v. 1.2
Copyright © 2003-2008 AnaliteX
July 2008
Visit our web-page at: www.analitex.com
eMap User’s Manual
Table of Contents
1 Preface ....................................................................................... 2-3
1.1
General introduction
2-3
1.2
Support offerings
2-4
1.3
Reporting problems
2-4
2 Installation ................................................................................. 2-5
2.1
Installation
2-5
2.2
User interface
2-6
3 Quick start ................................................................................. 3-9
4 Calculation of an electron density map ................................... 4-10
4.1.1
File formats ................................................................. 4-10
4.1.2
Symmetry .................................................................... 4-13
4.1.3
Layers .......................................................................... 4-17
5 Peak search .............................................................................. 5-20
6 3D viewer ................................................................................ 6-26
6.1.1
The level control ......................................................... 6-26
6.1.2
Rotating and zooming the model ................................ 6-28
6.1.3
Model animation ......................................................... 6-29
6.1.4
Clipping planes ........................................................... 6-30
6.1.5
3D view settings .......................................................... 6-35
7 Theoretical structure factors calculation ................................. 7-39
7.1.1
File formats ................................................................. 7-39
7.1.2
Symmetry .................................................................... 7-41
7.1.3
Atomic parameters ...................................................... 7-42
7.1.4
Structure factors calculation ....................................... 7-44
8 Reciprocal space viewer .......................................................... 8-49
8.1
Working side pane dialog bars.
8-52
8.1.1
The Diffraction dialog pane ........................................ 8-53
8.1.2
The Kikuchi dialog pane ............................................. 8-55
8.1.3
The Precession dialog pane ......................................... 8-57
8.2
Simulating Precession Patterns
8-59
8.3
Symmetry determination
8-60
8.4
Simulation of mayenite along [111]
8-61
9 References ............................................................................... 9-62
2-2
eMap User’s Manual
1 Preface
This preface provides information about the eMap User’s
Manual and links to AnaliTEX technical support.
1.1 General introduction
eMap is a program which allows you to perform the following
types, or processing modules, of data handling:
1.
Calculate an electron density (from X-ray diffraction) or
electrostatic potential (from electron diffraction) maps and
save them in a file with special format, supported by eMap;
2.
Perform a peak search in the calculated three-dimensional
electron density/electrostatic potential maps. The peak
positions can be saved in RES file format which can be read
directly into Diamond or any other program for atomic
structure visualization;
3.
Visualization of calculated maps in 3D with a possibility of
rotation and zooming in real-time. There is a possibility to
add clipping planes in order to see internal details or slices of
the map;
4.
Calculate theoretical structure factors using tables of atomic
scattering factors for X-ray and electron crystallography.
5.
Visualize diffraction patterns for X-rays and electrons.
2-3
eMap User’s Manual
1.2 Support offerings
You
can
always
contact
AnaliTEX
by
email
([email protected]).
1.3 Reporting problems
If you can have problems running eMap or any component,
please report them to the AnaliTEX support team by email
([email protected]).
2-4
eMap User’s Manual
2 Installation
eMap runs under Windows® 2000, XP and Vista. About 65MB
of hard disk space is needed for the eMap program.
2.1 Installation
Install the program by clicking on Setup.exe located in the
directory eMap on the CD. The program will ask you to choose
destination
location,
the
default
is
C:\Program
Files\AnaliTEX\eMap. Use Browse if you want to put the program
in another directory, or on another drive. Click Next when the
program folder and drive are as required. Then you will be asked to
select program folders under which eMap is run from the Start menu.
Select the program folder (default = eMap) and click on Finish.
IMPORTANT: Windows Vista users and users with limited
access rights may need to run eMap as Administrator for the first time.
For example, Windows Vista has enhanced security setting. Windows
Vista users only: using Windows Explorer locate the eMap executable
(under default location C:\Program Files\AnaliTEX\eMap or the
destination folder chosen by the user during the installation step).
Click on the eMap program using the right mouse button and choose
Run as administrator from the context menu
2-5
eMap User’s Manual
2.2 User interface
The user interface of eMap is designed in order to achieve the
principle "The program drives the user". Thus, the most common
errors and mistakes in the data handling process can be avoided.
Any processing module can be started from the Start page.
NOTE: This page will only appear if the MS Internet Explorer is
installed. In case if eMap will failed to locate the Internet Explorer
then the simplified Installed components dialog will appear.
2-6
eMap User’s Manual
The modules browser is a page with image buttons, which
represent each available module. A short description text is displayed
on the right side when you select the button using mouse. In order to
launch a required component, click on the short description text on the
right side of the corresponding image button.
2-7
eMap User’s Manual
The Installed components (no Internet Explorer installed)
browser is a dialog box with image buttons, which represent each
available module. A short description text is displayed on the right
side when you select the button using mouse.
The modules browser can be reached by selecting the Start
page tab.
2-8
eMap User’s Manual
3 Quick start
Each processing step (except 3D and reciprocal space
visualizations) follows a common principle having the same start
dialog
Here you can always choose a recently opened file (mouse
double-click on the name in the Recent files column) or load a new
one by pressing Load.
NOTE: Load doesn’t work in the DEMO mode and will show
a warning message.
3-9
eMap User’s Manual
4 Calculation of an electron density map
You can start the module by pressing
from the Start
page.
Load a desired file or double-click on a recently opened file.
4.1.1 File formats
eMap supports 3 different file formats right now.
4.1.1.1 TXT files
Any text file TXT can be simply edited. The format is as
follows. Any line starting with semi-colon ';' is treated as a comment
line.
Example:
; a b c Alpha Beta Gamma – this is a comment line
The 1st non-comment line must have the unit cell parameters
separated by space(s) or tab(s):
a b c α β γ.
Example:
40.687
40.687 12.546
90
90
120
All following lines must have 5 numbers separated by space(s)
or tab(s) and contain
h k l Ampl Phase. Here h, k, l are Miller indices, Ampl and
Phase are the corresponding structure factor amplitude and phase (in
degrees).
4-10
eMap User’s Manual
Example of input file:
Comments to each line of the
file
Line description
; a b c Alpha Beta Gamma
Comment line
50 50 50 90 90 90
a b c α β γ
1 0 0 2000 0
h
0 0 2 2000 0
…
1 0 1 8000 180
…
k
l
Ampl
Phase
4-11
eMap User’s Manual
4.1.1.2 HKL files
There are two different types of HKL files supported by eMap.
The first is an output from Triple2, the second is an output from
TriMerge (Calidris, Sweden). Any text file can be simply edited and
then the TXT extension can be changes to HKL. The format is as
follows. Any line starting with semi-colon ';' is treated as a comment
line.
TriMerge file example
Triple2 file example
; Comment
SpaceGroup: 4
SpaceGroup 4
Cell: 42.7 41.7 73.0 90 104.6
90
Cell_A 42.7
KASH_Radius: 27.66
Cell_B 41.7
Format: h k l a p
Cell_C 73.0
--------------------------
Alpha 90
Beta 104.6
Gamma 90
H
K
L
Amp
Pha
--------------------0
0
-1
253.3
180
1
0
0
461.7
0
1
0
-1
219.6
0
0
1
-1
326.8
75
0
0
-2
875.3
0
0
0
-1
253.3
180
1
0
0
461.7
0
1
0
-1
219.6
0
0
1
-1
326.8
75
0
0
-2
875.3
0
4-12
eMap User’s Manual
4.1.2 Symmetry
The program will automatically jump to the next dialog Select
the symmetry…:
Here you can:
1. Change the space group by pressing Modify or clicking
inside the box with space group name (Cm).
2. Change the unit cell parameters by pressing Modify;
You can press Next > after expansion (if needed).
4.1.2.1 Space Group
The Space Group Browser dialog:
4-13
eMap User’s Manual
The first step in editing a space group is to specify its name or a
number (1 to 230).
In the upper List Box under Hermann-Mauguin symbol or
space group number you can put any of the mentioned and press
ENTER on your keyboard. The Space Group Browser will try to
locate the space group by symbol or its number. In case of error the
Browser will notify you by a warning. You must use the correct form
of the name for the space group without any spaces. You can use the
short symbol (Cm) or the less ambiguous full international symbol
(C1m1). The full symbol allows you to specify unconventional
symmetry settings. For example, in monoclinic space groups you can
select any of a, b and c as the unique axis.
For the space group number the Browser will assume the
standard setting only.
4-14
eMap User’s Manual
Alternatively, you can browse the Tree List of space groups and
select the desired space group and setting by a single mouse-click.
Everything available in the program information about a
selected space group is displayed on the right side of the Space Group
Browser.
Press OK if you made your choice or Cancel if you don't want to
change the space group.
Note: If the space groups in the List Box and in the Tree List are
not the same, the one in the List Box will be used.
4.1.2.2 Unit cell parameters
The dialog restricts the cell parameters to the crystal system
by default. For example, a ≡ b for tetragonal and hexagonal space
groups. Unmark it if you have non-standard space group settings and
would like to change the data in disabled edit boxes.
4.1.2.3 Reflections list expansion
Any 3D density/potential map is calculated using 3D Fourier
transformation. In this case the program requires a list of all
4-15
eMap User’s Manual
reflections. After pressing Next button eMap will try to expand loaded
reflections (if they are unique in the file). In case of large data it may
take some time.
The expansion of reflections procedure proceeds with merging
them first. eMap merges all symmetry-related reflections (if any).
Then expands them in order to get a full list of symmetry-related
reflections using the specified space group's symmetry operations.
However, only one of the two reflections in a Friedel pair is
generated, so hkl is included but not hk l .
4-16
eMap User’s Manual
4.1.3 Layers
The next step in the calculation of the density/potential map is to
define a 3D grid (matrix) using the following dialog:
Press Add to add a layer to the calculation list.
The 3D density/potential map is calculated as a matrix of points.
The number of points along x, y and z can be varied freely. Default
values correspond to the maximum resolution, which depends on the
outmost available reflection.
4-17
eMap User’s Manual
A map with uniform resolution.
In the example above a = 39.668 Å, b = 8.158 Å, c=23.392 Å, β
= 90.05˚ and space group Cm. If you choose Resolution and type 1 in
each of X-dir, Y-dir and Z-dir boxes, the grid resolution becomes 1
Ångström in all 3 directions. Switch back to Sections number. You
will see that the grid of the map now has 39, 8 and 23 points along the
x, y and z directions, respectively.
The idea of the Layer properties is to define the 3D grid in real
space in order to calculate your density/potential map. The Start and
End fractional coordinates are by default all set in the range of [0 to
1]. This defines a single unit cell. The program divides each range, for
example in the X-direction (EndX – StartX) by the corresponding
number of sections for this direction SectionsX, if you have selected
Section number. Thus you get the resolution as (EndX – StartX) /
4-18
eMap User’s Manual
SectionsX etc. On the other hand, if you define the resolution along
each of X, Y and Z directions, the procedure is the opposite – the
program calculates the number of sections by (EndX – StartX) /
ResolutionX. Why do we need the number of sections and the
resolution? The number of sections defines the grid in 3D real space
and eMap will calculate the value of density/potential in every grid
point. In the above example you'll get 39*8*23 = 7176 points. The
resolution defines the grid step in real and reciprocal spaces.
With higher resolution, the file size will grow proportionally.
Each grid point occupies 4 bytes in the file (float data type). Thus the
file size is four times larger than the number of points. In addition to
that, eMap pre-calculates the same map with 1 byte size for each grid
point. This adds 25% to the file size. Usually, there are no problems
working with files around 100 Mb (except 3D viewer, which is a
really memory consuming module!). This corresponds to a map with
300x300x300 grid points.
GENERAL NOTES.
A. The calculated density/potential map is not normalized by the
scale factor of 1/(2·V) where V is the volume of the unit cell. The
normalization factor can be added on demand.
B. You can use non-integer Miller indices hkl. This is suitable
for some applications such as quasicrystals.
4-19
eMap User’s Manual
5 Peak search
The peak search finds the highest peaks in the calculated map
and lists them as xyz fractional coordinates.
The 3D viewer can be started from the Start page using
.
A dialog with a list of recent files will appear as mentioned in
the Quick start chapter. Double click or press Load in order to load an
EDM file.
The following dialog will appear:
This dialog helps to choose a suitable value of the
density/potential threshold in the Threshold density value frame.
This value is critical for the peak search algorithm because it looks for
groups of connected grid points in the calculated 3D map, which are
5-20
eMap User’s Manual
above the threshold value. Such a group will be treated as a single
peak. The following diagram can represent the pixel connection rules:
This picture shows a part of a map where eMap will find 9 wellseparated peaks (on the left). The threshold value is too low, so there
are peaks connected to each other (on the right).
It is easy to select a desired threshold value in order to separate
"atoms" which can be treated as peaks in the calculated 3D map. The
position of the peak will be determined by the position of the
maximum value within the group of the grid points.
You can check each layer moving the scroll bar in the Layer
position and coordinate frame. There is a possibility to choose any
projection type (X, Y and Z). In case of big unit cell dimensions you
can make a big view of the layer by pressing View. This will create a
special window:
5-21
eMap User’s Manual
Here you can resize the window in order to enlarge the image.
At the same time you can change the threshold value by pressing <
THRESH (decrease) or THRESH > (increase) on the top left.
Moving from one layer to another can be done using < LAYER
(decrease layer number) or LAYER > (increase layer number). The
information about the current layer and the threshold value are
displayed at the top right corner.
When you are satisfied with the results, close the view window
and press Next. The peak search dialog will open:
5-22
eMap User’s Manual
Here you can set up the initial data for the peak search.
The following possibilities can be considered during the peak
search:
1. The use of the asymmetric unit (ASU). You can mark/unmark the
use the asymmetric unit only in case you want to perform the
search within ASU/whole unit cell respectively;
2. You can change the Min peak distance (in Ångström) between
peaks. eMap removes all peaks which are too close to each other
leaving the strongest peak;
3. The Number of atoms is calculated by dividing the volume of the
whole unit cell or ASU by the Average atomic volume (default is
20 Å3/atom). This number limits the total number of peaks to be
printed into an output file. The program will output only the
5-23
eMap User’s Manual
strongest peaks when the total number of peaks found in the 3D
map is greater than the Number of atoms;
4. You can change the output file name or select an already existing
file for overwriting. The program makes the output in RES file
format which can be loaded into a structure visualization program
(such as Diamond);
Pressing Search peaks starts the peak search. The progress line
will run twice. The first time eMap looks for peaks. The second time
the program processes the list of found peaks using the Number of
atoms, Minimum peak distance and the ASU (if marked). Any of
these two operations can be aborted at any time pressing Abort.
The results of the peak search will be written into the RES file
with the file name specified in the Results file name edit box.
In the current version eMap assigns the atomic symbol of carbon
(C) to all atoms. The peak height of a corresponding atom appears
instead of the temperature factor in the output file. This helps to
distinguish really strong (heavy atoms) from light peaks:
TITL eMap output
CELL 1.5406
ZERR 4
8.158
0.000
12.342
14.452
90.000
90.000
90.000
0.000
0.000
0.000
0.000
0.000
LATT -1
SFAC C
C1
1
0.000000
0.583333
0.828571
1
70011.74
C2
1
0.500000
0.383333
0.328571
1
70011.73
C3
1
0.000000
0.883333
0.000000
1
69661.37
C4
1
0.500000
0.083333
0.500000
1
69661.37
C5
1
0.000000
0.400000
0.314286
1
68412.18
5-24
eMap User’s Manual
C6
1
0.500000
0.566667
0.814286
1
68412.17
C7
1
0.500000
0.783333
0.328571
1
66551.02
C8
1
0.000000
0.183333
0.828571
1
66551.02
C9
1
0.775000
0.583333
0.100000
1
64150.78
C10
1
0.275000
0.383333
0.600000
1
64150.78
When the peak search is performed over the whole unit cell,
eMap writes LATT –1 (corresponds to the P1 space group) into the
output file, because the file contains all atoms.
The peak list can be opened in any text editor and edited.
5-25
eMap User’s Manual
6 3D viewer
With 3D viewer you can see the 3D map.
The 3D viewer module can be started from the Start page
dialog using
.
Here we call 'voxel' a three-dimensional analog of a twodimensional pixel.
6.1.1 The level control
The most important property of the 3D viewer is that you can
change the threshold value and see changes in real-time. Press
on
the 3D viewer extra toolbar. The following dialog will appear:
The dialog displays the minimum and maximum values found in
the loaded map file. The default threshold value is always half-way
between minimum and maximum. You can change the threshold by
6-26
eMap User’s Manual
moving the scroll bar or editing manually the box to the right of the
Threshold label.
6.1.1.1 Estimate volume and surface area
The dialog shows the surface area and volume above the current
threshold in Å2 and Å3 per unit cell. The surface area is approximated
by triangles, which fit the best to the surface with the given threshold
value. Summing up all the values over the given threshold and
multiplying by the elementary volume of a single voxel gives the
approximation of the volume.
6-27
eMap User’s Manual
6.1.2 Rotating and zooming the model
Rotate the model with the mouse. Press and hold the left mouse
button within the 3D view area, move the mouse across the screen.
Zoom the model using the mouse wheel or A and Z buttons on your
keyboard.
The series of screenshots shows the sequential zooming the
loaded model by the mouse wheel.
6-28
eMap User’s Manual
6.1.3 Model animation
Model animation will set the 3D viewer in automatic rotation
mode or so-called animation mode, Preferences Animation from
the main menu. The animation can be toggled on / off.
Animatio
Animatio
n is ON:
n is
OFF:
Press and hold the left mouse button within the 3D view area,
move the mouse across the screen and release the button. The model
will continue to rotate in that direction (Animation mode).
6-29
eMap User’s Manual
6.1.4 Clipping planes
There is a possibility to use clipping planes which allow you to
cut away a part of space in order to see in details the internal content
of the map being visualized. Choose Preferences Clip planes from
the main menu or press
on the 3D viewer toolbar. The following
dialog will appear.
One should think about clipping planes as regular planes in their
mathematical definition. 3D viewer clips away everything which lies
on the negative side of each clipping plane. Negative or positive here
is a sign given by the following equation:
D = [n o p ] + d ,
6-30
eMap User’s Manual
where n is the clipping plane normal, the symbol ° means vector
dot-product, p is any given point and d is the distance of the plane
from the origin of coordinates. Any point, which lies on the same half
of space where normal to the plane is, gives positive D value. The
plane distance d is positive if the coordinate’s origin is on the positive
side of the clipping plane. The origin of coordinates (0, 0, 0) is always
in the middle of the unit cell. The plane distance d is in Ångström
units. The following picture shows an example of a plane (a part of a
plane) with its normal shown as an arrow:
All the points on the same side as the plane normal have positive
distance to the plane and negative if they are behind the plane.
You can design your clipping plane by editing the plane normal
using three different formats:
6-31
eMap User’s Manual
1. Reciprocal, when the plane normal components are treated as
h, k, l indices;
2. Real space Cartesian (orthogonal) plane normal coordinates;
3. Real space fractional (generally, non-orthogonal) plane
normal coordinates.
Any clipping plane is defined internally in eMap in real space
Cartesian coordinates. However often it is more convenient for the
user to define it in terms of reciprocal space by assigning hkl indices.
There are 3 clipping planes added to the Clipping planes dialog in the
example: n = (1, 0, 0), d = 30, n = (0, 1, 0), d = 30 and n = (0, 0, 1), d
= 30. The following sequence of 3D images represents step-by-step
addition and applying these three clipping planes:
6-32
eMap User’s Manual
Sequentially applying 3 clipping planes: (a) initial structure,
(b) adding (1, 0, 0) d = 30 clipping plane, (c) adding (0, 1, 0) d = 30
clipping plane,
(d) adding (0, 0, 1) d = 30 clipping plane. Clipped regions marked by
arrows.
Mark Reverse normal if the normal should be inversed. You
can limit the volume displayed by several planes. Press Add button to
add a plane into the list. Press Remove to remove the selected
clipping plane from the list. Select a plane in the list if you want to
change the value for already designed clipping plane. The current
6-33
eMap User’s Manual
plane settings (the plane normal components and the plane distance)
will be automatically displayed and ready to edit. To after the edited
values press Update.
Press Apply if you want to see the results of setting the clipping
planes.
The total number of clipping planes depends on the OpenGL
implementation. The number of clipping planes is limited by six in all
current (by the year 2004) implementations of OpenGL on all
available PC video cards. The total number of clipping planes can be
seen on the very top of the dialog – it shows the text of the frame as
Plane 1 of 6, where 6 is the maximum number of available clip planes
in the current OpenGL release.
NOTE: if your 3D video hardware is old and doesn't support
clipping planes on the hardware level the OpenGL software
implementation will clip your structure without using the hardware.
This can slow down the visualization during zooming or rotation.
6-34
eMap User’s Manual
6.1.5 3D view settings
Choose from the main menu Preferences Settings. The
following dialog will appear. You can choose the group of properties
you would like to change in the left upper box. Currently three basic
setting are available to change:
1. Fonts and colors;
2. Grid and axes;
3. Projection type.
Press Apply to see the changes in the 3D viewer. Press OK or
Cancel to leave the dialog.
6.1.5.1 Colors
Any color can be changed by clicking in the small colored box
on the left side of the explanation text (for example, black for the
background color). This will bring up the standard Windows Select
Color dialog:
6-35
eMap User’s Manual
Under basic colors you can choose the color needed. If a color is
missing you can define you own under Custom colors by selecting an
empty square and then clicking Define Custom Colors. Press OK
when ready.
Internal and external surfaces of your model can be changed in
the same way.
6.1.5.2 Axes properties
This dialog allows you to change the properties of the three
basic axes X, Y and Z and define the grids in X, Y and Z planes.
6-36
eMap User’s Manual
Toggle the plane grid ON / OFF by marking/unmarking Draw
lines in the corresponding tab (X axis, Y axis or Z axis).
Grid ON
Grid OFF
Each axis is spit into 10 steps from 0.0 to 1.0 with 0.1 step by
default. If you would like to change this, unmark Auto grid and edit
Splits. The default range [0.0; 1.0] can also be changed. Unmark Auto
scale and edit the minimum and maximum values.
Mark Show numbers if you would like to show the numbers
related to the axis.
6-37
eMap User’s Manual
You can assign a label to each axis, marking Label and inserting
a label text into the edit box.
The axis color and line color can be edited; activate Line color
and Axis color accordingly.
6.1.5.3 3D view type
The user can choose between two different projection types, socalled orthographic and perspective;
Orthographic view
Perspective view
With orthographic projection, points with the same x and y
coordinates fall exactly on top of each other when you look along the
z-axis. With perspective projection, the image looks like we would see
it in real life; points with the same x and y coordinates but different z
will be separated. Look at the corners of the unit cell as an example;
on the orthographic projection you see only 4 corners but in
perspective projection you see all 8 corners.
6-38
eMap User’s Manual
7 Theoretical structure factors calculation
You can calculate the theoretical structure factors for X-ray or
electrons using the module Theoretical structure factors.
The module can be started from the Start page by pressing the
corresponding button.
A dialog with a list of recent files will appear as mentioned in
the Quick start chapter (see 3). Double click or press Load in order to
load a file.
7.1.1 File formats
eMap supports 4 different file formats.
7.1.1.1 TXT files or eMap file format
Any text file TXT can be simply edited.
Any line starting with semicolon ';' is treated as a comment line.
An example of an input file is presented here.
Example:
title = Brucite
source = x-ray
wavelength = CuA1
min_d = 0.7000
max_d = 10.000000
space_group = 164
unit_cell_a = 3.150000
unit_cell_b = 3.150000
unit_cell_c = 4.770000
unit_cell_al = 90.000000
7-39
eMap User’s Manual
unit_cell_bt = 90.000000
unit_cell_gm = 120.000000
;atom Symb
Lbl
x
y
AN33, AN12, AN13, AN23
z
OCC OXID ISO_U AN11, AN22,
atom = Mg, Mg1, 0.000000, 0.000000, 0.000000,
atom = O, O1, 0.333330, 0.666670, 0.220500,
atom = H, H1, 0.333330, 0.666670, 0.418000,
The format is self-explanatory, except, maybe lines with atomic
parameters. Any line with atomic parameters must start with 'atom ='
text and has at least first 5 non-empty fields. Commas must separate
all fields. You can leave the field empty (space or tab) if you want to
use a default value.
The fields are:
1. the atomic element symbol (as in the Mendeleyev Periodic
Table);
2. the atomic label (can be any text label);
3. x, y and z fractional coordinates of the atom;
4. occupation factor (assumed 1.0 if missing);
5. oxidation number (assumed 0 if missing);
6. temperature factor.
In case of temperature factors see the table with examples:
Example 1
;isotropic temperature factor B
atom = N, N, 0.30901, -0.014, 0.11601, 1.0, 0.0, iso =
{B, 23.2}
7-40
eMap User’s Manual
Example 2
;isotropic temperature
numbers are omitted
factor
U,
occupancy
and
oxid.
atom = N, N, 0.30901, -0.014, 0.11601, , , iso = {U,
23.2}
Example 3
;anisotropic temperature factor B (other choices are U
or T(beta))
; instead of <B11> etc. must be real numbers
atom = Ca, Ca1, 0.30901, -0.014, 0.11601, , , aniso =
{B, <B11>, <B22>, <B33>, <B12>, <B13>, <B23>}
7.1.1.2 PDB files
PDB files from the protein data bank can be used as input.
7.1.1.3 CIF files
CIF files can be read directly by eMap. The program will search
only for specific information in the file, such as unit cell parameters,
symmetry and atomic co-ordinates.
7.1.1.4 INS files (Shelx)
Shelx instruction files (INS) files can be read directly by eMap.
The program will search only for specific information in the file, such
as unit cell parameters, symmetry and atomic parameters (the same as
in the case of CIF files).
7.1.2 Symmetry
This dialog has almost the same appearance and functions as
described in 0.
7-41
eMap User’s Manual
Press Next > to continue.
7.1.3 Atomic parameters
This dialog helps you to edit the properties of atoms available in
the loaded file as well as to delete or add new atoms. You can notice
some relations between this dialog and the same dialog available in
the Diamond program.
7-42
eMap User’s Manual
You can select a desired atom in the list under Atomic
parameters. Press Delete if you want to delete the atom. Press Insert
if you want to add a new atom to the list. Press Append if you want to
apply all the changes you've done to the atomic parameters of the
selected atom.
7.1.3.1 Atomic position, occupancy and symbol
You can edit the atomic position, the occupancy, and the symbol
or even change the element in the Atom frame.
The oxidation factor is not taken into the account in
calculations, however some file formats provide it, so it can be
observed in the Oxidation no. edit box if available (empty means 0).
7.1.3.2 Temperature factors
You can select the type of the temperature factor for the selected
atom in the Displacement frame. The following possibilities under
Type:
7-43
eMap User’s Manual
1. Not defined. All edit boxes will be disabled, no
temperature factor will be used during the calculations for
the selected atom;
2. U (anisotropic). The anisotropic U-temperature factor with
six components is required. Empty edit boxes mean 0;
3. B (anisotropic). The anisotropic B-temperature factor with
six components is required. Empty edit boxes mean 0;
4. Beta (anisotropic). The anisotropic β-temperature factor
with six components is required. Empty edit boxes mean 0;
5. U (isotropic). The isotropic U-temperature factor with a
single component is required. Empty edit box means 0;
6. B (isotropic). The isotropic B-temperature factor with a
single component is required. Empty edit box means 0;
Press Append to apply the changes.
7.1.4 Structure factors calculation
The following dialog helps to change the source, the wavelength
and the limits of calculations:
7-44
eMap User’s Manual
You can change the source type in the Wavelength frame and
modify the wavelength by pressing Modify. Source can be X-ray or
electrons.
The X-ray wavelength dialog appears if you press Modify for
X-ray as the Source type:
Here you can choose the Source type as well as the Radiation
type (Kα1, Kα2 or Kαm).
7-45
eMap User’s Manual
The Electron wavelength dialog appears if you press Modify
for electrons as the Source type:
Here you can edit the Voltage (in eV) only. eMap will
recalculate the Corresponding wavelength automatically.
Press Modify in the Min & max frame if you want to modify
the minimum and maximum limiting d-values (in Ångström). These
values affect on the total number of reflections to be calculated.
You can observe the theoretical number of reflections to be
calculated in the same frame.
NOTE: the minimum d-value cannot be less then λ/2, where λ is
the current wavelength.
7-46
eMap User’s Manual
Press
to calculate the theoretical structure factors. The
progress dialog will appear to show the state of calculations (it can
appear shortly for a small number of reflections).
Press Finish (the button becomes enabled only after you did
some calculations). eMap will ask you to Save calculated data. Here
you can select a file name for the data to be saved.
Peak list preview
You can browse the reflections list (before or after expansion)
by pressing Preview:
Select any column to sort the reflections according to that
column. The first click on the column header will sort all the
7-47
eMap User’s Manual
reflections in descending order. The second click will sort them in
ascending order (NOTE: not available in DEMO mode).
It is possible to edit the data in the five columns: h, k, l, F(hkl)
and Pha(deg). Double-click at the cell you want to edit. The other
columns are not available for editing because of their dependency on
these five.
NOTE: Usually, it is best to edit merged data files to keep the
correct relations between symmetry-related reflections. Edit function
is not available in DEMO mode.
7-48
eMap User’s Manual
8 Reciprocal space viewer
8-49
eMap User’s Manual
The reciprocal space viewer module is designed for the
visualization of reciprocal space.
In addition to the functions of the Reciprocal Space Viewer
toolbar (described above), several other diffraction type visualization
modes are available through the Preferences of the main menu. These
modes are:
8-50
eMap User’s Manual
•
2D view. Regular 2D diffraction
mode (default). Can be controlled
using the Diffraction pane (see 0);
•
Kikuchi/HOLZ lines. Can be
controlled using the Kikuchi pane
(see 8.1.2);
•
and
Rotation
Rotation
animation. In rotation mode, the
electron beam is rocked back and
forth
in
one
direction,
or
equivalently, the sample is tilted
back and forth in that direction. It
is fixed to the range [–1º to +1º],
with 30 steps.
•
Precession
and
Animate
precession. Can be controlled
using the Precession pane (see
8.1.3).
Set scale allows you to scale the
simulated diffraction pattern exactly.
8-51
eMap User’s Manual
8.1 Working side pane dialog bars.
The Reciprocal space viewer offers 3 pane dialog bars on the
right side (default) of the main view. These bars can be re-attached to
any side of the current view or the main window (left or right sides are
preferable due to the vertical nature of the dialog bar items
placement). Any dialog pane can be closed or hidden any time by
using the 2 buttons
in the right top corner of the bar.
8-52
eMap User’s Manual
8.1.1 The Diffraction dialog pane
The Diffraction dialog pane
allows the user to control the
current zone axis indices, the
Stereographic projection view,
show/hide the hkl Miller indices
for all reflections, show/hide the
annotation text, change some
parameters of the diffraction
pattern
such
as
the
beam
convergence angle, the voltage
(electron diffraction) and the
thickness (electron diffraction).
When you move around over
the stereographic projection, the
index at the bottom left gives
the nearest Miller indices. Leftclick
and
the
stereographic
projection will be reoriented,
with that zone axis [given at
upper left] at its center.
The Diffraction dialog pane.
8-53
eMap User’s Manual
does just that:
toggles on/off all
the descriptive text on the screen:
etc.
Press
and Simulator will display the electron diffraction
pattern along that zone axis:
8-54
eMap User’s Manual
8.1.2 The Kikuchi dialog pane
Kikuchi lines are useful for crystals
with small unit cells, i.e. < 8 Å or so.
…
The Kikuchi dialog pane allows the
user
to
control
the
disk
size
(convergence angle), the threshold for
Kikuchi
lines
visualization
and
mode.
HOLZ
lines
Checking
the
HOLZ lines will show the central disk
(000-spot) enlarged. NOTE: in order to
observe the HOLZ lines in the 000-disk
the following three rules should be
satisfied:
The Kikuchi dialog pane.
1. The
Ewald
switched ON, i.e.
sphere
should
be
with the frame
around it.
2. The calculated diffraction pattern
should contain enough spots (enough
resolution) so that the Ewald sphere can
reach the upper reciprocal layers;
3. The value in the Max HOLZ index
8-55
eMap User’s Manual
should be greater than or equal to 0
(default is 0).
Checking/unchecking the HOLZ shift
will switch ON/OFF the dynamical
correction in the calculations of the
HOLZ lines positions within the 000disk which leads to the so-called HOLZ
Central beam (highly
magnified using
lines shift.
).
8-56
eMap User’s Manual
8.1.3 The Precession dialog pane
The Precession dialog pane allows the
user to control the precession angle in
Precession and Precession animation
modes. The min and max values of the
precession angles can be changed by the
user. Here 0 and 3 degrees are used.
allows you to
follow how an electron precession
pattern is built up, namely by the
successive summation of a large number
of different electron diffraction patterns.
In order to see the same thing in the
electron microscope, the precession must
be slowed down to about 1 Hz.
For
more
information
about
the
precession technique, see the home
pages of NanoMEGAS at
The Precession dialog pane.
http://www.nanomegas.com/
8-57
eMap User’s Manual
1. At 0° precession the
electron diffraction pattern is
just the normal selected area
electron diffraction (SAED)
pattern.
2. As the precession angle is
increased the momentary
electron diffraction pattern
looks more and more
misaligned. Notice also that
the highest resolution
reflections are further out
with Precession ON.
3. When the precession angle
is even larger, the FOLZ
reflections (marked red here)
start to appear at high
resolution.
The pink circle is centered on a small red cross, at the distance
corresponding to the respective tilt in degrees. It is shown only when
the Spot visualization mode is set to the right:
8-58
eMap User’s Manual
8.2 Simulating Precession Patterns
When
simulating
electron
precession patterns, the most clear
patterns are obtained when choosing
Data type Fhkl:
and Rendering
Greyscale:
For the mineral mayenite along the [011] zone axis, the
precession pattern at 0° precession is:
Increasing the precession angle will lead to an expansion of the
central ZOLZ and even more marked broadening of the FOLZ circle.
Already at 0.2° precession angle the ZOLZ and FOLZ start to merge:
8-59
eMap User’s Manual
8.3 Symmetry determination
The combined information from ZOLZ and FOLZ is very useful
for symmetry determination. Notice in the case of mayenite above
(space group I 4 3d , a = 11.98 Å) that there are twice as many
diffraction spots per unit area in the FOLZ ring than in the central
ZOLZ are. Notice also that the diffraction spots in the FOLZ are
shifted relative those of the ZOLZ. This information can be used to
determine the space group, as described in detail by [7].
Experimentally, the symmetry can be determined from such
precession patterns by the program Space Group Determinator from
Calidris, Sollentuna, Sweden. An example is shown below:
8-60
eMap User’s Manual
8.4 Simulation of mayenite along [111]
Here the symmetry is 6mm in the ZOLZ but only 3m1 in the
FOLZ. This excludes tetragonal and hexagonal space groups, but
allows trigonal and cubic space groups.
The systematic absences (analysed in the bottom window) are
only compatible with rhombohedral (in hexagonal setting) [001] and
I-centered cubic, along [111].
8-61
eMap User’s Manual
9 References
1. Z.L. Wang. Elastic and Inelastic Scattering in Electron Diffraction and
Imaging. Springer. 1995, 476 pp.
2. E.J. Kirkland. Advanced Computing in Electron Microscopy. Springer.
1998, 250 pp.
3. R. Vincent, P. Midgley, Double conical beam-rocking system for
measurement
of
integrated
electron
diffraction
intensities.
Ultramicroscopy. 55 (1994) 271-282.
4. P. Oleynikov, S. Hovmöller, X.D. Zou. Precession electron diffraction:
observed and calculated intensities. Ultramicroscopy. 107 (2007), 523-533.
A
PDF
file
may
be
downloaded
from
http://www.fos.su.se/~svenh/index.html
5. P. Oleynikov. Exploring reciprocal space – electron diffraction, texture
and precession, Ph.D. thesis, Stockholm University, Department of
Structural Chemistry, 2006. (90 pages + 7 papers. Free copies may be
obtained from the author or via AnaliTEX or Calidris).
6. J.P. Morniroli, A. Redjaïmia, S. Nicolopoulos. Contribution of electron
precession to the identification of the space group from microdiffraction
patterns. Ultramicroscopy. 107 (2007) 514-522.
7. J.P. Morniroli, J.W. Steeds. Microdiffraction as a tool for crystal
structure identification and determination. Ultramicroscopy. 45 (1992)
219-239.
8. The whole of Ultramicroscopy Vol. 107 (2007) issues 6-7, is devoted to
the electron precession technique.
9. A large number of references on electron precession can be found at the
NanoMEGAS home page http://www.nanomegas.com/bibliography2.php.
9-62