1
Fairfield Osborn Preserve Outdoor Autonomous Wireless Network
Design and Implementation
Final Project Report
Sen Guan
Submitted to Dr. Farid Farahmand and the Senior Design Project Faculty of the
Engineering Science Department of Sonoma State University
Submitted in partial fulfillment of the requirements for the
Master of Science Degree
Aug 15, 2012
1
Fairfield Osborn Preserver Outdoor Autonomous Wireless Network
Design and Implementation for FOP
by Sen Guan
A thesis (project) submitted to
Sonoma State University
In partial fulfillment of the requirements
for the degree of
MASTER OF SCIENCE
in
Computer and Engineering Science
-----------------------------------------------------Dr. Farid Farahmand, Chair
-----------------------------------------------------Dr. Jack Ou
-----------------------------------------------------Dr. Ali Kujoory
-----------------------------------------------------Date
2
Acknowledgement
First and foremost, I would like to express my deep sense of gratitude to the
invaluable contributions of Dr. Farid Farahmand, my project advisor. I feel motivated and
encouraged every time I meet him. I would not complete this project without his
abundant help and invaluable assistance, support and guidance. Deepest gratitude is also
due to the members of the supervisory committee, Dr. Ali Kujoory and Dr. Jack Ou,
without their assistance this study would not have been successful. I also wish to express
my gratitude to Mr. Shahram Marivani, the network analyst and adjunct professor of
Engineering Department of SSU, who rendered help during the period of my project
work. My special thanks to Centre of Community Engagement of SSU. Without their
generous funding, this project would not have been materialized. I would also like to
acknowledge the work done by Shivam Aditya. His thinking and contributions helped me
to develop the solar power system of this project. Last but not least I wish to avail myself
of this opportunity, express a sense of gratitude and love to my friends and my beloved
parents for their manual support, Strength and help and for everything.
3
Abstract
Global climate change exerts a great influence to environment. The costs of unmitigated
climate change are potentially enormous. The environment impacts also cause harm to
wildlife. Therefore, collecting weather information and monitoring wildlife becomes a
major object to many researches and studies. Many weather stations and sensors have
been set in Fairfield Osborn Preserver (FOP). However, people have to collect data
manually. The proposed Fairfield Osborn Preserver WLAN (FOPW) project designs and
implements an outdoor autonomous Wireless Local Area Network (WLAN) located in
FOP. The FOPW covers certain areas where weather stations and sensors exist. By
connecting to the FOPW, weather stations and sensors are able to upload data
automatically. The system comprises three types of nodes: controller node, intermediate
node, and end node. The Controller Node has a wired Internet access and is in charge of
data roaming. The other two nodes will be set in the field to extend the wireless signal
coverage. There is no AC power resource outside the building of FOP and the
intermediate and end nodes are powered by the same solar power system. Besides the
hardware design, this paper also introduces some fundamental theories for the WLAN
characterizations, radio wave propagation, antenna principle, environmental impacts of
signal attenuation, and the solar power system. The last part of the paper includes some
experimental testing results and analysis. Through experimental measurements, we
demonstrate that the modified indoor network devices can be effective alternatives for the
expensive outdoor devices in an outdoor WLAN design. By increasing the transmit
power and antenna height, the FOPW design overcomes the huge path loss due to foliage.
We also evaluate the performance of FOPW in different weathers.
4
Contents
List of Figures .................................................................................................................... 7
List of Equations ............................................................................................................... 8
List of Tables ..................................................................................................................... 9
List of Abbreviations ...................................................................................................... 10
1. Introduction ............................................................................................................. 11
2. Background ............................................................................................................. 14
3. Design Architecture & Fundamental Theories .................................................... 17
3.1 Design Challenges .................................................................................................. 17
3.3 Fundamental Theories ............................................................................................. 20
3.3.1 Wireless LANs and Their Characterizations ................................................... 20
3.3.2 Router, Access Point and Repeater .................................................................. 22
3.3.3 Radio Wave Propagation ................................................................................. 23
3.3.4 Antenna Principle............................................................................................. 25
3.3.5 Environmental Impacts .................................................................................... 29
3.3.6 Solar Power ...................................................................................................... 31
4. Hardware Design & Implementation of FOPW Design ...................................... 33
4.1 High level Design ................................................................................................... 33
4.2 Design Details ......................................................................................................... 35
4.2.1 Office Node Design ......................................................................................... 36
4.2.2 Middle Node Design ........................................................................................ 37
4.2.3 End Node Design ............................................................................................. 40
4.2.4 Solar Power System Design ............................................................................. 41
4.3 Signal Strength Measurement & Locations Selection ............................................ 45
5. Experiment Results and Analysis .............................................................................. 49
5.1 Path Loss Measurement .......................................................................................... 49
5.2 The Network Performance Test .............................................................................. 50
5.2.1 Impact of the Antenna Height .......................................................................... 50
5.2.2 Impact of Different Antenna Propagation Directions ...................................... 52
5.2.3 Impact of the Weather Condition ..................................................................... 53
5.3 Power Consumption ................................................................................................ 55
5. Future Work ............................................................................................................ 55
6. Conclusion ............................................................................................................... 57
7. Reference ................................................................................................................. 60
5
Appendix A – Detailed Budget ...................................................................................... 62
Appendix B – Bill of Materials ...................................................................................... 63
Appendix C – Nodes Installation & Configuration ..................................................... 64
C1 - Office Node ........................................................................................................... 64
C2 - Middle Node ......................................................................................................... 65
C3 - End Node Installation Procedures ......................................................................... 68
Appendix D – Test Plan, Procedures& Results ........................................................... 69
D1 - Linksys 54G Router Power Consumption Measurement ..................................... 69
D2 - Signal Booster Power Consumption Measurement .............................................. 70
D3 - Hawking HOW2R1 Smart Repeater Power Consumption Measurement ............ 71
D4 - Middle Node & End Node Power Consumption Measurement ........................... 72
D5 - Environmental Impacts ......................................................................................... 73
D5.1 - Different Antenna Heights vs. Signal Strength ............................................. 73
D5.2 - Signal Strength vs. Different Weathers ......................................................... 74
D6 - Coverage Survey................................................................................................... 76
D7 - Received Signal Strength Survey ......................................................................... 77
Appendix E – Data Sheet ................................................................................................ 78
E1 - D-link DI-624 Router ............................................................................................ 78
E2 - Linksys 54G Router .............................................................................................. 78
E3 - Hawking HOW2R1 Smart Repeater ..................................................................... 78
E4 - Hawking HAO14SPD Panel Antenna ................................................................... 78
E5 - HawkingHSB2 Signal Booster .............................................................................. 78
E6 - USB Wireless Adapter .......................................................................................... 78
E7 - Sunforce 50048 Solar Panel Kits .......................................................................... 78
E8 - Power Bright PW400-12 Power Inverter .............................................................. 78
E9 - GPS Sensor............................................................................................................ 78
6
List of Figures
Figure 1 - Fairfield Osborn Preserve on Google Earth ..................................................... 12
Figure 2 - Weather Station Settled in Osborn Fairfield Preserve ..................................... 13
Figure 3 - Distances between Each Node & End Node Coverage .................................... 19
Figure 4 - Design Architecture ......................................................................................... 20
Figure 5 - WLAN Modes .................................................................................................. 21
Figure 6 - Panel Antenna Radiation Patterns [10] ............................................................ 26
Figure 7 - Directional Antenna Beamwidth [10] .............................................................. 27
Figure 8 - Fresnel Zone [11] ............................................................................................. 28
Figure 9 - Typical Solar Power System ............................................................................ 31
Figure 10 - Sunrise, Sunset, Dawn and Dusk Times in FOP [14] .................................... 33
Figure 11 – The High Level Data Communication Design .............................................. 34
Figure 12 – The FOP Communication System Block Diagram ....................................... 35
Figure 13 – The Office Node Design ................................................................................ 37
Figure 14 – The Middle Node Design .............................................................................. 38
Figure 15 - Linksys WRT54G Configuration ................................................................... 39
Figure 16 - The End Node Design .................................................................................... 41
Figure 17 - Solar Panel Tilt Angle .................................................................................... 44
Figure 18 - The Idea Installation [2] ................................................................................. 45
Figure 19 – The Wireless SSIDs Captured by InSSIDer [18] .......................................... 46
Figure 20 – The Signal Strength Captured by InSSIDer as Shown in Google Earth Map 47
Figure 21 - Middle Node and End Node potential locations ............................................ 48
Figure 22 - Middle Node Reception Survey ..................................................................... 48
Figure 23 – The Signal Strength for Different Antenna Heights ...................................... 51
Figure 24 - End Node Coverage in Different Antenna Height ......................................... 52
Figure 25 - Signal Propagation in Vertical Directions...................................................... 52
Figure 26 - Signal Propagation in Horizontal Directions ................................................. 53
Figure 27 - Network Performance in Different Weather .................................................. 54
Figure 28 - Total Cost of FOPW Design .......................................................................... 59
Figure 29 - Office Node Installation ................................................................................. 64
Figure 30 - Middle Node Installation................................................................................ 66
Figure 31 - Linksys WRT54G Configuration ................................................................... 66
Figure 32 - End Node Installation ..................................................................................... 68
Figure 33 - RSSI vs. Distance (Antenna Height is 3 feet) ................................................ 73
Figure 34 - RSSI vs. Distance (Antenna Height is 6 feet) ................................................ 73
Figure 35 - Signal Strength from Office Node to Middle Node in Sunny Weather ......... 74
Figure 36 - Signal Strength from Office Node to Middle Node in Foggy Weather ......... 75
Figure 37 - Coverage Survey Route.................................................................................. 76
Figure 38 - RSSI from Office Node to End Node ............................................................ 76
Figure 39 - Middle Node & End Node RSSI Survey........................................................ 77
7
List of Equations
Equation 1 - Free Space Path Loss [8] .............................................................................. 24
Equation 2 - Fresnel Zone Determination [11] ................................................................. 28
Equation 3 - 1st Fresnel Zone Radius [11] ....................................................................... 28
Equation 4 - Weissberger's Modified Exponential Decay Model [14] ............................. 30
Equation 5 – Estimation for the Number of Batteries....................................................... 43
8
List of Tables
Table 1 - The Comparison of Similar Outdoor WLAN Designs ...................................... 16
Table 2 - 802.11 Protocol Comparison ............................................................................. 22
Table 3 - Solar Panel Power Output ................................................................................. 32
Table 4 - Specifications of Each Node ............................................................................. 36
Table 5 - Linksys WRT54G Specifications ...................................................................... 39
Table 6 - Power Consumption for the Router, the Signal Booster and the Repeater ....... 42
Table 7 - Solar Panel Angel Calculation [17] ................................................................... 44
Table 8 - Middle Node Locations Comparison................................................................. 49
Table 9 – The Path Loss Comparison over The Links...................................................... 50
Table 10 - RSSIs in Different Directions .......................................................................... 53
Table 11 - Network Performance in Different Weather ................................................... 55
Table 12 - Middle Node & End Node Power Consumption ............................................. 55
Table 13 - Detailed Budget ............................................................................................... 62
Table 14 - Bill of Materials ............................................................................................... 63
Table 15 - Linksys WRT54G Router Power Consumption .............................................. 69
Table 16 - Smart Repeater Power Consumption Measurement ........................................ 71
Table 17 - Middle Node and End Node Power Consumption Measurement ................... 72
9
List of Abbreviations
AP - Access Points
ART- Average of Response Time
dBi - states the gain of an antenna in decibel as referenced to an isotropic source
DHCP -Dynamic Hosting Configuring Protocol
DIY - Do It Yourself
EIRP - Effective Isotropic Radiated Power
FCC - Federal Communication Committee
FSPL- Free Space Path Loss
FOP - Fairfield Osborn Preserve
FOPW - Fairfield Osborn Preserve WLAN
GPS - Global Positioning System
LOS - Line of Sight
MIMO- Multiple in & Multiple Out
MPP - Maximum Power Point
OFDM - Orthogonal frequency-division multiplexing
PLR - Packet Lost Rate
POE - Power Over Ethernet
RF - Radio Frequency
RSSI - Receive Signal Strength Indication
SSID - Service Set Identifier
SSU - Sonoma State University
VSWR-Voltage Standing Wave Ratio
WDS - Wireless Distribution System
Wi-Fi -Wireless Fidelity
WLAN - Wireless Local Area Network
10
1.
Introduction
Since last century, Earth's average surface temperature has increased more than
one degree Fahrenheit and the rate of warming is nearly three times. Most of scientists
believe global warming becomes the major issue of climate change. Global warming
generates a series of consequences, such as the retreat of glaciers, rising sea level,
desertification and so on. It also brings some serious damages to ecosystem and
agricultural. Especially, it has a significant impact to wildlife. It even accelerates the
extinction of some species. However, people know very little about the changes between
biological diversity and climate. Therefore, monitoring environment and wildlife
becomes a very important object to sciences and researchers.
As a multidisciplinary university, Sonoma State University (SSU) has been
committed to the research of protecting ecological environment and wildlife. The SSU
Field Stations & Nature Preserves provide lands, facilities, databases and programs that
inspire participation, collaboration and innovation in education and research at their
preserves. Fairfield Osborn Preserve (FOP) was one of it that managed by the SSU Field
Stations & Nature Preserves department. The 411-acre Osborn Preserve lies on the
northwest flank of Sonoma Mountain, predominantly in the Russian River watershed at
the dry southern end of the North Coast Range of the northern California. The Nature
Conservancy established Fairfield Osborn Preserve in 1972 through the generosity of
William and Joan Roth in honor of Joan’s father, Fairfield Osborn. The Preserve was
donated to SSU in 1997. The Preserve is dedicated to protecting and restoring natural
communities and to fostering ecological understanding through education and research.
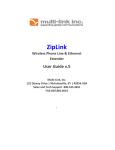
Figure 1 shows a snapshot of the FOP map on Google Earth [1] . In the figure, the green
11
line shows the boundary of the Preserve. The blue line shows the areas where are the
weather stations are located.
Figure 1 - Fairfield Osborn Preserve on Google Earth
Because of the impact of the Global Warming, more and more researches and
studies are concentrated in environment monitoring. Several weather stations have been
set in the preserve. They are used to record different parameters of climate such like
temperature and humility. Electronic sensors are wildly used in these weather stations to
accomplish the goal. So far as the sensors receive enough power, they can capture
accurate data continuously under different weather conditions. Besides that, sensors are
capable to save the weather information automatically without any manual operation until
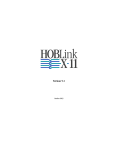
researchers walk to the locations of the weather stations and collect those data. Figure 2
shows a typical weather station settled in FOP.
12
Figure 2 - Weather Station Settled in Osborn Fairfield Preserve
Even though these weather stations have so many benefits, the users of these
weather stations still have difficulty on collecting the data. They have to spend
considerable amount of time on hiking because some of the weather stations are set in the
middle of the forest where one needs a lot of time and energy to reach. In order to save
time, the purposed project, Fairfield Osborn Preserve WLAN (FOPW), provides a
wireless network to cover the areas between the weather stations and sensors. The FOPW
offers Wi-Fi signal that can be used to upload the data. The researchers do not have to
come to the Preserve physically but sit in their offices to control the sensors and collect
climate information remotely. They can save a lot time and energy. Besides that, it
provides other opportunities and feature such as using wireless camera to monitor wild
life and having Internet access in the preserve. By knowing the motivation of the FOPW
project, the next section introduces some background information.
13
2.
Background
In section 2, we introduce four similar outdoor WLAN designs. Two of them are
"Do-It-Yourself" (DIY) projects, and the other two require professional solutions. Then, I
will compare them to our proposed FOPW design. After the comparison, we can find out
the uniqueness of the FOPW design.
In chapter 9 of "Wi-Fi Toys” [2], the author, Mike Outmesguine introduced a DIY
project to build up an outdoor wireless repeater node by using indoor devices and solar
power system. He used two wireless access points operating in bridge mode. One access
point (AP) is used for broadcasting the signal and the other one is used for backhaul
downlink. He claims in the beginning of chapter 9 in his book that by using signal
booster and high gain antenna, “the system can be located out as far as the eye can see”,.
A solar power system also embedded with his repeater node. By collecting energy
directly from the Sun with a 70W solar panel, the repeater node becomes a standalone
system on the top of a hill where there is no AC power resource to access. All
communication devices and two lead-acid batteries are put in an 18*18*6 inch
waterproof steel box. Even though the repeater node has an outstanding performance, it is
very heavy to carry on up a hill and attach to a steel pole. Denny Mavromatis [3] did
another DIY project that modified a Linksys router to work as a bridge. He puts the
router in a waterproof enclosure with an 8dBi Omni directional antenna. So that, he was
able to pass the Wi-Fi signal from his parents house 200 meters away. He did not have a
solar power system to power up his system but used AC power from his house. Due to
the limitation of hardware, the modified repeater did not work reliably. He says he had to
reboot the repeater once a while and lost connection in rainy days. One common problem
14
in these projects is the modifying indoor routers to work as outdoor APs or repeaters. The
reason for modifying the indoor products instead of buying outdoor products is to reduce
cost. Without solar power system, the average cost of each node is about $200 to $300.
However, indoor APs are not designed for outdoor environment. Compared to the
outdoor products, the indoor products are difficult to keep in stable status beyond room
temperature. Besides that, the indoor products usually have lower transmit power than the
outdoor products, which will give the indoor devices shorter signal range. Typically, an
indoor router has a 300-metersignal range if there is no obstacle on the signal propagation
path.
Other than the mentioned DIY projects, Meraki [4] and Trango [5] are two
companies that manufacture high performance outdoor devices and offer professional
solutions for outdoor WLAN design. Their expertise is to design and implement a reliable
WLAN with high performance. Meraki uses four high-performance outdoor APs to
establish a roughly pentagonal-shaped wireless mesh network with over 500 meter
across, straight through the heart of the Jefferson National Forest in University of
Virginia. Each AP costs more than $2000. Trango System provides another outdoor
solution. Because 900MHz system offers excellent receiver sensitivity and penetrability
in a forest environment, their subscriber unit can expect no line-of-sight (NLOS)
performance of up to 6 miles or beyond. Each node costs over $1300on average. The
advantage of the professional solutions is all the devices having high performance in
areas with different weather and they are easy to operate. However, the cost is
unaffordable. It costs easily over $4000 on a point-to-point WLAN design. The budget of
the FOPW design does not allow us to choose the commercial devices.
15
Table 1 - The Comparison of Similar Outdoor WLAN Designs
Outdoor WLAN Design
DIY: How to create an
outdoor wireless
repeater[2]
DIY: Outdoor Wireless
Access Point/Signal
Repeater [3]
Meraki: University of
Virginia [4]
Trango System: 900
MHz wireless radio,
NLOS Broadband
Wireless Network [5]
Frequency
2.4GHz
Distance
Up to
3,200m
LOS
Yes
Cost
$800
(With Solar
Power System)
$200/Node
2.4GHz
200m
Yes
2.4/5GHz
152m
No
$2096 +Tax/
Node
900MHz
9656m
or
beyond
No
AP:
$1993+Tax
Subscribe unit:
$713 + Tax
Antenna
16dBi
Grid
Antenna
8dBi
Omni
Antenna
11/14dB
Sector
Antenna
10dB
Panel
Antenna
The FOPW design tries to find a balance between performance and cost. Different
from other people’s projects and professional solutions, it has to deal with more
complicated environmental impacts than DIY projects and to have a lower cost than
commercial solutions. As we know, the signal will attenuate very quickly when there are
obstacles between the transmitter and the receiver. The attenuation rate is from 0.2dB/m
to 0.5dB/m inside the forest canopy, said Chymitdorzhiev, T.N [6]. With big attenuation
rate, users can lose connection even less than a few meters away from a regular indoor
router. However, there is no way to have a clear wave propagation path because there are
too many trees in the FOP. Therefore, the FOPW design has to overcome huge signal
attenuation and obtain a stable performance. In the meantime, the budget of the FOPW
design does not allow us to choose professional outdoor wireless products. As it was
mentioned in the previous paragraph, there are some commercial products in the market
that can overcome the difficulty of signal attenuation but they can cost over $2,000 for
each node. In order to reduce cost, I needed to build an outdoor access point by
modifying some indoor devices and put them in a waterproof enclosure. The total cost of
16
each node is much lower than the cost of a commercial outdoor product but with
compactable performance.
Besides keeping balance between performance and cost, to locate a position that
can satisfy both the solar power availability and the signal strength requirements is
another issue. In the middle of FOP, there is no AC power resource to use and hard to
find open areas for solar panels to absorb maximum sun light during daytime because of
the shade of trees. We need to find out a place for the solar panels to obtain as much solar
power as possible. In the meantime, the location has to avoid as many trees as possible to
reduce signal attenuation on the propagation path.
3.
Design Architecture & Fundamental Theories
This chapter has three sections. First section describes the design challenges. The
second section introduces the network architecture of FOPW.
The last section
summarizes five fundamental theories to help understanding the challenges of designing
a WLAN in a forest environment.
3.1 Design Challenges
The goal of the purposed FOPW design is to create a self-sufficient outdoor
WLAN and evaluate the network performance in different weathers. In order to achieve
the goal, there are two critical challenges to resolve: the power consumption and the
coverage.
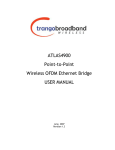
Coverage: The FOPW extends Wi-Fi coverage from the FOP office building to the area
around Turtle Pond. There is a hill on the radio wave propagation path. Therefore, an
intermediate node sets up on the top of the hill to pass the signal from the office building
17
to the End Node. Then, the End Node rebroadcast the signal to cover the area around the
Turtle Pond. Shown as Figure 3, the total distance from the office building of FOP to the
End Node is 371m. There are many trees grown on the hill that are over 20 meters high
and also it is impossible to put antennas over the height. Therefore there is no line of
sight (LOS) between the adjacent nodes. The signal attenuation, multipath fading, and
various interferences caused by trees all become issues to affect communications between
the nodes. When the connections become unreliable, packets are dropped during
transmission, which means the data captured by the weather stations will be lost.
Increasing the total system gain and the antenna height and avoiding the obstacles can
help transmitters to send stable signals over the path. In addition, The End Node has to
cover an area of 37370m² (185m*202m). Sensors and weather stations are set up in the
covered area. However, the sensors and weather stations usually have a low transmitting
power. Even if they have a good reception, their signals cannot reach the End Node. In
order to obtain an appropriate communications, the End Node of the FOPW cannot use
high transmit power; however we can increase antenna height to extend the coverage.
Power Consumption: For a standalone system, a solar power system is required to
provide enough power to run the system continuously. There are two major challenges
for to build a solar power system. The first one is to find a shade-free area in forest to set
up the solar panels. The place should satisfy both the solar power and signal strength
requirements. The solar panel should be put in an open area to absorb enough sunlight
during daytime. In the meantime, the node should receive strong signals at the same
place. Another challenge is the solar panel output. Each node would use several hundreds
of watt-seconds per day. That will require large enough solar panel within affordable
18
price. The panel output will vary based on factors such as the temperature, panel tilt
angle, atmospheric conditions, and how clean is the path. We can adjust the panel tilt
angle to improve the output of each solar panel.
Figure 3 - Distances between Each Node & End Node Coverage
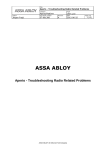
3.2 Design Architecture
Shown as Figure 4, the design architecture of the FOPW is divided into three
parts: the controller node, the intermediate node, and the end node. The Controller Node
has a wired Internet access and it is in charge of routing the data. The Intermediate Node
needs to work as a bridge, in order to repeat the signal sending from the Controller Node
and extend it to the End Node. The End Node provides Wi-Fi communications to the
sensor nodes and the weather stations within its coverage area.
19
Figure 4 - Design Architecture
3.3 Fundamental Theories
Sub-section 3.3 summarizes five fundamental theories in the following paragraphs
to help us understand the design process more clearly. I start with describing the WLAN
characterization. Then, I describe the three components of a WLAN: the Router, the
Access Point, and the Repeater. The next is the understanding of the radio wave
propagation. The third is the antenna principle. Then, I introduce two environmental
impacts on signal attenuation. At the end of the sub-section, I present some knowledge of
the solar power system.
3.3.1 Wireless LANs and Their Characterizations
The Definition of WLAN is a local area network which uses a high frequency
radio signal to transmit and receive data over a distance of a few hundred feet and over
the Ethernet protocol. WLAN is used to extend boundaries of the Local Area Network
(LAN). There are two basic modes for the WLAN, the Ad-hoc and the infrastructure
mode. The architectures of both modes are shown in Figure 5. Whereas the infrastructure
mode has a central device to control the communication, the Ad-hoc mode does not. Adhoc devices are only able to communicate with another Ad-hoc device in their range
including an infrastructure device or any other device connected to a wired network.
20
Moreover, the security level of the ad-hoc mode is lower compared to an infrastructure
mode network. On the other hand, the Infrastructure mode requires an access point as a
base station to control communications. Access point of an infrastructure WLAN
supports increased levels of security, faster transmission speed and integration with a
wired network. The FOPW uses the infrastructure mode.
v
Base Station
Infrastructure Mode
Ad-hoc Mode
Figure 5 - WLAN Modes
Another concept of a WLAN is the communication protocol. This WLAN
combines 802.11g and 802.11n protocols that are created and maintained by the IEEE
LAN/MAN standards Committee 802.11 family. It consists of a series of modulation
techniques that use the same basic protocol. These two protocols are compared in Table
2: 802.11g and 802.11n. The IEEE 802.11g protocol divides 2.4000-2.4835 GHz band in
to 13 channels spaced 5 MHz apart, each channel has a bandwidth of 20MHz. 802.11n
protocol has same property, but has a 40MHz-wide channel on 5GHz operating. 802.11n
can operate on 4 streams because of adding Multiple-Input Multiple-Output (MIMO)
antennas. The MIMO streams have better performance on severing multiple clients. The
IEEE 802.11n protocol allows a maximum of four MIMO streams and can achieve a 600
Mbit/s data rate with four spatial streams using on 40 MHz-wide channel. Both of
21
802.11g and 802.11n protocols use OFDM (Orthogonal Frequency Division
Multiplexing) spread spectrum system. They transmit multiple signals over a single path
within its own unique frequency range in order to distribute the data over a large number
of carriers. The benefit of OFDM modulation method is easily adapted to sever channel
conditions and lower multi-path distortions. It has high spectral efficiency and low
sensitivity to time synchronization errors.
Table 2 - 802.11 Protocol Comparison
802.11
protocol
Freq
(GHz)
Channel
Bandwidth
(MHz)
Allowable
MIMO streams
Maximum
Data Rate (Mbit/s)
Modulation
G
2.4
20
1
54
OFDM/DSSS
N
2.4
5
20
40
4
4
72.2 per stream
150 per stream
OFDM
3.3.2 Router, Access Point and Repeater
Router: Router is the core device of a network. It forwards data packets between
networks, and plays the role of gateway. In a network, router determines the path a data
packet shall take. Especially, a router with wireless function can establish a WLAN and
distribute the connection without the need of cable. In an infrastructure WLAN, a router
is required and works as a base station to control signal communications.
Access Point: Similar to a wireless router, the main purpose of an AP is to allow the
wireless devices to connect to a wireless network. AP usually connects to a wired
network, and can relay data between the wireless and wired devices on the network. The
difference between the router and AP is that the router directs the way of the packets
whereas AP performs as an antenna. If a network is geographically too large to be
22
covered by one AP, more APs would be required to make a complete wireless
infrastructure.
Repeater: In a wireless communications system, APs can only transmit the data only in a
limited distance before the quality of the signal degrades. Repeaters can pick up and
amplify the receiving signal to extend the distance over which data can safely travel.
When located on top of a hill, a repeater can greatly enhance the coverage of a wireless
network by allowing communications from one side of the hill to another side. However,
a traditional repeater works in its own subnet with its client devices. The primary router
and repeater work in different IP domains. In order to reduce complexity, a Repeater
Bridge is introduced to WLAN system. A repeater bridge repeats a wireless signal from
primary AP and has all clients on the same network. This feature can greatly benefits the
FOPW design. The Office Node and the End Node of FOPW are two cooperating APs set
in two opposite sides of a hill. They must establish a wireless connection because pulling
a wire is restricted and not cost effective. Middle Node is built up at the top of the hill
and performs as a repeater bridge. The node ensures the signal sending from Office Node
will reach to End Node. Moreover, all clients connected to the FOPW are in the same IP
domain. However, repeater bridges have a disadvantage. The maximum throughput
halves after the first retransmission being made because repeater bridges can be
considered bridging and accepting wireless clients at the same time.
3.3.3 Radio Wave Propagation
Without doubt, the performance of wireless communication systems depends in a
fundamental way on the RF link. As a consequence, predicting the propagation
characteristics between two antennas is one of the most important tasks for the design and
23
installation of wireless communication systems [7]. There are five basic phenomena of
radio wave propagation. The first one is free space path loss (FSPL), which indicates the
loss in signal strength of a radio wave when it is traveling through free space (usually air)
with no obstacles nearby to cause reflection or diffraction. The expression of FSPL [8] in
terms of dB is:
(
)
((
) )
( )
( )
Where,
: Speed of light in vacuum
: Signal frequency (in MHz)
: Distance from the transmitter (in meters)
Equation 1 - Free Space Path Loss [8]
From Equation 1, we know a fact: the longer the transmit distance and the higher
the operation frequency, the bigger would be the attenuation. The second phenomenon is
the reflection, which occurs when the radio wave is transmitting in different mediums.
Reflection is caused by impedance mismatch, so it is often measured in a dimensionless
ratio know as Voltage Standing Wave Ratio (VSWR). In an outdoor environment,
reflection would occur of buildings, surface of earth or plants. The reflected waves follow
the typical laws of reflection. The incident angle is equal to the angle of reflection and
that the wave undergoes a phase change of 180 degrees. The third phenomenon is
absorption. When the signal wave is transmitted through a medium, a portion of its
energy will be absorbed. Especially in an outdoor environment, complicated weather
situations and terrains will cause much more absorption than an indoor environment. The
fourth phenomenon is diffraction. Diffraction occurs when the radio is transmitted, it
obstructed by a sharp edge [9]. The radio signal impinging on the edge results in
secondary waves that propagate in all directions around the edge (including behind the
24
obstacle.) Diffraction is responsible for providing a path between the transmitter and the
receiver even when there is no direct or reflected path. The diffraction depends on the
geometry of the object, as well as on the amplitude, phase, and polarization of the
incident wave at the point of diffraction. The last phenomenon is interference. In physics,
interference is the phenomenon in which two waves superpose to form a resultant wave
of greater or lower amplitude. In a WLAN, two Radio Frequency (RF) signals performs
in a nearly frequency will cause a cross talk or attenuation. Two waves could be from one
source or two different sources. All of these phenomena will be considered as a factor to
influence WLAN performance.
3.3.4 Antenna Principle
The antenna is a key building block in the construction of wireless
communications systems. The purpose of this sub-section is to provide an overview of
fundamental antenna properties and performance characteristics. There are four concepts
included: passivity, radiation patterns, beamwidth and Fresnel Zone. This knowledge can
be used to establish antenna selection criteria for optimum system performance.
First, antennas are passive devices. To operate, they require no supply voltage and
they do not amplify RF energy. Antennae convert electrical energy to RF waves in the
case of transmitting antennae or convert RF waves into electrical energy in the case of
receiving antenna. The physical dimensions (especially length) of an antenna are directly
related to the frequency at which the antenna can propagate or receive waves. Total
amount of energy emitted by antenna does not increase. It only distributes the energy
around the antenna.
25
The second concept is radiation patterns, which describes how the antenna directs
the radiation energy. As stated earlier, an antenna cannot radiate more total energy than is
delivered to its input terminals. Radiation patterns are typically presented in the form of a
polar plot for a 360-degree angular pattern in both vertical and horizontal planes. Based
on pattern ship, antennas can be divided into two categories, which are Omni directional
and directional antennas. The Omni directional antennas radiate or receive equally well in
all directions. They are used when coverage is required in all directions around the
horizontal axis and most effective when large coverage areas are needed around a central
point. Commonly used for point-to-multipoint designs. On the other hand, the directional
antennas radiate RF energy in one or two directions and are commonly used for a pointto-point connection. Often radiate in a hemispherical or cylindrical coverage pattern.
They have back and side lobes and if used effectively, they may further reduce the need
for additional access points. Figure 6 [10] simply shows the radiation patterns of a typical
directional antenna.
Figure 6 - Panel Antenna Radiation Patterns [10]
The next concept good to know about antenna is the beamwidth. Beamwidth is
calculated by measuring the off-axis angle in degrees where beam drops by ½ (-3 dB) of
the strength at the 0° position. Horizontal and vertical vectors must be considered when
discussing an antenna’s beamwidth. Typically, an Omni directional antenna will have
26
360° beamwidth on horizontal and 7° to 80° on vertical vector. A directional antenna will
have 30° to 180° on horizontal vector and 6° to 90° on vertical vector. As seen in Figure
6, a directional antenna may have multiple lobes. The one with highest radiated energy is
called the main lobe and the rest is called side lobes. When we are talking about
beamwidth of a directional antenna, it means the beamwidth of the main lobe. Figure 7
[10] shows the beamwidth of the main lobe for the directional antenna in Figure 6.
Figure 7 - Directional Antenna Beamwidth [10]
The last important concept is the Fresnel Zone, which is the area centered on the
visible Line of Sight (LOS) between the transmitting and receiving antennas. Fresnel
Zone defines an area around LOS that can introduce the RF signal interference if
blocked. RF waves travel in a straight line from the transmitter to the receiver without
any obstruction. However, if there are obstacles along the path, the radio waves reflecting
off those objects may arrive out of phase with the signals that travel directly and reduce
the power of the received signals. In Figure 8 [11], the green line is the visual line of
sight between the wireless signal transmitter and receiver. The black circle is the
boundary of the first Fresnel Zone and indicates the wave line of sight. D is the distance
between the transmitter and the receiver, r is the radius of the first Fresnel Zone at point
P. d1 and d2 are distances from point P to the transmitter and the receiver, respectively.
27
Figure 8 - Fresnel Zone [11]
An accurate calculation of the Fresnel Zone will improve the reliability in the
design of a WLAN. Equation 2[11] introduces a general way to calculate the Fresnel
Zone radius.
√
Where,
= The nth Fresnel Zone radius in meters
= The distance of P from one end in meters
= The distance of P from the other end in meters
= The wavelength of the transmitted signal in meters
Equation 2 - Fresnel Zone Determination [11]
The first zone (n=1) must be kept wildly free without obstructions to avoid radio
wave interference. Equation 2[11]can be simplified to Equation 3[11], which gives the
radius of the First Fresnel Zone by knowing the frequency of operation and total
transmitting distance.
√
Where,
= radius in meters
= total distance in kilometers
= frequency transmitted in gigahertz.
Equation 3 - 1st Fresnel Zone Radius [11]
28
3.3.5 Environmental Impacts
Obstacle vegetation causes the first environmental impact. In the FOPW design
project, the signal has to pass through much vegetation that may cause a huge loss in the
signal strength. In a wired network, signal will be transmitted through cables. We can
simply predict the signal loss by the length of the cable. However, it is more complicated
to measure the attenuation of outdoor wireless links especially in a forest environment.
Many researchers have studied the effect of obstructions on the signal attenuation.
Hidayab in his paper "Wi-Fi Signal Propagation in 2.4 GHz" [12] claims that the
environmental circumstance is an important thing that needs to be taken into
consideration. He shows that the propagations between an indoor environment with no
obstruction and an outdoor environment, which has obstruction along the propagation
path, are quite different. The path loss of outdoor scenario is much bigger than the indoor
scenario. Additionally, vegetations cause multiple path fading and interference that will
cause more attenuation. In order to obtain a clear First Fresnel Zone, both the transmitter
and the receiver antennas can be erected to high enough location above the obstructions
so that the path loss would be negligible. When radio wave travels in a straight line from
the transmitter to the receiver without any obstacle, we can simply calculate the signal
strength loss by using Equation 1. "However, the antenna height is not the only
consideration in engineering design and some fundamental principle must be considered
such as communication quality, economical cost and engineering implementation, etc",
said Siyu Li [13]. He believes that the speed of signal attenuation is not monotonically
decreasing and the transmission range is not monotonically increasing, with the increase
of antenna height. If antennas are set above the height of the obstructions, it will be very
29
unfeasible and uneconomic. Therefore, Antennas are not necessarily to be set at a very
high position. If a network is set up in a forest environment, it is very difficult to increase
the antenna height to obtain a clear Fresnel Zone. Equation 1 is not suitable in this
situation. In other words, we need to create a model to predict the signal loss along the
propagating path in a forest environment. Many studies have been carried out to
characterize and model the effects of vegetation experimentally. Weissberger's Modified
Exponential Decay Model [14] is applicable in situations where propagation is likely to
occur through a grove of trees rather than by diffraction over the top of the trees. In the
FOPW design, the LOS path is blocked by dense, dry and leafy trees. Therefore, we can
use Weissberger's model to predict the signal loss. The expression is shown in Equation 4
which claims that the path loss must be calculated with inclusion of the FSPL. Based on
this model, the 2.4GHz signal has an additional 0.2dB/m ~ 0.5dB/m in a forest
environment.
(
)
{
Where,
: Vegetation loss in dB
: Frequency in GHz
: Depth of trees in meter
Equation 4 - Weissberger's Modified Exponential Decay Model [14]
Another impact of environment comes from different weather conditions. In
different weathers, air will have different intensity and contains impurities such like
rainfalls, snow and sands. It can cause more absorption, reflection and diffraction to
influence the network performance on Average of Response Time (ART) and Packet
Loss Rate (PLR). In Hidayab's also [12] shows two figures of signal strength under
windy environment and ideal environment. The difference is minor, but the author
30
believes that, the outdoor environment such as wind and drizzling also caused the path
loss during propagation. Especially in a forest environment, rainfall will cover on foliage.
From RF point of view, the density of the transmitting medium is changed. It causes
more attenuation on the signal propagation path. In the area of FOP, the main weather
situation in winter is rainfall and fog. The Weissberger's model does not include the
factor caused by humility. Therefore, in the FOPW design, we need to consider the
influence of foggy and raining weathers.
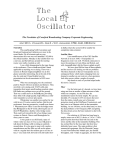
3.3.6 Solar Power
The key issue of building a self-sufficient system is the power resource. Typically,
there are several ways of drawing power from the nature such like solar power, wind
force, and waterpower. Solar power is the most common and efficient resource to be used
in a mountainous region. Solar panels, solar controller, and batteries combine to make a
stand-alone solar power system. However, solar panels and batteries only provide DC
current. In some cases, the loads need to be powered up by AC power supply, so that a
DC-AC inverter will be required. Figure 9 shows a typical solar power system.
Figure 9 - Typical Solar Power System
31
The solar panel is the most important part of a solar power system, and the most
expensive part. Many pieces of photovoltaic cells assembled to create a solar panel. It
absorbs the sunlight and converts the energy directly into electricity by the photovoltaic
effect. There are three main types of solar cells, Monocrystallines silicon, Multicrystalline and orthin-film silicon. Crystalline silicon is the most popular and efficient
product as it provides an excellent balance of performance and cost. The solar power
ratings assume operation at a Maximum Power Point (MPP), which is generally
considered impossible to achieve in the real-world deployments. The solar panel output
varies depending on the physical location of the solar power system and the availability
of consistent sunlight exposure. The expected output power is somewhere in the 80% to
90% efficiency range during the peak hours of sunlight. As we all know, the sun light is
only available in the daytime. Figure 10 [15] shows the FOP area's sunrise, sunset, dawn
and dusk times for the whole year. The daytime duration of FOP is from 10 hours to 15
hours due to different season. However, the MPP is assumed to achieve during the peak
hours. When the output current is bigger than 80% of the maximum value, we assume the
sunlight is in peak hours. By knowing that, we can choose the proper size of the solar
panel for both Nodes. Table 3 shows output values of different sizes of solar panel. More
power will charge batteries faster, keeping them topped up for cloudy days. Too little
power may cause a power outage from drained batteries due to decreased charge capacity.
Table 3 - Solar Panel Power Output
Rate
Power
40w
50w
70w
100w
Rated
Voltage
12V
12V
12V
12V
Rated
Current
2.41A
3.15A
4.25A
6.00A
Open Circuit
Voltage
22.2V
19.8V
21.4V
21.0V
Dimensions
(H*w*d in inches)
50.9*13*1.4
48.0*13.0*1.3
47.3*20.8*2.2
56.9*20.8*2.2
Panel
Weight
22lbs
17lbs
23lbs
26lbs
32
Once the sunlight is converted into electricity, a controller controls the working state of
the entire solar power system to protect the batteries from over being over charged. When
the modules generate enough power for the loads, the extra power can be stored in
batteries for use in the nighttime and any weather conditions without sunlight. Lead-acid
batteries are commonly used for the solar power systems.
Figure 10 - Sunrise, Sunset, Dawn and Dusk Times in FOP [14]
4.
Hardware Design & Implementation of FOPW Design
This section first introduces hardware design and implementation. At end of the
section, we introduce an approach for the signal strength measurement and how to use the
approach to select the installation location for each node.
4.1 High level Design
Figure 11 shows the location of the FOPW design in a visual way. FOPW uses a
point-to-point repeating infrastructure and contains three nodes, which are the Office
Node, the Middle Node, and the End node. The Office Node is considered as a controller
33
node that will be set up around the office building of FOP. The facility provides the
Internet access and AC power. The Office Node creates a wireless network and
transmits2.4GHz signal through a high gain directional antenna. The hill in the area
blocks the signal transmission from the Office Node to the End Nodes. A Middle Node is
introduced at the top of the hill to perform as a bridge to relay the signal from one side of
the hill to the other. The End Node is located beside the Turtle Pond to create Wi-Fi
signal coverage around the pond. Two solar power systems provide power for the Middle
Node and the End Node.
Middle
Node
Internet Access
Sub Network
End Node
Office
Station
Figure 11 – The High Level Data Communication Design
Figure 12 shows the main components of each node. The Office Node contains
one router, one signal booster and a high gain directional antenna. The router connects to
a wired network by Ethernet cable and to create a wireless network. As the basic station,
the router performs DHCP function that creates an IP domain of 192.168.2.*. The
wireless signal is amplified by the signal booster and is transmitted through a high
directional antenna. The signal booster is set up at the maximum transmit power level to
ensure for the signal to reach the Middle Node. The Middle Node contains a repeater
bridge, two signal boosters and two high gain directional antennas. The main function of
the Middle Node is to receive the radio wave from the Office Node and relay the signal to
34
the End Node. The End Node is also a repeater that uses Omni antenna to extend the
coverage. Two solar power systems are attached to the Middle Node and End Node.
Directional
Antenna
AP
Wire
Controlor
Solar Power
System
Client
Batteries
Controlor
Solar Panel
Wireless
Wireless
Wire
Batteries
Access
Point
Sensor
Wire
Cable
Directional
Antenna
Wire
Cable
Signal
Booster
Wire
Power
Source
Wireless
Wireless
Wire
Wire
Directional
Antenna
Repeater
Bridge
Signal
Booster
Cable
Signal
Booster
End Node
Wireless
Cable
Router
Wired
Cable
Internet
Middle Node
Cable
Office Node
Solar Panel
Solar Power
System
Figure 12 – The FOP Communication System Block Diagram
4.2 Design Details
From the last sub-section, we learned that the FOPW is build up of three nodes
and two solar power systems. Each node contains different components and has different
power requirements. The following sub-section introduces the details for each node and
the solar power system as shown in Figure 12. Table 4 contains the detail specifications
of each node. The FOP design uses 2.4GHz radio and 802.11b/g protocol to communicate
with adjacent nodes. The End Node uses 5GHz radio and 802.11n protocol to
35
communicate with end users such as sensors and computers. In order to overcome huge
propagation attenuation, the FOP design uses 500mW transmit power and high gain
directional antennas between adjacent nodes.
Table 4 - Specifications of Each Node
Nodes
Specifications
Office Node
Middle Node
End Node
Mode
Firmware
SSID
Frequency
Router
D-link
Office Node
2.4G Hz
802.11b/g
Repeater Bridge
DD-WRT
Middle Node
2.4G Hz
802.11b/g
Channel
Channel 1
IP Domain
Transmit Power
Antenna Type
Antenna Gain
Max Throughput
192.168.2.*
500mW
Directional
14dBi
54Mbps
Receive:
Channel 1
Re-transmit:
Channel 6
192.168.2.*
500mW/500mW
Directional
14dBi
27Mbps
Repeater
Hawking
End Node
Receive:
2.4GHz /802.11b/g
Re-transmit:
5GHz/802.11n
Receive:
Channel 6
Re-transmit:
Channel 183
192.168.2.*
200mW/65mW
Directional/ Omni
12dBi/5dBi
27Mbps
4.2.1 Office Node Design
Figure 13 shows the detail of the Office Node. The Office Node contains a D-link
DI-624 wireless router (See Appendix E1), a Hawking HAO14SPD directional antenna
(Appendix E4) and a Hawking HSB2 signal booster (See Appendix E5). The directional
antenna is mounted at the top of a steel pole. Because the Middle Node has a higher
elevation than the Office Node, a tripod is used to hold the steel pole with a tilt angle to
make sure the antenna can point to the Middle Node. The router and the signal booster
are put in a waterproof enclosure right under the antenna. In order to connect to the
Internet, an Ethernet cable is plugged into the WAN port of the router. As the base station
36
of the infrastructure WLAN, the wireless router of the Office Node creates a WLAN and
generates the IP domain for IP addresses from 192.168.2.101 to 192.168.2.200 by using
DHCP protocol. In the U.S, The maximum Effective Isotropic Radiated Power (EIRP) of
a radio wave is regulated by part 15 of the Federal Communications Commission (FCC)
rule. The rule governs the maximum transmitter power of 27dBm when the antenna gain
is 15dBi. Thus the transmit power of the signal booster is set at 500mw (27dBm) max
and the directional antenna used has a 14dBi gain with the output of 25mW.
Implementation process is shown in Appendix C1.
Cat5 Cable
Internet
WAN
Port
Lan Lan Lan Lan
Port1 Port2 Port3 Port3
Wireless
Router
Signal Booster
Antenna
extension cable
RPSMA
RPSMA
SMA-TNC
connector
Antenna
RP-TNC
extension cable
Directional
Antenna
AC-DC adapter
Power
AC-DC adapter
Power
RPSMA
AC Power
AC Power
Figure 13 – The Office Node Design
4.2.2 Middle Node Design
Figure 14 shows the components of the Middle Node and the solar power system.
The main purpose of the Middle Node is to establish connection between the Office Node
and the End Node. The Middle Node contains a Linksys WRT54G router (See Appendix
E2), two Hawking HAO14SPD antennas and Hawking HSB2 signal boosters (See
37
Appendix E5). Same as in the Office Node, the antennas are mounted at the top of a 9
feet high steel pole. One antenna will point to the Office Node and the other points to the
End Node. The router and the two signal boosters will be put in a waterproof enclosure
under antennas.
Lan
Port1
Lan
Port2
Repeater/
Bridge
Power
Antenna
extension cable
TNC
TNC-SMA
connector
Antenna
extension cable
TNC
TNC-SMA
connector
RP-SMA
RP-SMA
Signal
Booster
Connector
Signal
Booster
RP-SMA
RP-SMA
SMA-TNC
connector
SMA-TNC
connector
+
Solar
Panels
Power
Antenna
extension cable
Power
Lan
Port3
Antenna
extension cable
+ Connector
-
Lan
Port3
Wire
WAN
Port
Directional
Antenna
Directional
Antenna
Connector
+
-
Smart
Controller
+
-
+
Batteries
Figure 14 – The Middle Node Design
The critical design of the Middle Node is to modify an indoor router into a
compatible outdoor repeater bridge. Table 5 contains the major specifications of a
Linksys WRT54G router. The hardware design of Linksys WRT54G router brings 4
major benefits to accomplish the modification. First, the router has a dual attachable
antenna design, which allows us to switch the original low gain antennas into high gain
antennas. In additional, one antenna can be used to receive RF signal, another antenna
can be used to retransmit RF single to another direction. Second, the Linksys router can
38
operate under an outdoor temperature, because, in the area FOP, the average temperature
is from 39.0 °F ~ 83.0 °F [16] in the most time of a year.
Table 5 - Linksys WRT54G Specifications
Frequency Band
Data Transfer Rate
Transmit Power
Antenna Type
Power Consumption
Operating Temperature
Humidity Range Operating
Dimensions (W*D*H)
Weight
2.4GHz
54Mbps
1mW ~251mW
Dual attachable Omni antennas
6W
32.0 °F ~ 104.0 °F
10 - 85%
7.3inch *6.9inch*1.9inch
1.1lbs
By changing the firmware into a third party firmware called DD-WRT. An indoor
router (Linksys WRT54G) is able to perform as a repeater bridge. The modification
procedures are shown in Appendix C2. The firmware adds many useful features such as
adjustable transmit power and the scheduled radio time restrictions.
Figure 15 - Linksys WRT54G Configuration
Form Figure 15, the transmit power set up at 65mW (18dBm) because of the
signal booster requires input power from 8dBm to 18dBm. In the "Radio Time
Restrictions" setup menu, the transmit radio is closed from 20pm to 5am of the next day.
By shutting down the radio wave transmission, the Middle node can reduce power
39
consumption in a daily routine. In order to build up a self-sufficient system, the Middle
Node requires a solar power system conserve power in different weathers. The solar
power system includes the solar panels, the smart controller, and the batteries. The solar
power system design is introduced in section 4.2.4. The installation procedures are
provided in Appendix C2.
4.2.3 End Node Design
Figure 16 shows the components of the End Node. The End Node picks up the
signal sending from the Middle Node and rebroadcasts it to cover the area around the
Turtle Pond. The communication unit is a Hawking HOW2R1 Outdoor Smart Repeater
(See Appendix E3). The repeater has an internal directional antenna to communicate with
the Middle Node and two external Omni directional antennas to create Wi-Fi coverage.
Same as the Middle Node, the End Node requires a solar power system as discussed in
the next sub-section. The smart repeater uses Power Over Ethernet (POE) technology to
pass electrical power safely, along with data over Ethernet cabling. 12V DC power
supply cannot power up POE devices. Therefore, the End Node uses a DC-AC inverter to
transform 12 DC power into 220V AC power for use by the smart repeater. The
installation procedure is of End Node is shown in Appendix C3.
40
Repeater
Solar Panels
TNC
Omin
Directional
Antenna
POE
Port
Wire
Omin
Directional
Antenna
POE
Port
CAT5 Cable
TNC
Lan
Port
+
-
+
-
AC-DC Adapter
POE Injector
Smart Controller
DC-AC
Inverter
+
-
Batteries
Figure 16 - The End Node Design
4.2.4 Solar Power System Design
In order to build a self-sufficient system, both the Middle Node and the End Node
require Solar Power System to generate enough power to use. The Solar Power Systems
not only generate power to use in daytime but also conserve power in nighttime and days
without any sunlight. The design has to follow four steps: calculate the power
requirements, choose the right solar panel, choose the right batteries and build a rugged
structure to support equipment.
First step is calculating the power requirements. After measuring the power
consumption of every item, we find out the Hawking HSB2 signal boosters and HAO2R1
Smart Repeater have fluctuating value for the power consumption due to varying
throughput. The results are listed in Table 6. The measurement procedures are shown in
Appendix D1, D2 and D3. We can predict the power consumptions of the Middle Node
and the End Node by adding different components. Amp-hour represents the number of
41
hours that a 1-amp current drawing device will be powered by a particular battery before
it runs out of energy.
Table 6 - Power Consumption for the Router, the Signal Booster and the Repeater
Load Items
Linksys WRT54G Router
Signal Booster
Smart Repeater (with ACDC inverter)
Voltage
(V)
12
12
12
Current
(A)
0.45
0.01~1.2
0.85~0.91
Power
(W)
5.4
0.12~14.4
10.2~10.92
Average amp-hour
/Day
10.8
14.52
21.12
Once we find out the power consumptions of the Middle Node and the End Node,
the solar panel sizing becomes the second step. In the FOPW design, we choose
"Sunforce-50048 (12V, 60W)" solar panel sets (See Appendix E7). The set includes four
15W solar modules. The following sizing processes determine how many solar modules
are required for the Middle Node and the End Node.
Middle Node:
1. Total average amp hours per day for The Middle Node: 25.32
2. Average sun hours per day in the position of Middle Node: 5
3. Divide line 1 by line 2 for total solar array amps required: 5.064
4. Divide line 3 by 0.85 to compensate for the solar panel efficiency: 5.96
5. Peak Amps of solar module used: 1
6. Total number of solar modules in parallel. Divide line 4 by 5: 5.96
End Node:
1. Total average amp hours per day for The Middle Node: 20.64
2. Average sun hours per day in the position of Middle Node: 6
3. Divide line 1 by line 2 for total solar array amps required: 3.46
4. Divide line 3 by 0.85 to compensate for the solar panel efficiency: 4.07
42
5. Peak Amps of solar module used: 1
6. Total number of solar modules in parallel. Divide line 4 by 5: 4.07
The power generated by the solar power modules should be bigger than the power used
by the nodes. Therefore, the numbers of modules required to provide enough power per
day is 6 for the Middle Node and 5 for the End Node.
The third step is to choose the right batteries. The capacity of the batteries decides
the expected work duration which means how many hours the system can operate and
carry the load without any sunlight. In another word, the solar power system has to offer
enough energy in daytime and save in the batteries, so that the system can stay operation
and collect data during nighttime until the sunlight comes back. Then, the batteries can be
charged again when the sun returns. The Deep-Cycle batteries are like any other batteries
- the less they work, the longer they last. Therefore, a bigger bank not only gives a larger
reservoir, but also offers longer battery life.
(
)
Where,
: The power conserved in one battery
: The power used by load
: Average sunlight peak hours
: The number of batteries
Equation 5 – Estimation for the Number of Batteries
According to Table 6, the power used by the Middle Node 12.66W, which is the
sum of the power used by the router and the average power used by the signal booster.
The average power used by the End Node is 10.56W. The power conserved in one battery
is 84W. Based on that, numbers of batteries can be estimated by using Equation 5.
(
Middle Node:
End Node:
(
)
)
(
(
)
)
43
In order to protect batteries from over discharge, 50% more batteries need to be added to
each node. Based on calculation, Middle Node requires six of 12V at 7Amp Lead-Acid
batteries. End Node requires five of the same kind of batteries.
The last step is to design a rugged structure to support the equipment. Figure 18
shows the design structure for the idea installation. Solar panels need to be pointed in the
direction of the sun to allow the panel to capture the most amount of sunlight. In the
FOPW design, the solar panels have to point to the south because the location is in the
northern hemisphere. The solar panels are mounted on steel poles with a certain tilt angle.
In order to achieve MPP, the tilt angle between a solar panel unit and the holding pole is
different in different seasons [17]. The tilt angles between solar panels and holding poles
is calculated and summarize in Table 7 and shown in Figure 17.
Table 7 - Solar Panel Angel Calculation [17]
Summary: Solar Panel Angle Calculation for FOP
SEASON
ANGLE / TILT CALCULATION
Winter
(Latitude * 0.9) + 29 degrees = (38*0.9)+29=63.2
Summer
(Latitude * 0.9) - 23.5 degrees = (38*0.9)-23.5=10.7
Spring and Fall
Latitude - 2.5 degrees = (38-2.5)=35.5
Winter
Summer
Ø
So
lar
Pa
r Pa n
l
ne
Pole
l
el
63.2°
10.7°
Pole
Ø
ne
Ø
Pa
So l a
lar
Ø
Ø
Ø
So
Spring & Fall
35.5°
Pole
Figure 17 - Solar Panel Tilt Angle
44
Figure 18 - The Idea Installation [2]
4.3 Signal Strength Measurement & Locations Selection
Stable and strong signal strength ensures a wave link keeping connected and
having a good data transmission rate. It is the most important factor to influence the
network reliability and performance. By measuring the signal strength in the area with
many trees, we can find a location for the Middle Node to have the best reception. In the
FOPW design, we introduce one approach to estimate signal strength by using the free
Wi-Fi network scanner software called "InSSIDer" [18]. Service Set Identifier (SSID)
refers to as a network name or identifier. All devices attempting to connect to a specific
WLAN must use the same SSID. By monitoring and analyzing the signals captured by
the wireless Network Interface Controlled (NIC) card of any computer, InSSIDer can
inspect the surrounding SSIDs and track the received signals strength in dBm over time.
The software detected eleven SSIDs as shown in Figure 19. The signals are received with
45
different strength from -37dBm to -79dBm and shown under "RSSI" category. RSSI
stands for Received Signal Strength Indication which is an indication of the power level
being received by the antenna. In addition, InSSIDer shows all the detected networks are
working under different frequency range and channels. In the FOPW design, we can use a
laptop installed InSSIDer to simulate the RSSIs of the Middle Node. First, connect a
wireless NIC card with 500mw transmit power to the laptop. Then, connect a 14dBi
directional antenna to the wireless NIC card. At last, walk around in the FOP and raise
the antenna to the same height as the Middle Node would be. In this case, we can use
inSSIDer to inspect the surrounding RSSIs to simulate the receptions of each node.
Therefore, we can locate the best place to install the Middle Node
Figure 19 – The Wireless SSIDs Captured by InSSIDer [18]
One important feature of InSSIDer is to associate Wi-Fi reception with GPS
coordination. By using this feature, the RSSIs are associated with GPS coordination and
46
are able to be displayed on to Google Earth map. It requires a GPS sensor installed on
computer to gather the GPS information. In Figure 19, there are two categories on the left
side, which are "Latitude" and "Longitude". By recoding the parameters over time and
exporting data to Google Earth map, one can collect the capability to measure the signal
coverage with meaningful signal strength over time in the area. If there is no GPS sensor
configured, the values show all zero. In Figure 35, these two categories show the real
time values of latitude and longitude. For example, Figure 20 shows the track when
people carry a laptop loaded with InSSIDer and travels in the FOP. Green bubbles
indicate the RSSIs captured by InSSIDer on the travel path. The sizes of the bubbles
indicate the strength of received signals. The biggest bubble location is assumed to be the
location of transmitter.
Figure 20 – The Signal Strength Captured by InSSIDer as Shown in Google Earth Map
The location of the Middle Node is not only having good signal reception, but
look as good as an open area for the solar power aspect. There are three open areas
marked as B1, B2 and B3 shown in Figure 21 that could be used to set up the Middle
47
Figure 21 - Middle Node and End Node potential locations
Using the approach introduced earlier this sub-section, the RSSIs capture at each
locations are shown in Figure 22. The reception at B1 is slightly better than the others.
Figure 22 - Middle Node Reception Survey
From Table 8, we also observe that B1 has the best communication link with the
End Node. Even though, B1 is not the best locations on solar power aspect, B1 should
48
offer enough energy to run the Middle Node. Therefore, B1 is the best location to set up
the Middle Node.
Table 8 - Middle Node Locations Comparison
Locations
B1
B2
B3
RSSIs Received
from Office Node
-68dBm ~76dBm
-73dBm ~-74dBm
-74dBm ~-76dBm
RSSIs Received by
End Node
-68dBm ~ -76dBm
No Connection
-73dBm ~ -80dBm
Percentage of Peak
Sunlight Hours
50%
40%
70%
5. Experiment Results and Analysis
This section includes three parts. In the first sub-section, we compare the
theoretical path loss with the realistic path loss of both links. Then, we listed and
analyzed three results for the network performance test. The last sub-section is the results
of the power consumption measurement of the Middle Node and the End Node.
5.1 Path Loss Measurement
Table 9 contains the path losses of the two wireless links in the FOPW design.
One link is between the Office Node and the Middle Node; another one is between the
Middle and the End Nodes. The path length of each link is 203m and 171m. By using
Equation 1 and Equation 4, the theoretical path loss for the each link is 125dBm and
120dBm. In a wireless system, the total system gain equals to the sum of transmit power
(in dBm), transmit antenna gain and receive antenna gain. Received Signal Strength
Indication (RSSI) is the relative received signal strength (usually is a negative number in
dBm). Therefore, the path loss is the subtraction of the Receiver RSSI and the total
system gain. The measured path loss of the first link is from -123dB to -133dB. The
second link has a measured path loss in the range of -121dB to -129dB. Both of the
theoretical path losses are in the corresponding ranges. The results show that the
49
Weissberger's Modified Exponential Decay Model is applicable to predict the signal path
loss in an environment with much foliage.
Table 9 – The Path Loss Comparison over The Links
Link
TX
RX
TX
Total
RSSI Measured Theoretical
Antenna Antenna Power System Gain (dB) Path Loss Path Loss
Gain (dBi) Gain (dBi) (dBm)
(dB)
(dB)
(dB)
Office Node
-68
-123
to
14
14
27
55
to
to
-125
Middle node
-78
-133
Middle Node
-68
-121
to
14
12
27
53
to
to
-120
End Node
-76
-129
5.2 The Network Performance Test
According to Table 9, the total system gain is the subtotal of the transmit antenna
gain, the receive antenna gain, and the transmit power, which is 55dBm for the link
between the Office and the Middle Nodes and 53 dBm for the link between the Middle
and the End Node. However, the FOPW system has to deal with an extra huge
attenuation, which is about 0.2dBm ~ 0.5dBm/meter caused by forest environment. The
signal would drop to an unreliable level in 200 meters. It is very important to optimize
the received signal strength to insure the connections between each node and improve the
network performance. In sub-section 5.2, we analyzed three experimental results of the
signal strength measurement and the networking performance test under different criteria.
5.2.1 Impact of the Antenna Height
For the wireless sensor networks, the antenna height of the transmitter and the
receiver should be raised high enough to obtain a clear Fresnel Zone. In that case, the
plant impact on path loss could be negligible. However, the antenna height is not the
single consideration in engineering design and some other issues such as communication
50
quality, economical cost, and engineering implementation must be considered. In the
FOPW project, due to the complicated terrain, it is impossible to make antennas to cover
all desired areas. Two different antenna heights (3 feet and 6 feet) were tested at the End
Node. One of the impacts of changing antenna height is increasing the receiving signal
strength. Figure 23 shows the signal strength captured at different distances from the End
Node. From the figure, we observe that the system has higher gain when the height of
transmitting antenna is increased. The testing procedures are shown in Appendix D5.1.
RSSI vs. Distance in Different Antenna Heights
0
-10 0
20
40
60
80
100
-20
RSSI(dBm)
-30
-40
-50
3 Feet
-60
6 Feet
-70
-80
-90
-100
Distance (m)
Figure 23 – The Signal Strength for Different Antenna Heights
Another impact of increasing antenna height is increasing network coverage.
Figure 24 shows the coverage of the End Node in different antenna heights. When the
antenna height of the End Node is 3 feet, the signal barely covers the pond. The receiving
signal strength is mostly under -80dB, which is unacceptable. When the antenna height
increases to 6 feet, the coverage of the End Node is better near the area around the pond
with average signal strength of -70dBm.
51
Figure 24 - End Node Coverage in Different Antenna Height
5.2.2 Impact of Different Antenna Propagation Directions
Because of lacking of LOS between each node, the signal attenuation is
unpredictable in the aspect of propagation direction. Based on the data sheet of Hawking
HAO14SDP panel antenna (See Appendix E4), the beamwidth of using antenna is 30
degree in both the horizontal and vertical directions. The impact of the antenna
propagation direction is tested in both the horizontal way and vertical way. The angle
between the transmission path and ground is taken to be 30° and 60° (See Figure 25). The
antenna rotation angle is taken 0° and ±30° (See Figure 26).
30°
Middle Node
Office Node
60°
Middle Node
Office Node
Figure 25 - Signal Propagation in Vertical Directions
52
Middle Node
Middle Node
Middle Node
30°
30°
Office Node
Office Node
Office Node
Figure 26 - Signal Propagation in Horizontal Directions
RSSIs in these different propagation directions were obtained, as shown in Table 10. It
can be observed that there is no obvious difference in the signal attenuation in both
vertical and horizontal directions. In the NLOS case, as far as the directional antenna
keeps in its beamwidth, the wireless signal reception does not rely on the directionality.
In this NLOS scenario, wireless signal propagation takes on certain homogeneity because
of the high density of trees and inter-twisting of foliage.
Table 10 - RSSIs in Different Directions
Horizontal Angle
Vertical Angel
30°
60°
0°
30°
60°
74dB ~ -81dB
-72dB ~ -82dB
-76dB ~ -84dB
-73dB ~ -83dB
-74dB ~ -85dB
-75dB ~ -86dB
5.2.3 Impact of the Weather Condition
In the FOPW project, three tests were taken in a sunny day, a foggy day and a
rainy day. The Average of Response Time (ART) and the Packet Lose Rate (PLR) were
measured.
WinPing is a software application that allows you to test network
performance. First, use a laptop and connect to the End Node wirelessly. Then, enter the
IP address of the Office Node, which is 192.169.2.1 in WinPing. The button ''Options"
53
opens the WinPing options: Infinite Loop allows running pings in an infinite loop and
shows the average. However, we can stop the loops at 1000. The "Auto-Save" option
allows saving all the pinging information (in Infinite Loop Mode). A Ping Graph allows
us easily to view the information for every loop.
Figure 27 - Network Performance in Different Weather
The results are shown in Figure 27 and summarized in Table 11. In the figure, red lines
indicate the response time of the communication between Office Node and End Node in
foggy weather and black lines for sunny weather. From the table we can tell that in foggy
weather, the ART increased by 50% and more packets dropped. 1000 packets were sent
from the End Node to the Office Node. If the Office Node received the sending packet, it
sent an acknowledgment back. Otherwise, the packet was considered to be lost during
transmission. In 1000 loops, 58 packets are lost in sunny weather and, 108 packets are
lost in foggy weather. In rainy weather, there is no connection between each node. From
the results, we observe that the 2.4GHz radio wave has a poor penetrability in the forest
environment in rainy weather. When it is raining, rainfall sticks on trees and leaves.
Water causes more absorption and reflection then dry foliage.
54
Table 11 - Network Performance in Different Weather
Weather Condition
Sunny
Foggy
Rainy
Average of Response Time
61.38ms
97.95ms
Time Out
Packet Lost Rate
5.8%
10.8%
100%
5.3 Power Consumption
The power consumption is tested after the entire network was set up. The Middle
Node uses 5.1W without any traffic. The power consumption jumps to 24.2W When the
Middle Node has a large throughput (loading videos). We choose the average value to
predict the power consumption of the Middle Node, which is 14.65W. The current of End
Node has a slightly difference between staying ideally and working status. We just use
10.32W to estimate the power consumption. Based on testing the results, six modules of
solar panels and six 12V*7Amp batteries are capable to offer enough power for the
Middle Node operating as a standalone node. Also five modules of solar panels and
four12V*7Amp batteries are required for the End Node to operate as a standalone node.
Table 12 - Middle Node & End Node Power Consumption
Current (no traffic)
Current (with traffic)
Solar Panel Voltage
Battery Voltage (fully charged)
Power Consumption (average)
5.
Middle Node
0.425 A
0.53A~1.51A
23.69 V
12.58V
14.65W
End Node
0.86A
0.89A
22.78V
12.96V
10.32W
Future Work
In section 6, we elaborate on some future work that can be done on FOPW to
enhance it based on the purposed design.
Larger Backbone: At beginning of Chapter 1, Figure 1 shows that the areas
(circled by yellow the lines) needed to be covered by wireless signal. However, the
55
FOPW presented in this project only covers one of areas. In the future, a larger backbone
is needed to cover the whole preserve. For that the repeaters that are similar to the Middle
Node can be added to the existing network. When more nodes are added to the FOPW
design, some problem may arise. One problem is the network frame. The Office Node is
not only going to communicate with one Middle Node, but multiple nodes. Then the
Router used in the Office Node has to be capable of handling multiple communications
links. Another problem is the network performance. Data packets will hop multiple times
to arriver the destination. This will cause longer delay and more chances of dropping
packets.
Improve Reception: In order to improve the signal reception, there are three
alternative designs that can be used. One is to use the 900MHz radio frequency to
establish the links between each node instead of the 2.4GHz radio frequency. With the
900MHz frequency, signal can easily go through the forest and reach 1 mile away in any
weather. The disadvantage is that the cost of the 900MHz components is higher than that
of the 2.4GHz. Another potential solution is to add more nodes on the propagation path
so that fewer trees would obstruct the link. The reliability of each link will be improved.
However, more nodes require more power and higher cost. Another solution is to
increase the antenna height by hanging it under a balloon for clear LOS. Clear Fresnel
Zone will make sure that the signal can be sent from the Office Node to the End Node in
any weathers.
Applications: Using wireless IP cameras to monitor the wildlife and the
environment is a very helpful application. The higher transmission speed and power
consumption requirements would be two challenges for this application. In order to
56
monitor the wildlife, the remote IP cameras would be hidden in the forest and far away
objects. Higher resolution requirement of imaging or videos requires higher performance
to upload data in real time. Due to the environmental impacts, the PLR is more than 5%.
It causes noticeable performance issues such like jitter with VOIP and video streams.
This application would require more power and in turn bigger solar panels and more
budgets.
Alterative Power Source: The climate of FOP is typical Mediterranean regions. It
is often raining in winter. Fog inlands frequently cover along the valley bottoms, leaving
the upper slopes of the mountain exposed. There is not much sunlight in most areas. Solar
power is quite unreliable in winter. Trees also cause a lot of shade blocking the sunlight
in daytime. Having an alternative power source will help the required power availability
for extended time when enough sunlight is not available. Wind power could be the best
option to combine with the solar power.
6.
Conclusion
After all, the proposed FOPW design creates a WLAN network, which covers the
area around the Turtle Pond and a strip area among the signal transmission path from the
Office Node to the End Node. By increasing transmit power and using high gain
directional antennas, the FOPW design overcome the huge attenuation on the propagation
path, which caused by trees and other vegetations. The FOPW design offers the Internet
access under its coverage. We have been successful to check our emails and load
YouTube videos within the coverage areas. By increasing the height of antennas, the
FOPW design can cover the major area around the Turtle Pond.
57
By measuring the path loss between each link, we know that the Weissberger's
model is accurate enough to account for the signal loss. However, the Weissberger's
model does not include any factor for the weather impacts. We can only predict the path
loss when the signal propagation path is blocked by dense, dry and leafy trees. When the
entire system is completely installed and configured, the performance test shows the
weather has a great impact on the signal propagation. By evaluating the performance of
the FOPW design, we know that, the weather significantly affects the propagation of the
radio signals in the forest environment. The Wi-Fi signal is not stable in foggy weather in
terms of ART and PLR increasing. The whole network cannot function during a rainy
weather. From the study, we know that the 2.4GHz radio wave is badly attenuated in the
forest environments. The penetrability is very poor even when high gain directional
antenna with high transmitting power is used. Trees cause a lot of reflection, absorption
and multi-path fading. Moreover, poor weather condition can significantly influence the
signal attenuation. When it is foggy or rainy, the rainfalls paste on trees and the leaves for
sometimes that can attenuate the RF signal. Water absorbs and reflects the RF signal and
the penetrability of RF signal decreases. Antenna height is another factor to influence the
signal strength. Increasing the antenna height can improve the signal reception and
coverage. Antenna directionality has a small influence on the signal penetrability in forest
environments because of high density of trees and inter-twisting of branches and leaves.
The total cost of the FOPW design is $2170.17, including the three nodes and two
solar power systems (See Appendix B). The costs of the installation such as the tripod
and the installation kits are unexpected. Referring to Figure 18, the original design
requires digging a 3 feet deep hole in the ground and inserting the mounting pole in it.
58
However, this structure is not stable to stand. Therefore, we need to purchase a stronger
tripod to hold the mounting pole. In that case, the total cost of ROPW design would be
over the budget (See Appendix A). From Figure 28, the total cost of the three nodes is
$1340.31. The average cost per node is $446.77. Compare to the two professional
solutions mentioned in Table 1, the cost per node of the FOPW design is much lower
than theirs.
Figure 28 - Total Cost of FOPW Design
59
7.
Reference
[1] "Google Earth", free software, http://www.google.com/earth/index.html.
[2] "Mike Outmesguine", Wi-Fi Toys, Wiley Publishing, Inc, ISBN: 0-7645-5894-3.
[3] "DIY: Outdoor Wireless Access Point/Signal Repeater",
http://www.mavromatic.com/?p=426.
[4] "Meraki Network", http://www.meraki.com/customers/casestudies/#!universitiesuniversity-of-virginia.
[5] "Trango System", http://www.trangobroadband.com/wireless-products/multipointbroadband-access/M900S-900mhz.aspx.
[6] ''Chymitdorzhiev, T.N", Electromagnetic Wave Attenuation for Propagation Through
a Forest Belt, IGARSS'04, Proceedings, 2004 IEEE International.
[7] "Shittu, W.A.", Prediction of Received Signal Power and Propagation Path
Loss in
Open/Rural Environments Using Modified Free-Space Loss and Hata Models, RF and
Microwave Conference, 2008 IEEE International.
[8] "Free Space Path Loss", http://en.wikipedia.org/wiki/Free-space_path_loss.
[9] "Tapan K. Sarkar", A Survey of Various Propagation Models for Mobile
Communications, IEEE Antennas and Propagation Magazine, Vol.45, No.3, June 2003.
[10] "Shenzhen AiJia Communication", http://www.antennachina.net/tech.asp.
[11]"Fresnel Zone", http://en.wikipedia.org/wiki/Fresnel_zone.
[12] "Hidayab, M", Wi-Fi Signal Propagation in 2.4 GHz, Microwave Conference, IEEE
2009, E-ISBN: 978-1-4244-2802-1.
[13] "Siyu Li and Hongju Gao", Propagation Characteristics of 2.4GHz Wireless Channel
in Cornfields, Communication Technology (ICCT), 2011 IEEE 13th International
Conference.
[14] "Meng, Lee and Ng", Study of Propagation Loss Prediction in Forest Environment,
Progress in Electromagnetic Research B, Vol. 17, 117-133, 2009.
[15] "Sunrise, Sunset, Dawn and Dusk Time graphic",
http://www.gaisma.com/en/location/rohnert-park-california.html
[16] "Average temperature in Rohnert Park",
http://www.weather.com/weather/wxclimatology/monthly/graph/94928
60
[17] "Panel Tilt Angle Calculation", http://www.solarpoweristhefeature.com/how-tofigure-correct-angle-for-solar-panels.shtml.
[18]"InSSIDer", http://www.metageek.net/products/inssider/footnote.
61
Appendix A – Detailed Budget
Table 13 - Detailed Budget
Item
Communication Units
Router
Bridge
Access Point
Signal Booster
Antenna
Enclosure
Installation Kits
Solar Power System
Solar Power Sets
Battery
AC-DC Inverter
Testing Item
GPS Sensor
USB Wireless Adapter
Omni-Directional Antenna
Yagi Antenna
Total
Projected
Cost($)
50
50
200
150
300
20
50
500
100
30
30
20
50
50
1600
62
Appendix B – Bill of Materials
Table 14 - Bill of Materials
Item
1
2
3
4
5
6
7
8
9
10
11
12
13
14
15
16
17
18
19
20
21
22
Description
Hawking HAO14SPD Signal
Booster
D-link DI-624 Router
Linksys WRT54G Router
Hawking HOW2R1 Smart Repeater
Panel Antenna
Omni-Directional Antenna
Yagi Antenna
Basket
Cement
Solar Power kits
Battery
AC-DC Inverter
GPS Sensor
USB Wireless Adapter
Tri Pod 1
Tri Pod 2
PVC pipe
Coaxial Power Plug
XL Clip Box
Enclosure
Installation Kit
Pipe Connector
QTY
Price
Total
3
1
1
1
3
2
1
2
2
2
8
1
1
1
1
1
2
2
2
2
3
5
80
30
50
239
85
30
29.95
1.69
20
279.95
14
35
25
30
275
39
5
1.49
6.99
5
30
2.69
240
30
50
239
255
60
32.8
3.68
40
559.90
112
35
25
30
275
39
10
3.97
15.16
10
90
14.66
Total
2170.17
63
Appendix C – Nodes Installation & Configuration
C1 - Office Node
Installation Procedures:
1. Put D-link DI-624 router and Hawking HSB2 signal booster in a waterproof plastic
enclosure.
2. Drill two big holes on the top of the enclosure and insert two pipe connectors for
wiring antenna cable, power cord and Ethernet cable. Drill some small holes on the
bottom to radiate heat.
3. Wrap the enclosure with tinfoil paper to avoid sunlight heating up the devices. Seal the
two pipe connectors on the top.
4. Mount the enclosure and antennas on the top of a steal pole.
5. Hold the pole with a tripod.
6. Adjust the direction and tilt angel of antenna.
Figure 29 - Office Node Installation
64
C2 - Middle Node
Installation Procedures:
1. Put a Linksys WRT54G router and two of Hawking HSB2 signal boosters in a
waterproof plastic enclosure.
2. Drill two big holes on the top and one big hole on the bottom of the enclosure. Insert
two pipe connectors for wiring antenna cable, power cord and Ethernet cable. Drill some
small holes on the bottom to radiate heat.
3. Wrap the enclosure with tinfoil paper to avoid sunlight heating up Middle Node. Seal
three pipe connectors. Mount the enclosure and two Hawking HAO14SPD Panel
Antennas on the top of a steal pole.
4. Adjust the directions of both antennas. Make sure one antenna point to Office Node,
another one point to End Node
4. Put 25 pounds cement in a basket to act as a basement. Insert the steal pole into the
basement and use a tripod to make it solid.
5. Put solar panels on the ground. Adjust the direction to south and tile angel to
corresponding seasons.
6. Connect solar panels, batteries and electronics devices with a smart controller.
Configurations:
1. Open browser to http://192.168.1.1. Change Wireless Mode to Repeater Bridge.
Change Wireless Network Name (SSID) to Office Node.
2. In Wireless-Advanced Setting page set TX Power to 65. In Radio Time Restrictions,
we can schedule to shown down the radio in a daily routine. For example, shows the
radio will shut down from 0am to 5am and from 20 pm to 24pm every day.
65
Figure 30 - Middle Node Installation
Figure 31 - Linksys WRT54G Configuration
66
Modification Procedures:
1. Download vxworkskiller Gv8-v3.bin and dd-wrt.v24_micro_generic.bin. Install TFTP.
2. Configure computer's local Ethernet IP address to 192.168.1.100, subnet
255.255.255.0 and gateway 192.16.1.1.
3. Power cycle Linksys router
4. Open browser to http://192.168.1.1
5. Use the firmware upgrade dialog to flash vxworkskiller Gv8-v3.bin.
6. Wait five minutes and power cycle the router.
7. Flash the DD-WRT firmware using TFTP. Enter command line "tftp -i 192.168.1.1"
8. Upgrade firmware of using wrt.24v_micro_generic.bin
67
C3 - End Node Installation Procedures
Installation Procedures:
1. Mount Hawking HOW2R1 Smart Repeater on top of a PVC pipe
2. Adjust the direction of the repeater to point to Middle Node
3. Similar as Middle Node, a basket with cement is using as a basement to hold the
repeater.
4. Use an Ethernet cable to connect the repeater to a POE injector. Then connect the
injector to a DC-AC inverter, which connect to batteries. Connect batteries and solar
panel with a smart controller
Figure 32 - End Node Installation
68
Appendix D – Test Plan, Procedures& Results
D1 - Linksys 54G Router Power Consumption Measurement
Equipment:
Agilent E3631 Power Supply, Linksys WRT54G router
Procedures:
1. Connect Linksys WRT54G Router to Agilent E3631 Power Supply.
2. Adjust power from 3.3V to 12V and record current
3. Calculate power consumption by multiplex voltage and corresponding current
Result:
Table 15 - Linksys WRT54G Router Power Consumption
Voltage(V)
<3.3
3.3
5
12
Current(Amp)
0
0.76
0.65
0.43
Power(W)
0
2.508
3.25
5.4
69
D2 - Signal Booster Power Consumption Measurement
Equipment:
Agilent E3631 Power Supply, Linksys WRT54G Router, Hawking HSB2 Signal Booster,
HP DV4 Laptop
Procedures:
1. Connect HSB2 Signal Booster to Linksys WRT54G router
2. Power up HSB2 Signal Booster by Agilent E3631 Power Supply
3. Adjust power from 3.3V to 12 V. In the meantime, record current drawing by HSB2
4. Set output power at 12V level. Let the router access to the Internet, and connect to
laptop wirelessly. Make a stream go through signal booster. For example, load YouTube
videos on the laptop. Then, monitor the change of current.
Result:
When signal booster stay ideal, it only use very little amount of power, the current is
0.01A. When signals keep sending through booster, it becomes very hard to monitoring
the current. The maximum reading of captured current is 1.12A. The most common
reading is from 0.4A to 0.8A.
70
D3 - Hawking HOW2R1 Smart Repeater Power Consumption Measurement
Equipment:
Agilent E3631 Power Supply, Hawking HOW2R1 Smart Repeater, Power Bright
PW400-12 Power Inverter, HP DV4 Laptop
Procedures:
1. Use Ethernet cable connect Hawking HOW2R1 Smart Repeater to POE injector
2. Connect POE injector to Power Bright PW400-12 Power Inverter
3. Use Agilent E3631 Power Supply to generate 12V DC power.
4. Observe current value on Agilent E 3631 Power Supply.
5. Connect Power Bright Pw400-12 Power Inverter to Agilent E3631 Power Supply.
Observe current value
6. Connect HP DV4 Laptop to Hawking HOW2R1 Smart Repeater wirelessly
7. Load YouTube video on HP DV4 Laptop. Observe the change of current value.
Result:
Table 16 - Smart Repeater Power Consumption Measurement
Items
Voltage
Min
Max
Average
(V)
Current (A) Current (A) Current (A)
Power (W)
Power Inverter
12V
0.388
0.389
0.389
4.668
Power Inverter +
Smart Repeater
(No Traffic)
12V
0.796
0.895
0.853
10.236
Power Inverter +
Smart Repeater
(Traffic)
12V
0.901
0.912
0.907
10.884
71
D4 - Middle Node & End Node Power Consumption Measurement
Equipment:
Fluke-179 Multimeter, Laptop
Procedures:
1. Use Fluke-179 multimeter to observe the current of the Middle Node when there is no
data being transferred. Record the minimum and maximum value.
2. Connect Laptop to the Middle Node. Start loading YouTube video. Observe the current
of the Middle Node and record the value.
3. Repeat step1 and step 2 by connecting multimeter and laptop to the End Node
Result:
Table 17 - Middle Node and End Node Power Consumption Measurement
Node
Middle
Node
End
Node
Voltage
(V)
12.58
No Traffic
Minimum
Maximum
Current (A) Current (A)
0.425
0.425
Loading Videos
Average
Power
Minimum
Maximum
(W)
Current (A) Current (A)
0.53
1.51
14.65
12.96
0.86
0.89
0.86
0.89
10.32
72
D5 - Environmental Impacts
D5.1 - Different Antenna Heights vs. Signal Strength
Test Procedures:
1. Use the same set up of End Node to broadcast signal
2. Holding a laptop walk away from the router
3. Record RSSIs along the walking path
4. Display RSSI data in to Google Earth, shown in Figure 33
Figure 33 - RSSI vs. Distance (Antenna Height is 3 feet)
5. Repeat step 1 to step 4 by increasing the height of PVC pipe to 6 feet. Result is shown
in Figure 34
Figure 34 - RSSI vs. Distance (Antenna Height is 6 feet)
73
D5.2 - Signal Strength vs. Different Weathers
Test Procedures:
1. Set the angle between the transmission path and ground of Office Node transmitter
antenna to 30°. Keep the horizontal angle at 0°. The weather is sunny.
2. Walk from Office Node to End Node and record RSSIs along the path,
3. Walk to End Node; connect laptop to End Node wireless.
4. Use WinPing to ping Office Node by IP address of 192.168.2.1.
5. Repeat step 1 to step 4 in foggy weather.
Result:
1. Figure 35 shows the RSSI captured on the path from the Office Node to the Middle
Node when it is sunny.
Figure 35 - Signal Strength from Office Node to Middle Node in Sunny Weather
74
2. Figure 36 shows the RSSI captured on the path from the Office Node to the Middle
Node when it is foggy weather
Figure 36 - Signal Strength from Office Node to Middle Node in Foggy Weather
75
D6 - Coverage Survey
Survey Procedures:
1. Holding a laptop installed InSSIDer, walk along the red lines shown in Figure 37.
2. Record RSSIs and export data into *.kml files.
3. Display the*.kml files on Google Earth, shown in Figure 38.
Figure 37 - Coverage Survey Route
Figure 38 - RSSI from Office Node to End Node
76
D7 - Received Signal Strength Survey
Survey Procedures:
1. Walk to the location of the Middle Node. Use InSSIDer to capture RSSI of the SSID
named "Office Node". Observe the minimum value and the maximum value of the RSSIs.
2. Walk to the location of the End Node. Use InSSIDer to capture RSSI of the SSID
named "Middle Node". Observe the minimum value and the maximum value of the
RSSIs.
3. Export the capture data into Google Earth.
Result:
As shown in Figure 39, the minimum RSSI captured at the Middle Node is -68dBm and
maximum value is -78dBm. The minimum RSSI captured at the End Node is -68dBm
and maximum value is -76dBm.
Figure 39 - Middle Node & End Node RSSI Survey
77
Appendix E – Data Sheet
E1 - D-link DI-624 Router
Data Sheet: ftp://ftp10.dlink.com/pdfs/products/DI-624/DI-624_ds.pdf
E2 - Linksys 54G Router
Data Sheet: http://homedownloads.cisco.com/downloads/datasheet/wrt54gv8-ds.pdf
E3 - Hawking HOW2R1 Smart Repeater
Data Sheet: http://hawkingtech.com/index.php/products/downloadfile/36.html
E4 - Hawking HAO14SPD Panel Antenna
User's Manual: http://hawkingtech.com/index.php/products/downloadfile/134.html
E5 - HawkingHSB2 Signal Booster
Data Sheet: http://hawkingtech.com/index.php/products/downloadfile/37.html
E6 - USB Wireless Adapter
Data Sheet:
http://www.alfa.com.tw/in/front/bin/ptdetail.phtml?Part=AWUS036EH&Category=0
E7 - Sunforce 50048 Solar Panel Kits
User's Manual:
http://sunforceproducts.com/prodinfo/fr_vend_lit/(50048)60W%20kit%20SF.pdf
E8 - Power Bright PW400-12 Power Inverter
Specification Sheet: http://www.powerbright.com/pdf/PW400_spec_sheet.pdf
E9 - GPS Sensor
Data Sheet : http://www.usglobalsat.com/store/download/62/bu353_ds_ug.pdf
78